Abstract
The successful application of artificial intelligence (AI) techniques for the quantitative analysis of hybrid medical imaging data such as PET/CT is challenged by the differences in the type of information and image quality between the two modalities. The purpose of this work was to develop color-based, pre-processing methodologies for PET/CT data that could yield a better starting point for subsequent diagnosis and image processing and analysis. Two methods are proposed that are based on the encoding of Hounsfield Units (HU) and Standardized Uptake Values (SUVs) in separate transformed .png files as reversible color information in combination with .png basic information metadata based on DICOM attributes. Linux Ubuntu using Python was used for the implementation and pilot testing of the proposed methodologies on brain 18F-FDG PET/CT scans acquired with different PET/CT systems. The range of HUs and SUVs was mapped using novel weighted color distribution functions that allowed for a balanced representation of the data and an improved visualization of anatomic and metabolic differences. The pilot application of the proposed mapping codes yielded CT and PET images where it was easier to pinpoint variations in anatomy and metabolic activity and offered a potentially better starting point for the subsequent fully automated quantitative analysis of specific regions of interest or observer evaluation. It should be noted that the output .png files contained all the raw values and may be treated as raw DICOM input data.
1. Introduction
Hybrid systems combine different imaging modalities that provide different information. PET/CT hybrid systems, for example, yield functional information from PET scans and anatomical information from CT scans to provide a more accurate diagnosis. The imaging is performed in sequence in this case. Namely, the CT is completed first and is then followed by the PET scan. But the two image sets may be co-registered and fused to present both anatomic and metabolic information on a specific point in the human body in either two (2D) or three dimensions (3D) [1,2].
Most PET/CT applications are in oncology, where this hybrid modality plays a critical role in the diagnosis and follow-up of cancer patients [3,4]. Beyond cancer, PET/CT has also proven its value in neurology and psychiatry where it yields important information on the brain’s metabolic activity in areas associated with neurological and psychiatric disorders [5,6,7].
PET measures the metabolism of different organs and tissues in the body, a function that changes when a pathological condition such as cancer, inflammation, heart disease, or a brain disorder, is present. CT offers additional anatomic information that optimizes diagnosis [3,4]. Experts interpret data and perform diagnoses by first identifying abnormal metabolic activity in organs or tissues on the PET images. They then select specific regions of interest (ROIs) by combining corresponding PET and CT slices and calculating parameters that are related to the metabolic and anatomical characteristics of the regions [3,4,5,6,7,8]. The accurate identification and selection of ROIs require an initial manipulation of the images through a windowing process that increases contrast or reduces noise [8]. Windowing may be performed manually by an expert by independently manipulating windowing parameters such as window level and width or by using preset preprocessing options available on the clinical workstations [8]. Computer algorithms and artificial intelligence (AI) techniques have been proposed for the automated detection, segmentation, and classification of ROIs in PET/CT data [9,10]. These techniques show promising results but lack standardization, reproducibility and generalizability and, hence, are not fully deployed in clinical practice [9]. One of the main reasons for the limited success of computer-aided detection or diagnosis methods is that they start from the same grayscale raw data, which require optimization during the initial stage of the process. This is usually carried out with a standard pre-processing filter for contrast enhancement or noise reduction [10]. This pre-processing stage does not always yield a significant improvement. Experts or templates are then used to provide the starting point for subsequent analysis of ROIs [11]. This is often the case in brain PET/CT images where ROI segmentation is better achieved by initial selection by experts or by registering clinical images with premade anatomy templates or atlases via intensive registration processes [11,12,13,14,15]. In conclusion, the stages of manual or automated detection, segmentation, and classification rely heavily on the preprocessing of the raw data for their success. Furthermore, it is apparent from the performance of proposed AI techniques to date that if standardization, reproducibility, and generalizability are desirable, a better preprocessing methodology is necessary. As the desired information is in the images, we need new and better ways to extract and interpret it.
This work proposes a new, color-based transformation of CT and PET brain data as a preprocessing step that could yield information of greater value for the expert observer or subsequent AI detection, segmentation, and classification, or both. Color coding is used in fused CT and PET images to enhance the visual display and interpretation of low-, moderate-, and high-uptake areas [8,11]. To the best of our knowledge, color-based preprocessing has not been used for the interpretation or analysis, manual or automated, of PET/CT scans to date. The recently reported fusion of panchromatic (PET) and multispectral (MRI) data [16] or a peritumoral halo layers [17] may be advantageous for segmentation and classification processes but neither is directly applicable to PET/CT data.
2. Materials and Methods
2.1. Colormap Properties
Most medical imaging modalities today provide 16 bits of grayscale data (216 or 65,536 gray values). The American College of Radiology (ACR) has developed a Standard for Digital Imaging and Communications in Medicine (DICOM) that defines a widely accepted and followed Grayscale Standard Display Function (GSDF), but, to date, there is no agreement on colored display [18]. Yet, color is used in many modalities including hybrid imaging, such as PET/CT, to display luminance differences in one image, e.g., PET, when fused with the corresponding grayscale image from another modality, e.g., CT. Color allows enhanced visibility of features and assists diagnosis. It should be noted that colors in this case do not correspond to clinical characteristics. They are based on different scales or maps defined by the preference of the observer, and they are often referred to as “pseudo colors” [19,20].
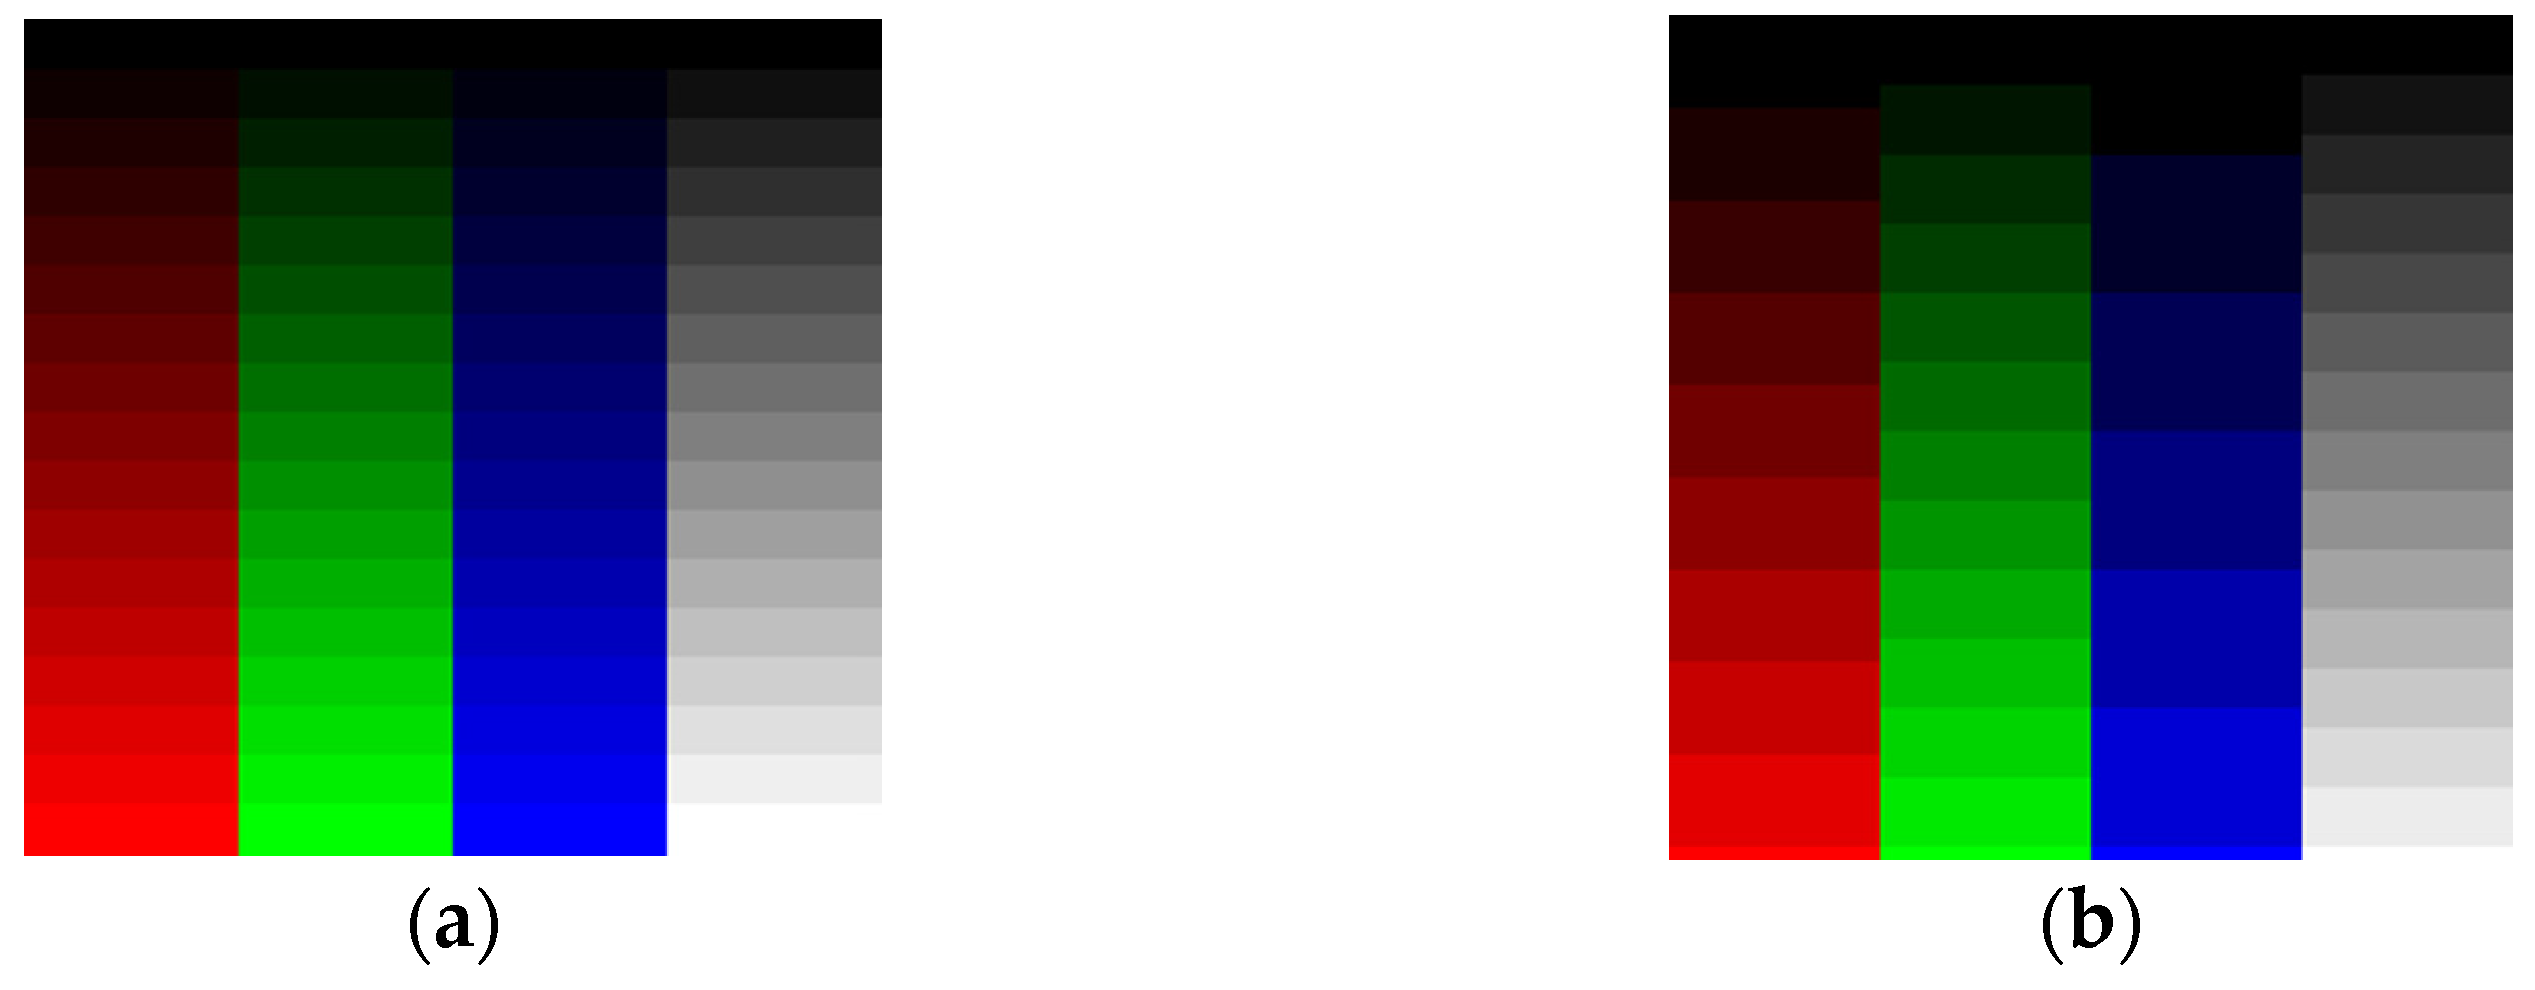
The human eye does not have the same sensitivity to all colors. Figure 1a presents 8-bit data (0 to 255 values) distributed across 16 Red (R), Green (G), Blue (B), and Gray (Gy) channels. Low Green and Gray values are better distinguished than the corresponding Red and Blue values. To remedy this, we may choose to adjust the number of levels per color. For example, one may select 9 R levels, 12 G levels, 6 B levels, and 16 Gy levels as shown in Figure 1b to distinguish the colors using a Just-Noticeable Difference (JND) approach [21]. Figure 2 confirms that the selection of grayscale for medical images is the best way to archive information using a grayscale-level contrast. This is also obvious in empirical formulas for RGB transformation to luminance/intensity, which is related to contrast.

Figure 1.
(a) Red, Green, Blue, and Gray channels with 16 intensity levels from 0 (dark) to 255 (light). We observe the difference as a JND. (b) As shown, 9 Red levels, 12 Green levels, 6 Blue levels, and 16 Gray intensity levels from 0 (dark) to 255 (light) give better contrast separation using the human eye’s JND function.
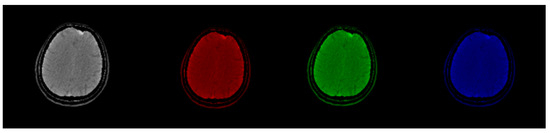
Figure 2.
Original CT slice in grayscale (left) followed by Red, Green, and Blue coloring. Gray and Green shades outperform Red and Blue in terms of the discernibility of the structures.
Figure 1 demonstrates that by using luminance as a criterion, optimum image contrast may be obtained in grayscale. This does not hold in the colored images where important information exists not only in luminance but in the color itself as well. Figure 3 shows how color may contain visible information that does not exist in the classic grayscale representation.

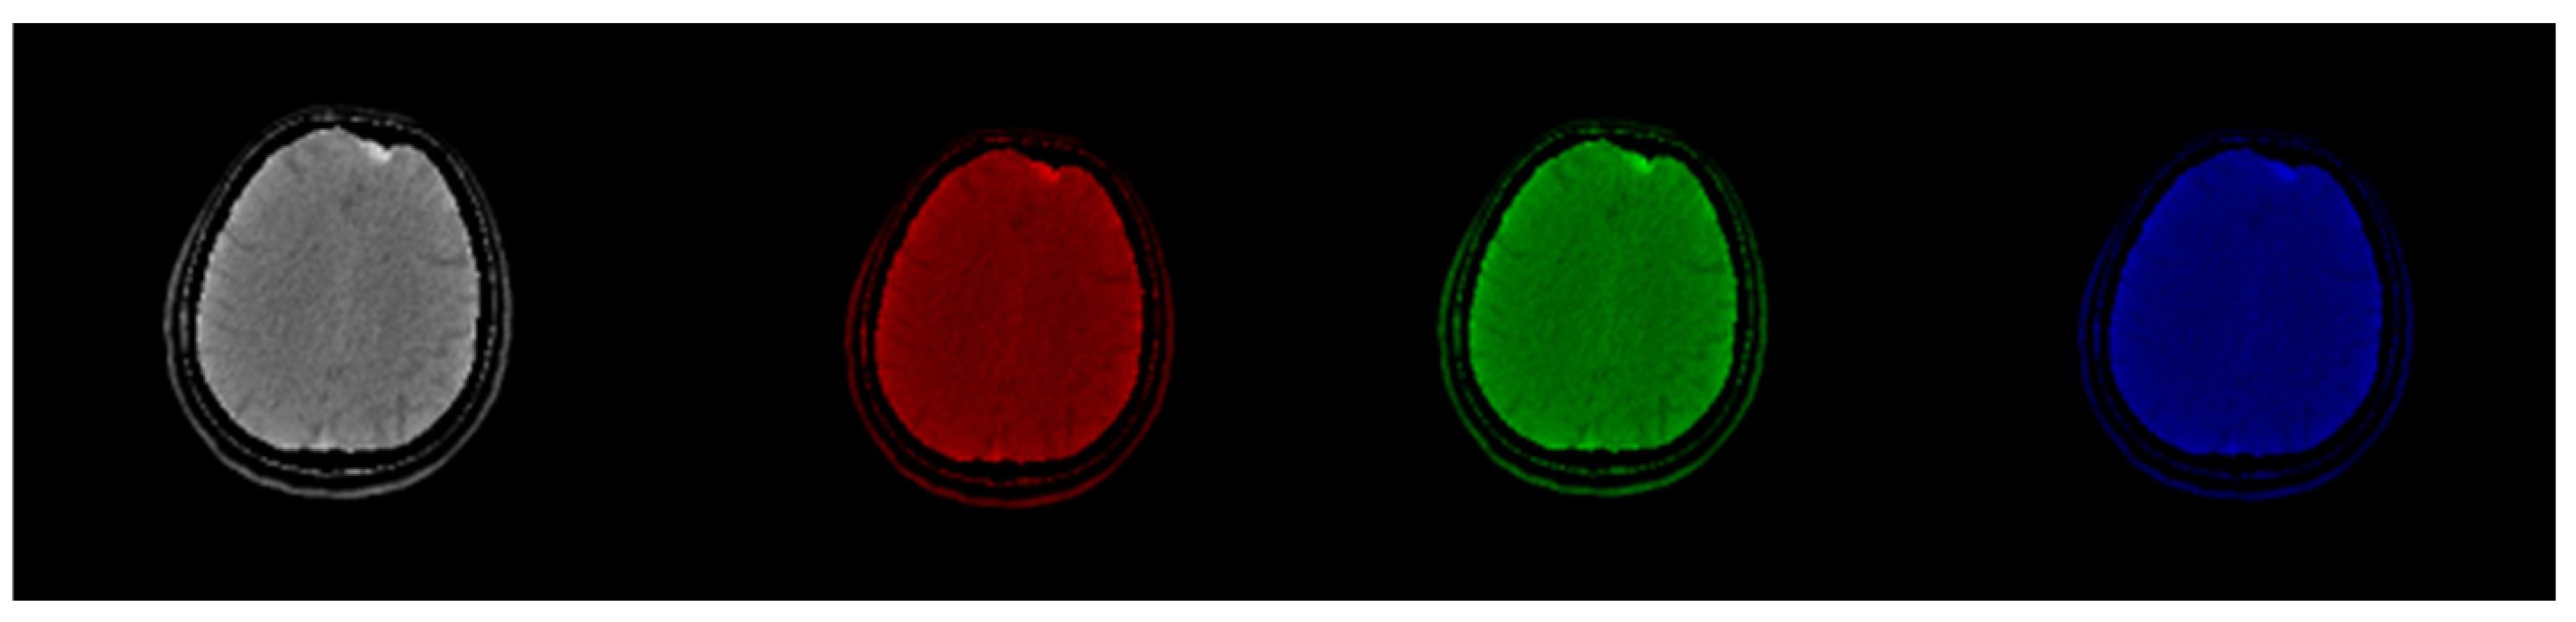
Figure 3.
Luminance according to RGB luminance formula has less noticeable information in grayscale mode than in color mode.
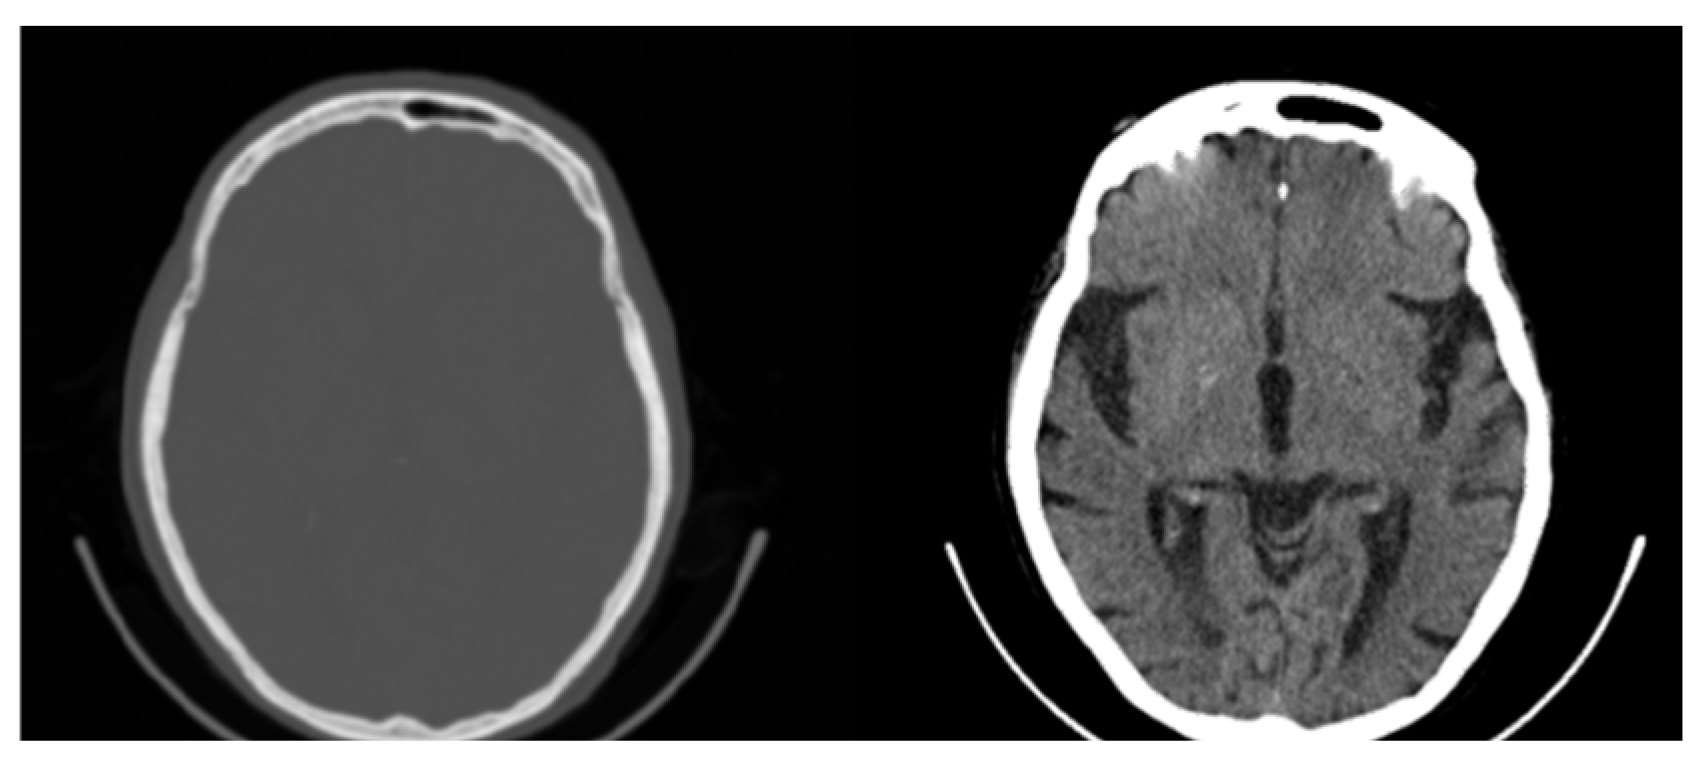
Another factor that may limit information and contrast in areas of interest is windowing. Medical images are often processed to remove noise or enhance contrast for better visualization [22]. Windowing is a common technique for contrast enhancement where only a subset of data are selected for presentation or analysis while data outside the window’s range are rejected, as is shown in the CT image in Figure 4 [22].

Figure 4.
Original CT slice (left) and windowed slice (right) with improved contrast. All possible 65,536 (16-bit) original values are mapped to 256 (8-bit) Gray values limiting the contrast and visibility of information.
Considering the subjectivity of both the visualization and windowing processes, one understands the challenges of defining a uniquely optimum and applicable color map for the human observer following known standards for the color sensitivity of the human eye [23]. An alternative approach is to focus on optimizing images for artificial intelligence (AI) processing. Specifically, one could create optimum ground truth data by labeling or tagging images with accurate and reliable tissue-specific information using multiple distinct color intensities. Such data could be subsequently used as segmentation masks to train machine learning models for quantitative analysis of medical images that can then be evaluated by the observer [24,25].
In this work, two different methods are proposed, each with a different purpose, for the development of preprocessed images for any subsequent AI processing, e.g., segmentation or classification
2.2. Method 1: Colormap Information Transform (CIT)
The first method follows the steps described below.
- Step 1: Channel Steps Determination.
Each color channel may be divided into a given number of discrete channel levels (CLs). For an 8-bit image, discrete channel steps (CSs) may then be defined as follows:
As a working example, and based on the intensities shown in Figure 1, an initial selection may be 6 Red channel levels (RCLs), 5 Blue levels (BCLs), and 11 Green levels (GCLs) with values in the range of 37 to 222 based on the JND of the human eye. Exceptionally low and high values are disregarded to keep data transformation away from high and low intensities where color information may not offer adequate discernibility. Applying Equation (1) to the working example, the channel steps for the different colors are as follows:
Red channel steps (RCSs) = 37 for 6 levels;
Green channel steps (GCSs) = 22 for 11 levels;
Blue channel steps (BCSs) = 43 for 5 levels.
The discrete values (DVs) of the levels for the three colors are as follows:
Red discrete values (RDVs) = [37, 74, 111, 148, 185, 222];
Green discrete values (GDVs) = [22, 44, 66, 88, 110, 132, 154, 176, 198, 220, 242];
Blue discrete values (BDVs) = [43, 86, 129, 172, 215].
- Step 2: Determine Channel Mapping Shades
Channels in RGB tuple format will have the following color shades number (CSN):
In the working example, this leads to 330 color shades in the RGB tuple formation.
To determine the contribution of each channel to the final pixel color, the discrete values are divided by the total number of channel levels (TCLs), where
In the working example, TCL = 6 + 11 + 5 = 22 levels in all channels and the red, green, and blue contributions are determined by dividing the |RDV|, |GDV|, and |BDV| with the TCL.
The above color mapping process is applicable to any grayscale medical image, 8-bit or higher, such as PET, SPECT, MRI, or digital mammography and tomosynthesis. In CT images, however, pixel values represent radiodensities expressed in dimensionless Hounsfield units (HUs) [26]. Generally, HU values range from −1000 for air to 3000 for metals [26,27]. Human body tissues show different ranges of HUs (different minima HUmin and maxima HUmax) depending on the density and content of the tissues. An appropriate map of the HUs to the RGB color space requires the following formula:
Applying Equation (4), all possible HU values in the range from HUmin to HUmax are clearly mapped and spread across distinguished color values. Note that smaller values for CSN lead to assigning at least 2 neighboring HU values to one color shade. For brain PET/CT, standard CT protocol uses a window of HU values centered at about 35 with a width of 240 ranging from −85 to +155 HU [27]. In the working example, these 240 HU values were linearly mapped to 330 color pixel values. Note, the number 330 was empirically selected to satisfy Equation (4) in our pilot study, the results of which indicated that the optimum selection of this parameter depends on the type of images and their specific application. In addition to the requirement of Equation (4) and to ensure that all color shades of the mapped HUrange are discernible, an additional weighting factor is needed for the contribution of the three colors, which is same for all three colors. Specifically, we aim at:
where RC, GC, and BC are the Red, Green, and Blue contributions. Equation (5) yields
In the working example, WC = 0.899288626, a value which slightly modifies the Red, Green, and Blue level but still satisfies Equation (4). We could have just used the cubic root of the fraction in parenthesis, but then the contrast, which helps improve observation, will decrease. This will happen because equal levels of R, G, B will exist and this will equate the importance of the contribution of each R, G, B level to the contrast according to their intensity.
This method offers a simple, lossless color mapping approach that may be applied to any medical image with slight modifications depending on the pixel bit depth independent of other scanner characteristics.
2.3. Method 2: Folding Colormap
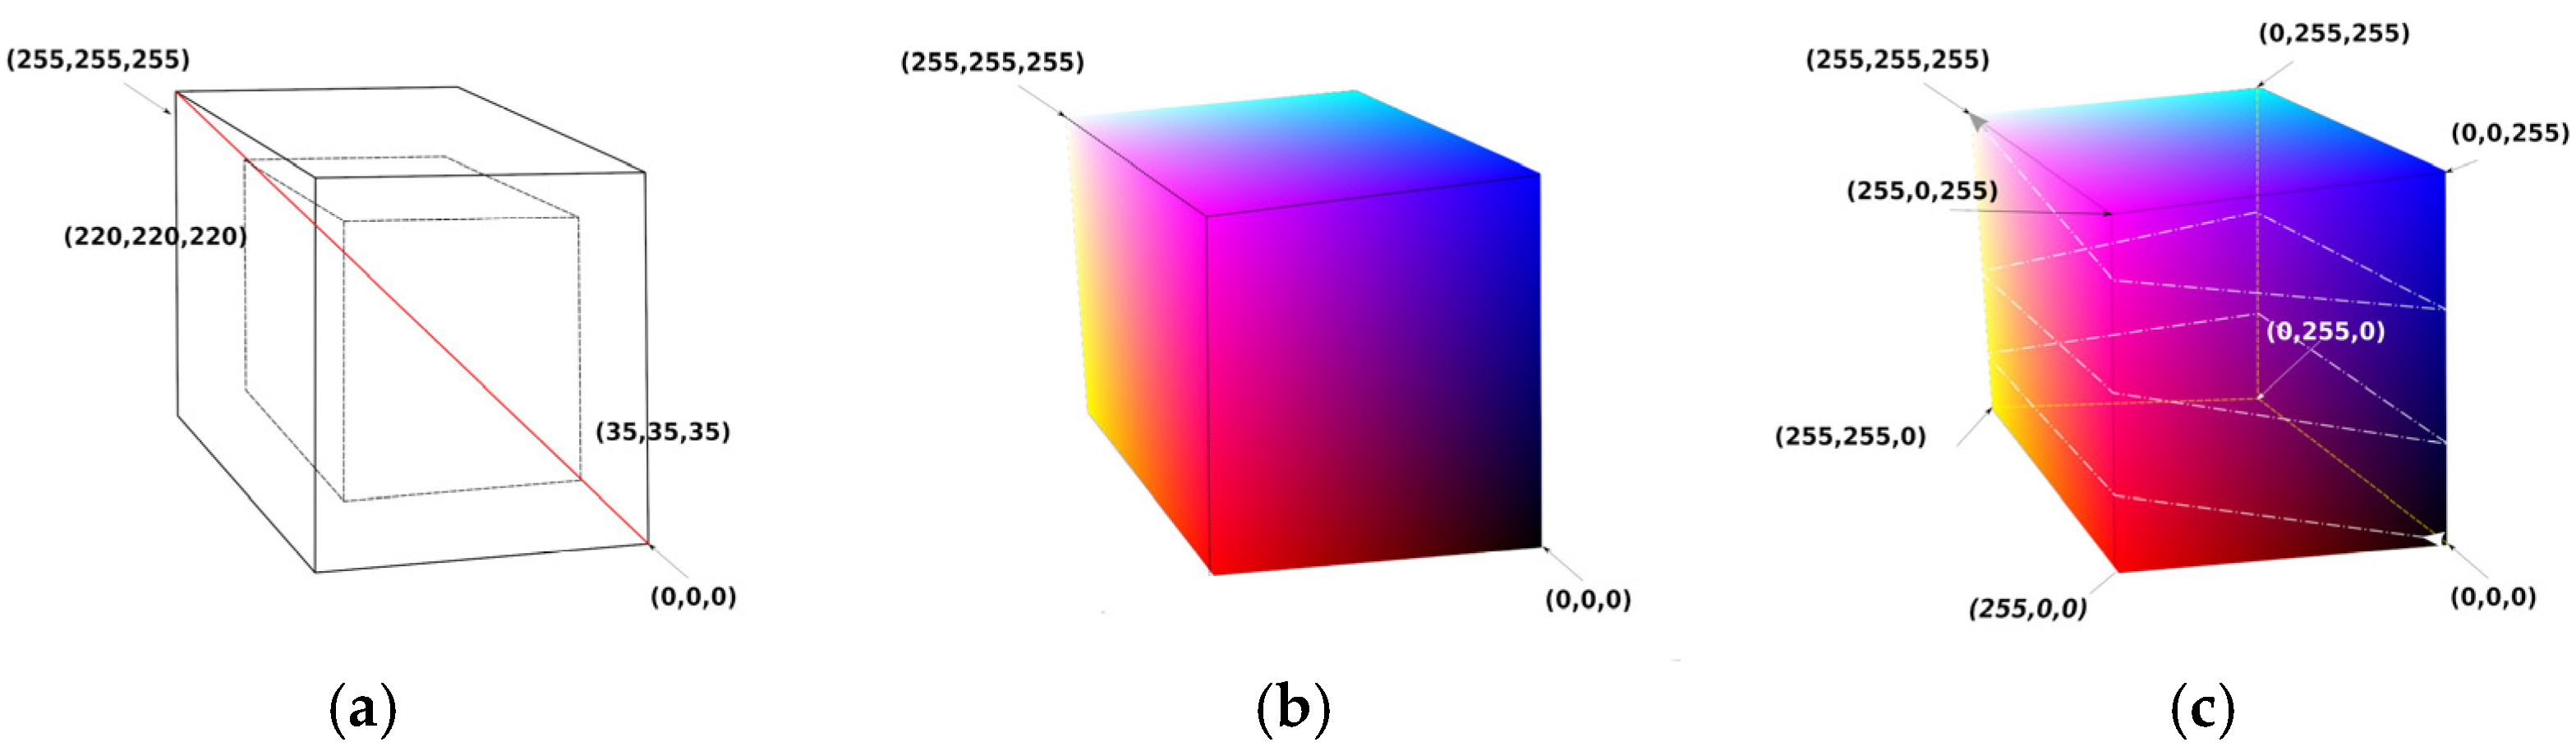
By examining the results of Method 1, it was observed that the classification of specific ROIs by color requires that the color distribution in the final image must be “continuous” because a minor change in the R, G, or B channel may affect the intensity of neighboring pixels in the same ROI that differ little in value. In an 8-bit image, there are 2 limit values for every RGB channel, namely 0 and 255. Hence, 8 limit tuples may be defined, such as (0,0,0), (0,0,255), (0,255,255), (0,255,0), (255,0,0), (255,0,255), (255,255,0), and (255,255,255). A cube can then be created that has the above 8 tuples as vertices, as shown in Figure 5. Only four rules are considered for this cube to give our novel method functionality.

Figure 5.
Colormap cube with continuous color changes over the surface of the cube. (a) Two concentric cubes with the diagonal crossing the grays from minimum to maximum values. The larger cube has 256 points on each side (from (0,0,0) to (255,255,255)). The smaller cube has 186 points on each side (from (35,35,35) to (220,220,220)). (b) Colormap cube with 256 points on each side. (c) Colormap cube with 256 points on each side folded along a strip line that starts at (0,0,0) and ends at (255,255,255) after 2.5 turns.
- Rule 1—Axis of Grays crossing zero: Black RGB (0,0,0) and White RGB (255,255,255) vertices must be positioned in a 3D inverted position, i.e., if cubic coordinates of Black are (a,a,a) then coordinates of White must be (−a,−a,−a).
- Rule 2—Color change density symmetry: Vertices which have a common edge must be subjected to only one-color channel inversion. Specifically, White Vertex RGB (255,255,255) is a point that belongs on 3 edges, as does every vertex. For each edge that has for starting point on the White Vertex, the opposite paired vertex must change by inverting R or G or B regardless of the layout of the final coordinates of the vertices, as shown on the cube of Figure 5c. Our general folding colormap method generates a strip of RGB values that start from a point with vertex P1 (i1,j1,k1) and end at another vertex point, P2 (i2,j2,k2), by folding the surface of the cube.
- Rule 3—Continuity: Strip RGB values’ coordinates must move only 1 step along a chosen axis X, Y, or Z.
- Rule 4—Values separation: Strip RGB values’ coordinates must not cross at any point on the cube’s surface.
For our pilot implementation of the method, the above rules were followed by creating simple models of strip line paths. The path we focused on started at RGB point (0,0,0) and ended at RGB point (255,255,255) by moving on a straight line. In Figure 5c, a black line is observed that folds the cube by 2.5 turns. The fastest path (smallest straight path) from RGB (0,0,0) to RGB (255,255,255) is a line that crosses two surfaces, each with 256 points, and has N = 2 × 256 − 1 discrete RGB values. For 1.5 rounds of strip line folding to reach from RGB (0,0,0) to RGB (255,255,255), there will be N = 6 × 256 − 5 values, etc.
2.4. Pilot Study Database
Images from different modalities, scanners, and protocols were used for the evaluation of the proposed methods, including CT, SPECT, PET, and MRI. Here, the results are presented for brain 18F-FDG PET/CT images acquired with a Biograph 6 (Siemens Healthcare, Erlangen, Germany). Brain scans of three normal and three patients diagnosed with dementia were studied. Scans were acquired with the same standard brain imaging protocol [11]. They were randomly selected from in-house PET/CT databases and aimed to provide a qualitative evaluation of the methods on subtle hypometabolic regions that are characteristic of dementia. The only criteria were that (a) normal and abnormal scans were verified by appropriate patient follow-up and clinical data and (b) scans contained no tumors to avoid high-contrast features. The PET images were 128 × 128 pixels in size while the CT images were 512 × 512 pixels; both had a pixel depth of 16 bits. This was a secondary use of unidentified and non-coded data. Hence, this study did not constitute research with human subjects because there was no interaction with any individual and no identifiable private information was used. The work was IRB-exempt.
2.5. Implementation Tools
An in-house-developed DICOM viewer application was developed to compare methods and evaluate the results. Python was used for the implementation in a Linux Ubuntu 22.04.4 LTS system using Python 3.11.5. The libraries PyQt5, PIL, matplotlib, pydicom, and numpy were also included in the development.
3. Results
3.1. CIT Application
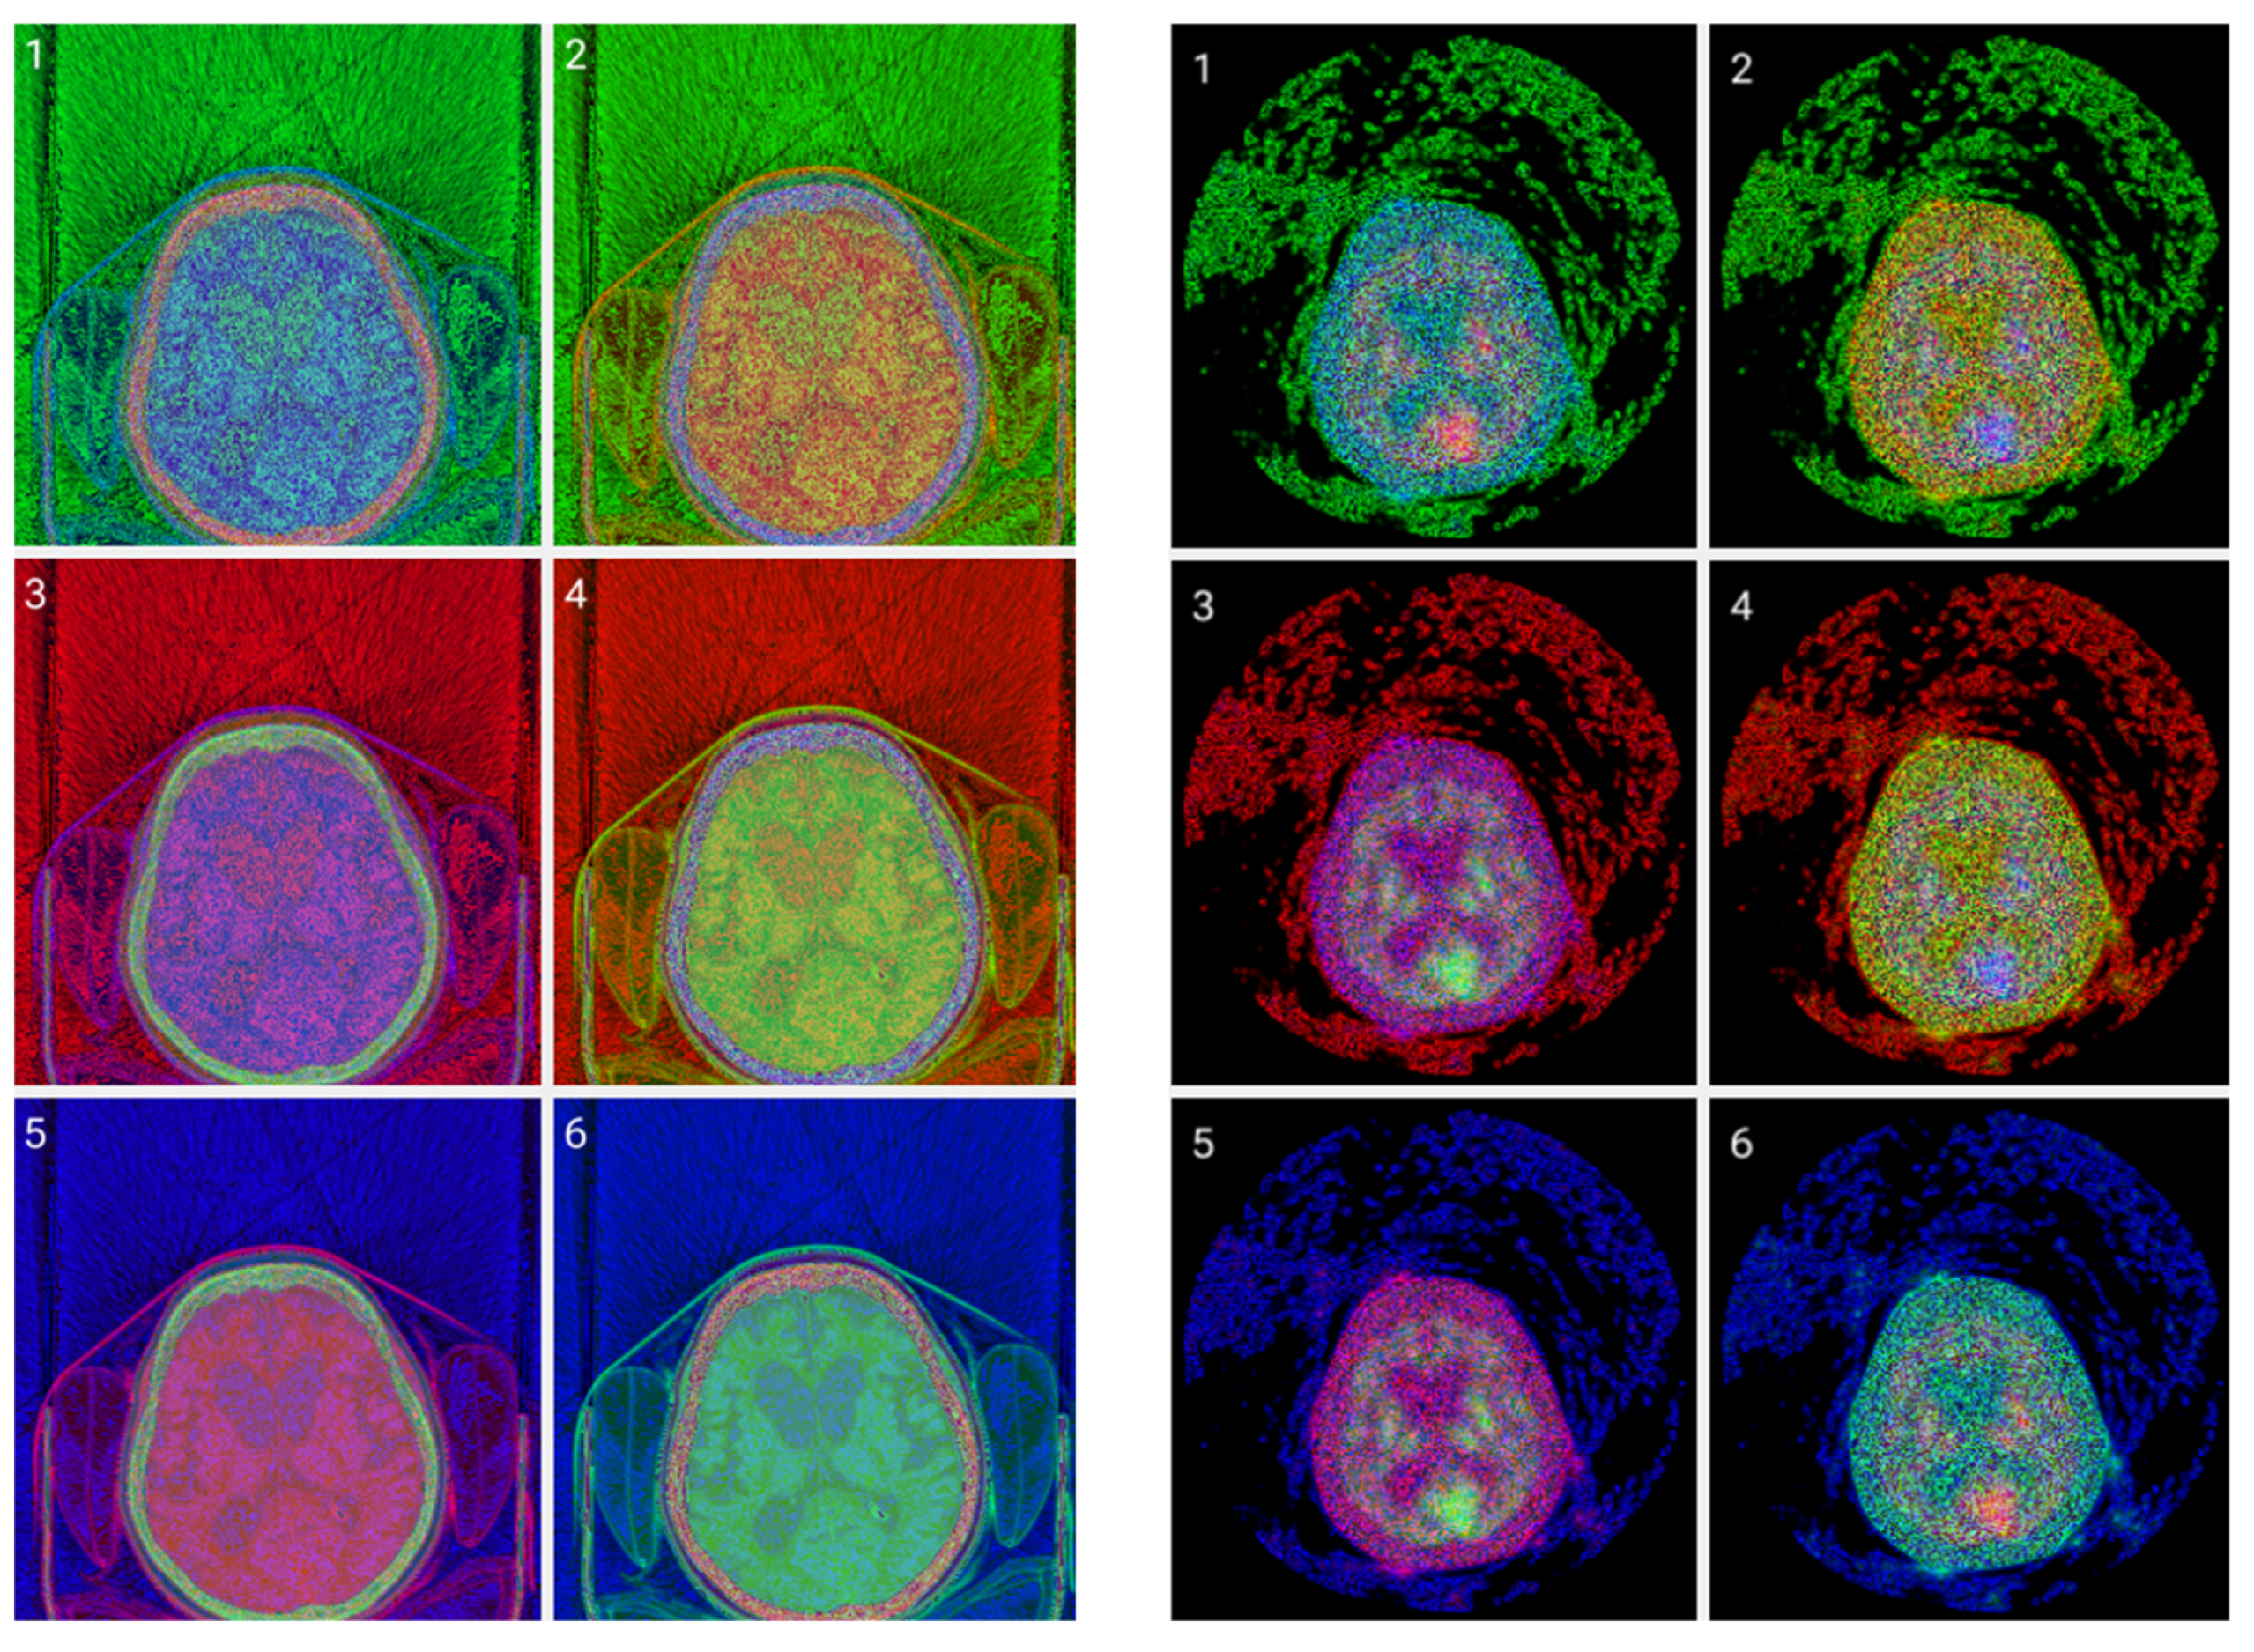
Figure 6 allows for a comparison of classic grayscale CT and PET images of a normal brain with images with different color byte significance from RGB and different distribution levels per channel.

Figure 6.
CIT of brain CT (left) and corresponding PET (right) images. 1. Normalized image of 16-bit integer to 8-bit grayscale. 2. Image data transformed by applying window thresholding normalized to grayscale. 3. CIT on RGB channels giving priority for the most significant byte to the Red channel, then Green, and then Blue, using equal distribution across the R, G, B levels. 4. CIT on RGB channels giving priority for the most significant byte to the Red channel, then Green, and then Blue using a biased distribution across the R/G/B levels at a ratio of 0.65/0.2/0.15. 5. CIT on RGB channels giving priority for the most significant byte to the Green channel, then Red, and then Blue, using equal distribution across the R, G, B levels. 6. CIT on RGB channels giving priority for the most significant byte to the Green channel, then Red, and then Blue, using biased distribution across the R/G/B levels at a ratio of 0.65/0.2/0.15.
The selection of the most significant byte on the RGB tuples affects the observable noise of the transformed image. At high frequencies, the least significant byte from the Green channel in the transformation is not “friendly” to the human eye as observed in Figure 7. The “friendliest” images are obtained by a CIT where the Blue channel represents the least significant byte.
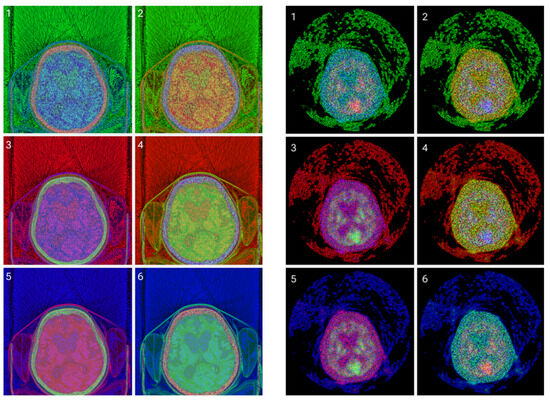

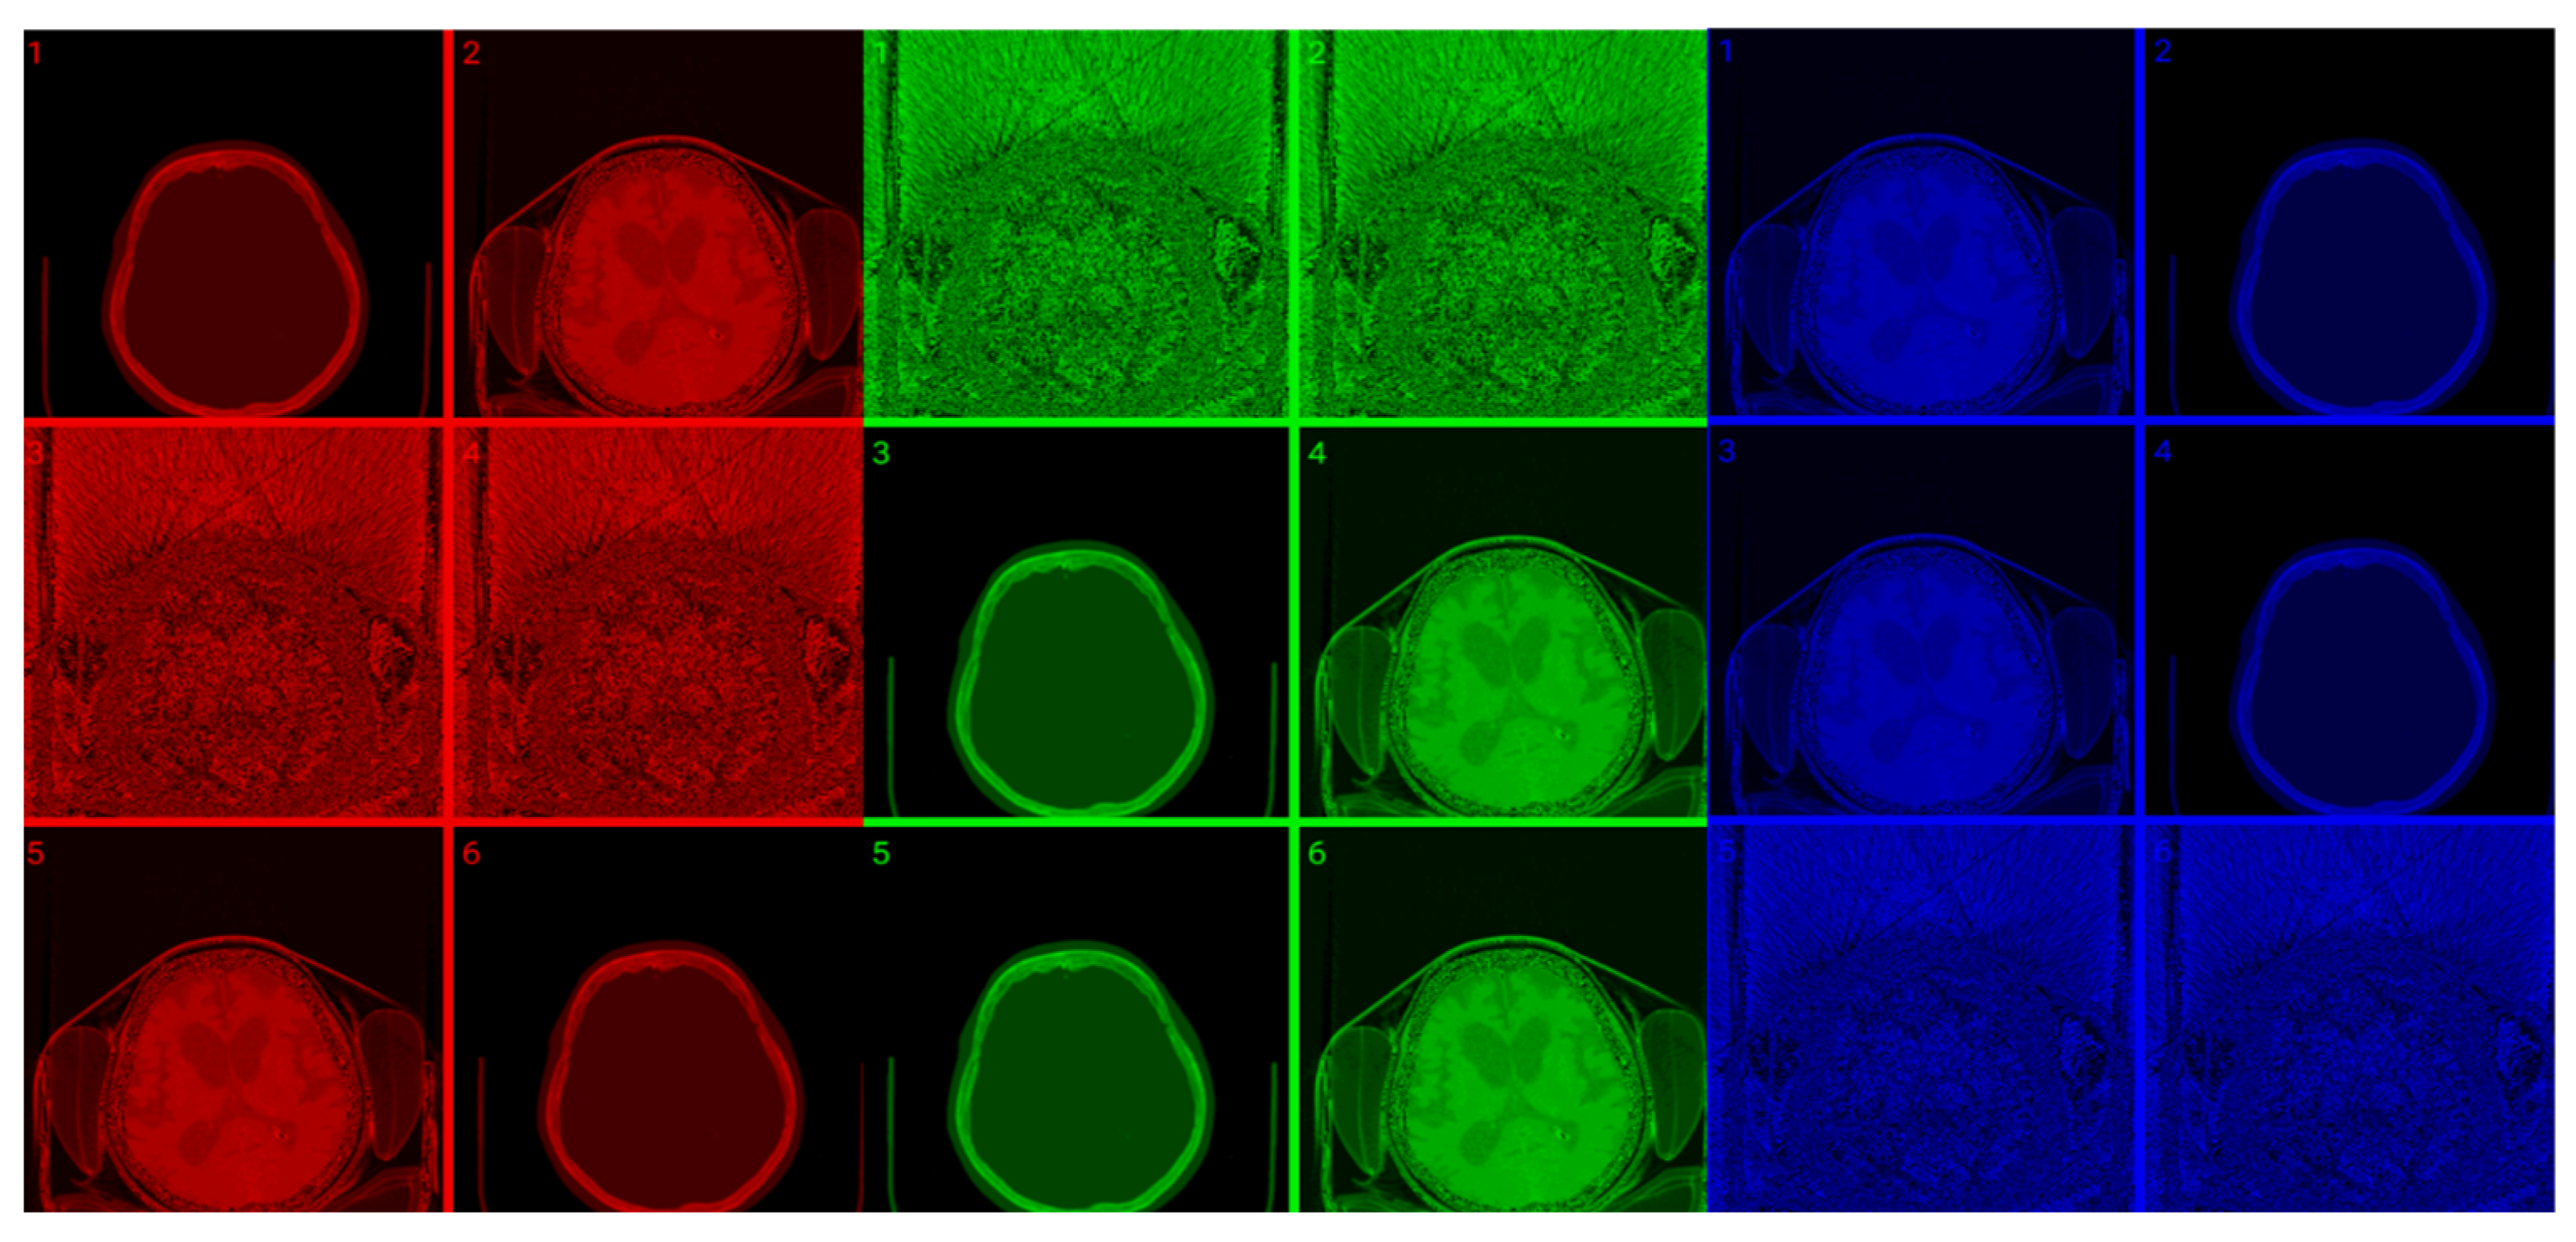
Figure 7.
(Top images series): Six CITs of a brain CT slice (left two columns) and corresponding PET slices (right two columns). 1. CIT on RGB channels giving responsibility for the most significant byte to the Red Channel, then Blue, and then Green using an equal distribution of R,G,B levels. 2. CIT on RGB channels giving responsibility for the most significant byte to Green Channel, then Blue, then Red using an equal distribution of R,G,B levels. 3. CIT on RGB channels giving responsibility for the most significant byte to Blue Channel, then Red, then Green using equal distribution of R,G,B levels. 4. CIT on RGB channels giving responsibility for the most significant byte to Blue Channel, then Green, then Red using equal distribution of R,G,B levels. 5. CIT on RGB channels giving priority for the most significant byte to Green Channel, then Red, then Blue using equal distribution of R,G,B levels. 6. CIT on RGB channels giving responsibility for the most significant byte to the Red Channel, then Green, and then Blue using an equal distribution of R,G,B levels. (Bottom image series): In this series of 18 CT images, we observe the noise that byte significance introduces into the distinct color channels. Every group of color represents the corresponding channel of the CT CIT images in the top image series.
Figure 8 shows raw, windowed, and CIT-transformed CT and PET slices including their associated color channels. Interestingly, useful information is present in different channels for the two modalities.
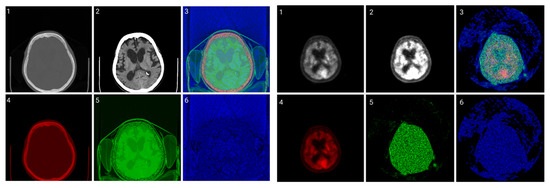
Figure 8.
CIT of brain CT (left block) and corresponding PET (right block). 1. Normalized image of 16-bit integer to 8-bit grayscale 2. Image transformed data by applying window thresholding normalized to grayscale 3. CIT on RGB channels giving priority for the most significant byte to Red Channel, then Green, then Blue using equal distribution of R,G,B levels. 4. Red channel of Image 3. 5. Green channel of Image 3. 6. Blue channel of Image 3.
3.2. Colormap Folding Application
In this method, the folding number gives more tissue detail if it is assigned proper values dependent only on modality, as can be seen in Figure 9 and Figure 10. This is particularly important for PET images to separate neighboring areas with similar metabolic properties, as can be seen in Figure 10.
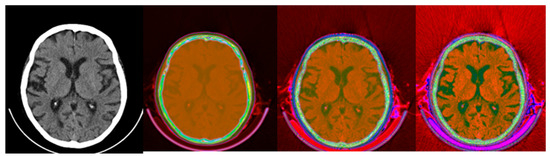
Figure 9.
Colormap Folding of CT image using 4, 13, and 28 folds from Black to White (from (left) to (right)).

Figure 10.
Colormap Folding of PET image corresponding to CT slice in Figure 9 using 1, 2, 3, and 25 folds from Black to White (from (left) to (right)).
The results in Figure 9 suggest that the Colormap Folding of a CT image may not offer additional value to the original windowed grayscale CT (left). There is value, however, in applying Colormap Folding to PET. “Hidden” information in the standard grayscale version of the images (Figure 10 left) becomes visible and ROIs with different metabolic behavior may be identified and quantified using SUVs. From left to right, the second image already shows better visible information than the classic presentation. The third image starts to separate the tissues into color regions and the fourth image produces more detailed separations. Folding the PET image a higher number of times gives a higher resolution and, despite the noise, is still useful to the human observer.
The fusion of CT and PET images after Colormap Folding improves presentation and adds valuable anatomic information, as seen in Figure 11.

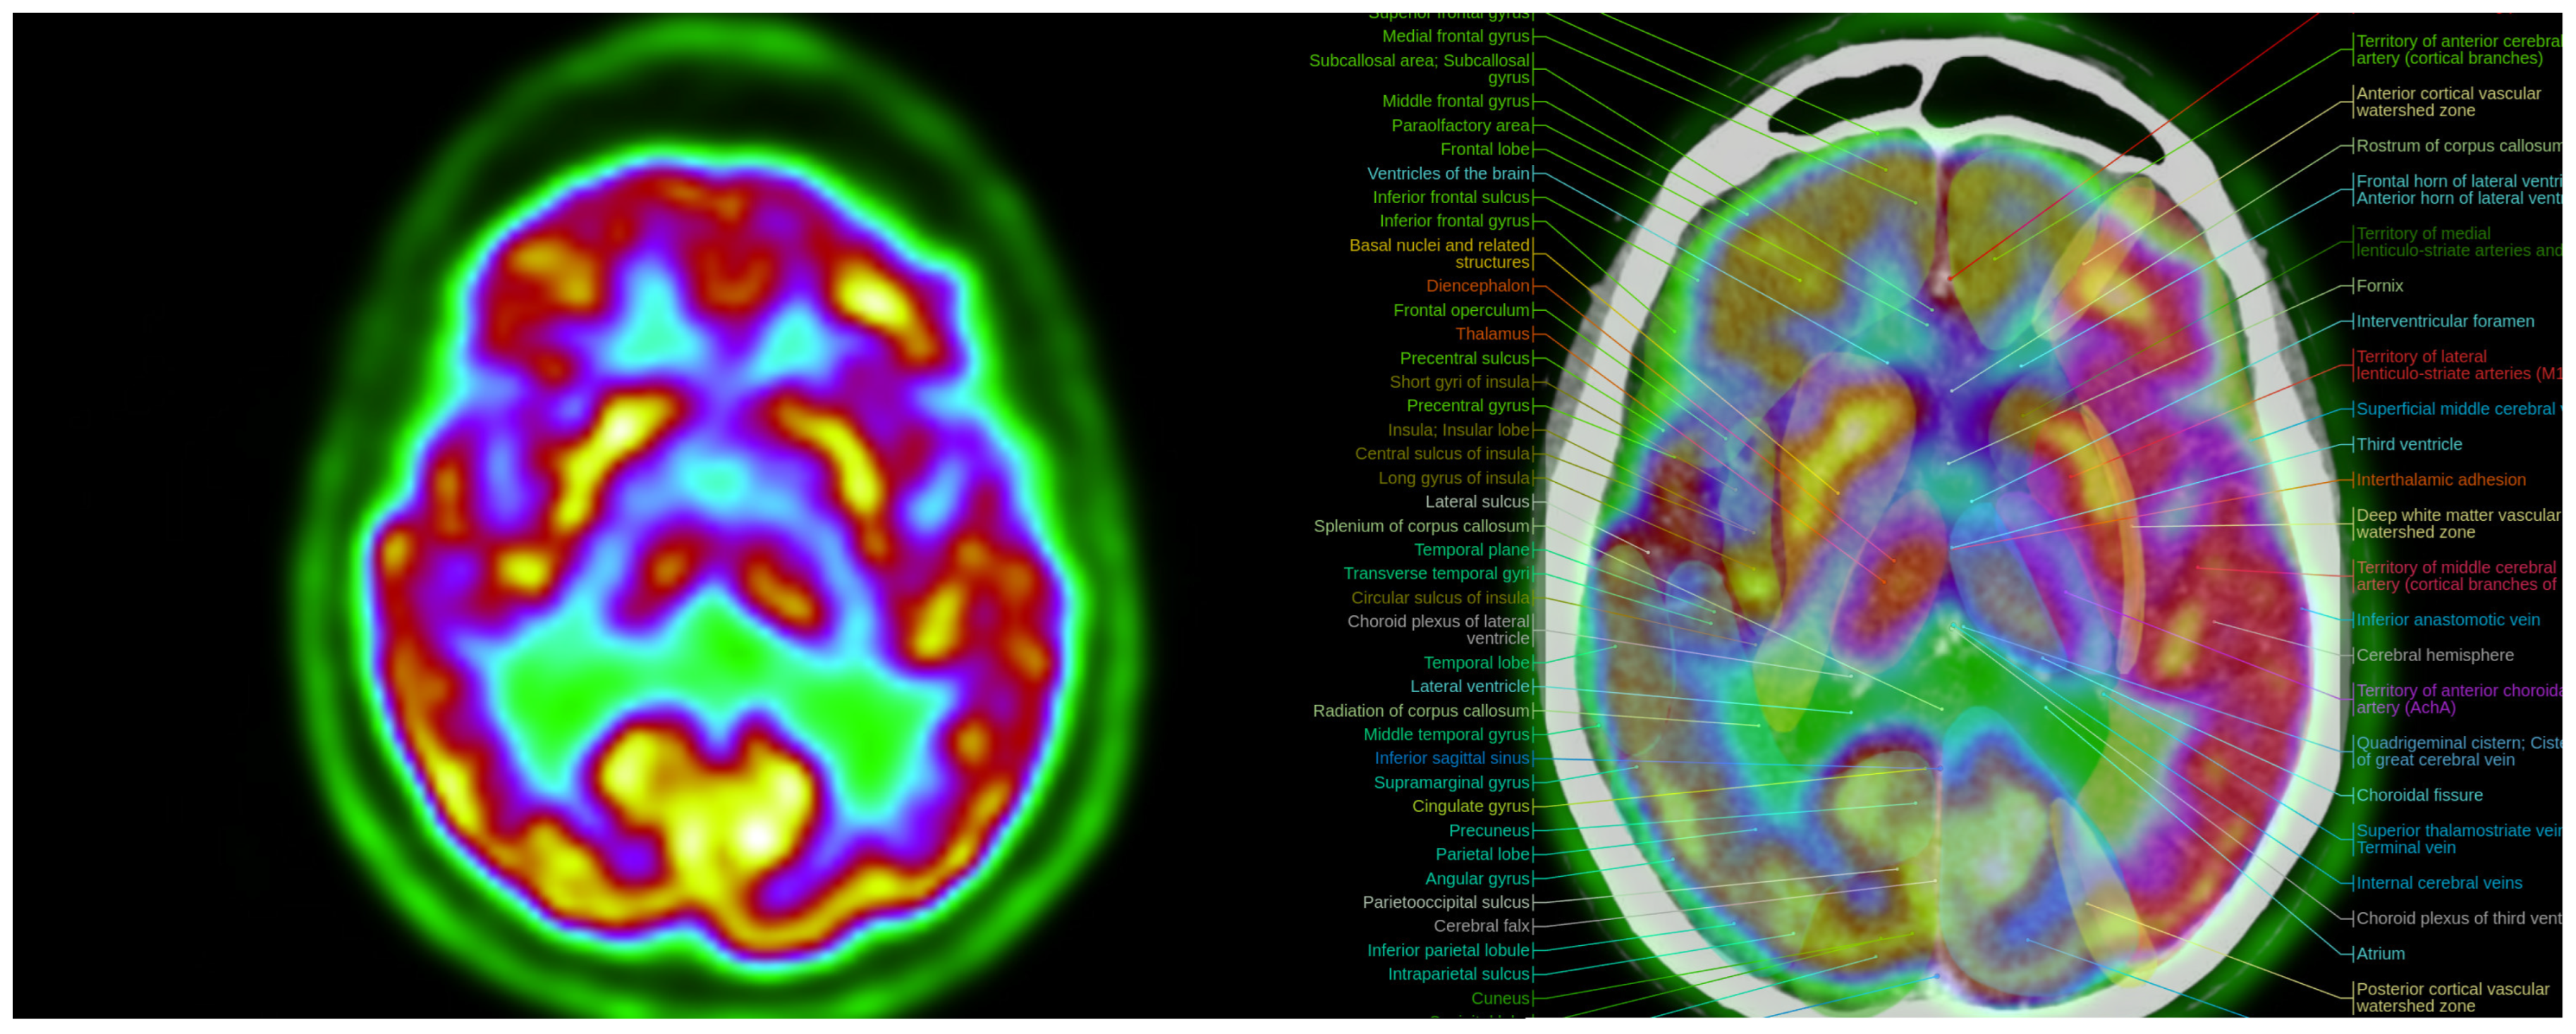
Figure 11.
Colormap Folding of a PET image with 2 folds (left) separates various metabolic regions by color. Anatomic information is added with the fusion of PET with CT (right). (Fused images were acquired from the IMAIOS medical imaging e-learning website where detailed anatomical information is available through a subscription).
The proposed Colormap Folding method is carried out using only white, black, and colors. Gray shades are left out of the method because the classical CT grayscale images will be fused with PET images that have undergone colormap folding. The fusion was evaluated using different percentage ratios and the results are presented in Figure 12, Figure 13 and Figure 14 for different folds.

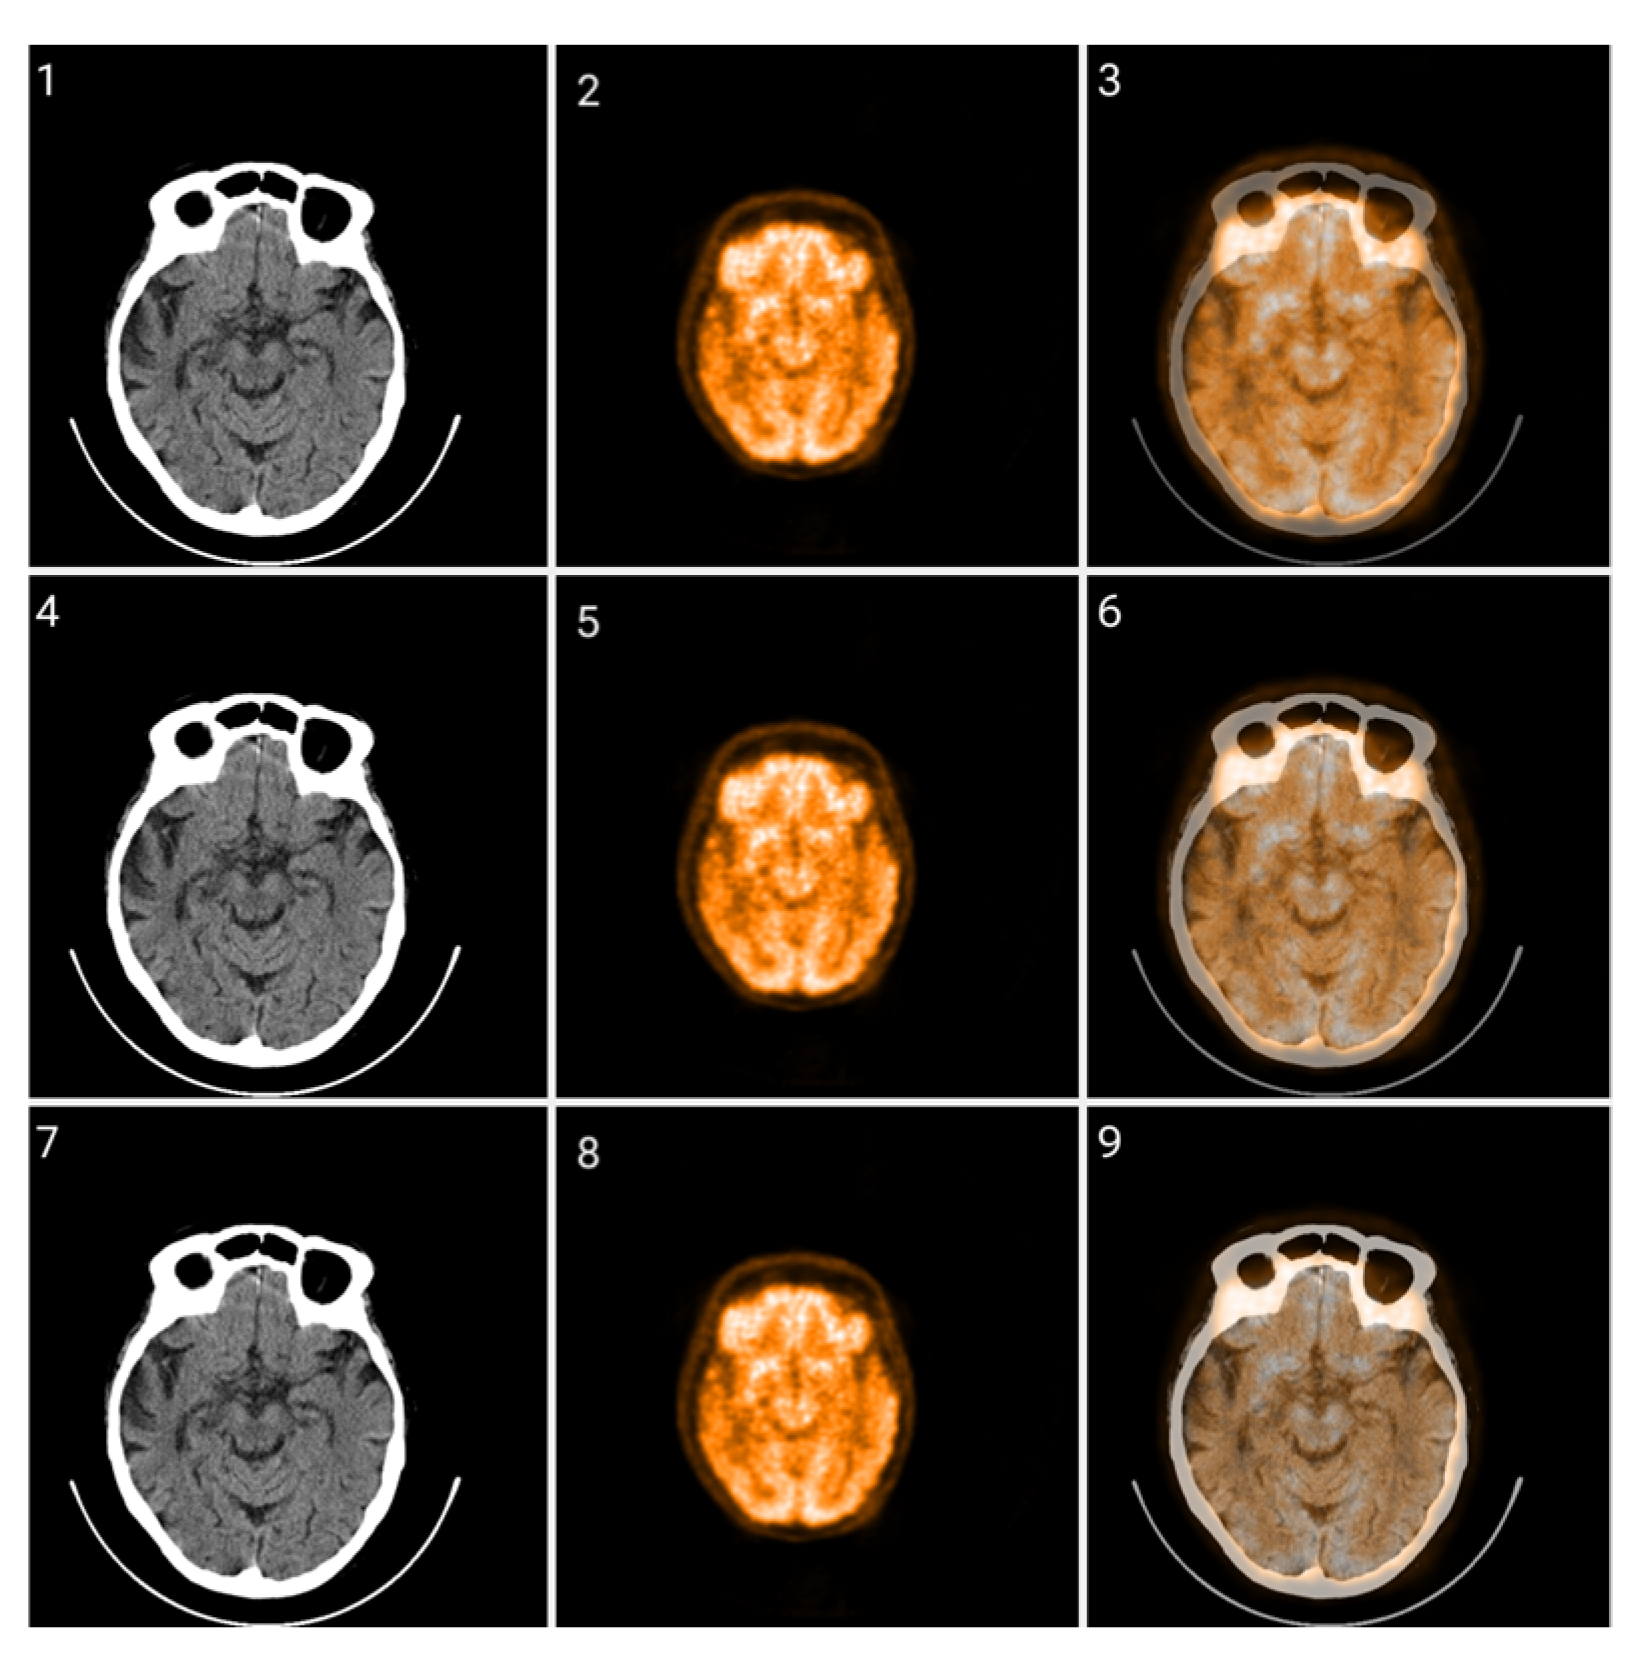
Figure 12.
Fusion of CT and PET images at different ratios. Images 1, 4, and 7 present a standard windowed CT image. Images 2, 5, and 8 present the corresponding PET image after Colormap Folding by 1 fold. Images 3, 6, and 9 present the results of fusing the CT and PET images at different ratios, 35%, 50%, 65% CT with 65%, 50%, 35% PET, respectively.
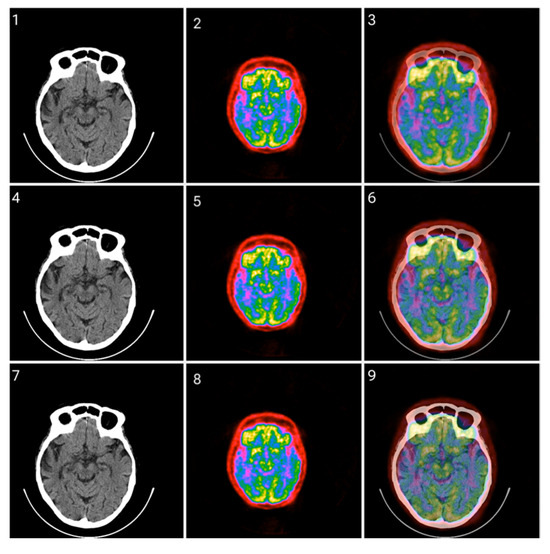
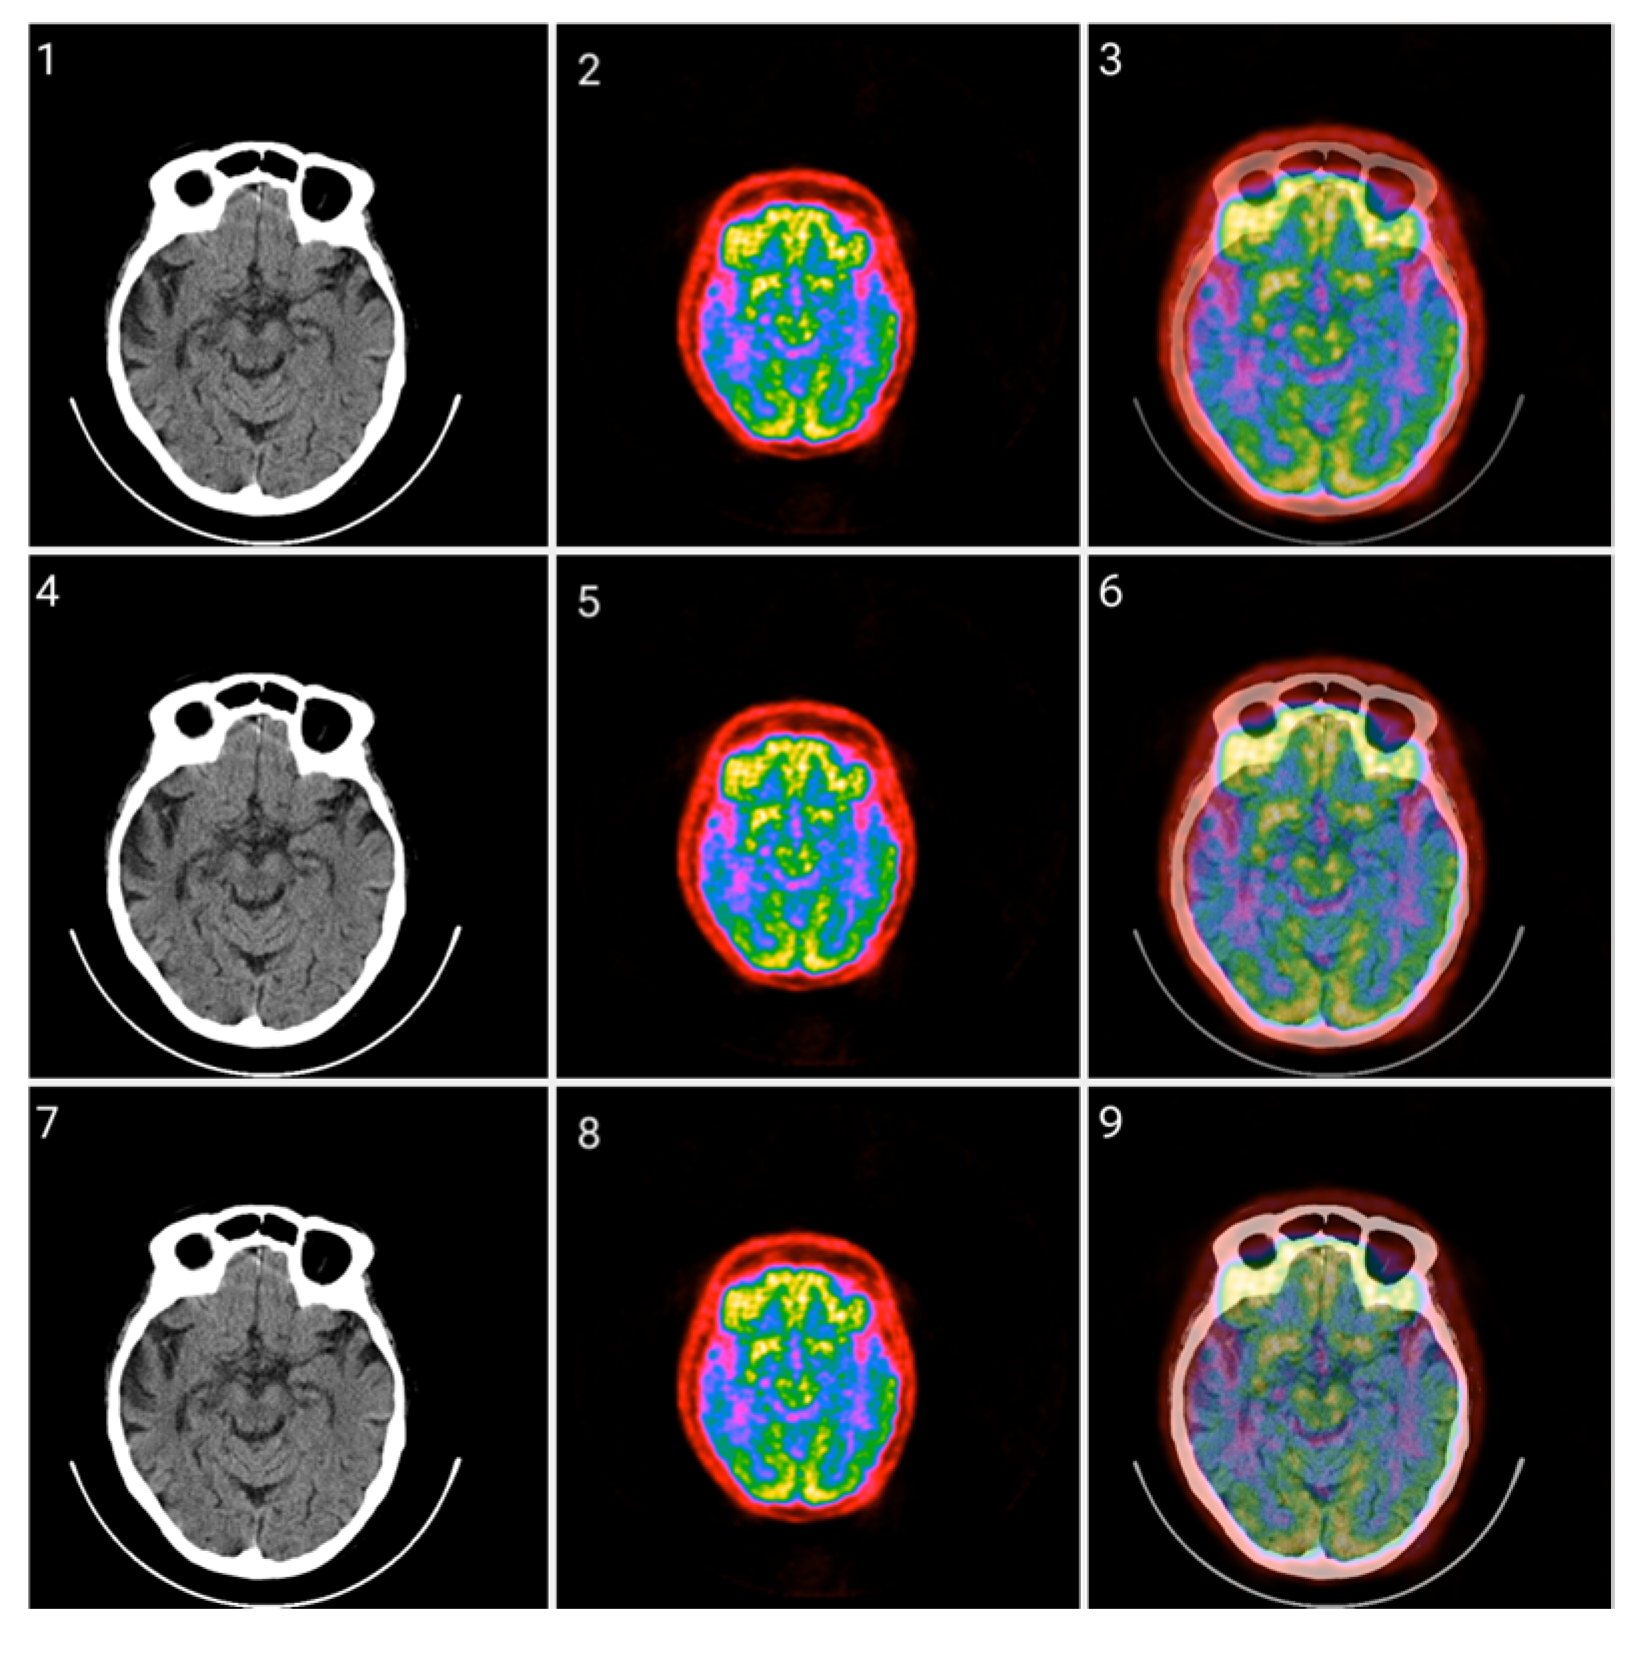
Figure 13.
Fusion of CT and PET images at different ratios. Images 1, 4, and 7 present a standard windowed CT image. Images 2, 5, and 8 present the corresponding PET image after Colormap Folding by 2 folds. Images 3, 6, and 9 present the results of fusing the CT and PET images at different ratios, 35%, 50%, 65% CT with 65%, 50%, 35% PET, respectively.
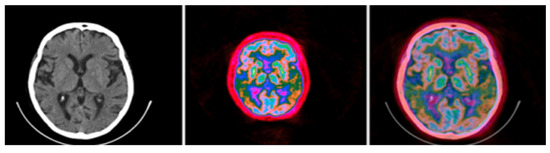
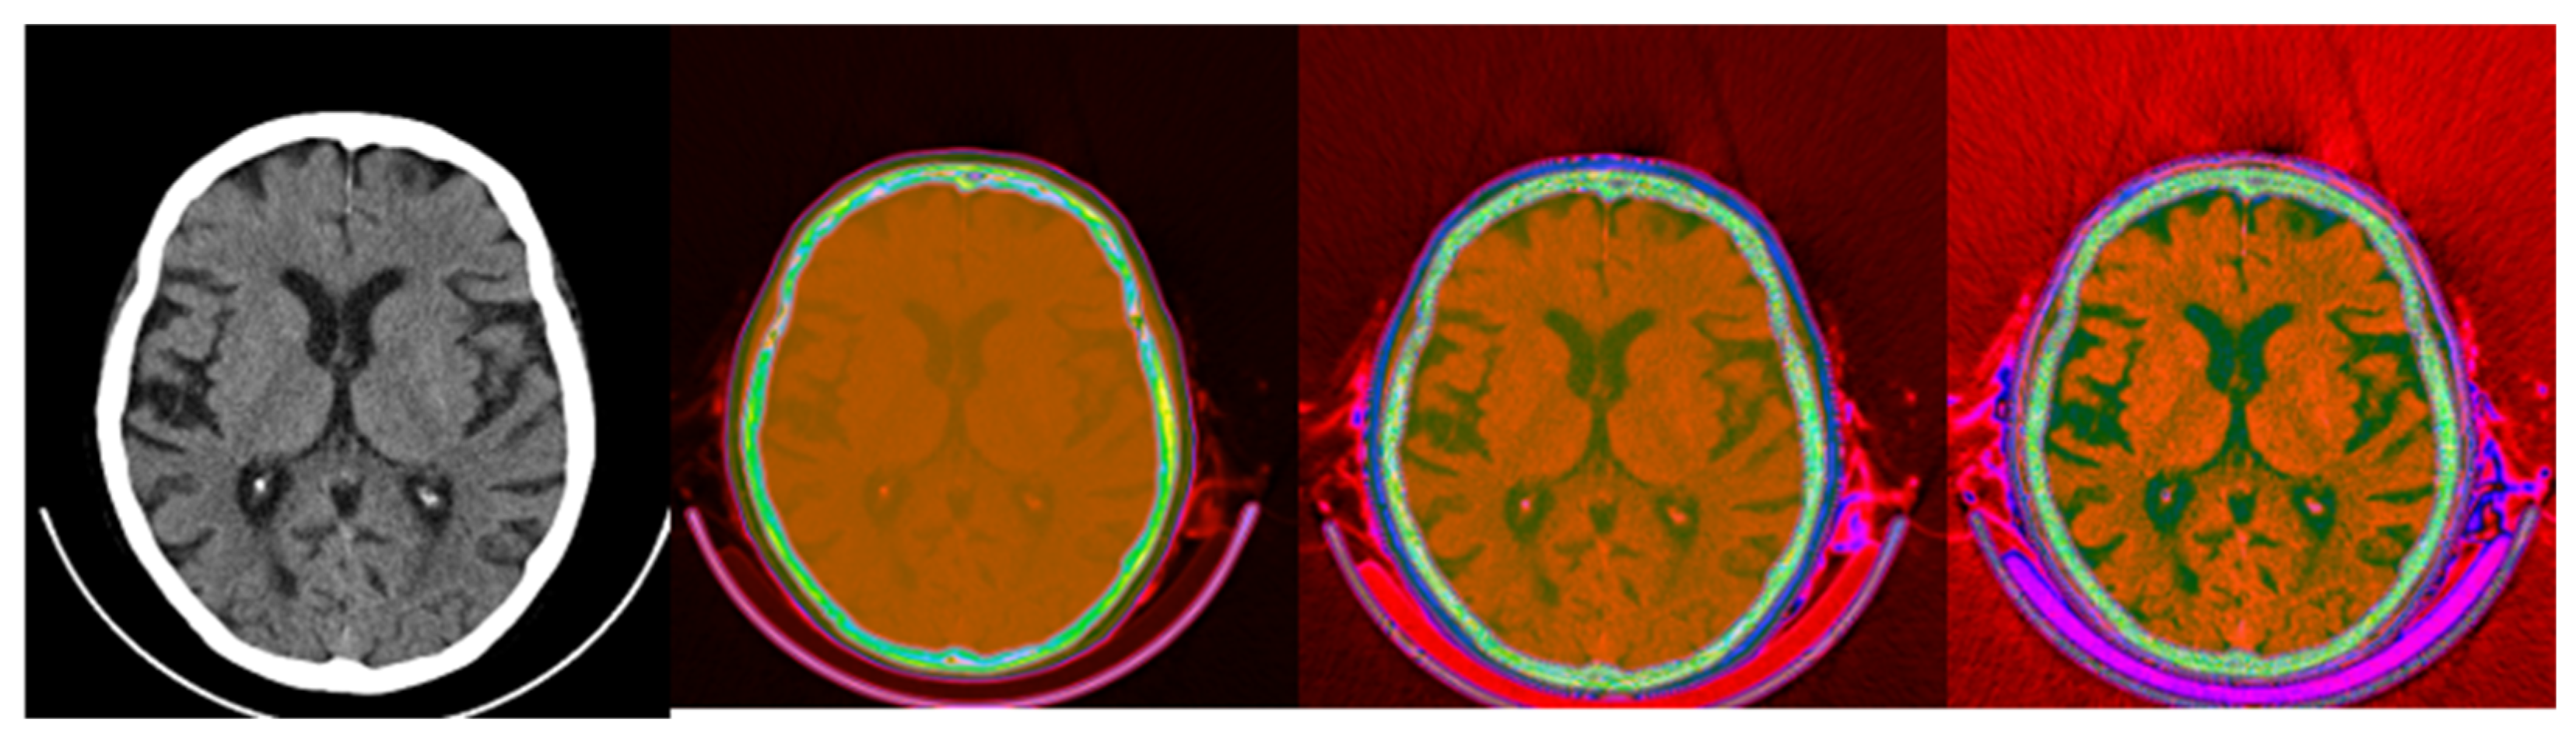
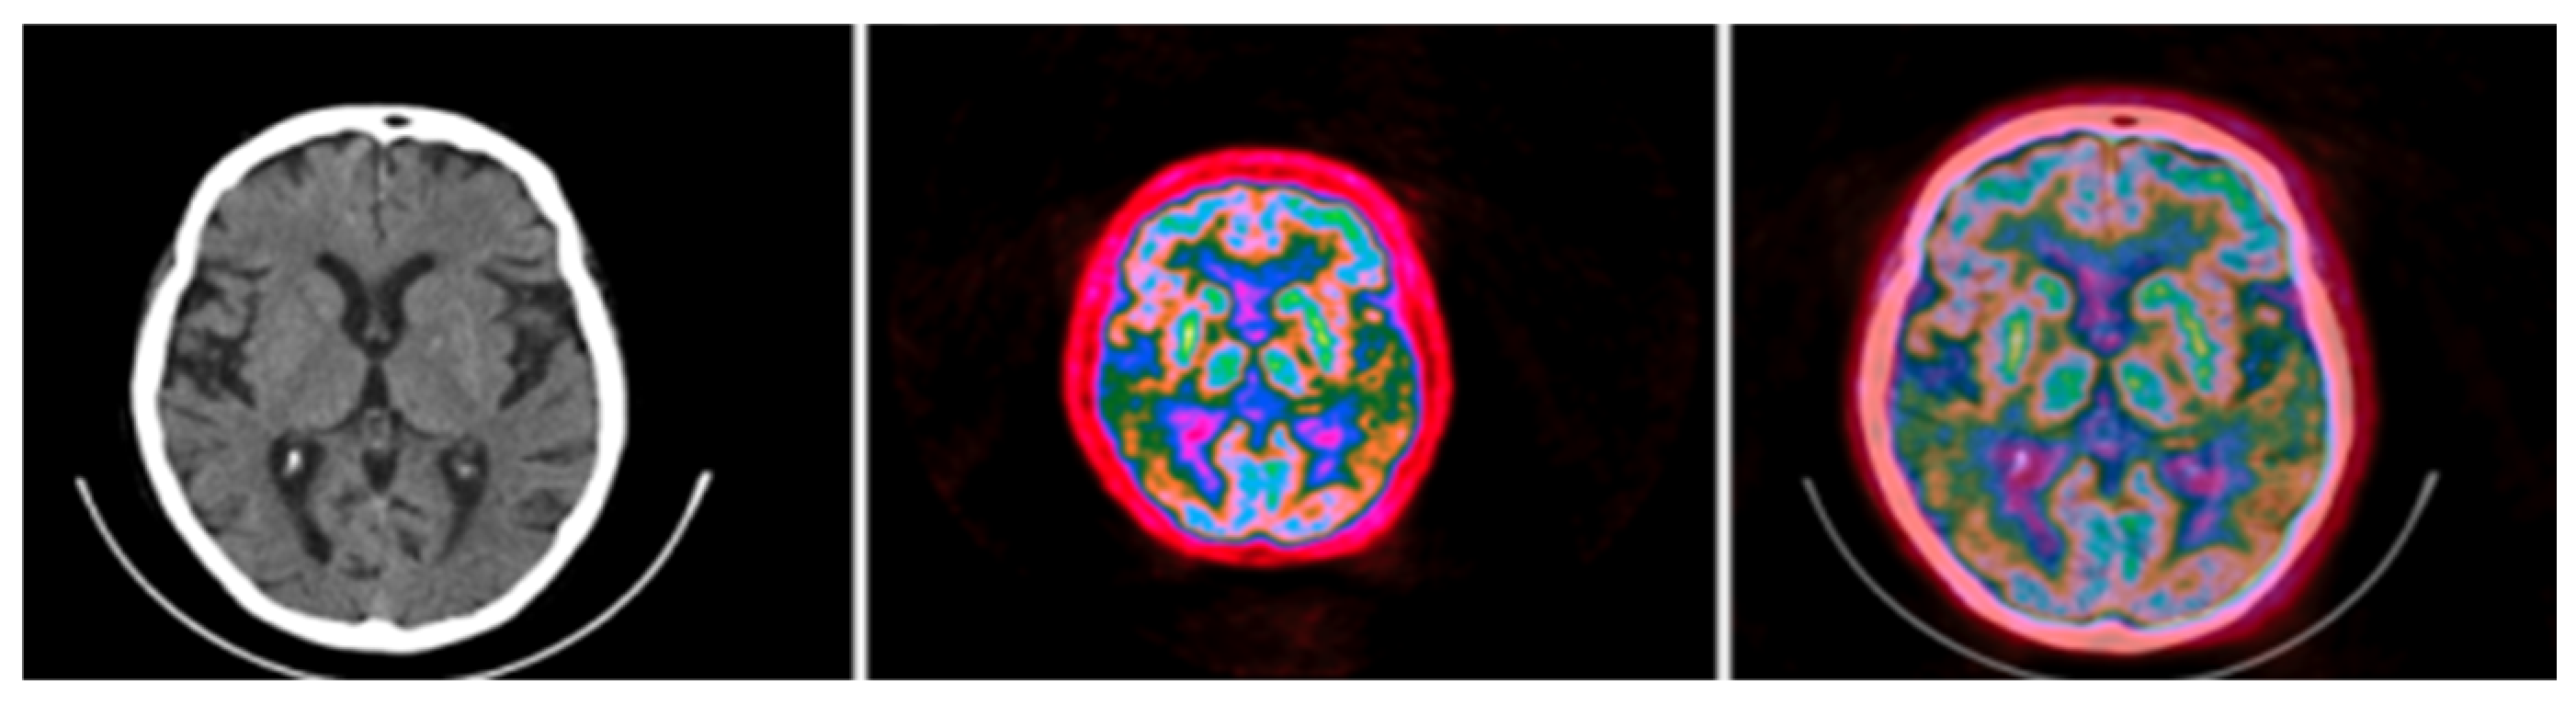
Figure 14.
Standard brain CT grayscale image (left), Colormap Folding applied to the corresponding PET image with 3 folds (middle) and fused scale-adjusted PET image with 50% of the CT image (right).
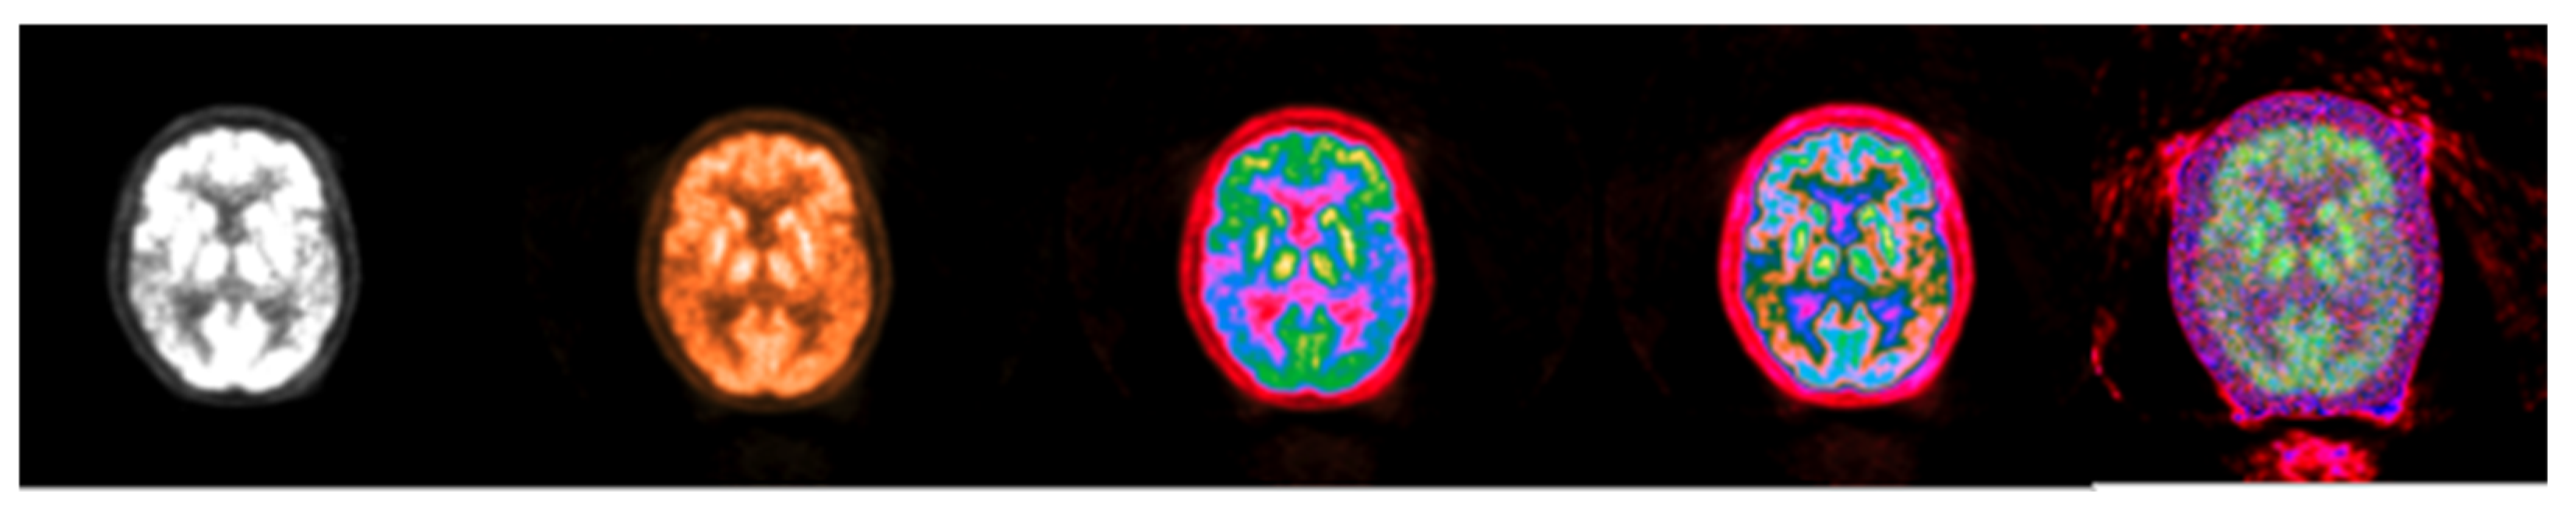
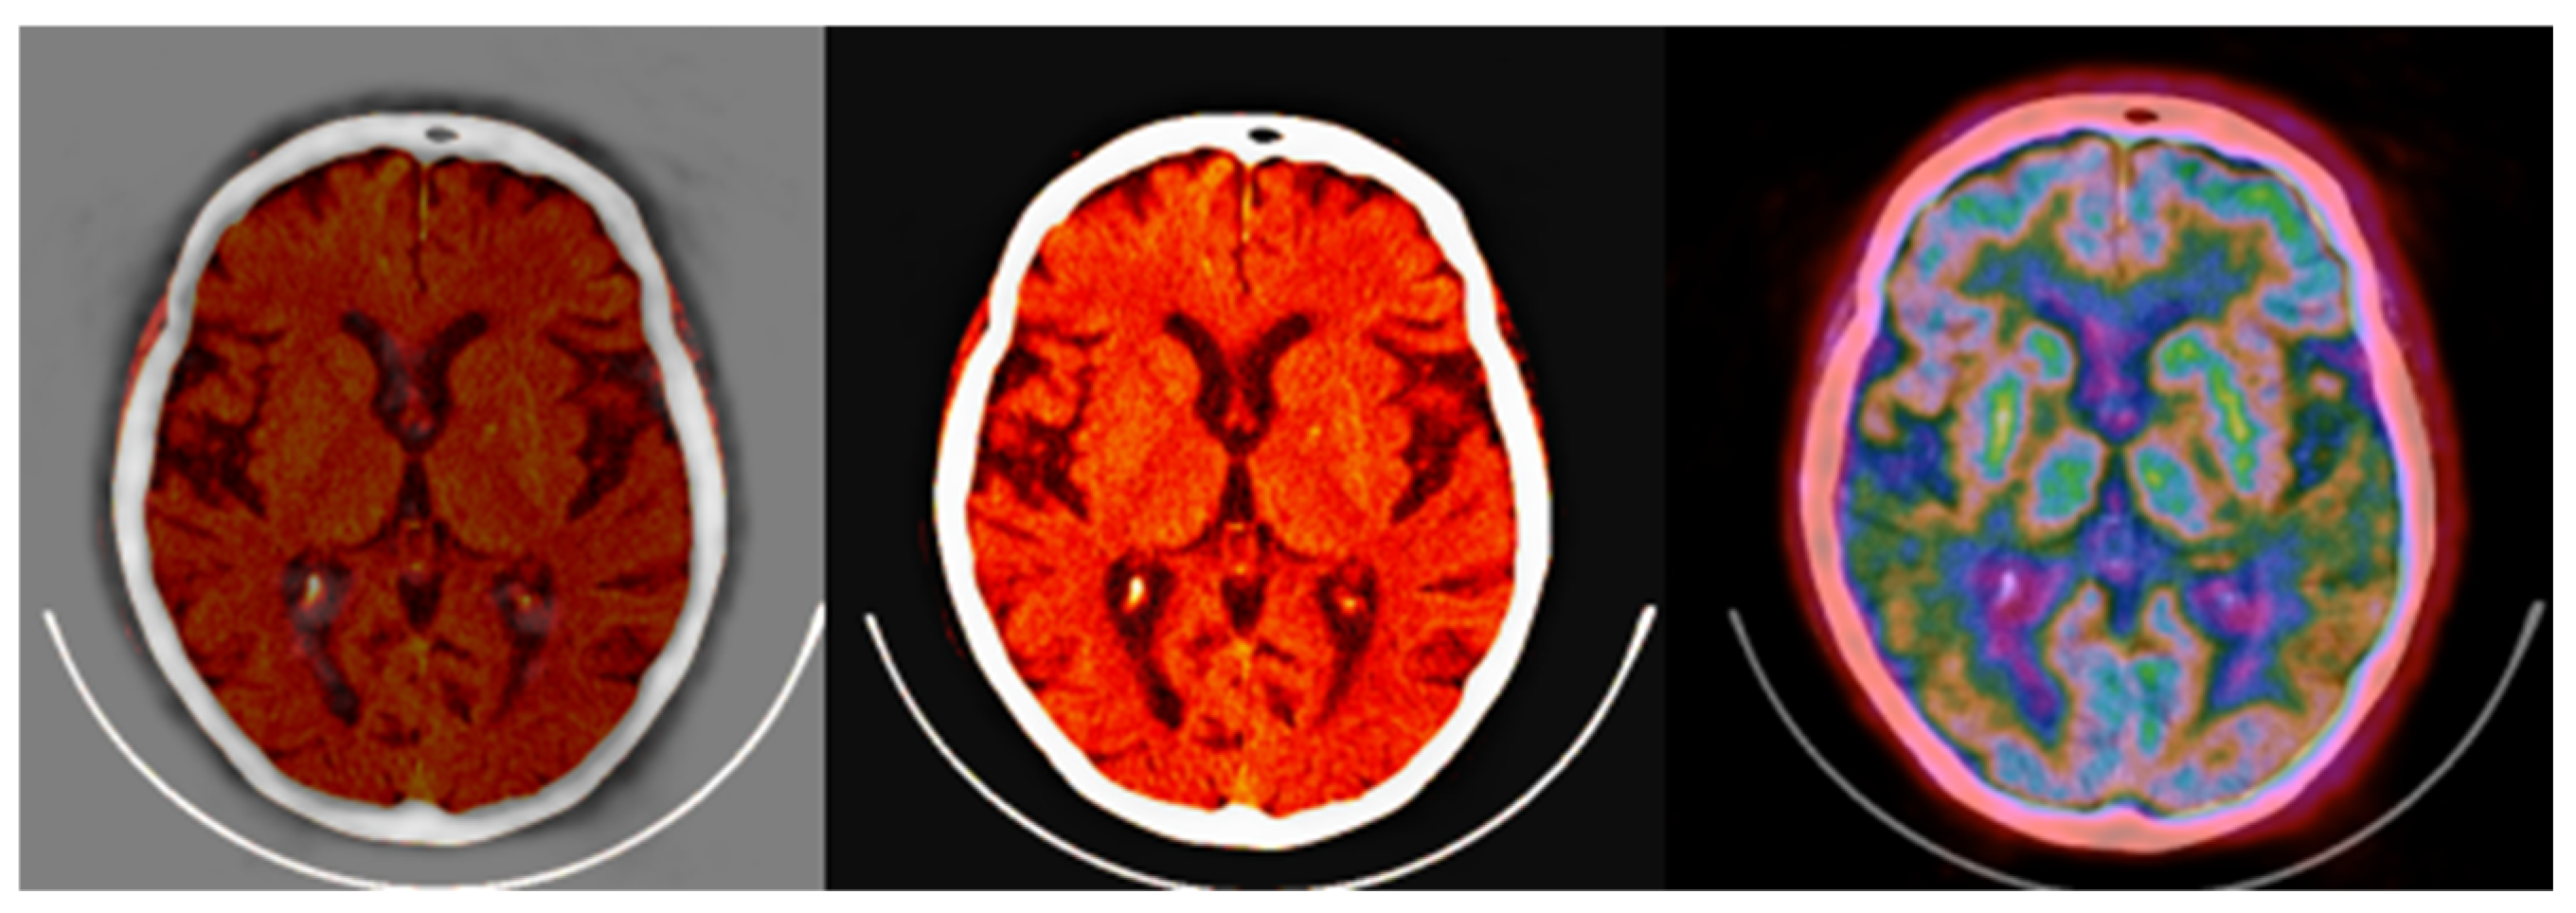
The fused images obtained with the proposed colormap folding may be compared with standard PET/CT fused data available on all manufacturers’ clinical workstation–user interfaces. Figure 15 presents typical results obtained for our data from a standard clinical interface and compares them to the fused image in Figure 14.

Figure 15.
(left,middle) images were obtained from a verified and clinically used PET/CT DICOM viewer software and represent the classical PET/CT fusion that may be used in clinical practice. These results may be compared with the 3-fold PET/CT fusion of Figure 14 using the proposed methodology.
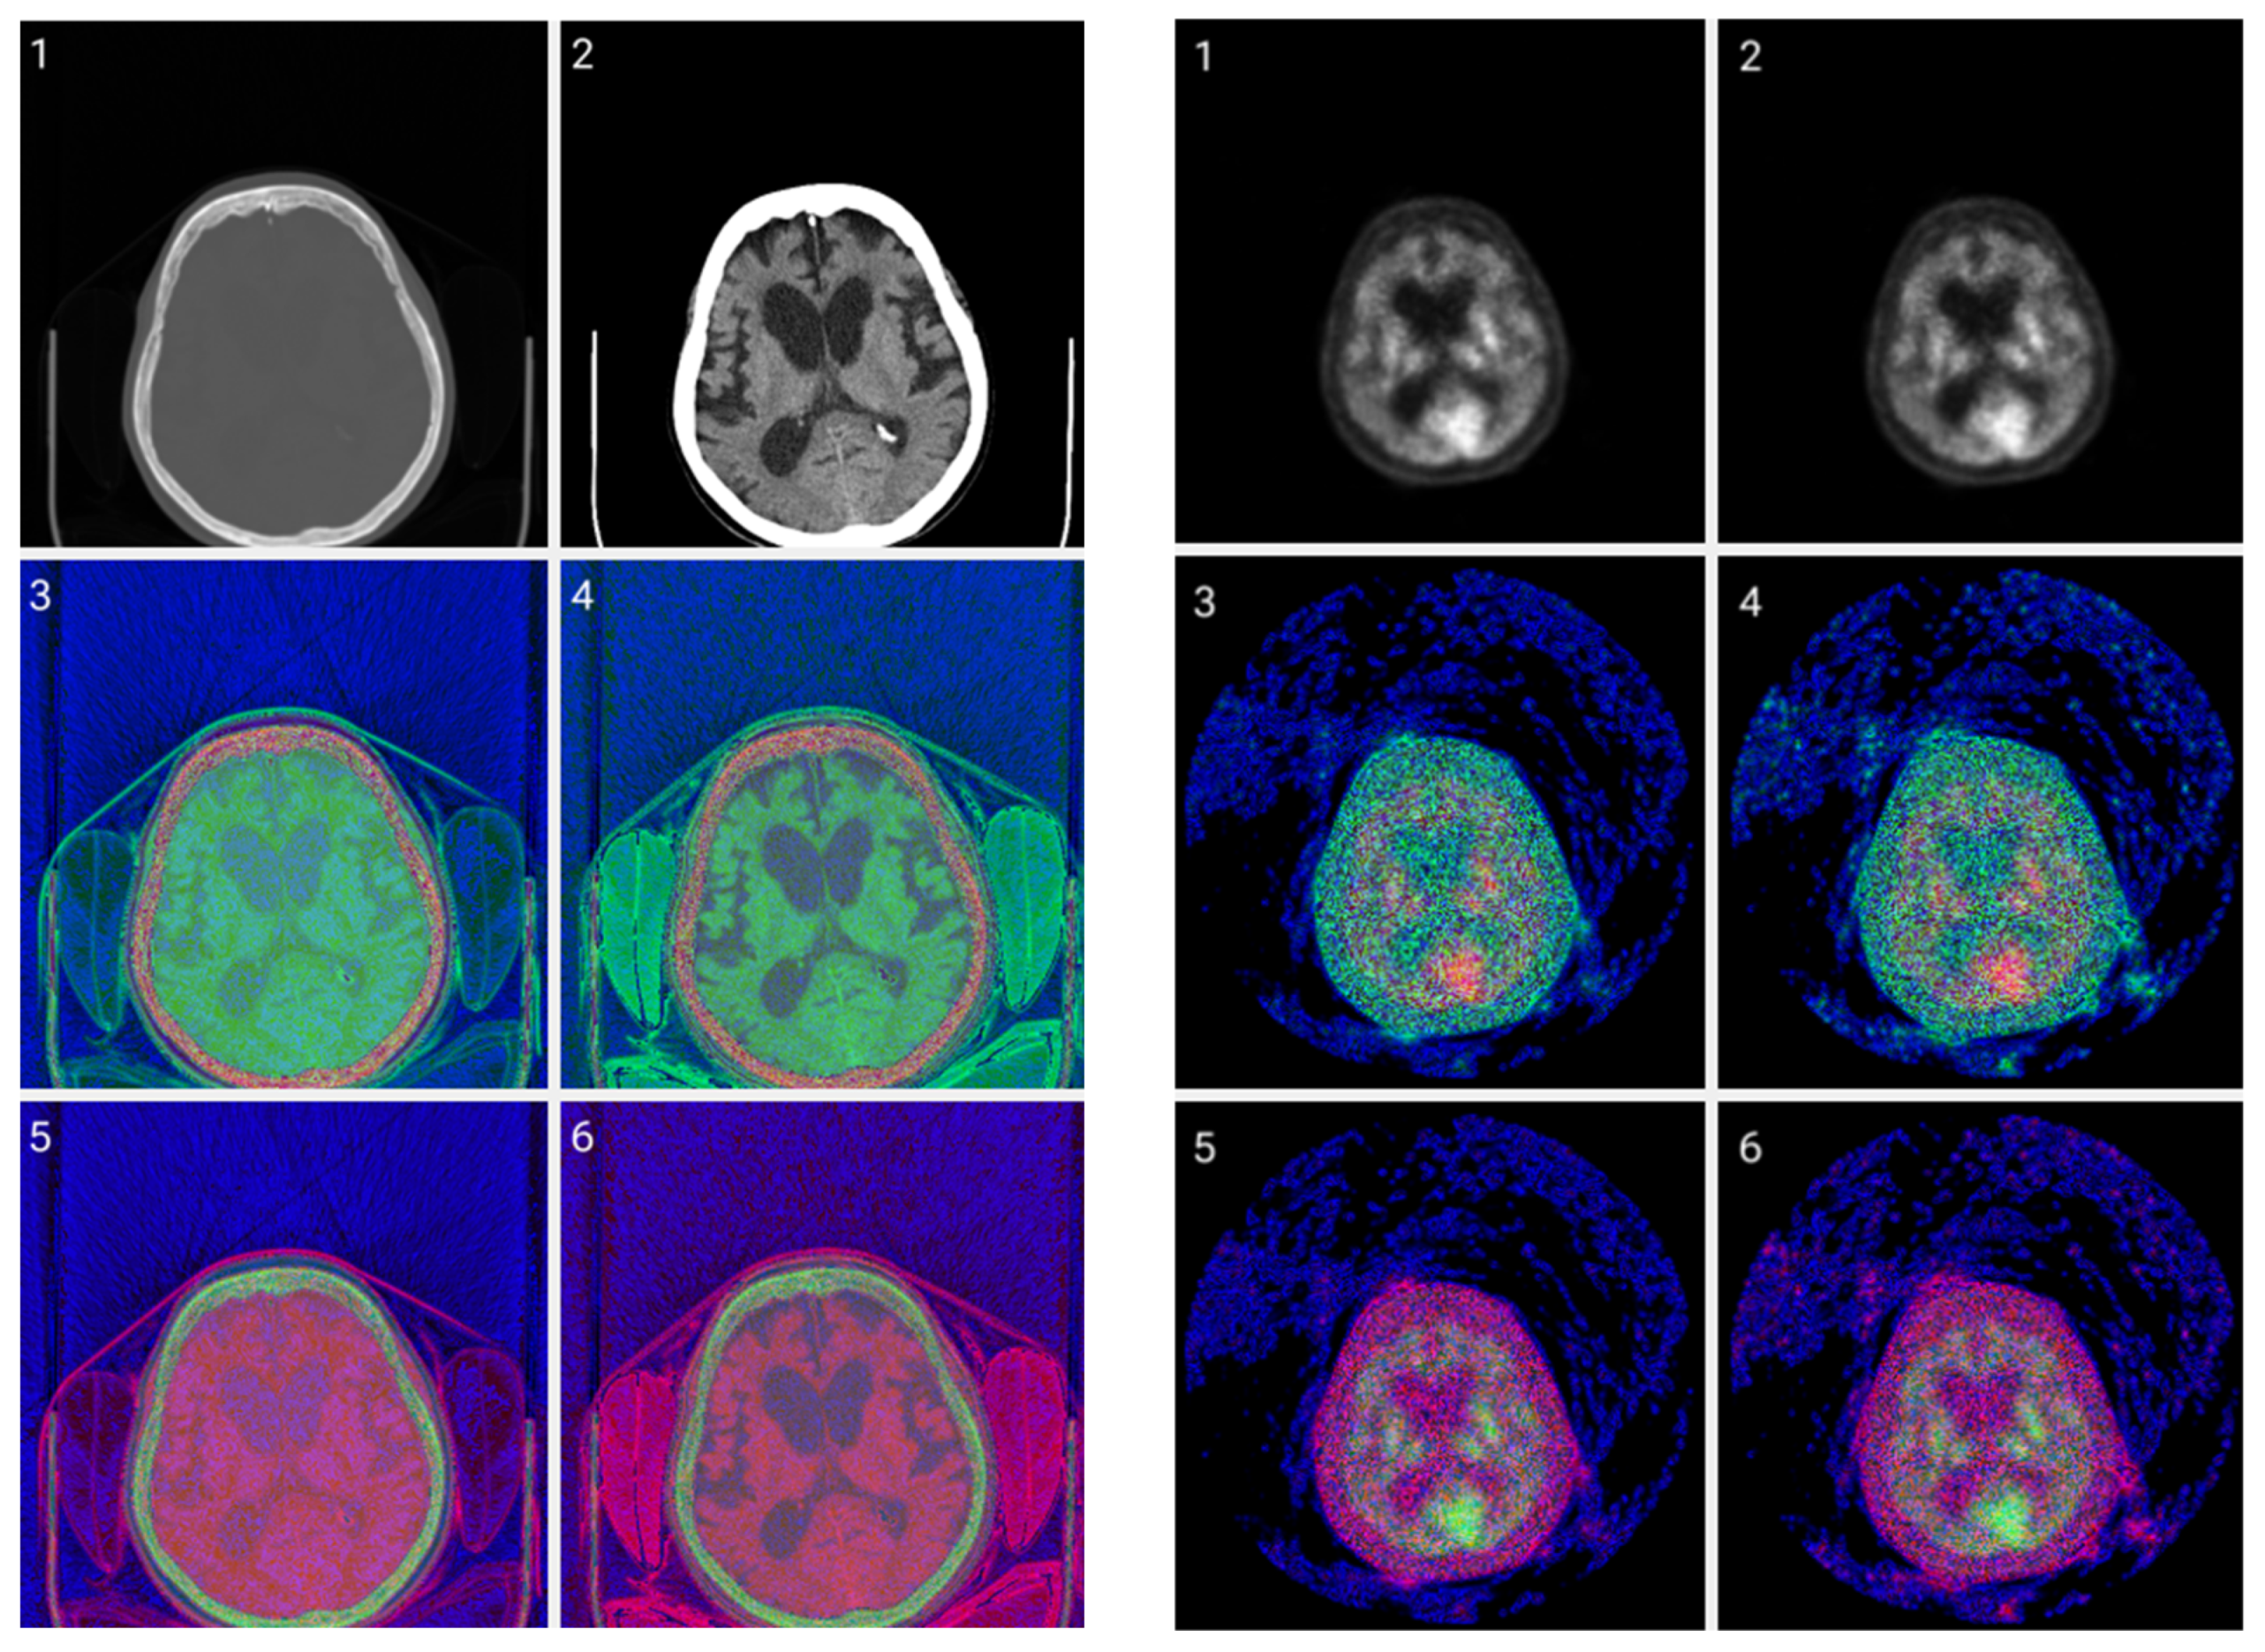
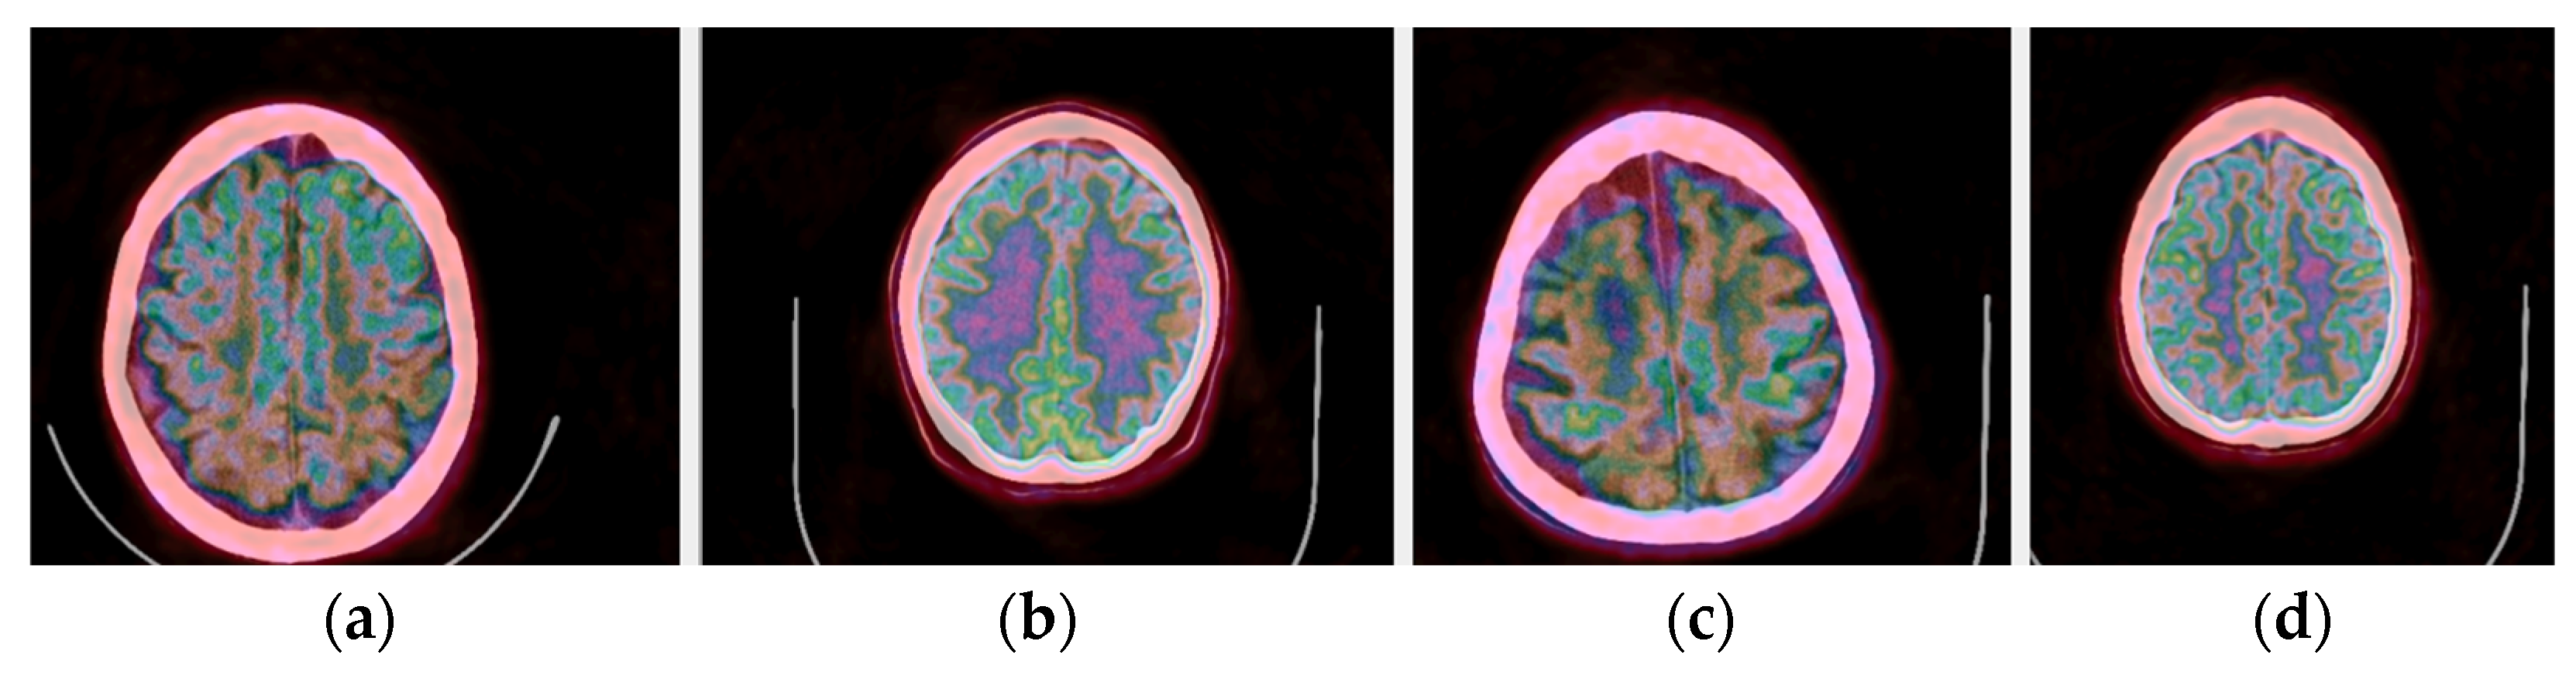
In addition to the application of the proposed methods to normal brain PET/CT scans, scans of patients with dementia were also processed in our pilot study. Representative fused PET/CT images using Colormap Folding are presented in Figure 16 for two healthy and two dementia patients. In this representation, orange color corresponds to high radiotracer uptake. Fewer orange-labeled areas are observed in the dementia patients than the healthy ones indicating lower uptake and, hence, lower metabolism.
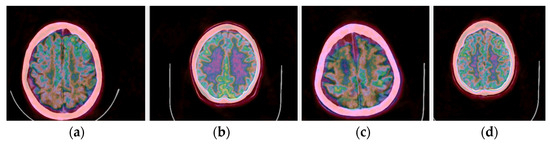
Figure 16.
(a,c) Fused PET/CT slices of healthy brain scans with orange color representing areas with highest radiotracer uptake. (b,d) Fused PET/CT slices of brain scans of patients with different stages of dementia.
4. Discussion
The proposed CIT method is a type of lossless color mapping. It generates images that contain all the information available in the raw DICOM files since no window is applied. The windowing process was replaced by a gradient of channel significance. A channel may encode large, medium, or small changes in pixel values. Small value changes are encoded on the third byte of significance in the (R,G,B) → (Byte,Byte,Byte) tuple as high spatial frequencies and appear like noise. Medium value changes are encoded on the second byte of significance in (R,G,B) → (Byte,Byte,Byte) tuple as medium spatial frequencies and contain valuable information in CT images. High-value changes are encoded on the first byte of significance in the (R,G,B) → (Byte,Byte,Byte) tuple as low spatial frequencies and contain valuable information from large areas in PET images due to metabolic processes. So, various priority levels from the most to least significant byte in RGB create different images with different visibilities due to the human’s eye variable sensitivity to colors. When color levels are biased (changed to a specific ratio) then we have contrast enhancement. The optimum fusion of PET/CT with the CIT method would be to blend the most significant byte of the PET image with the medium-significance byte of the CT image. Qualitative evaluation of the results by two nuclear medicine experts indicated that the color-coded image does not add any significant diagnostic value to the classical colored fusion already used clinically. It remains to be investigated how the color channels in the CIT will behave in an AI training model since, contrary to current single-channel data (grayscale) training, they contain all information available in the raw data in three separate channels that may be used as inputs for a detection, segmentation, or classification task [28,29,30].
The proposed Colormap Folding method is a lossy color mapping technique. Its purpose is to make information more visible to the human observer while targeting new AI research pathways and applications. For small number of folds there are visual losses but, at the same time, small variations in neighboring pixels are more distinct and easier to perceive visually while such differentiations may be more useful to an AI tool trained for computer vision. As the number of folds increases, the transformation tends to be lossless at the expense of losing diagnostic value, as confirmed by the experts. The optimum number of folds seems to be application dependent and will likely have to be determined for each application separately. Overall, the Colormap Folding offers a promising technique for numerous 2D or 3D applications including quantitative evaluation of the metabolism of specific ROIs before and after a specific treatment or comparison of drugs or evolution of a neurological or mental condition, as indicated by our pilot testing on dementia patients.
Both proposed color-encoding schemes required the conversion of DICOM data to .png files. The reversibility of the conversion was tested on a PET/CT image of a water phantom. Differences between the original and converted DICOM files were observed in the decimal places and may be considered negligible. A rigorous assessment of the losses (either visual or not) is required on real and diverse clinical data for a full assessment of .png and DICOM compatibility.
Both methods were also tested on whole-body PET/CT, SPECT, and MRI raw data showing great promise for a more generalized approach to medical image color-based transformation beyond brain PET/CT. This is the reason we call our methods high value and quantitative since our observations are directly related to the values recorded by the imaging system and have the advantage of showing observable difference due to eye color sensitivity.
5. Conclusions
In this study, two novel methods were described for using color on medical images. The first method, called Colormap Information Transform, offers additional information not available in windowed grayscale images, especially those created by CT. The CIT images have all the information from the raw data and do not use any windowing. By carrying out simple metadata editing to store the minimum, maximum values, and bitmapping levels, a lossless method was developed that can transform information in a medical image to three different simple .png files. In AI research models, such output may lead to different training mechanisms, alternative fine-tuning processes, or new deep neural network architectures for medical imaging since more informative input vectors would be available to the machine.
The second method yields results of higher diagnostic value in addition to its AI potential. It seems to introduce fewer spatial frequencies to the transformed images especially in PET while it may facilitate the segmentation and classification of ROIs of different metabolic activity and enhance qualitative measurements in 2D or 3D.
To support future clinical evaluations of the proposed methods, the initial in-house DICOM interface can be further developed to include the color mapping techniques as well as various image viewing and analysis tools. Our development was carried out in CPP using wxWidgets, VTK, and OpenGL in a Microsoft Windows OS that could be easily distributed for evaluation.
Author Contributions
Conceptualization, M.K. and M.M.; investigation, M.K. and M.M.; methodology, M.M.; software, M.M.; validation, S.C.; resources, S.C. and M.K.; writing—original draft preparation, M.M. and M.K.; writing—review and editing, M.M., S.C. and M.K.; supervision, M.K. All authors have read and agreed to the published version of the manuscript.
Funding
This research received no external funding.
Institutional Review Board Statement
Ethical review and approval were waived for this study because it is a secondary use of unidentified and non-coded data. Hence, this study did not constitute research with human subjects because there was no interaction with any individual and no identifiable private information was used.
Informed Consent Statement
Written informed consent was obtained from all subjects involved in this study.
Data Availability Statement
Data is contained within the article.
Conflicts of Interest
The authors declare no conflict of interest.
References
- Townsend, D.W.; Beyer, T.; Blodgett, T.M. PET/CT scanners: A hardware approach to image fusion. Sem. Nucl. Med. 2003, 33, 193–204. [Google Scholar] [CrossRef] [PubMed]
- Torigian, D.A.; Huang, S.S.; Houseni, M.; Alavi, A. Functional Imaging of Cancer with Emphasis on Molecular Techniques. CA Cancer J. Clin. 2007, 57, 206–224. [Google Scholar] [CrossRef] [PubMed]
- Jadvar, H.; Parker, J.A. Clinical PET and PET/CT; Springer Science & Business Media: Berlin/Heidelberg, Germany, 2006. [Google Scholar]
- Hess, S.; Blomberg, B.A.; Zhu, H.J.; Høilund-Carlsen, P.F.; Alavi, A. The pivotal role of FDG-PET/CT in modern medicine. Acad. Radiol. 2014, 21, 232–249. [Google Scholar] [CrossRef]
- Freeman, L.M.; Blaufox, M.D. (Eds.) Brain Imaging Update. Semin. Nucl. Med. 2012, 42, 353. [Google Scholar] [CrossRef]
- Wang, T.; Xing, H.; Wang, S.; Liu, L.; Li, F.; Jing, H. Deep learning-based automated segmentation of eight brain anatomical regions using head CT images in PET/CT. BMC Med. Imaging 2022, 22, 99. [Google Scholar] [CrossRef] [PubMed]
- Tremblay, P.; Dick, A.S. Broca and Wernicke are dead, or moving past the classic model of language neurobiology. Brain Lang. 2016, 162, 60–71. [Google Scholar] [CrossRef]
- Hofman, M.S.; Hicks, R.J. How We Read Oncologic FDG PET/CT. Cancer Imaging 2016, 16, 35. [Google Scholar] [CrossRef]
- Sadaghiani, M.S.; Rowe, S.P.; Sheikhbahaei, S. Applications of artificial intelligence in oncologic 18F-FDG PET/CT imaging: A systematic review. Ann. Transl. Med. 2021, 9, 823. [Google Scholar] [CrossRef]
- Foster, B.; Bagci, U.; Mansoor, A.; Xu, Z.; Mollura, D.J. A review on segmentation of positron emission tomography images. Comp. Biol. Med. 2014, 50, 76–96. [Google Scholar] [CrossRef]
- Lyra, V.; Parissis, J.; Kallergi, M.; Rizos, E.; Filippatos, G.; Kremastinos, D.; Chatziioannou, S. 18F-FDG PET/CT brain glucose metabolism as a marker of different types of depression comorbidity in chronic heart failure patients with impaired systolic function. Eur. J. Heart Fail. 2020, 22, 2138–2146. [Google Scholar] [CrossRef]
- Porter, E.; Fuentes, P.; Siddiqui, Z.; Thompson, A.; Levitin, R.; Solis, D.; Myziuk, N.; Guerrero, T. Hippocampus segmentation on noncontrast CT using deep learning. Med. Phys. 2020, 47, 2950–2961. [Google Scholar] [CrossRef]
- Carlson, M.L.; DiGiacomo, P.S.; Fan, A.P.; Goubran, M.; Khalighi, M.M.; Chao, S.Z.; Vasanawala, M.; Wintermark, M.; Mormino, E.; Zaharchuk, G.; et al. Simultaneous FDG-PET/MRI detects hippocampal subfield metabolic differences in AD/MCI. Sci. Rep. 2020, 10, 12064. [Google Scholar] [CrossRef] [PubMed]
- Zhang, Y.; Zhang, D.; Chen, Z.; Wang, H.; Miao, W.; Zhu, W. Clinical evaluation of a novel atlas-based PET/CT brain image segmentation and quantification method for epilepsy. Quant. Imaging Med. Surg. 2022, 12, 4538–4548. [Google Scholar] [CrossRef] [PubMed]
- Alongi, P.; Laudicella, R.; Panasiti, F.; Stefano, A.; Comelli, A.; Giaccone, P.; Arnone, A.; Minutoli, F.; Quartuccio, N.; Cupidi, C.; et al. Radiomics Analysis of Brain [18F]FDG PET/CT to Predict Alzheimer’s Disease in Patients with Amyloid PET Positivity: A Preliminary Report on the Application of SPM Cortical Segmentation, Pyradiomics, and Machine-Learning Analysis. Diagnostics 2022, 12, 933. [Google Scholar] [CrossRef]
- Bhateja, V.; Srivastava, A.; Moin, A.; Lay-Ekuakille, A. Multispectral medical image fusion scheme based on hybrid contourlet and shearlet transform domains. Rev. Sci. Instrum. 2018, 89, 084301. [Google Scholar] [CrossRef] [PubMed]
- Jun, S.; Park, J.G.; Seo, Y. Accurate FDG PET tumor segmentation using the peritumoral halo layer method: A study in patients with esophageal squamous cell carcinoma. Cancer Imaging 2018, 18, 35. [Google Scholar] [CrossRef]
- NEMA. Digital Imaging and Communications in Medicine (DICOM), Part 14: Grayscale Standard Display Function, Vol. PS 3.14; National Electrical Manufacturers Association: Washington, DC, USA, 2001. [Google Scholar]
- Badano, A.; Revie, C.; Casertano, A.; Cheng, W.C.; Green, P.; Kimpe, T.; Krupinski, E.; Sisson, C.; Skrøvseth, S.; Treanor, D. Consistency and Standardization of Color in Medical Imaging: A Consensus Report. J. Dig. Imag. 2015, 28, 41–52. [Google Scholar] [CrossRef]
- International Color Consortium. Visualization of Medical Content on Color Display Systems. White Paper #44. April 2016, Revised October 2023. Available online: https://color.org/whitepapers/ICC_White_Paper44_Visualization_of_colour_on_medical_displays-v2.pdf (accessed on 20 January 2025).
- Zhang, Z.; Shang, X.; Li, G.; Wang, G. Just Noticeable Difference Model for Images with Color Sensitivity. Sensors 2023, 23, 2634. [Google Scholar] [CrossRef]
- Xue, Z.; Antani, S.; Long, L.R.; Demner-Fushman, D.; Thoma, G.R. Window Classification of Brain CT Images in Biomedical Articles. AMIA Annu. Symp. Proc. 2012, 2012, 1023–1029. [Google Scholar]
- International Telecommunication Union. ITU-R Recommendation BT.709. Available online: https://www.itu.int/rec/R-REC-BT.709-6-201506-I/en (accessed on 20 January 2025).
- Yarlagadda, R.; Hershey, J.E. Signal Processing, General. In Encyclopedia of Physical Science and Technology, 3rd ed.; Meyers, R.A., Ed.; Academic Press: Cambridge, MA, USA, 2003; pp. 761–779. [Google Scholar]
- Erickson, B.J.; Korfiatis, P.; Akkus, Z.; Kline, T.L. Machine Learning for Medical Imaging. Radiographics 2017, 37, 505–515. [Google Scholar] [CrossRef]
- DenOtter, T.D.; Schubert, J. Hounsfield Unit. 2023 Mar 6. In StatPearls [Internet]; StatPearls Publishing: Treasure Island, FL, USA, 2024. [Google Scholar] [PubMed]
- Mishra, D.; Ghimire, R.K.; Chand, R.B.; Thapa, N.; Panta, O.B. Evaluation of Hounsfield Unit in adult brain structures by CT. J. Inst. Med. 2016, 38, 70–75. [Google Scholar] [CrossRef]
- Samala, R.K.; Drukker, K.; Shukla-Dave, A.; Chan, H.P.; Sahiner, B.; Petrick, N.; Greenspan, H.; Mahmood, U.; Summers, R.M.; Tourassi, G.; et al. AI and machine learning in medical imaging: Key points from development to translation. BJR/Artif. Intell. 2024, 1, ubae006. [Google Scholar] [CrossRef] [PubMed]
- Mall, P.K.; Singh, P.K.; Srivastav, S.; Narayan, V.; Paprzycki, M.; Jaworska, T.; Ganzha, M. A comprehensive review of deep neural networks for medical image processing: Recent developments and future opportunities. Healthc. Anal. 2023, 4, 100216. [Google Scholar] [CrossRef]
- Liu, Z.; Lin, Y.; Cao, Y.; Hu, H.; Wei, Y.; Zhang, Z.; Lin, S.; Guo, B. Swin Transformer: Hierarchical Vision Transformer using Shifted Windows. In Proceedings of the 2021 IEEE/CVF International Conference on Computer Vision (ICCV), Montreal, QC, Canada, 10–17 October 2021; pp. 9992–10002. [Google Scholar] [CrossRef]


Disclaimer/Publisher’s Note: The statements, opinions and data contained in all publications are solely those of the individual author(s) and contributor(s) and not of MDPI and/or the editor(s). MDPI and/or the editor(s) disclaim responsibility for any injury to people or property resulting from any ideas, methods, instructions or products referred to in the content. |
© 2025 by the authors. Licensee MDPI, Basel, Switzerland. This article is an open access article distributed under the terms and conditions of the Creative Commons Attribution (CC BY) license (https://creativecommons.org/licenses/by/4.0/).