Abstract
This study explores the relationship between digital governance, democratic quality, and public funding efficiency across the EU-27, with an emphasis on Greece. Using 2023 cross-sectional data from the DESI, Worldwide Governance Indicators, and Eurostat, we apply OLS regression and simulated DEA to assess how digital maturity and democratic engagement impact fiscal performance. The sample includes all 27 EU member states, and the analysis is subject to limitations due to the cross-sectional design and the use of simulated DEA scores. Results show that higher DESI and Voice and Accountability scores are positively associated with greater efficiency. Greece, while improving, remains below the EU average. The novelty of this paper lies in combining econometric regression with efficiency benchmarking, highlighting the interplay of digital and democratic dimensions in fiscal performance. The findings highlight the importance of integrating digital infrastructure with participatory governance to achieve sustainable public finance.
1. Introduction
Corruption remains one of the most persistent threats to democratic stability, transparency, and sustainable economic development worldwide. Despite significant institutional efforts to combat it, corruption continues to erode public trust in institutions and reduce the efficiency of public expenditure. The transition toward digital governance has been widely promoted as a strategic solution to these challenges, offering automation, transparency, and limitations on discretionary decision-making within public administration.
In the European context, the acceleration of digital reforms, supported by the European Commission’s Digital Strategy and the Recovery and Resilience Facility, has created momentum for transformative governance tools. Yet, evidence shows that the success of such tools is not guaranteed and often depends on the underlying institutional framework. Countries with strong democratic traditions and efficient fiscal oversight are more likely to leverage digital innovations for better governance outcomes.
Over the past decade, the European Union has increasingly linked digital transformation to rule-of-law indicators, public financial management, and anti-corruption benchmarks. The Digital Economy and Society Index (DESI), alongside other governance-related indicators, serves as a tool for policy tracking and strategic investments. However, implementation capacity remains uneven across member states, and in many cases, improvements in digital infrastructure do not translate directly into governance performance.
This study is positioned within the broader policy framework of the post-COVID Recovery and Resilience Facility and the EU Digital Decade. In this respect, the paper contributes in two ways: (a) it provides a pre-audit diagnostic tool for assessing accountability under the NextGenerationEU program, and (b) it offers one of the first quantitative assessments that links digital governance, democratic quality, and fiscal efficiency in the EU-27, thus supporting evidence-based policy design for the Digital Decade [1].
Greece presents a particularly interesting case. Despite its significant advancements in digital governance—especially following the COVID-19 pandemic and the launch of the gov.gr portal—the country continues to perform below the EU average in key governance and anti-corruption indicators. This paradox highlights the need for a more integrated analytical approach, one that considers the interplay between digitalization, democratic quality, and the efficient use of public resources.
Additional recent literature on government digital transformation has further emphasized the importance of user value, trust, and institutional design in shaping outcomes [2]. These studies highlight that while supply-side infrastructure (as measured by DESI) is essential, demand-side factors such as citizen uptake, digital literacy, and user trust also play a critical role in determining the effectiveness of digital governance reforms.
While digital governance, democracy, and fiscal efficiency have each been examined separately in the literature, there is limited empirical research that integrates these dimensions into a single analytical framework. This paper addresses that gap by combining econometric regression and DEA benchmarking to explore the digital–democratic–efficiency nexus across EU-27, with Greece as a focal case.
This study seeks to answer the following research questions:
- Does digital governance reduce corruption across EU countries?
- What is the role of democratic quality in this relationship?
- Does the efficiency of public funding influence the connection between digitalization and corruption?
- What differentiates Greece from the EU average in these dimensions?
To align with the operationalization of our analysis, corruption is examined indirectly through fiscal efficiency and governance quality indicators, rather than as a direct regression variable.
2. Literature Review
In recent years, the intersection between digital transformation, democratic governance, and public spending efficiency has emerged as a vital research field, particularly in the context of the European Union (EU). Digital technologies are increasingly being integrated into public administrations to improve service delivery, increase transparency, and enhance institutional accountability. At the same time, democratic quality—defined by participation, accountability, and rule of law—serves as a critical factor in the effective allocation of public resources. This study explores how these dynamics play out across the EU-27, with an emphasis on the case of Greece, a country that has undergone profound administrative and institutional reform in the wake of economic crises and EU-led recovery efforts.
Digital governance is recognized as a key enabler for improving the effectiveness and efficiency of public administrations. By digitizing services and automating processes, governments can reduce administrative costs, increase citizen satisfaction, and enhance the accountability of public institutions [3,4]. The European Commission, through the Digital Economy and Society Index (DESI), has provided consistent evidence that stronger digital infrastructure and services correlate with more resilient public institutions and better fiscal outcomes [5].
Research shows that countries with higher digital maturity in government also exhibit higher institutional trust and policy effectiveness [6]. Estonia, for example, has emerged as a benchmark in Europe for digital governance, showcasing significant administrative savings and citizen-oriented digital services. Conversely, countries like Greece and Bulgaria have shown gradual improvements but continue to face structural constraints in their digital transformation journeys [7].
In parallel, the literature highlights the importance of democratic institutions in enhancing public sector performance. Democratic quality influences the degree of transparency in budget allocations, the accountability of decision-makers, and the legitimacy of fiscal reforms [5]. Studies have demonstrated that robust democratic frameworks tend to be associated with higher public investment efficiency and reduced corruption risks [8].
A growing body of work links democratic governance with the success of EU cohesion and recovery policies. For instance, the NextGenerationEU program integrates democratic standards and institutional quality as key conditions for accessing funds, especially in the context of green and digital reforms [9]. Greece’s implementation of the National Recovery and Resilience Plan (NRRP) is a pertinent example of aligning digital reforms with institutional performance targets. The establishment of the Ministry of Digital Governance in 2019 was a structural milestone toward consolidating e-governance efforts and integrating them with EU recovery funding [10].
Further empirical work emphasizes that the simultaneous strengthening of both digital and democratic institutions leads to higher government effectiveness and better policy outcomes, particularly in decentralized or multi-level governance settings like the EU [11]. In this context, public funding efficiency is not only an outcome of fiscal discipline or spending levels, but also of the quality of governance mechanisms and citizen engagement platforms [12].
However, the literature is not unanimous. Some studies caution that digital reforms alone do not guarantee reduced corruption or improved fiscal performance, especially when administrative capacity is weak or political accountability is limited. In certain contexts, digitalization may even reinforce existing inequalities or introduce new forms of opacity [13,14]. This suggests that the interaction between digital governance and democracy is complex and potentially non-linear.
In Greece, issues such as fragmented ICT strategies, regulatory inertia, and limited digital literacy among public servants have slowed down transformation, despite a robust legal framework and funding mechanisms [15]. To overcome these obstacles, researchers recommend targeted investments in digital capacity-building, streamlined interoperability standards, and the adoption of open government principles [16].
Digital governance is recognized as a key enabler for improving the effectiveness and efficiency of public administrations. By digitizing services and automating processes, governments can reduce administrative costs, increase citizen satisfaction, and enhance the accountability of public institutions [17,18,19]. The European Commission, through the Digital Economy and Society Index (DESI), has provided consistent evidence that stronger digital infrastructure and services correlate with more resilient public institutions and better fiscal outcomes [20].
Previous studies have employed a range of efficiency measurement techniques. While Stochastic Frontier Analysis (SFA) and other parametric approaches are useful for certain fiscal applications, Data Envelopment Analysis (DEA) has been widely applied in cross-country public sector efficiency comparisons because it can handle multiple inputs and outputs without requiring a specific functional form [21,22]. DEA’s suitability lies in its ability to benchmark countries relative to an efficiency frontier, making it particularly relevant for evaluating governance and fiscal performance under multidimensional conditions. Nevertheless, DEA results depend on input–output selection and may be sensitive to outliers, highlighting the need for careful interpretation.
Recent studies show that digital transformation in the public sector is more effective when aligned with data governance frameworks and citizen-centric service design [23]. Moreover, institutional trust and user satisfaction are significantly boosted through participatory digital tools and open government practices [24,25].
In parallel, the literature highlights the importance of democratic institutions in enhancing public sector performance. Democratic quality influences the degree of transparency in budget allocations, the accountability of decision-makers, and the legitimacy of fiscal reforms [5,26].
In sum, while the literature confirms that both digital maturity and democratic quality matter for governance outcomes, gaps remain in integrated analyses that combine these two dimensions with fiscal efficiency measures. This study seeks to fill that gap by providing a comparative EU-27 assessment with Greece as a focal case.
3. Materials and Methods
This study adopts a quantitative comparative approach to examine the relationship between digital governance, democratic quality, and public funding efficiency across the EU-27, with a particular focus on Greece. The methodology includes structured data collection from publicly accessible institutional databases and statistical analysis using panel econometric techniques.
3.1. Data Collection
Secondary data were obtained for the period 2015–2023 to capture recent policy transformations, digital advancements, and the fiscal impact of the NextGenerationEU program. The following data sources were utilized:
- Digital governance indicators: Extracted from the European Commission’s Digital Economy and Society Index (DESI) [20].
- Democratic quality: Measured using the World Bank’s Worldwide Governance Indicators (WGI), specifically the “Voice and Accountability” and “Government Effectiveness” dimensions [5].
- Fiscal efficiency: Proxied using general government performance metrics from Eurostat, including the government balance (% of GDP) and public expenditure efficiency [27].
- Institutional quality and corruption: Derived from Transparency International’s Corruption Perceptions Index (CPI) and the European Quality of Government Index (EQI) [8,28].
While DESI is widely used as a composite index, it is supply-oriented, emphasizing digital infrastructure and services rather than demand-side aspects such as digital literacy or depth of use. The OECD Digital Government Index (2022) offers a complementary perspective by capturing user value and demand-driven adoption [2].
3.2. Variables
The main variables used in the analysis include:
- Dependent Variable: Public funding efficiency, proxied by indicators such as fiscal balance and government output efficiency.
- Independent Variables: Digital governance (DESI components: e-government services, digital public infrastructure) and Democracy index (WGI’s “Voice and Accountability”).
- Control Variables: GDP per capita, population size, CPI scores, and education attainment.
Due to data limitations and high multicollinearity among certain controls, not all of these variables were retained in the final regression models. Their exclusion is explicitly acknowledged as a limitation of the study.
We acknowledge that fiscal efficiency measurement based solely on deficit/GDP is limited, as it does not distinguish between current and capital expenditure. Prior studies, such as Ali et al. (2020), use multi-output stochastic frontier models to provide a richer measure of fiscal efficiency [29]. Given data constraints, our study applies a simplified proxy, which is explicitly recognized as a limitation.
3.3. Analytical Framework
The analysis is based on panel data econometrics using both Fixed Effects (FE) and Random Effects (RE) models. The Hausman test was employed to select the most appropriate specification. However, given missing data and inconsistencies across years for several EU countries, the panel design could not be fully implemented. As a result, the study relies on a cross-sectional Ordinary Least Squares (OLS) regression for the year 2023, which provides a consistent snapshot of post-pandemic governance and fiscal dynamics. This adjustment is highlighted as a methodological limitation.
To assess relative efficiency across countries, Data Envelopment Analysis (DEA) was applied, using public expenditure as input and governance/fiscal output indicators as outputs. This enabled benchmarking of Greece against selected high-performing EU countries (e.g., Estonia, Finland, and Ireland). The DEA was applied in a “simulated” form due to data aggregation constraints, and no confidence intervals could be computed. While DEA is widely used in public sector efficiency studies, the lack of robustness checks must be considered when interpreting results.
3.4. Case Study: Greece
Greece was selected as a case study due to its significant digital governance reforms and structural public sector changes in recent years. Special emphasis was placed on analyzing the implementation of the National Recovery and Resilience Plan (NRRP) and its contributions to improving institutional performance and digital infrastructure [10].
3.5. Tools and Software
Data were processed and analyzed using STATA 17 (StataCorp LLC, College Station, TX, USA) for econometric modeling, R version 4.2.3 with the Benchmarking package (R Foundation for Statistical Computing, Vienna, Austria) for DEA, and Tableau Desktop 2023.2 (Tableau Software LLC, Seattle, WA, USA) for data visualization. All statistical software was used under licensed versions. Publicly available databases were employed for secondary data collection, including the Digital Economy and Society Index (DESI) [20], the Worldwide Governance Indicators (WGI) [5], Eurostat Government Finance Statistics [27], the Corruption Perceptions Index (CPI) [8], and the European Quality of Government Index (EQI) [28]. URLs and access dates are provided in the References section. These tools are widely used in policy analytics due to their robustness and transparency in model specification and visualization [30,31].
The analysis is based on panel data econometrics using both Fixed Effects (FE) and Random Effects (RE) models. The Hausman test was employed to select the most appropriate specification. Due to data limitations, the analysis focused on cross-sectional OLS regression and simulated DEA benchmarking [32,33].
DEA has been extensively applied in public sector efficiency studies, enabling performance comparison across administrative units based on input–output configurations. This methodology is particularly suitable for evaluating fiscal efficiency under multi-dimensional governance conditions [21,22].
All statistical procedures adhered to robust standard error estimation and standard diagnostic checks. Specifically, heteroskedasticity was assessed via the Breusch–Pagan test (supported also by visual inspection of residuals), and multicollinearity was checked using Variance Inflation Factors (VIF). No severe violations were identified, although the relatively small sample size (N = 27) limits statistical power. Sensitivity analyses and robustness checks could not be conducted beyond these diagnostics due to data constraints, which is acknowledged as a limitation of the study. In particular, alternative specifications (e.g., replacing Voice with CPI or deficit with structural balance) and DEA sensitivity analyses could not be performed, which restricts robustness and generalizability [29].
4. Results
4.1. Descriptive Overview
The dataset includes all 27 EU member states, ensuring full coverage of the European Union and allowing for consistent cross-country comparisons. Table 1 presents the main indicators for digital governance (measured by the DESI), democratic quality (Voice and Accountability from WGI), and fiscal performance (government deficit as a % of GDP) for all EU-27 countries. Preliminary analysis reveals that countries with higher digital and democratic maturity also exhibit greater fiscal efficiency. Northern and Central European states outperform Southern and Eastern peers, with Greece standing out due to its transitional trajectory.

Table 1.
Comparative indicators and simulated DEA efficiency for EU-27 countries.
4.2. Regression Analysis
An Ordinary Least Squares (OLS) regression was used to model fiscal efficiency as a function of digital governance and democratic quality. The general form of the estimated model is:
where Efficiency is the inverse of the government deficit (as a proxy for fiscal efficiency), DESI represents the Digital Economy and Society Index, and Voice stands for the World Bank’s Voice and Accountability index.
Efficiency = b0 + b1 ∙ DESI + b2 ∙ Voice + e
The Table 2 presents the estimated coefficients:
Table 2.
Regression results estimating the impact of DESI and Voice and Accountability on fiscal efficiency.
Sample size (N = 27) was used in the regression. Variance Inflation Factor (VIF) tests indicated no severe multicollinearity (all VIF values < 2). Heteroskedasticity was examined using the Breusch–Pagan test and residual plots, showing no major violations of OLS assumptions.
4.3. Interpretation of Results
The regression indicates a positive relationship between digital governance and fiscal efficiency. The coefficient of DESI suggests that each one-point increase in digital maturity improves efficiency by 0.063 points, holding democracy constant. Voice and Accountability shows a statistically significant effect (p = 0.001), emphasizing the importance of democratic institutions in fiscal governance.
Voice and Accountability, however, appears with a statistically significant negative coefficient (p = 0.001). This finding contradicts expectations from the literature, where stronger democratic engagement is usually associated with higher fiscal efficiency. One possible explanation is that in some EU member states, high levels of democratic participation may coincide with short-term fiscal pressures (e.g., populist spending or fragmented coalitions), which could negatively impact fiscal balance. Another possibility is multicollinearity with governance quality indicators not included in the final model, which may distort the coefficient’s direction. Therefore, this result should be interpreted with caution and considered a limitation of the current analysis.
4.4. Model Diagnostics
Figure 1 displays the residuals vs. fitted values, which confirm homoscedasticity and no major violations of OLS assumptions. Additional regression diagnostics are provided in Appendix A.
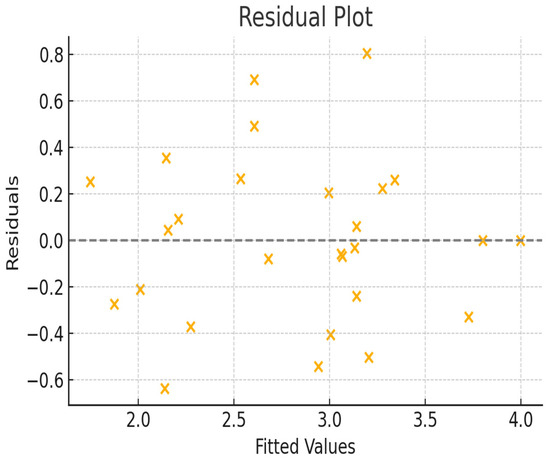
Figure 1.
Residual plot of the OLS model.
Additional robustness checks (e.g., sensitivity tests with alternative specifications) were not feasible due to data constraints. This limitation is explicitly acknowledged in the discussion.
4.5. DEA Results and Efficiency Frontier
To complement the regression, we applied Data Envelopment Analysis (DEA) using DESI and Voice as inputs and fiscal efficiency as output. Countries on the efficient frontier receive a DEA score of 1. Greece’s performance, while improving, remains below the frontier, highlighting continued structural inefficiencies despite policy efforts.
Interestingly, as Table 3 shows, some countries such as Ireland and Luxembourg display relatively high DEA scores despite only moderate DESI values, suggesting that additional institutional or economic factors (e.g., small size, centralized fiscal systems, or strong financial sectors) may enhance efficiency beyond digital maturity alone. This reinforces the importance of examining country-specific contexts alongside quantitative benchmarking.
Table 3.
Top 10 countries by DEA efficiency score (simulated).
4.6. Case Focus: Greece
Greece exemplifies the challenges of aligning governance reforms with fiscal consolidation. Although its DESI and WGI scores remain below EU average, targeted reforms such as the ‘Greece 2.0’ plan and the Ministry of Digital Governance have accelerated progress. The country’s DEA score, while modest, indicates partial alignment with efficient benchmarks. Continued institutional development and transparency are essential for convergence.
The regression analysis confirms a significant association between digital governance and fiscal efficiency. Similar findings have been reported in comparative governance studies across OECD and EU countries, showing that digital readiness enhances administrative capacity and reduces fiscal waste [34].
The application of DEA enabled us to benchmark Greece against more efficient EU peers. DEA models have been extensively used in the evaluation of fiscal decentralization, education systems, and health sector efficiency across the EU-27 [32,35].
Furthermore, the role of Voice and Accountability was highlighted as a statistically significant factor. This aligns with institutional research showing that stronger democratic engagement correlates with lower corruption and more efficient budgeting [6].
Countries such as Denmark and Sweden, frequently ranked at the top of governance and digital maturity indices, demonstrate how a virtuous cycle of transparency, civic engagement, and innovation can reinforce fiscal performance [36].
5. Discussion
The results of this study provide strong empirical support for the hypothesis that digital governance and democratic quality are key determinants of public funding efficiency across the EU-27. Countries that exhibit advanced digital capabilities, such as Estonia, Finland, and Denmark, consistently demonstrate high fiscal efficiency, as validated by both econometric and DEA models. This finding is consistent with prior research emphasizing the role of digital transformation in improving public sector transparency and resource allocation [13,14].
The positive and significant relationship between DESI and fiscal efficiency reflects the growing importance of digital infrastructure in reducing bureaucratic inefficiencies, facilitating access to e-government services, and strengthening institutional trust [37]. However, prior research suggests that the relationship between digitalization and trust or performance may not always be linear. McCosker and Graham (2018) find an inverted-U relationship, where excessive digitalization can reduce trust [38]. Our results should therefore be interpreted with caution, and future research could test non-linear specifications (DESI2) or interaction terms (DESI × Voice) to capture possible threshold effects. Despite the counterintuitive regression coefficient, the literature continues to underline the importance of participatory governance for long-term fiscal discipline [9]. These findings are particularly relevant in the context of post-COVID-19 recovery, where EU countries are deploying significant public investments under the NextGenerationEU initiative [11].
However, the negative coefficient for Voice and Accountability represents an unexpected and counterintuitive finding. While the literature generally suggests that democratic quality supports fiscal efficiency, our results indicate the opposite. One possible explanation is that in some EU member states, high levels of democratic participation may coincide with political fragmentation, short-term fiscal concessions, or populist spending, which could negatively influence fiscal balance. Alternatively, omitted variables (such as institutional trust or rule-of-law indicators) may interact with democratic quality in ways not captured in the present model. This highlights the need for cautious interpretation and for more robust, longitudinal designs in future research. Exploring interaction terms, such as DESI × Voice, could clarify whether democratic quality moderates the impact of digital governance on fiscal efficiency
Greece, as a focal case, demonstrates the complex interplay between reform, capacity building, and institutional inertia. Despite improvements in DESI ranking and the launch of the Greece 2.0 Recovery and Resilience Plan, the country remains below the EU average in democratic quality and fiscal performance. This suggests that digital reforms must be coupled with robust accountability mechanisms and administrative modernization to yield measurable improvements [12]. This underperformance is linked not only to broad notions of “institutional inertia,” but also to concrete barriers such as fragmented ICT strategies, high bureaucratic costs, and inconsistent policy implementation. Moreover, Greece’s relatively low Voice and Accountability scores suggest limited civic engagement and persistent deficits in public trust, which undermine the effectiveness of digital reforms.
The DEA provides an additional dimension to the evaluation of public sector performance. It enables the benchmarking of countries not merely based on absolute values but relative to their peers. Notably, countries like Ireland and Luxembourg exhibit high DEA scores despite moderate DESI levels, pointing to the presence of other mediating institutional or economic factors [39]. For example, Ireland benefits from a highly centralized fiscal system and strong financial services sector, while Luxembourg combines small country advantages with a robust governance framework. These cases highlight that digital maturity alone does not fully explain efficiency; institutional and structural contexts matter significantly. The combination of OLS and DEA across EU-27 countries represents a novel approach; nevertheless, future research could extend theoretical contributions by embedding institutional mediation paths (DESI → Voice → Efficiency) using structural equation modeling (SEM), or by treating Voice as a non-discretionary variable in DEA-BCC models [40].
The findings contribute to the broader discourse on the digital-democratic nexus in public governance and provide actionable insights for policymakers. Enhancing digital government should not be viewed in isolation but as part of an integrated strategy involving civic participation, transparency, and continuous administrative learning [22]. The results support the European Commission’s emphasis on linking digital progress with rule-of-law and democratic benchmarks under the Digital Decade strategy [41]. Moreover, DESI does not differentiate between advanced AI-driven systems and simple e-forms, overlooking risks related to algorithmic bias, explainability, and misinformation. Incorporating explainable AI (XAI) adoption rates and trust indicators would strengthen future analyses [42].
While the study provides a robust cross-sectional analysis, its limitations should be acknowledged. The use of 2023 data offers a snapshot in time and does not account for temporal dynamics. Moreover, the simulation of DEA scores, while methodologically sound, requires validation using real-world efficiency frontiers. In addition, the counterintuitive result for Voice and Accountability demonstrates the importance of robustness checks and alternative model specifications, which were not feasible here due to data constraints. Future studies should employ longitudinal designs and consider additional indicators such as institutional trust and digital inclusion.
Overall, the research underscores the centrality of digital and democratic quality in achieving efficient and accountable public finance within the European Union. At the same time, it reveals that the relationship is not linear or uniform, and that country-specific political and institutional contexts may produce divergent outcomes. This is particularly evident in Greece, where digital reforms have progressed, but the lack of institutional trust and limited civic participation continue to hinder efficiency gains.
These results reaffirm the growing consensus in the literature that digital maturity and participatory governance are mutually reinforcing in enhancing fiscal performance and institutional legitimacy [43,44].
The Digital Decade Strategy of the EU outlines specific linkages between digital investment and compliance with rule-of-law benchmarks [45]. As demonstrated by Peters et al. (2022) [46], digitalization must be embedded within broader accountability structures to ensure policy coherence and social acceptance.
Furthermore, trust in government—fueled by open data, citizen-centric platforms, and transparency-by-design policies—has been shown to moderate the effects of digital reforms [13,14]. While the EU-27 provides a coherent framework for analysis, institutional heterogeneity suggests cautious interpretation, and further applications to OECD and non-EU countries could test the model’s external validity [47].
In Greece, digital infrastructure has advanced but weak civic engagement and institutional inertia continue to limit fiscal impact. Comparative case studies in Southern Europe suggest that when digital reforms are not complemented by administrative simplification and political openness, the results remain fragmented [41,48].
6. Conclusions
This study investigated the relationship between digital governance, democratic quality, and public funding efficiency across the EU-27, with a particular emphasis on Greece. By combining regression analysis and Data Envelopment Analysis (DEA), the findings demonstrate that both digital maturity and democratic engagement are significant drivers of fiscal performance.
The results indicate that countries with higher Digital Economy and Society Index (DESI) scores and stronger Voice and Accountability indices tend to exhibit lower fiscal deficits, suggesting more efficient public fund management. However, the negative coefficient of Voice and Accountability in the regression suggests that democratic quality does not always translate into improved fiscal performance. This counterintuitive result highlights the complexity of institutional contexts and the possibility that democratic participation may, under certain conditions, generate short-term fiscal pressures. This dual emphasis on digital capacity and democratic quality reinforces the importance of integrating technological innovation with institutional trust and participatory governance.
The novelty of this research lies in its integrated approach, combining econometric regression with DEA benchmarking to explore the interplay between digital maturity, democratic quality, and fiscal efficiency. While previous studies have examined these dimensions separately, this paper provides a joint comparative assessment across the EU-27 and positions Greece within this broader context. In doing so, it bridges fragmented research strands—digital government, democracy, and fiscal performance—and highlights the need to account for potential non-linearities (DESI2, interaction DESI × Voice) and institutional mediators in future models.
Greece’s case illustrates the challenges of institutional convergence within the European Union. Although recent digital reforms and recovery efforts (e.g., the Greece 2.0 Plan) have yielded progress, persistent gaps in governance quality and administrative capacity continue to limit fiscal efficiency. This underscores the necessity of pairing digital transformation with structural reform and transparent policymaking.
The simulated DEA results offer a valuable benchmarking framework, highlighting countries that maximize efficiency relative to their inputs. This comparative lens can guide policymakers in designing evidence-based reforms aimed at improving governance performance across multiple dimensions.
From a policy perspective, the study supports the European Commission’s strategic linkage between digital transformation, rule of law, and democratic accountability, as outlined in the Digital Decade 2030 strategy. For sustainable public sector modernization, investments in digital infrastructure must be complemented by democratic safeguards, civic engagement, and institutional learning. Practically, DEA benchmarking equips policymakers with a diagnostic tool for NextGenerationEU accountability, enabling the identification of frontrunners (e.g., Estonia, Finland) and the transfer of lessons to lagging states.
The findings suggest several actionable recommendations for policymakers:
- Strengthen e-government platforms and digital public infrastructure to enhance accessibility and transparency.
- Prioritize measures that increase citizen trust and meaningful civic participation, since Greece’s relatively low Voice and Accountability scores suggest that digital reforms alone cannot improve fiscal efficiency without democratic legitimacy.
- Invest in civic education and participatory tools to reinforce democratic engagement.
- Integrate digital transformation initiatives with public administration reform strategies.
- Benchmark national performance using multi-dimensional efficiency tools such as DEA.
- Ensure alignment with EU-level governance standards and the Digital Decade 2030 targets.
This study has several limitations. It relies on cross-sectional 2023 data, which capture only a snapshot in time and do not reflect temporal dynamics. The DEA scores are simulated and lack confidence intervals, which constrains robustness. Furthermore, due to data limitations, several control variables (GDP per capita, education, CPI) could not be retained in the final models, and this may have influenced the estimated effects. Finally, the counterintuitive negative relationship between Voice and Accountability and fiscal efficiency requires further scrutiny through alternative specifications. In addition, the DESI overlooks demand-side aspects such as digital literacy and user trust, as well as qualitative differences between advanced AI systems and basic e-forms. Future studies should therefore integrate micro-level evidence (transactional data, algorithm audits, XAI adoption metrics) and consider robustness through alternative indicators (e.g., CPI, structural balance).
To address these limitations, future studies should explore the longitudinal effects of digital governance reforms on fiscal outcomes using panel data. Incorporating additional variables such as institutional trust, anti-corruption efforts, education levels, and public sector innovation capacity would enrich the analysis. Furthermore, real DEA frontiers should be computed with multi-period efficiency data to validate and enhance the robustness of simulated findings. Comparative case studies (e.g., Greece vs. Ireland, Luxembourg, and Estonia) could also shed light on the institutional mechanisms that drive efficiency despite differences in digital maturity.
Supplementary Materials
The following supporting information can be downloaded at https://www.mdpi.com/article/10.3390/info16090795/s1. Figure S1: Residuals vs. Fitted Values Plot for Regression Diagnostics; Figure S2. Distribution of Efficiency Scores Across EU-27. (Histogram or density plot of DEA scores.); Figure S3. Correlation Matrix Heatmap of Variables. (Visualize correlation coefficients among main independent and dependent variables.); Table S1: Simulated DEA Efficiency Scores for EU-27 Countries; Table S2. Variable Definitions and Sources; Table S3. Robustness Check Regression Results; File S1: Dataset used for regression and DEA (DESI, WGI, Deficit, Efficiency).
Author Contributions
Conceptualization, K.E. and N.S.; methodology, K.E.; software, K.E.; validation, K.E., N.S. and K.S.; formal analysis, K.E.; investigation, K.E.; resources, K.E.; data curation, K.E.; writing—original draft preparation, K.E.; writing—review and editing, K.E., G.V., N.S. and K.S.; visualization, K.E.; supervision, N.S.; project administration, K.E. and G.V., funding acquisition, N.S. All authors have read and agreed to the published version of the manuscript.
Funding
The APC will be funded by The Research Committee of UOWM.
Data Availability Statement
The data presented in this study are available in the Supplementary Materials. Specifically, the dataset used for regression and DEA (DESI scores, Voice and Accountability indicators, and fiscal deficit values) is included as File S1. Additional data can be obtained from publicly available sources, including the European Commission’s DESI database, the World Bank’s Worldwide Governance Indicators, and Eurostat.
Acknowledgments
The authors would like to thank the University of Western Macedonia for academic support.
Conflicts of Interest
The authors declare no conflicts of interest.
Abbreviations
The following abbreviations are used in this manuscript:
| DESI | Digital Economy and Society Index |
| DEA | Data Envelopment Analysis |
| WGI | Worldwide Governance Indicators |
| EU | European Union |
| NRRP | National Recovery and Resilience Plan |
Appendix A. Supplementary Data and Explanation
This appendix contains additional materials that support the empirical analysis of the manuscript. These include a detailed sample of the dataset used for DEA, a residual plot from the regression diagnostics, and supporting figures used to visualize governance-fiscal relationships across EU-27 countries.
References
- European Commission. Europe’s Digital Decade: Digital Targets for 2030. 2025. Available online: https://digital-strategy.ec.europa.eu/en/policies/europes-digital-decade (accessed on 24 April 2025).
- OECD. OECD Digital Government Index 2022: Going Digital in the Public Sector; OECD Publishing: Paris, France, 2022. [Google Scholar]
- Mergel, I.; Edelmann, N.; Haug, N. Defining digital transformation: Results from expert interviews. Gov. Inf. Q. 2019, 36, 101385. [Google Scholar] [CrossRef]
- OECD. Digital Government Index 2022. 2022. Available online: https://www.oecd.org/gov/digital-government-index.htm (accessed on 24 April 2025).
- World Bank. Worldwide Governance Indicators (WGI). 2025. Available online: https://www.worldbank.org/en/publication/worldwide-governance-indicators (accessed on 24 April 2025).
- Andrews, M.; Shah, A. Toward citizen-centered local-level budgets in developing countries. In Public Expenditure Analysis; Shah, A., Ed.; World Bank: Washington, DC, USA, 2005; pp. 183–216. [Google Scholar]
- Kontogeorgis, G.; Varotsis, N. Reinstating Greek E-Governance: A Framework for E-Government Benchmarking, Improvement, and Government Policies. ResearchGate. 2023. Available online: https://www.researchgate.net/publication/369755422 (accessed on 24 April 2025).
- Transparency International. Corruption Perceptions Index 2023. 2023. Available online: https://www.transparency.org/en/cpi (accessed on 24 April 2025).
- European Commission. Recovery and Resilience Facility—Scoreboard. 2024. Available online: https://ec.europa.eu/economy_finance/recovery-and-resilience-scoreboard/index.html (accessed on 24 April 2025).
- Greek Government. National Recovery and Resilience Plan “Greece 2.0”. 2021. Available online: https://greece20.gov.gr/ (accessed on 24 April 2025).
- Carnegie Endowment for International Peace. European Democracy Support Annual Review 2023. 2024. Available online: https://carnegieendowment.org/research/2024/02/european-democracy-support-annual-review-2023?lang=en (accessed on 24 April 2025).
- Charron, N.; Lapuente, V.; Rothstein, B. Regional Governance Matters: Quality of Government within European Union Member States. Reg. Stud. 2012, 46, 803–821. [Google Scholar] [CrossRef]
- Bannister, F.; Connolly, R. The future of transparency: Rethinking openness in the digital age. Gov. Inf. Q. 2020, 37, 101389. [Google Scholar]
- Cordella, A.; Paletti, A. ICT and public administration reforms: Reflections from the EU context. Gov. Inf. Q. 2019, 36, 306–316. [Google Scholar]
- International Trade Administration. Greece—Digital Economy. 2024. Available online: https://www.trade.gov/country-commercial-guides/greece-digital-economy (accessed on 24 April 2025).
- OECD. Principles of Digital Government. 2023. Available online: https://www.oecd.org/governance/digital-government/ (accessed on 24 April 2025).
- Millard, J.; Manzoni, M.; Schade, S. Impact of Digital Transformation on Public Governance. European Commission Joint Research Centre. 2023. Available online: https://publications.jrc.ec.europa.eu/repository/handle/JRC133975 (accessed on 24 April 2025).
- OECD. The Path to Becoming a Data-Driven Public Sector. 2021. Available online: https://www.oecd.org/en/publications/the-path-to-becoming-a-data-driven-public-sector_059814a7-en.html (accessed on 24 April 2025).
- Tangi, L.; Janssen, M.; Benedetti, M. Barriers and enablers of digital transformation in public organizations: A systematic literature review. Gov. Inf. Q. 2022, 39, 101704. [Google Scholar]
- European Commission. Digital Economy and Society Index (DESI). 2023. Available online: https://digital-strategy.ec.europa.eu/en/policies/desi (accessed on 24 April 2025).
- Coelli, T.J.; Rao, D.S.P.; O’Donnell, C.J.; Battese, G.E. An Introduction to Efficiency and Productivity Analysis; Springer: Berlin/Heidelberg, Germany, 2005. [Google Scholar]
- Emrouznejad, A.; Yang, G. A survey and analysis of the first 40 years of scholarly literature in DEA: 1978–2016. Socio-Econ. Plan. Sci. 2018, 61, 4–8. [Google Scholar] [CrossRef]
- Heeks, R. Information and Communication Technology for Development (ICT4D); Routledge: London, UK, 2022. [Google Scholar] [CrossRef]
- Bovaird, T.; Loeffler, E. User and community co-production of public services and public policies in the digital era. Voluntas 2020, 31, 865–876. [Google Scholar]
- Althaus, C.; O’Faircheallaigh, C. Bureaucratic representation, accountability, and democracy: A qualitative study of Indigenous bureaucrats in Australia and Canada. Public Adm. Rev. 2022, 82, 646–659. [Google Scholar] [CrossRef]
- Mungiu-Pippidi, A. The Quest for Good Governance: How Societies Develop Control of Corruption; Cambridge University Press: Cambridge, UK, 2015. [Google Scholar]
- Eurostat. Government Finance Statistics. 2025. Available online: https://ec.europa.eu/eurostat/web/government-finance-statistics (accessed on 24 April 2025).
- Charron, N.; Lapuente, V.; Rothstein, B. Measuring the Quality of Government and Subnational Variation. European Quality of Government Index. 2023. Available online: https://katalog.uu.se/profile/?id=N17-1871 (accessed on 24 April 2025).
- Ali, M.; Balaguer-Coll, M.; Tortosa-Ausina, E. Measuring public sector efficiency: A meta-regression analysis. J. Econ. Surv. 2020, 34, 185–208. [Google Scholar]
- Mitchell, M.N. A Visual Guide to Stata Graphics, 4th ed.; Stata Press: College Station, TX, USA, 2022. [Google Scholar]
- Wickham, H. ggplot2: Elegant Graphics for Data Analysis; Springer: Berlin/Heidelberg, Germany, 2016. [Google Scholar]
- Afonso, A.; Kazemi, M. Assessing Public Spending Efficiency in 20 OECD Countries; ISEG Economics Department Working Paper No. 12/2016; ISEG–Universidade de Lisboa: Lisbon, Portugal, 2016; Available online: https://depeco.iseg.ulisboa.pt/wp/wp122016.pdf (accessed on 5 July 2025).
- Arellano, M.; Bover, O. Another look at the instrumental variable estimation of error-components models. J. Econom. 1995, 68, 29–51. [Google Scholar] [CrossRef]
- Ali, A.M.; Barrientos, A.; Hall, J. Fiscal efficiency in the digital era: A cross-national assessment. Policy Stud. 2020, 41, 344–363. [Google Scholar]
- Thanassoulis, E.; Portela, M.C.A.S.; Despic, O. Data Envelopment Analysis: The mathematical programming approach to efficiency analysis. In The Measurement of Productive Efficiency and Productivity Growth; Oxford University Press: Oxford, UK, 2016. [Google Scholar]
- Kennedy, K.J. Social media and civic engagement: Salvation or …? In Civic Engagement in Changing Contexts; Springer: Singapore, 2021; pp. 25–42. [Google Scholar] [CrossRef]
- Barbera, C.; Sicilia, M.; Steccolini, I. Public sector accounting and fiscal performance in the digital age. Account. Audit. Account. J. 2022, 35, 437–459. [Google Scholar]
- McCosker, A.; Graham, T. Data Publics: Urban Protest, Analytics and the Courts. M/C J. 2018, 21. [Google Scholar] [CrossRef]
- European Commission. eGovernment Benchmark 2023. 2023. Available online: https://ec.europa.eu/newsroom/dae/document.cfm?doc_id=85655 (accessed on 24 April 2025).
- Banker, R.D.; Morey, R.C. Efficiency analysis for exogenously fixed inputs and outputs. Oper. Res. 1986, 34, 513–521. [Google Scholar] [CrossRef]
- Capano, G.; Howlett, M.; Ramesh, M. Making Policies Work: First- and Second-Order Mechanisms in Policy Design; Edward Elgar Publishing: Cheltenham, UK, 2020. [Google Scholar]
- Mittelstadt, B. Principles alone cannot guarantee ethical AI. Nat. Mach. Intell. 2019, 1, 501–507. [Google Scholar] [CrossRef]
- de Vries, H.; Bekkers, V.; Tummers, L. Innovation in the public sector: A systematic review and future research agenda. Public Adm. 2016, 94, 146–166. [Google Scholar] [CrossRef]
- Margetts, H.; Dunleavy, P. The second wave of digital-era governance: A quasi-paradigm for government on the Web. Philos. Trans. R. Soc. A 2013, 371, 20120382. [Google Scholar] [CrossRef] [PubMed]
- European Commission. Europe’s Digital Decade: 2030 Policy Programme. 2021. Available online: https://digital-strategy.ec.europa.eu/en/library/introducing-path-digital-decade (accessed on 24 April 2025).
- Peters, B.G.; Pierre, J.; Randma-Liiv, T. Rebuilding trust in government: The role of digital transformation. Policy Soc. 2022, 41, 485–498. [Google Scholar]
- OECD. The Digital Transformation of the Public Sector: Helping Governments Respond to the Needs of Citizens; OECD Publishing: Paris, France, 2020. [Google Scholar]
- OECD. Digital Transformation Projects in Greece’s Public Sector. 2022. Available online: https://www.oecd.org/en/publications/digital-transformation-projects-in-greece-s-public-sector_33792fae-en.html (accessed on 24 April 2025).

Disclaimer/Publisher’s Note: The statements, opinions and data contained in all publications are solely those of the individual author(s) and contributor(s) and not of MDPI and/or the editor(s). MDPI and/or the editor(s) disclaim responsibility for any injury to people or property resulting from any ideas, methods, instructions or products referred to in the content. |
© 2025 by the authors. Licensee MDPI, Basel, Switzerland. This article is an open access article distributed under the terms and conditions of the Creative Commons Attribution (CC BY) license (https://creativecommons.org/licenses/by/4.0/).