Abstract
Attaining sustainable development goals is a complex process that involves a range of economic, social, and environmental factors. It requires investments in infrastructure, technology, and human capital. In this case, green finance is conducive to channel investments toward sustainable projects and initiatives by providing incentives for environmentally friendly practices and technologies and by encouraging companies and investors to adopt sustainable business models. This paper aims to check the spatial spillover effect of green finance on attaining sustainable development for European Union (EU) countries for 2008–2021. The study applies the spatial Durbin model to explore the research hypothesis. The findings confirm that green finance promotes the achievement of sustainable development goals. However, the impact of green finance on attaining sustainable development is heterogeneous depending on the EU region. In this case, the EU should intensify its green finance policy considering the regional features that significantly affect the achievement of sustainable development goals by reducing greenhouse gas emissions, improving energy efficiency, and promoting renewable energy. In addition, it is necessary to develop alternative financial sources involving green bonds that could be used to fund green projects on renewable energy projects, green building construction, etc.
1. Introduction
In an era defined by escalating environmental concerns and an imperative to reshape traditional economic paradigms, the concept of sustainable development has ascended to the forefront of global discourse [1,2,3]. Encompassing the harmonization of economic prosperity, social equity, and ecological integrity, the pursuit of sustainable development stands as a linchpin for steering societies toward a balanced and resilient future [4]. Amid this pivotal transformation, scholars [5,6,7] underline that the role of finance emerges as a paramount driver, wielding the potential to either perpetuate unsustainable practices or propel a transition to more regenerative and inclusive models [8,9].
Green finance, with its distinctive emphasis on aligning financial activities with ecological imperatives, emerges as a pivotal mechanism within this evolutionary landscape. Defined by its capacity to channel capital toward projects that yield both economic returns and positive environmental outcomes, green finance embodies a catalytic force capable of reshaping industries [10,11,12,13], fostering innovation [14,15,16,17], and steering economies toward sustainable trajectories [18,19,20,21,22,23,24]. At its core, green finance transcends the realms of mere fiscal transactions, transcending into a dynamic conduit for progress that marries economic aspirations with planetary well-being [25,26,27].
Considering official reports and indices such as the United Nations Sustainable Development Goals Index [28] and the European Sustainable Development Report [29], EU countries have different levels of success in attaining sustainable development goals (SDGs). The effectiveness of EU countries in attaining SDGs is based on a range of factors, including economic development, policy implementation, social initiatives, and environmental efforts. According to official reports [28,29], Nordic countries (Sweden, Denmark, Finland, Norway) have comprehensive social welfare systems, high levels of gender equality, quality education, and strong environmental policies. They tend to perform well across multiple SDGs, particularly those related to clean energy, gender equality, quality education, and climate action [28,29]. Germany advances renewable energy policies, robust healthcare systems, strong environmental regulations, and contributions to international development efforts. It typically performs well in goals related to clean energy, industry innovation, quality education, and decent work and economic growth [28,29]. The Netherlands is recognized for its efficient public transportation, sustainable urban planning, and water management practices. It excels in SDGs related to clean water and sanitation, sustainable cities and communities, and climate action [28,29]. Austria has high-quality healthcare and education systems, as well as efforts to promote renewable energy and environmental conservation. It performs well in goals related to good health and well-being, quality education, and clean energy [28,29]. Estonia has made strides in digital innovation, e-governance, and connectivity. It performs well in SDGs related to innovation and industry, sustainable cities, and quality education [28,29]. In this case, it is useful to analyze the spillover effects of green finance, revealing the interconnectedness of regional progress among EU countries and providing actionable insights for effective policymaking, cross-border collaboration, and targeted sustainable development strategies. The core aim of this paper is to investigate the spatial spillover consequences of green finance in the pursuit of sustainable development across EU countries. The paper’s originality and contribution to the theoretical landscape of sustainable development bridges the theoretical gap between green finance and sustainable development by exploring how the spatial distribution of green finance initiatives impacts the overall progress toward sustainability within the EU.
The paper has the following structure: Section 2—highlighting the intersection of green finance and sustainable development while exploring the existing research on spatial spillover effects; Section 3—outlining the analytical framework employed, detailing the application of the spatial Durbin model to investigate the research hypothesis; Section 4—explaining the empirical findings, offering insights into the spatial dynamics of green finance’s impact on sustainable development across various EU regions; Section 5 and Section 6—underlining the core results of the investigation, comparison analysis of the obtained results with the previous investigations, and exploring the policy implication for extending green finance for attaining SDGs, the study’s limitations, and further direction for investigation.
2. Literature Review
The interplay between green finance and the attainment of sustainable development goals (SDGs) within European Union (EU) countries has garnered significant attention in recent years. Rasoulinezhad and Taghizadeh-Hesary [30] confirm the link between green finance, green energy consumption, and energy efficiency using Granger tests and the STIRPAT framework for green leaders from 2002 to 2018. They reveal that green bonds aid green energy deployment and reduce CO2 emissions in the long term. Similar conclusions were obtained by Ahmed et al. [31] for ASEAN countries. Rasoulinezhad and Taghizadeh-Hesary [30] outline the actuality of long-term support policies for green energy investment, increased green bond volume, and energy efficiency. Based on a survey questionnaire, Ronaldo and Suryanto [32] indicate that green finance significantly contributes to SDGs by promoting green technology innovation and green microenterprises, leading to enhanced environmental and economic sustainability. Huang et al. [33] investigate the influence of green finance on businesses’ green innovation toward SDGs in China. By employing a difference-in-difference methodology, the research demonstrates that green finance policies stimulate high-quality green innovation while discouraging low-quality attempts. This impact is more significant within specific industries and enterprise categories, fostering enhanced green productivity growth and enriching our understanding of the interplay between green finance, innovation, and SDGs [33]. However, based on the results of panel cointegration analysis, Zhang et al. [34] prove that green finance could provoke a decline in renewable energy growth in China. Mohanty et al. [35] and Du et al. [36], based on the results of the bibliometric analysis, show that green finance stimulates market businesses, notably propelling economic sustainability through the growth of the green industry, encompassing power generation, ecological sustainability, cleaner production, and renewable energy sectors. Bei and Wang [37] outline that green investment boosts the extension of renewable energy and, consequently, stimulates the attainment of SDGs. Based on the results of the cross-sectional ARDL technique, Jian and Afshan [38] confirm that green finance stimulates carbon neutrality in the short and long term. Prior studies [39,40] show that green investment promotes the SDGs via green projects and renewable energies. Past studies [41,42,43] outline that green finance promotes environmentally friendly practices and technology adoption, which in high-density regions lead to improved resource management, reduced emissions, and enhanced quality of life, aligning with SDG targets for clean energy, sustainable cities, and climate action. By strategically applying green finance in densely populated areas, communities drive positive impacts on their environment and social well-being, contributing to broader sustainability objectives [41,42,43]. Scholars [44,45,46] show that green finance’s ability to channel funds into eco-friendly projects leads to reduced energy consumption and alignment with SDGs such as clean energy and climate action. However, the studies [47,48,49] outline that green finance might divert resources from essential sectors, promote surface-level changes without addressing systemic issues, and even be prone to “greenwashing”, where initiatives appear environmentally friendly without substantial impact. It underscores the need for a balanced and holistic approach, considering both the potential benefits and possible limitations of using green finance to achieve SDGs related to energy consumption and sustainability [47,48,49]. Past studies [50,51] confirm that efficient governance enhances the allocation of resources and regulatory frameworks, fostering an environment conducive to green finance initiatives. This, in turn, accelerates progress toward SDGs related to environmental sustainability [52] and clean energy [50,51]. However, studies [53,54] outline that an overemphasis on government efficiency might sideline social and equity considerations, leading to an unequal distribution of benefits from green finance projects.
Using the spatial Durbin model, scholars [55] prove that green finance positively contributes to sustainable economic growth, while energy development also has a positive impact but with a negative spatial spillover effect. The interaction between green finance and energy development negatively affects economic growth, and green finance acts as a partial intermediary in enhancing sustainable economic growth via green energy development. Applying a spatial model, Cheng et al. [56] justify that green finance promotes green innovations by enhancing regional innovation capabilities in China. Scholars [57] show that green finance exerts a significant negative direct influence on carbon emissions. However, the observed impact of green finance on neighboring provinces through spillover effects appears to be negligible in China [57]. Huang et al. [51] demonstrate that green finance has a substantial negative impact on carbon emissions directly, while the influence of green finance on neighboring provinces through spillover effects seems to be minor. Using Malmquist Data Envelopment Analysis (DEA) and spatial Durbin models, the study [58] evaluates energy consumption efficiency and green finance’s spatial impact. DEA allows for assessing the productivity change or efficiency change of a set of decision-making units (DMUs) over time, typically in the context of firms or organizations. It measures how the efficiency of these DMUs evolve from one period to another by comparing their performance in two different time periods. The key idea behind Malmquist DEA is to evaluate whether there has been a change in productivity or efficiency between two time periods. Findings [58] reveal green finance’s negative influence on energy consumption. The conjunction of green finance policy and digital economic development amplifies this effect, while negative spatial links enhance energy control, especially in populous areas [58]. However, scholars [59] use a spatial dynamic panel model to show that green finance reduces carbon emissions and has a significant spatial spillover effect, lowering emissions locally and in nearby areas.
Considering the abovementioned, the study checks the following hypothesis:
Hypothesis 1.
Green finance has a spatial spillover effect on attaining sustainable development for European Union (EU) countries.
3. Materials and Methods
3.1. Explanation of the Variables
The scope of this study encompasses 27 EU countries selected based on data availability. The research timeline spans from 2008 to 2021, capturing a comprehensive view of developments within this period.
Explained variable: The SDG index (SDG) developed by Sachs et al. [28] is selected as the explanatory variable, which provides a comprehensive assessment of a country’s progress toward achieving sustainable development across various economic, social, and environmental dimensions. The SDG index is measured on a scale that ranges from 0, indicating poorer performance, to 100, signifying optimal performance in terms of sustainable development.
The findings (Figure 1) of the spatial distribution of SDG within mean values allow the allocation of 4 clusters of countries. Countries in Clusters 1 and 2 need to focus on improving their performance and implementing targeted measures to address SDGs, while those in Clusters 3 and 4 can share best practices and continue their efforts to ensure a sustainable future.
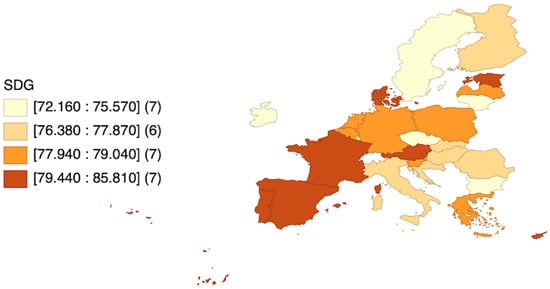
Figure 1.
Spatial distribution of SDG within mean values. Note: numbers in square brackets mean the thresholds for each cluster group within SDG’s mean values; numbers in round brackets—number of countries in each cluster.
Explanatory variable. Based on previous studies [60,61,62,63,64,65,66,67], the “Value of announced greenfield FDI projects” (GF) has been selected as an indicator of green finance. This indicator signifies investments directed toward new ventures and facilities that emphasize eco-friendly practices, technologies, and infrastructure. The rationale behind adopting this indicator is rooted in its potential to encapsulate a broad spectrum of green finance initiatives. These projects encompass a range of industries, from renewable energy ventures and sustainable infrastructure to innovative eco-conscious manufacturing.
Control explanatory variables encapsulate a spectrum of economic, social, and environmental dimensions that could potentially shape a country’s SDG performance. The range of possible control variables encompasses the following:
The gross domestic product (GDP) per capita of a country represents its economic output per individual. This variable helps control for the economic development level of a nation, which could have implications for both green finance activities and the pursuit of sustainable development goals. Countries with higher GDP per capita might be more equipped to allocate resources to green finance projects and implement sustainable practices, potentially influencing their SDG performance.
A country’s population density (PD), which measures the concentration of individuals within a given geographic area, offers insights into the demographic dynamics influencing sustainable development efforts. Varying population densities can lead to diverse challenges and opportunities related to resource allocation, infrastructure development, and the implementation of green finance strategies.
Government Efficiency (WGI): This control variable assesses the efficiency and transparency of a country’s government operations. Governments with higher efficiency might be more effective at implementing policies that support the adoption of green practices and contribute to the achievement of sustainable development goals (SDGs). The measurement of government efficiency is based on the World Governance Indicators (WGI) framework, which evaluates six key dimensions: Voice and Accountability, Political Stability and Absence of Violence/Terrorism, Government Effectiveness, Regulatory Quality, Rule of Law, and Control of Corruption. The WGI assessment scale ranges from −2.5 (indicating weaker governance performance) to 2.5 (indicating stronger governance performance).
Table 1 provides a comprehensive overview of the indicators and corresponding statistical descriptions utilized in this study.

Table 1.
Data, sources, and descriptive statistics.
3.2. Econometric Methodology
The spatial feature primarily encompasses individual spatial interactions, which involve aspects such as spatial autocorrelation and spatial heterogeneity. In the initial phase of employing the spatial panel model, conducting a spatial statistical analysis using the Moran index becomes essential. The Moran index, typically ranging between −1 and 1, provides a measure of spatial autocorrelation, indicating the degree to which similar values cluster together in space:
where Moran’s I measures the spatial autocorrelation; n—the number of observations in the dataset; W—the spatial relationships among regions; —the weight between country i and country j in the spatial weights matrix; —the values of SDG for countries i and j, respectively; and —the average value of SDG index in EU.
In the subsequent stage, the Wald test and the likelihood ratio (LR) test are employed to determine whether the spatial Durbin model (SDM) can be transformed into either a spatial lag model (SLM) or a spatial error model (SEM). The Wald test evaluates the significance of coefficients within the model and plays a key role in deciding whether particular variables warrant inclusion [70]. Through a comparison of the Wald statistic’s magnitude with critical values, a determination can be made regarding the integration of the spatial lag or spatial error term into the model, leading to a potential shift from SDM to either SLM or SEM. This assessment offers insights into whether the inclusion of lagged or error components more effectively captures spatial dependence. The likelihood ratio (LR) test, on the other hand, evaluates the overall fit of the model and aids in selecting the appropriate specification [71,72]. It compares the likelihood of the estimated models (SLM or SEM) against the SDM. If the LR statistic exceeds a certain threshold, it indicates that either SLM or SEM offers a better fit for the data, suggesting the need for the transformation.
Based on the research carried out by [71,72,73], the spatial Durbin model (SDM) functions as a comprehensive representation within the spatial panel model framework, incorporating both the spatial lag model (SLM) and the spatial error model (SEM). The notable characteristic of the spatial Durbin model resides not only in its capacity to reveal spatial spillover effects among neighboring countries concerning the dependent variable but also in its capability to investigate how independent variables in adjacent countries influence their respective dependent variables.
where SDG—SDG index of the EU countries; W—the spatial weight matrix; X—the n k data matrix of independent variables; —the spatially weighted regressors; —coefficients of spatial impacts; —spatial effect; —time effect; —the error term; i—country; t—time.
Based on the selected variables as described above, Equation (2) is reconfigured as follows:
All variables are expressed in logarithmic form to mitigate potential issues with heteroscedasticity.
4. Results
The Moran scatterplot facilitates the examination of the connection between a specific value and the mean value of that variable among neighboring entities. The results from the Moran’s I analysis (Figure 2) indicate that the majority of countries are situated within the first and second quadrants.
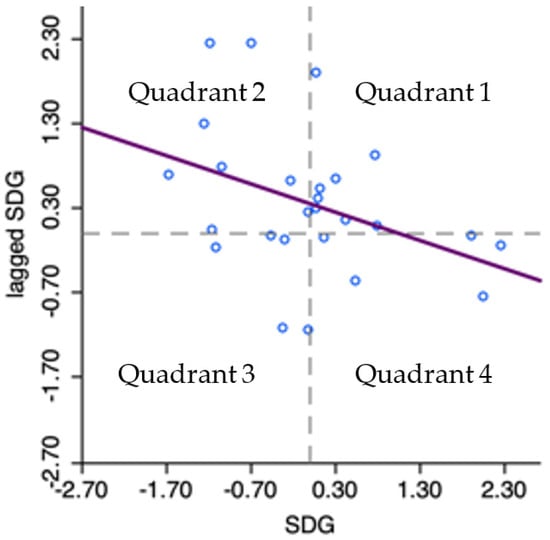
Figure 2.
Visualization of Moran’s I plot of SDGs.
The first quadrant contains countries with high SDG values that are surrounded by high SDG values: Estonia, Germany, the Netherlands, Chechia, Belgium, Poland, France, and Austria. The 2d cluster (countries with high SDG values are surrounded by countries with lower SDG values) contains Malta, Romania, Bulgaria, Cyprus, Luxemburg, Hungary, Spain, and Lithuania. The outcomes provide insights into the spatial distribution of SDG values, revealing a notable trend of cluster effects. This suggests that countries with comparable SDG values tend to aggregate together in geographically contiguous regions. This spatial clustering indicates the presence of shared characteristics or development patterns among neighboring countries, potentially pointing to regional factors influencing SDG achievements.
The findings reveal that the global Moran I index stands at 0.012 (with a z test value of 4.861), leading to the rejection of the initial assumption at a significance level of 5%. This observation underscores the existence of spatial autocorrelation in the performance of sustainable development goals (SDGs).
The results presented in Table 2 demonstrate that both the Wald and LR tests reject the hypothesis of SDM degeneration at a significance level of 1%. This implies that the SDM formulated in this paper is well founded.
Table 2.
Test for model selection.
The changes observed in the SDG index display heterogeneity, indicating significant variations across different countries. Additionally, SDGs demonstrate spatial interactions, highlighting the interdependence between neighboring regions. Table 3 presents the outcomes of the SDM regression estimations for the EU region.
Table 3.
Spatial panel regression results.
The log-likelihood is a measure of how well the model’s predictions align with the observed data. Lower values indicate better model fit. According to the outputs presented in Table 3, the SDM has the lowest log-likelihood, suggesting a better fit than OLS or SAR. Lower AIC (Akaike information criterion) values indicate a better balance between model fit and complexity. Similarly, the SDM has the lowest AIC, indicating that it might be the preferred model. Similar to AIC, BIC (Bayesian information criterion) is used for model selection, with lower values suggesting better model fit and parsimony. The SDM also has the lowest BIC.
The coefficient value of 0.004 indicates that when the value of announced greenfield foreign direct investment (FDI) projects increases by one unit, there is a corresponding increase of 0.004 in the SDG index. The low p value of 0.000 reflects the statistical significance of this relationship, suggesting that it is highly likely not due to chance. This observation implies that higher levels of greenfield FDI projects are closely associated with a positive impact on the SDG index, indicating a beneficial influence on sustainable development. Greenfield FDI projects refer to the establishment of new enterprises or ventures, often focusing on environmentally conscious practices and advanced technologies. The positive spatial interaction coefficient (W × GF) of 0.009 suggests that the presence of neighboring countries with high levels of greenfield FDI projects further amplifies this positive effect. In other words, countries situated near regions with robust greenfield FDI activities experience an even greater boost in their SDG index, potentially due to shared knowledge [74,75], cross-border collaborations, or regional synergy in sustainable development efforts.
The coefficient of 0.008 for the GDP per capita variable in the context of the SDG index reflects the potential influence of a country’s economic prosperity on its progress toward achieving sustainable development goals. Specifically, it suggests that a one-unit increase in GDP per capita is associated with an expected 0.008 unit increase in the SDG index. This implies that higher economic output per individual might lead to a higher SDG index, indicating a positive relationship between economic well-being and sustainable development outcomes. However, the p value of 0.089 exceeds the significance level of 0.05. This indicates that the relationship between GDP per capita and the SDG index may not be statistically significant, and the observed association could potentially have arisen by chance variation in the data. The GDP per capita measure might not comprehensively capture the economic well-being of a country. Other economic indicators, such as income distribution, inequality, and economic structure, might play a role in the relationship with SDG outcomes. Furthermore, the relationship between GDP per capita and SDGs might not be linear. There could be thresholds beyond which increases in GDP per capita have a more pronounced impact on SDG outcomes. Additionally, the impact of economic growth on sustainable development may have a time lag. Changes in GDP per capita might take some time to manifest in improved SDG outcomes.
The coefficient value of population density indicates that a one-unit increase in population density results in a 0.020 decrease in the SDG index. The low p value of 0.000 demonstrates that this relationship is statistically significant. This suggests that higher population density may be linked to lower SDG index values, possibly due to challenges related to resource allocation and environmental sustainability.
The significant positive relationship between government efficiency and the SDG index signifies that nations with more streamlined and transparent governance mechanisms are more likely to excel in achieving sustainable development objectives. Efficient governments can facilitate the implementation of sustainable practices, the allocation of resources toward eco-friendly initiatives, and the enforcement of regulations that mitigate environmental degradation. Moreover, transparent governance builds public trust, encourages citizen participation, and promotes accountability, thereby fostering an environment conducive to sustainable development efforts.
Table 4 demonstrates the assessment of the directions and magnitudes of effects arising from changes in the two explanatory variables through the utilization of summarized measures encompassing direct, indirect, and total impacts.
Table 4.
Spatial effect decomposition (direct, indirect, and total effects).
The results in Table 4 indicate that the direct impact of GF is both positive and significant, implying a favorable influence on SDGs. Moreover, the indirect effect of GF is also positive and statistically significant. This implies that the presence of high GF values in neighboring countries positively affects SDGs, aligning with intuitive expectations. The total effect stemming from GF is positive, largely attributed to its substantial indirect impact, signifying a significant GF spillover effect. Moreover, the coefficient estimates related to the variable GF, as presented in Table 3 (columns 4 and 5), closely align with the outcomes of the SDM model. The discrepancy between the coefficient estimate of 0.004 and the direct effect estimate of 0.005 in Table 4 (columns 2 and 3) amounts to 0.001. Given the minimal difference between the SDM coefficient and the direct impact estimate, it can be inferred that feedback effects are marginal and unlikely to hold substantial economic significance.
5. Discussion
The empirical results of the SDM confirm the hypothesis on the spillover effect of green finance on attaining sustainable development for EU countries for 2008–2021. Similar to past studies [30,31,32], the findings of this study’s significance (p value of 0.000) emphasize the role of green finance in promoting sustainable development among EU countries. The growth of green finance by one point leads to an increase in SDG by 0.004. The interaction terms in the SDM model confirm additional complexity. The statistically significant (p < 0.001) interaction term involving green finance (W × GF) underscores the intricate interplay between financial mechanisms and sustainable development outcomes. This suggests that the impact of green finance is not merely an isolated effect but rather is synergistically influenced by other governance-related factors. The interaction term accentuates that the combination of favorable financial practices with an enabling governance environment can produce amplified positive effects on SDG achievement. This finding resonates with prior studies [24,32,39] that have emphasized the importance of a holistic approach to sustainable development. Equally noteworthy, the statistically significant interaction term with the World Governance Indicator (W × WGI) emphasizes the pivotal role of effective governance in augmenting the benefits derived from green finance interventions. This implies that when governance practices coincide with proactive green financing strategies, the collective impact on advancing SDGs becomes notably pronounced [19,30,31]. This phenomenon underscores the importance of both financial innovation and governance reforms in fostering sustainable development synergies [12,23,24]. This finding is consistent with past studies [52,55,59,65], which have highlighted the symbiotic relationship between governance quality and sustainable development outcomes.
The identification of these significant interaction terms not only contributes to a more comprehensive understanding of the factors shaping SDGs but also offers actionable insights for policymakers and stakeholders. Leveraging the combined potential of green finance and improved governance practices emerges as a promising avenue for promoting more holistic and impactful advancements toward SDGs. This dynamic interaction underscores the interconnected nature of the factors that drive sustainable development and provides valuable guidance for crafting effective policies and strategies that pave the way for a more sustainable future.
6. Conclusions
The findings suggest that green finance plays a crucial role in attaining SDGs across EU countries. However, the impact of green finance on sustainable development varies based on the region within the EU. To effectively harness the potential of green finance for SDGs, policymakers should consider the following policy implications:
- Recognize the regional heterogeneity in the impact of green finance and design targeted strategies that address the unique needs and challenges of each EU region. This entails conducting thorough assessments of the local context, identifying the specific sectors with the greatest potential for green finance integration, and understanding the regulatory landscapes unique to each region. Policymakers should develop targeted strategies that align with the existing strengths of the region while mitigating the barriers that may hinder the adoption of green finance initiatives. For instance, regions with a robust renewable energy sector benefit from incentivizing investments in clean energy technologies. Meanwhile, areas grappling with high population density could explore innovative urban planning solutions, and sustainable transport projects enabled by green finance. Similarly, regions facing specific environmental challenges, such as water scarcity or biodiversity loss, could direct green finance toward projects that directly address these concerns.
- Encourage cross-border collaboration among EU regions to share best practices and experiences related to green finance. By fostering knowledge exchange [74,75], regions learn from successful initiatives, adapt them to their contexts, and collectively drive progress toward SDGs. This cross-regional learning process enables each region to adapt and customize successful initiatives to suit their specific circumstances and needs. By building upon proven models and avoiding the pitfalls experienced by others, regions save valuable time and resources in implementing green finance measures. Collaboration fosters a sense of collective responsibility and solidarity among EU regions, creating a cohesive front in the pursuit of sustainable development.
- Establish robust monitoring and evaluation mechanisms to measure the effectiveness of green finance interventions in different regions [76,77,78]. A well-designed monitoring and evaluation framework allows for the collection of quantitative and qualitative data that reflect the progress made in different regions. This information sheds light on the extent to which green finance interventions are contributing to SDGs, whether they are reducing carbon emissions, promoting renewable energy adoption, or enhancing environmental quality.
This study has certain limitations that need to be acknowledged and overcome in further investigations. First, while the paper examines the spatial spillover effect of green finance on attaining SDGs in EU countries, it might not encompass all the intricate dynamics and complexities involved in the process of achieving sustainable development. The multifaceted nature of sustainable development encompasses various socioeconomic and environmental dimensions that may not be fully captured within the spatial Durbin model framework. The study’s findings, which highlight the heterogeneity of the impact of green finance on sustainable development across EU regions, suggest the need for a deeper exploration of the underlying reasons for such variations. Factors such as regional policies, economic structures, and cultural differences could potentially contribute to this heterogeneity. Furthermore, it is necessary to enlarge the sample size and duration of study.
Author Contributions
Conceptualization, A.K., O.L. and T.P.; methodology, A.K., O.L. and T.P.; software, A.K., O.L. and T.P.; validation, A.K., O.L. and T.P.; formal analysis, A.K., O.L. and T.P.; investigation, A.K., O.L. and T.P.; resources, A.K., O.L. and T.P.; data curation, A.K., O.L. and T.P.; writing—original draft preparation, A.K., O.L. and T.P.; writing—review and editing, A.K., O.L. and T.P.; visualization, A.K., O.L. and T.P. All authors have read and agreed to the published version of the manuscript.
Funding
This research was funded by the Ministry of Education and Science of Ukraine, 0121U100468.
Data Availability Statement
Not applicable. The data sets are available at the open data bases Sachs et al. (2023), UNTCAD (2023), World Bank (2023).
Conflicts of Interest
The authors declare no conflict of interest.
References
- Kaul, S.; Akbulut, B.; Demaria, F.; Gerber, J.F. Alternatives to sustainable development: What can we learn from the pluriverse in practice? Sustain. Sci. 2022, 17, 1149–1158. [Google Scholar] [CrossRef] [PubMed]
- Mhlanga, D. The role of artificial intelligence and machine learning amid the COVID-19 pandemic: What lessons are we learning on 4IR and the sustainable development goals. Int. J. Environ. Res. Public Health 2022, 19, 1879. [Google Scholar] [CrossRef] [PubMed]
- Akkuş, Y.; Çalıyurt, K. The role of sustainable entrepreneurship in un sustainable development goals: The case of ted talks. Sustainability 2022, 14, 8035. [Google Scholar] [CrossRef]
- Pell, O. The ESG Triangle: How Lithium Mining in Latin America Could Point the Way Toward Long-Term Environmental and Social Value Strategies. In Critical Minerals, the Climate Crisis and the Tech Imperium; Springer Nature: Cham, Switzerland, 2023; pp. 179–201. [Google Scholar]
- Versal, N.; Sholoiko, A. Green bonds of supranational financial institutions: On the road to sustainable development. Invest. Manag. Financ. Innov. 2022, 19, 91–105. [Google Scholar] [CrossRef] [PubMed]
- Li, C.; Umair, M. Does green finance development goals affects renewable energy in China. Renew. Energy 2023, 203, 898–905. [Google Scholar] [CrossRef]
- Li, G.; Zhang, R.; Feng, S.; Wang, Y. Digital finance and sustainable development: Evidence from environmental inequality in China. Bus. Strategy Environ. 2022, 31, 3574–3594. [Google Scholar] [CrossRef]
- Lu, Q.; Farooq, M.U.; Ma, X.; Iram, R. Assessing the combining role of public–private investment as a green finance and renewable energy in carbon neutrality target. Renew. Energy 2022, 196, 1357–1365. [Google Scholar] [CrossRef]
- Debrah, C.; Chan, A.P.C.; Darko, A. Green finance gap in green buildings: A scoping review and future research needs. Build. Environ. 2022, 207, 108443. [Google Scholar] [CrossRef]
- Kwilinski, A.; Slatvitskaya, I.; Dugar, T.; Khodakivska, L.; Derevyanko, B. Main Effects of Mergers and Acquisitions in International Enterprise Activities. Int. J. Entrep. 2020, 24, 1–8. [Google Scholar]
- Dementyev, V.; Dalevska, N.; Kwilinski, A. Innovation and Information Aspects of the Structural Organization of the World Political and Economic Space. Virtual Econ. 2021, 4, 54–76. [Google Scholar] [CrossRef]
- Trushkina, N.; Abazov, R.; Rynkevych, N.; Bakhautdinova, G. Digital Transformation of Organizational Culture under Conditions of the Information Economy. Virtual Econ. 2020, 3, 7–38. [Google Scholar] [CrossRef] [PubMed]
- Melnychenko, O. Application of artificial intelligence in control systems of economic activity. Virtual Econ. 2019, 2, 30–40. [Google Scholar] [CrossRef] [PubMed]
- Trzeciak, M.; Kopec, T.P.; Kwilinski, A. Constructs of Project Programme Management Supporting Open Innovation at the Strategic Level of the Organization. J. Open Innov. Technol. Mark. Complex. 2022, 8, 58. [Google Scholar] [CrossRef]
- Letunovska, N.; Offei, F.A.; Junior, P.A.; Lyulyov, O.; Pimonenko, T.; Kwilinski, A. Green Supply Chain Management: The Effect of Procurement Sustainability on Reverse Logistics. Logistics 2023, 7, 47. [Google Scholar] [CrossRef]
- Miśkiewicz, R.; Matan, K.; Karnowski, J. The Role of Crypto Trading in the Economy, Renewable Energy Consumption and Ecological Degradation. Energies 2022, 15, 3805. [Google Scholar] [CrossRef]
- Trushkina, N. Development of the information economy under the conditions of global economic transformations: Features, factors and prospects. Virtual Econ. 2019, 2, 7–25. [Google Scholar] [CrossRef] [PubMed]
- Pudryk, D.; Kwilinski, A.; Lyulyov, O.; Pimonenko, T. Toward Achieving Sustainable Development: Interactions between Migration and Education. Forum Sci. Oeconomia 2023, 11, 113–132. [Google Scholar] [CrossRef]
- Chen, Y.; Lyulyov, O.; Pimonenko, T.; Kwilinski, A. Green development of the country: Role of macroeconomic stability. Energy Environ. 2023, 1–23. [Google Scholar] [CrossRef]
- Zhanibek, A.; Abazov, R.; Khazbulatov, A. Digital Transformation of a Country’s Image: The Case of the Astana International Finance Centre in Kazakhstan. Virtual Econ. 2022, 5, 71–94. [Google Scholar] [CrossRef]
- Chen, Y.; Kwilinski, A.; Chygryn, O.; Lyulyov, O.; Pimonenko, T. The Green Competitiveness of Enterprises: Justifying the Quality Criteria of Digital Marketing Communication Channels. Sustainability 2021, 13, 13679. [Google Scholar] [CrossRef]
- Stępień, S.; Smędzik-Ambroży, K.; Polcyn, J.; Kwiliński, A.; Maican, I. Are small farms sustainable and technologically smart? Evidence from Poland, Romania, and Lithuania. Cent. Eur. Econ. J. 2023, 10, 116–132. [Google Scholar] [CrossRef]
- Us, Y.; Pimonenko, T.; Lyulyov, O.; Chen, Y.; Tambovceva, T. Promoting Green Brand of University in Social Media: Text Mining and Sentiment Analysis. Virtual Econ. 2022, 5, 24–42. [Google Scholar] [CrossRef] [PubMed]
- Prokopenko, O.; Miśkiewicz, R. Perception of “green shipping” in the contemporary conditions. Entrep. Sustain. Issues 2020, 8, 269–284. [Google Scholar] [CrossRef] [PubMed]
- Letunovska, N.; Abazov, R.; Chen, Y. Framing a Regional Spatial Development Perspective: The Relation between Health and Regional Performance. Virtual Econ. 2022, 5, 87–99. [Google Scholar] [CrossRef] [PubMed]
- Arefieva, O.; Polous, O.; Arefiev, S.; Tytykalo, V.; Kwilinski, A. Managing sustainable development by human capital reproduction in the system of company`s organizational behavior. IOP Conf. Ser. Earth Environ. Sci. 2021, 628, 012039. [Google Scholar] [CrossRef]
- Dźwigoł, H. The Uncertainty Factor in the Market Economic System: The Microeconomic Aspect of Sustainable Development. Virtual Econ. 2021, 4, 98–117. [Google Scholar] [CrossRef]
- Sachs, J.D.; Lafortune, G.; Fuller, G.; Drumm, E. Implementing the SDG Stimulus. Sustainable Development Report 2023; SDSN: Paris, France; Dublin University Press: Dublin, Ireland, 2023. [Google Scholar] [CrossRef]
- Lafortune, G.; Fuller, G.; Bermont-Diaz, L.; Kloke-Lesch, A.; Koundouri, P.; Riccaboni, A. Achieving the SDGs: Europe’s Compass in a Multipolar World. Europe Sustainable Development Report 2022; SDSN and SDSN Europe: Paris, France, 2022. [Google Scholar]
- Rasoulinezhad, E.; Taghizadeh-Hesary, F. Role of green finance in improving energy efficiency and renewable energy development. Energy Effic. 2022, 15, 14. [Google Scholar] [CrossRef]
- Ahmed, N.; Areche, F.O.; Sheikh, A.A.; Lahiani, A. Green Finance and Green Energy Nexus in ASEAN Countries: A Bootstrap Panel Causality Test. Energies 2022, 15, 5068. [Google Scholar] [CrossRef]
- Ronaldo, R.; Suryanto, T. Green finance and sustainability development goals in Indonesian Fund Village. Resour. Policy 2022, 78, 102839. [Google Scholar] [CrossRef]
- Huang, H.; Mbanyele, W.; Wang, F.; Song, M.; Wang, Y. Climbing the quality ladder of green innovation: Does green finance matter? Technol. Forecast. Soc. Chang. 2022, 184, 122007. [Google Scholar] [CrossRef]
- Zhang, L.; Saydaliev, H.B.; Ma, X. Does green finance investment and technological innovation improve renewable energy efficiency and sustainable development goals. Renew. Energy 2022, 193, 991–1000. [Google Scholar] [CrossRef]
- Mohanty, S.; Nanda, S.S.; Soubhari, T.; Vishnu, N.S.; Biswal, S.; Patnaik, S. Emerging Research Trends in Green Finance: A Bibliometric Overview. J. Risk Financ. Manag. 2023, 16, 108. [Google Scholar] [CrossRef]
- Du, M.; Ruirui, Z.; Shanglei, C.; Qiang, L.; Ruixuan, S.; Wenjun, C. Can Green Finance Policies Stimulate Technological Innovation and Financial Performance? Evidence from Chinese Listed Green Enterprises. Sustainability 2022, 14, 9287. [Google Scholar] [CrossRef]
- Bei, J.; Wang, C. Renewable energy resources and sustainable development goals: Evidence based on green finance, clean energy and environmentally friendly investment. Resour. Policy 2023, 80, 103194. [Google Scholar] [CrossRef]
- Jian, X.; Afshan, S. Dynamic effect of green financing and green technology innovation on carbon neutrality in G10 countries: Fresh insights from CS-ARDL approach. Econ. Res.-Ekon. Istraživanja 2023, 36, 2130389. [Google Scholar] [CrossRef]
- Hasan, M.M.; Du, F. Nexus between green financial development, green technological innovation and environmental regulation in China. Renew. Energy 2023, 204, 218–228. [Google Scholar] [CrossRef]
- Li, J.; Dong, X.; Dong, K. How much does financial inclusion contribute to renewable energy growth? Ways to realize green finance in China. Renew. Energy 2022, 198, 760–771. [Google Scholar] [CrossRef]
- Zhang, H.; Geng, C.; Wei, J. Coordinated development between green finance and environmental performance in China: The spatial-temporal difference and driving factors. J. Clean. Prod. 2022, 346, 131150. [Google Scholar] [CrossRef]
- Lu, Y.; Gao, Y.; Zhang, Y.; Wang, J. Can the green finance policy force the green transformation of high-polluting enterprises? A quasinatural experiment based on “Green Credit Guidelines”. Energy Econ. 2022, 114, 106265. [Google Scholar] [CrossRef]
- Saleem, H.; Khan, M.B.; Mahdavian, S.M. The role of green growth, green financing, and eco-friendly technology in achieving environmental quality: Evidence from selected Asian economies. Environ. Sci. Pollut. Res. 2020, 29, 57720–57739. [Google Scholar] [CrossRef]
- Jiakui, C.; Abbas, J.; Najam, H.; Liu, J.; Abbas, J. Green technological innovation, green finance, and financial development and their role in green total factor productivity: Empirical insights from China. J. Clean. Prod. 2023, 382, 135131. [Google Scholar] [CrossRef]
- Sun, Y.; Gao, P.; Razzaq, A. How does fiscal decentralization lead to renewable energy transition and a sustainable environment? Evidence from highly decentralized economies. Renew. Energy 2023, 206, 1064–1074. [Google Scholar] [CrossRef]
- Alamgir, M.; Cheng, M.-C. Do Green Bonds Play a Role in Achieving Sustainability? Sustainability 2023, 15, 10177. [Google Scholar] [CrossRef]
- Sancak, I.E. Change management in sustainability transformation: A model for business organizations. J. Environ. Manag. 2023, 330, 117165. [Google Scholar] [CrossRef] [PubMed]
- Islam, S.; Hosseini, S.H.; McPhillips, K. The Transformative Capacities of the Sustainable Development Goals: A Comparison Between the Global Critical Literature and Key Development Actors’ Perceptions in Bangladesh. In The Palgrave Handbook of Global Social Change; Springer International Publishing: Cham, Switzerland, 2022; pp. 1–22. [Google Scholar]
- Hughes, S.S.; Velednitsky, S.; Green, A.A. Greenwashing in Palestine/Israel: Settler colonialism and environmental injustice in the age of climate catastrophe. Environ. Plan. E Nat. Space 2023, 6, 495–513. [Google Scholar] [CrossRef]
- Wang, X.; Elahi, E.; Khalid, Z. Do Green Finance Policies Foster Environmental, Social, and Governance Performance of Corporate? Int. J. Environ. Res. Public Health 2022, 19, 14920. [Google Scholar] [CrossRef] [PubMed]
- Huang, Y.; Chen, C.; Lei, L.; Zhang, Y. Impacts of green finance on green innovation: A spatial and nonlinear perspective. J. Clean. Prod. 2022, 365, 132548. [Google Scholar] [CrossRef]
- Kwilinski, A.; Lyulyov, O.; Pimonenko, T. Environmental Sustainability within Attaining Sustainable Development Goals: The Role of Digitalization and the Transport Sector. Sustainability 2023, 15, 11282. [Google Scholar] [CrossRef]
- Babajide, A.; Lawal, A.; Asaleye, A.; Okafor, T.; Osuma, G. Financial stability and entrepreneurship development in sub-Sahara Africa: Implications for sustainable development goals. Cogent Soc. Sci. 2020, 6, 1798330. [Google Scholar] [CrossRef]
- Fagbemi, F. COVID-19 and sustainable development goals (SDGs): An appraisal of the emanating effects in Nigeria. Res. Glob. 2021, 3, 100047. [Google Scholar] [CrossRef]
- Wang, R.; Wang, F. Exploring the Role of Green Finance and Energy Development toward High-Quality Economic Development: Application of Spatial Durbin Model and Intermediary Effect Model. Int. J. Environ. Res. Public Health 2022, 19, 8875. [Google Scholar] [CrossRef]
- Cheng, P.; Wang, X.; Choi, B.; Huan, X. Green Finance, International Technology Spillover and Green Technology Innovation: A New Perspective of Regional Innovation Capability. Sustainability 2023, 15, 1112. [Google Scholar] [CrossRef]
- Guo, C.Q.; Wang, X.; Cao, D.D.; Hou, Y.G. The impact of green finance on carbon emission--analysis based on mediation effect and spatial effect. Front. Environ. Sci. 2022, 10, 844988. [Google Scholar] [CrossRef]
- Huo, D.; Zhang, X.; Meng, S.; Wu, G.; Li, J.; Di, R. Green finance and energy efficiency: Dynamic study of the spatial externality of institutional support in a digital economy by using hidden Markov chain. Energy Econ. 2022, 116, 106431. [Google Scholar] [CrossRef]
- Chen, X.; Chen, Z. Can Green Finance Development Reduce Carbon Emissions? Empirical Evidence from 30 Chinese Provinces. Sustainability 2021, 13, 12137. [Google Scholar] [CrossRef]
- Mitchell, I.; Ritchie, E.; Tahmasebi, A. Is climate finance toward $100 billion “new and additional”. GCD Policy Pap. 2021, 205, 1–14. [Google Scholar]
- Mahat, T.J.; Bláha, L.; Uprety, B.; Bittner, M. Climate finance and green growth: Reconsidering climate-related institutions, investments, and priorities in Nepal. Environ. Sci. Eur. 2019, 31, 1–13. [Google Scholar] [CrossRef]
- Hussain, H.I.; Haseeb, M.; Kamarudin, F.; Dacko-Pikiewicz, Z.; Szczepańska-Woszczyna, K. The role of globalization, economic growth and natural resources on the ecological footprint in Thailand: Evidence from nonlinear causal estimations. Processes 2021, 9, 1103. [Google Scholar] [CrossRef]
- Szczepańska-Woszczyna, K.; Gedvilaitė, D.; Nazarko, J.; Stasiukynas, A.; Rubina, A. Assessment of Economic Convergence among Countries in the European Union. Technol. Econ. Dev. Econ. 2022, 28, 1572–1588. [Google Scholar] [CrossRef]
- Kharazishvili, Y.; Kwilinski, A. Methodology for Determining the Limit Values of National Security Indicators Using Artificial Intelligence Methods. Virtual Econ. 2022, 5, 7–26. [Google Scholar] [CrossRef]
- Moskalenko, B.; Lyulyov, O.; Pimonenko, T. The investment attractiveness of countries: Coupling between core dimensions. Forum Sci. Oeconomia 2022, 10, 153–172. [Google Scholar] [CrossRef]
- Karnowski, J.; Rzońca, A. Should Poland join the euro area? The challenge of the boom-bust cycle. Argum. Oeconomica 2023, 1, 227–262. [Google Scholar] [CrossRef]
- Savvidou, G.; Atteridge, A.; Omari-Motsumi, K.; Trisos, C.H. Quantifying international public finance for climate change adaptation in Africa. Clim. Policy 2021, 21, 1020–1036. [Google Scholar] [CrossRef]
- UNCTAD. World Investment Report. 2022. Available online: https://worldinvestmentreport.unctad.org (accessed on 10 December 2022).
- World Bank. Available online: https://data.worldbank.org (accessed on 14 April 2023).
- Mondal, S.; Kundu, D. Exact likelihood ratio and Wald tests for the balanced joint progressive censoring scheme. Appl. Stoch. Models Bus. Ind. 2022, 38, 1113–1126. [Google Scholar] [CrossRef]
- Ost, D.E. Interpretation and application of the likelihood ratio to clinical practice in thoracic oncology. J. Bronchol. Interv. Pulmonol. 2022, 29, 62–70. [Google Scholar] [CrossRef]
- Wang, B.X.; Hughes, V.; Foulkes, P. The effect of sampling variability on systems and individual speakers in likelihood ratio-based forensic voice comparison. Speech Commun. 2022, 138, 38–49. [Google Scholar] [CrossRef]
- LeSage, J.P.; Pace, R.K. The Biggest Myth in Spatial Econometrics. Econometrics 2014, 2, 217–249. [Google Scholar] [CrossRef]
- Dzwigol, H. Research Methodology in Management Science: Triangulation. Virtual Econ. 2022, 5, 78–93. [Google Scholar] [CrossRef]
- Szczepańska-Woszczyna, K.; Gatnar, S. Key Competences of Research and Development Project Managers in High Technology Sector. Forum Sci. Oeconomia 2022, 10, 107–130. [Google Scholar] [CrossRef]
- Dacko-Pikiewicz, Z. Building a family business brand in the context of the concept of stakeholder-oriented value. Forum Sci. Oeconomia 2019, 7, 37–51. [Google Scholar] [CrossRef]
- Miśkiewicz, R. Challenges facing management practice in the light of Industry 4.0: The example of Poland. Virtual Econ. 2019, 2, 37–47. [Google Scholar] [CrossRef] [PubMed]
- Karnowski, J.; Miśkiewicz, R. Climate Challenges and Financial Institutions: An Overview of the Polish Banking Sector’s Practices. Eur. Res. Stud. J. 2021, 24, 120–139. [Google Scholar] [CrossRef] [PubMed]
Disclaimer/Publisher’s Note: The statements, opinions and data contained in all publications are solely those of the individual author(s) and contributor(s) and not of MDPI and/or the editor(s). MDPI and/or the editor(s) disclaim responsibility for any injury to people or property resulting from any ideas, methods, instructions or products referred to in the content. |
© 2023 by the authors. Licensee MDPI, Basel, Switzerland. This article is an open access article distributed under the terms and conditions of the Creative Commons Attribution (CC BY) license (https://creativecommons.org/licenses/by/4.0/).