1. Introduction
Renewable energy plays a crucial role in meeting the growing need for sustainable and eco-friendly power solutions on a global scale. Notably, in the European Union (EU), the final energy consumption from renewable sources reached a substantial 23.0% share in 2022, according to stats [
1,
2]. To strengthen this commitment, EU Directive 2023/2413 sets a target of achieving a 45% share by 2030, with a particular emphasis on harnessing wind and solar energy resources [
3]. Within the broader spectrum of renewable sources, wind energy has emerged as a significant contributor, acknowledged for its role as one of the cleanest and readily available forms of power. In this context, airborne wind energy systems have been further developed to harvest winds at atmospheric levels beyond traditional wind turbines [
4].
Airborne Wind Energy Systems (AWESs) represent an emerging frontier in renewable energy innovation. These systems, distinguished by their capacity to capture high-altitude winds through aerial structures or tethered devices, represent a departure from conventional ground-based wind energy solutions. Their primary objective is to harness the more robust and consistent wind resources found at higher altitudes. Bechtle et al.’s study [
5] evaluates wind resources in the EU for 300, 1000, and 1500 m altitudes over seven years, revealing available power between 40 and 1600 W/m
2 with wind velocities ranging from 2.4 to 10.9 m/s.
AWESs are classified based on the position of the generator as Ground-Gen and Fly-Gen systems, or by types as drag-type or lift-type wind turbines [
4,
6]. In the Ground-Gen category, electricity generator alternator systems are positioned on the ground, whereas in the Fly-Gen category, the entire generator assembly is airborne, and the electricity generated is conveyed to the ground through tethered wires.
Drag-type airborne wind turbines utilize the drag force on their blades to extract energy from the wind. This type of turbine includes configurations such as the Savonius wind turbine, which is a vertical axis wind turbine (VAWT) with a drag-type design. Savonius turbines are notable for their self-starting nature thanks to their high torque at lower speeds. This feature makes them suitable for conditions with low wind speeds [
7]. However, despite high starting torque, Savonius turbines have lower efficiency compared to Darrieus turbines, which are typical lift-type airborne wind turbines [
8]. Lift-type turbines operate based on the lift force generated by their airfoil-shaped blades and are characterized by their vertical orientation that can harness wind energy from any direction without the need for a yaw mechanism.
In this context, AWESs offer several advantages over traditional ground-based wind turbines. Primarily, airborne systems can access higher altitudes where the wind is generally stronger and more consistent, leading to increased energy production [
4,
5]. This is supported by the fact that AWESs aim to harness wind energy beyond the altitude of traditional windmills in stronger and more steady winds using tethered wings [
9]. Furthermore, a substantial reduction in mass is provided compared to conventional wind turbines, potentially resulting in economic efficiencies [
10]. These advantages position AWESs as a promising technology for the future of wind energy generation.
Yet, AWESs face several key challenges and limitations in practical implementation compared to traditional wind turbines. Firstly, they rely on consistent and predictable wind patterns for optimal performance, making them less suitable for areas with highly unpredictable or intermittent winds. Additionally, AWESs require sophisticated tether management systems to ensure safe operation, as tether wear, entanglement, and breakage can pose significant operational risks. Moreover, altitude restrictions, airspace regulations, and aviation safety concerns limit the potential power generation capacity of AWESs. The complexity of control systems needed to manage airborne components, optimize power generation, and ensure stability adds another layer of challenge. AWES technology is still in its early stages of development, requiring further advancements, research, and testing to address key challenges and improve performance and reliability for widespread adoption.
Addressing the above-mentioned challenges requires targeted research efforts and innovative methodologies. Key research gaps include developing advanced control algorithms to optimize tethered flight paths and power generation efficiency. An improved understanding of aerodynamics and turbulence in high-altitude wind regimes is essential for designing robust and efficient AWES configurations. Advanced computational models and simulation tools can aid in predicting system behavior and optimizing design parameters. As technology advances, the performance of airborne wind turbines requires an extensive investigation and rigorous research effort to fully establish their feasibility and potential.
1.1. Literature Survey
The literature covers a range of research on AWES. A comprehensive review of AWESs, highlighting their various technologies, such as flying tethered wings or aircraft designed to access high-altitude winds, was provided by Cherubini et al. [
4]. Their study categorized prototypes developed by universities and companies worldwide based on system architecture, highlighting both proven hardware configurations and potential future implementations. Gerrie et al. [
11] presented recent experimental and computational results for three-bladed Darieus and three-bladed Savonius VAWTs. The computational results demonstrate a significant difference from the experimental results, with an order of magnitude discrepancy. Furthermore, the experimental power coefficient findings are notably low. The authors conclude that further experiments employing models representing changes in design parameters may be required as significant differences are observed between experimental results and simulations.
A number of other publications [
12,
13,
14,
15,
16,
17,
18,
19,
20,
21] have also focused on improving the performance of either Savonius, Daerius, or hybrid VAWTs using different approaches in design. However, it is important to note that while these turbines are practical for harnessing wind energy at low altitudes, the total energy produced is relatively low. The power coefficient for drag-type VAWT turbines ranges from 0.2 to 0.35. The area covered by the turbine is small, and the wind speed at low altitudes is very low (3–5 m/s at an altitude of 80 m). Scientists have conducted experiments and developed models at extremely high speeds, up to 12–14 m/s, to attract attention.
Noronha and Munishamaih [
22] developed and manufactured a prototype Horizontal Axis Airborne Wind Turbine (HAWT), in which a rotor is housed in a helium-filled enclosure and is also elevated by a spherical balloon. The prototype was tested under field conditions at a number of altitudes. The turbine produced 250 W at an average wind velocity of 6 m/s, with a power coefficient (Cp) of 0.25. The consistency between the experimental and computational results was evaluated in their study using the sliding mesh method in the numerical model (the mesh is stationary, and a superficial rotation effect is added to the rotor [
23]). The results were in agreement with the experimental results. Ali and Kim [
24] studied a detailed analysis of the power conversion performance of airborne wind turbines under unsteady loads. Their study utilized the computational fluid dynamics (CFD) analysis of a 2.51 m blade radius with a 6.5 tip speed ratio and 18 m/s wind speed for high-altitude offshore applications.
Several significant projects have been carried out regarding AWESs. One remarkable project application is the Buoyant Airborne Turbine (BAT) developed by Altaeros Energies, an MIT start-up [
25]. BAT proposes around twice the performance of ground-based wind turbines at altitudes around 600 m, where the expected wind power density rises to 1200 (W/m
2).
Another significant project is Omnidea’s LEMAP project [
26], based on the Magnus effect of the airborne rotor, which consists of a tethered cylindrical unit filled with helium gas. The Magnus effect enables the generation of lift and propulsion force through the rotation of bodies, such as cylinders or rotors, in a fluid medium. This phenomenon has been a subject of interest in designing and controlling airborne wind energy systems, particularly those utilizing the Magnus effect for harnessing wind power. A thorough recent review by Seifert [
27] explains the historical foundation and various applications of the Magnus effect. This effect has also been extensively studied and applied in the context of ship propulsion, particularly in the development of rotor ships such as Flettner’s Baden–Baden ship [
27,
28]. The computational studies of Gowree and Prince [
29] and Milutinović et al. [
30] are also noteworthy in this respect.
This study investigates the MAGENN Air Rotor System (MARS) project, a novel experimental drag-type vertical axis wind turbine (VAWT), and its performance assessment in various flat terrain conditions. Further analysis of our work was presented at ICCHMT 2023 [
31].
1.2. MAGENN Air Rotor System (MARS)
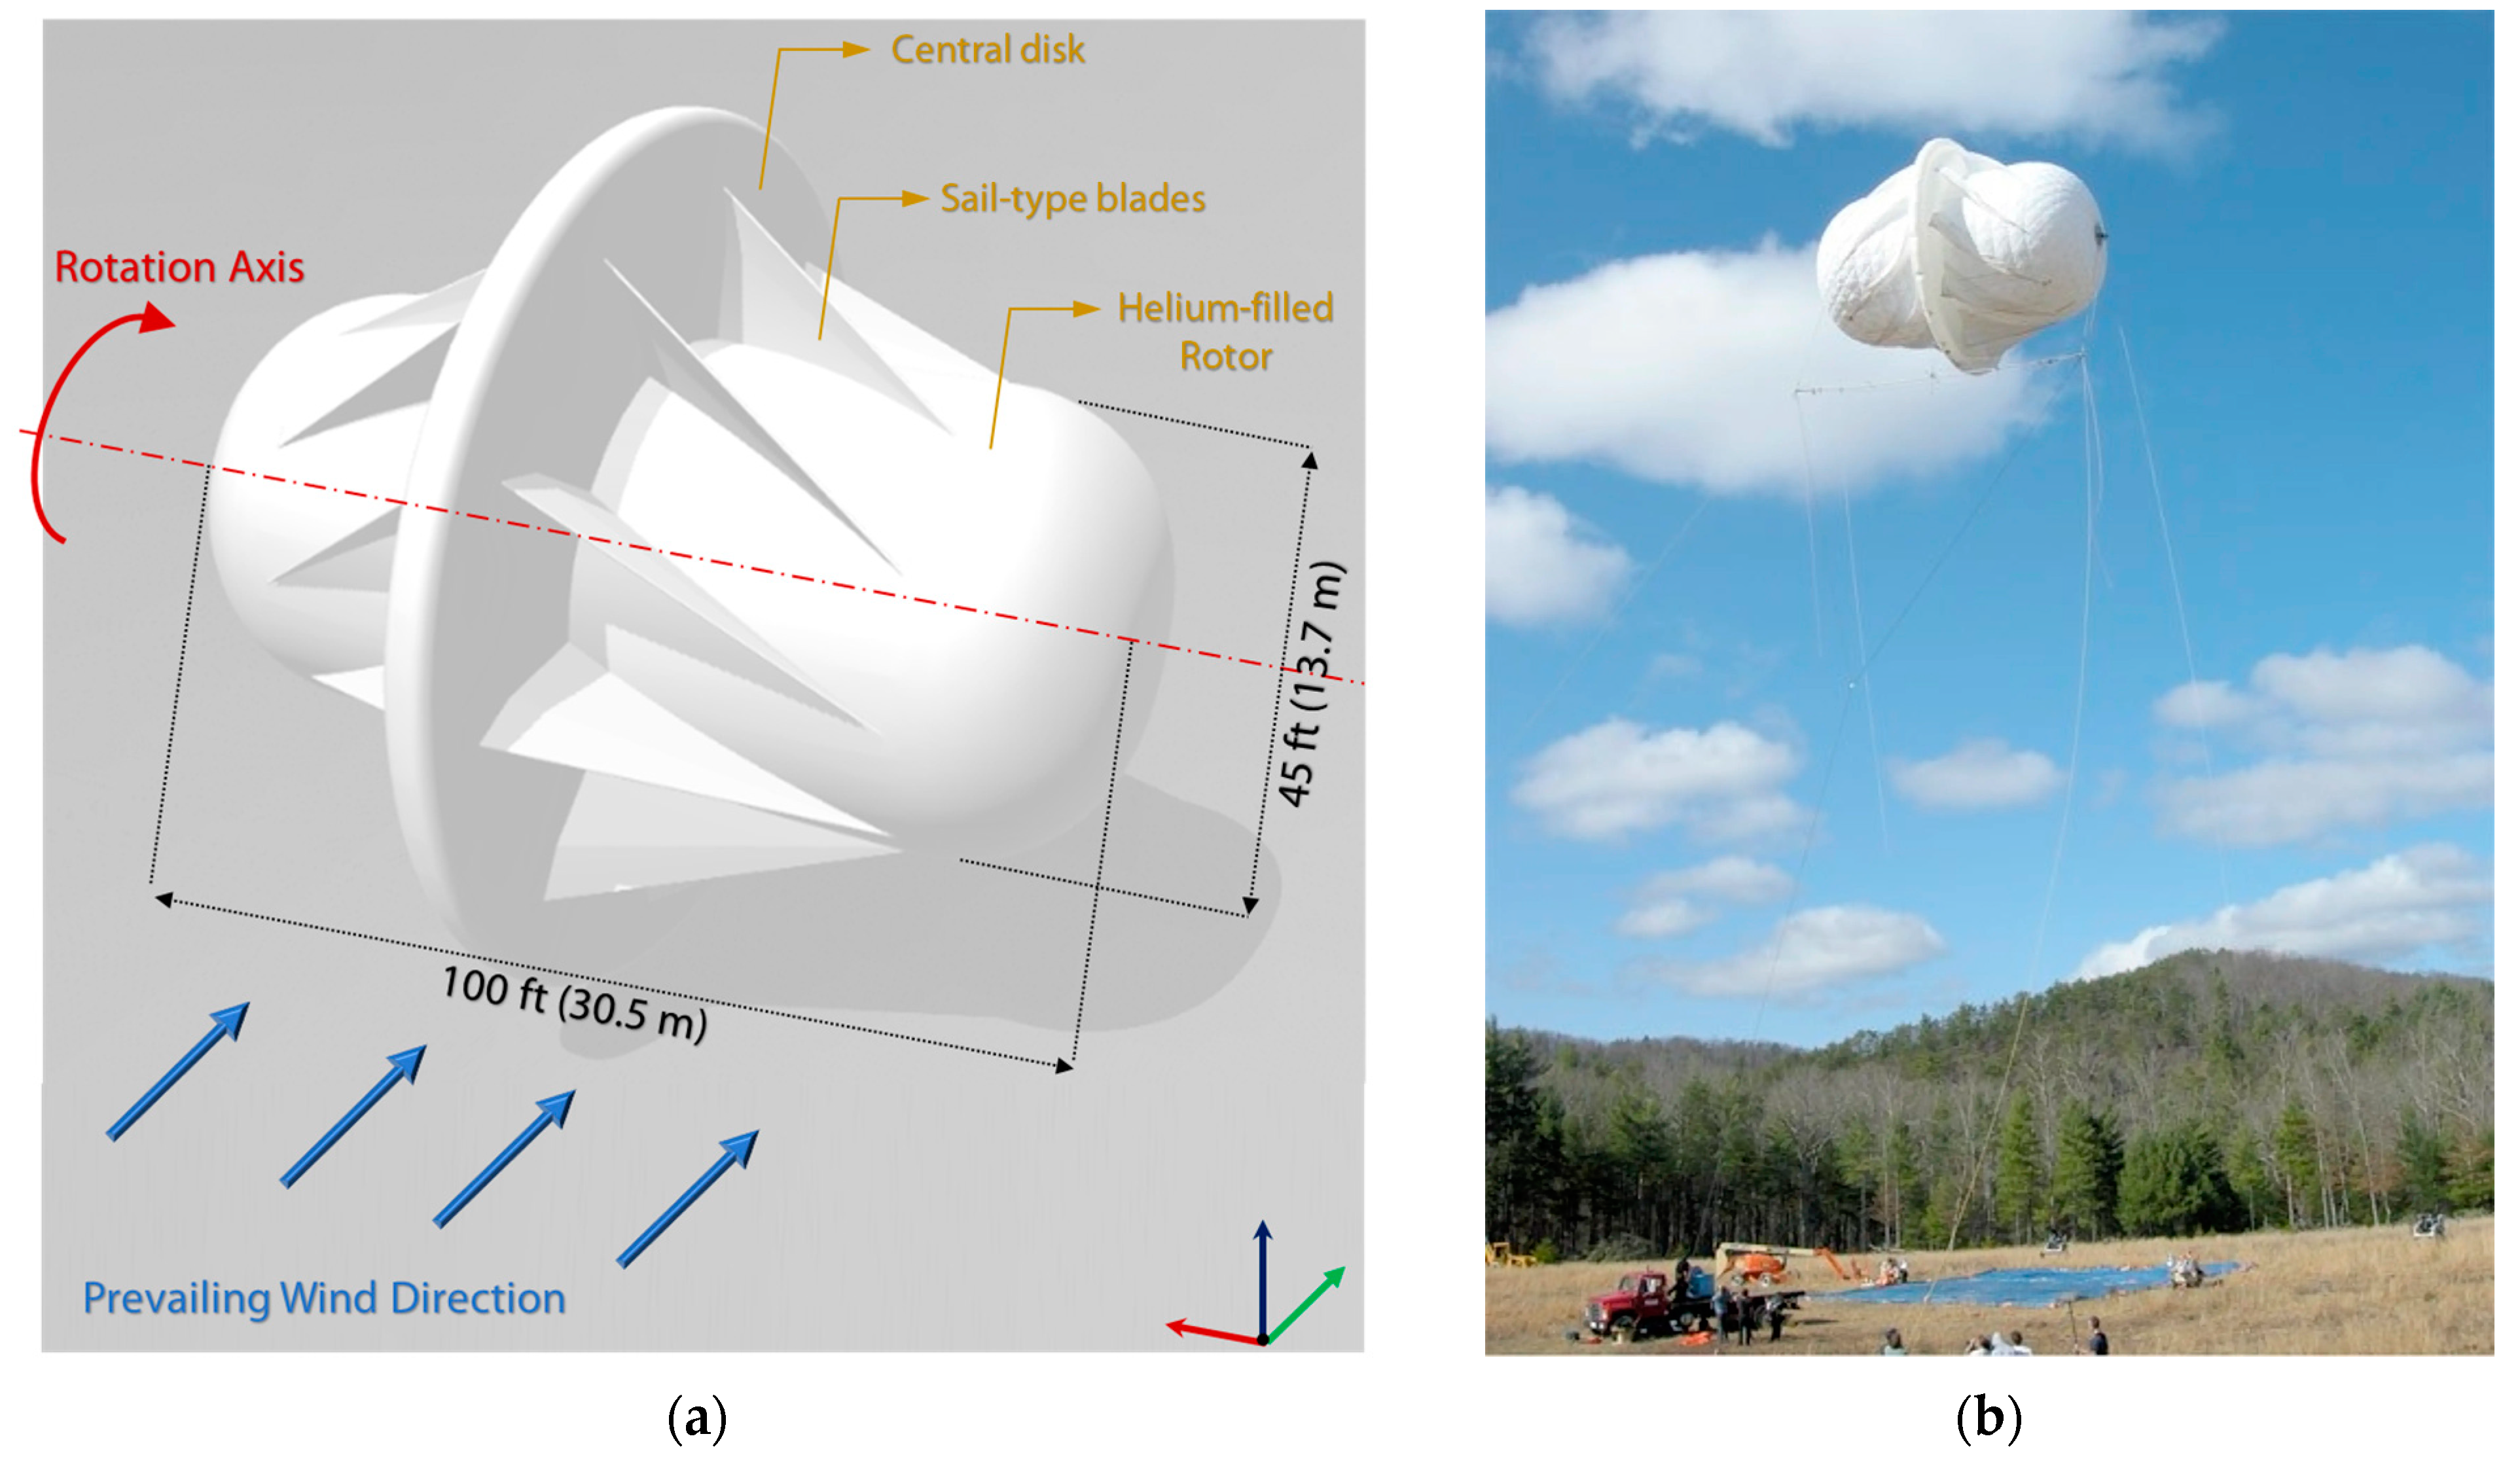
MARS is a novel airborne rotor designed and patented by Frederick D. Ferguson [
32]. The airborne rotor design is presented in
Figure 1. The figure illustrates the rotor, a cylindrical structure with a base diameter of 45 ft (13.7 m) and a length of 100 ft (30.5 m), which is filled with helium. As the interior of the structure is filled with helium, MARS, together with the Alteros’s BAT and Omnidea’s LEMAP projects, falls into the lighter-than-air category, with its sail-like wings, central disc, and bulky body. The rotor is expected to have a positive lift force due to not only the helium-filled body but also the spinning of the cylindrical zeppelin. The rotating cylinder design of the airborne rotor-type wind turbine aims to obtain a positive lift from the Magnus effect by increasing the elevation of the helium-filled rotor to high altitudes (300–600 m). The rotor is set to rise with the lift produced by initial rotation at lower altitudes obtained by increasing lift. The central disk maintains the motion perpendicular to the wind, and the corresponding diameter of the disk is 23.16 m. The rotor design is further addressed in detail in our previous publications [
31,
33].
1.3. Scope and Novelty of the Study
During the development phase, the company claimed that MARS had a power output of 100 kW for a 12 m/s wind velocity [
34]. Although this 100 kW-rated power output in 12 m/s wind velocity is also mentioned in Chaudhari’s study [
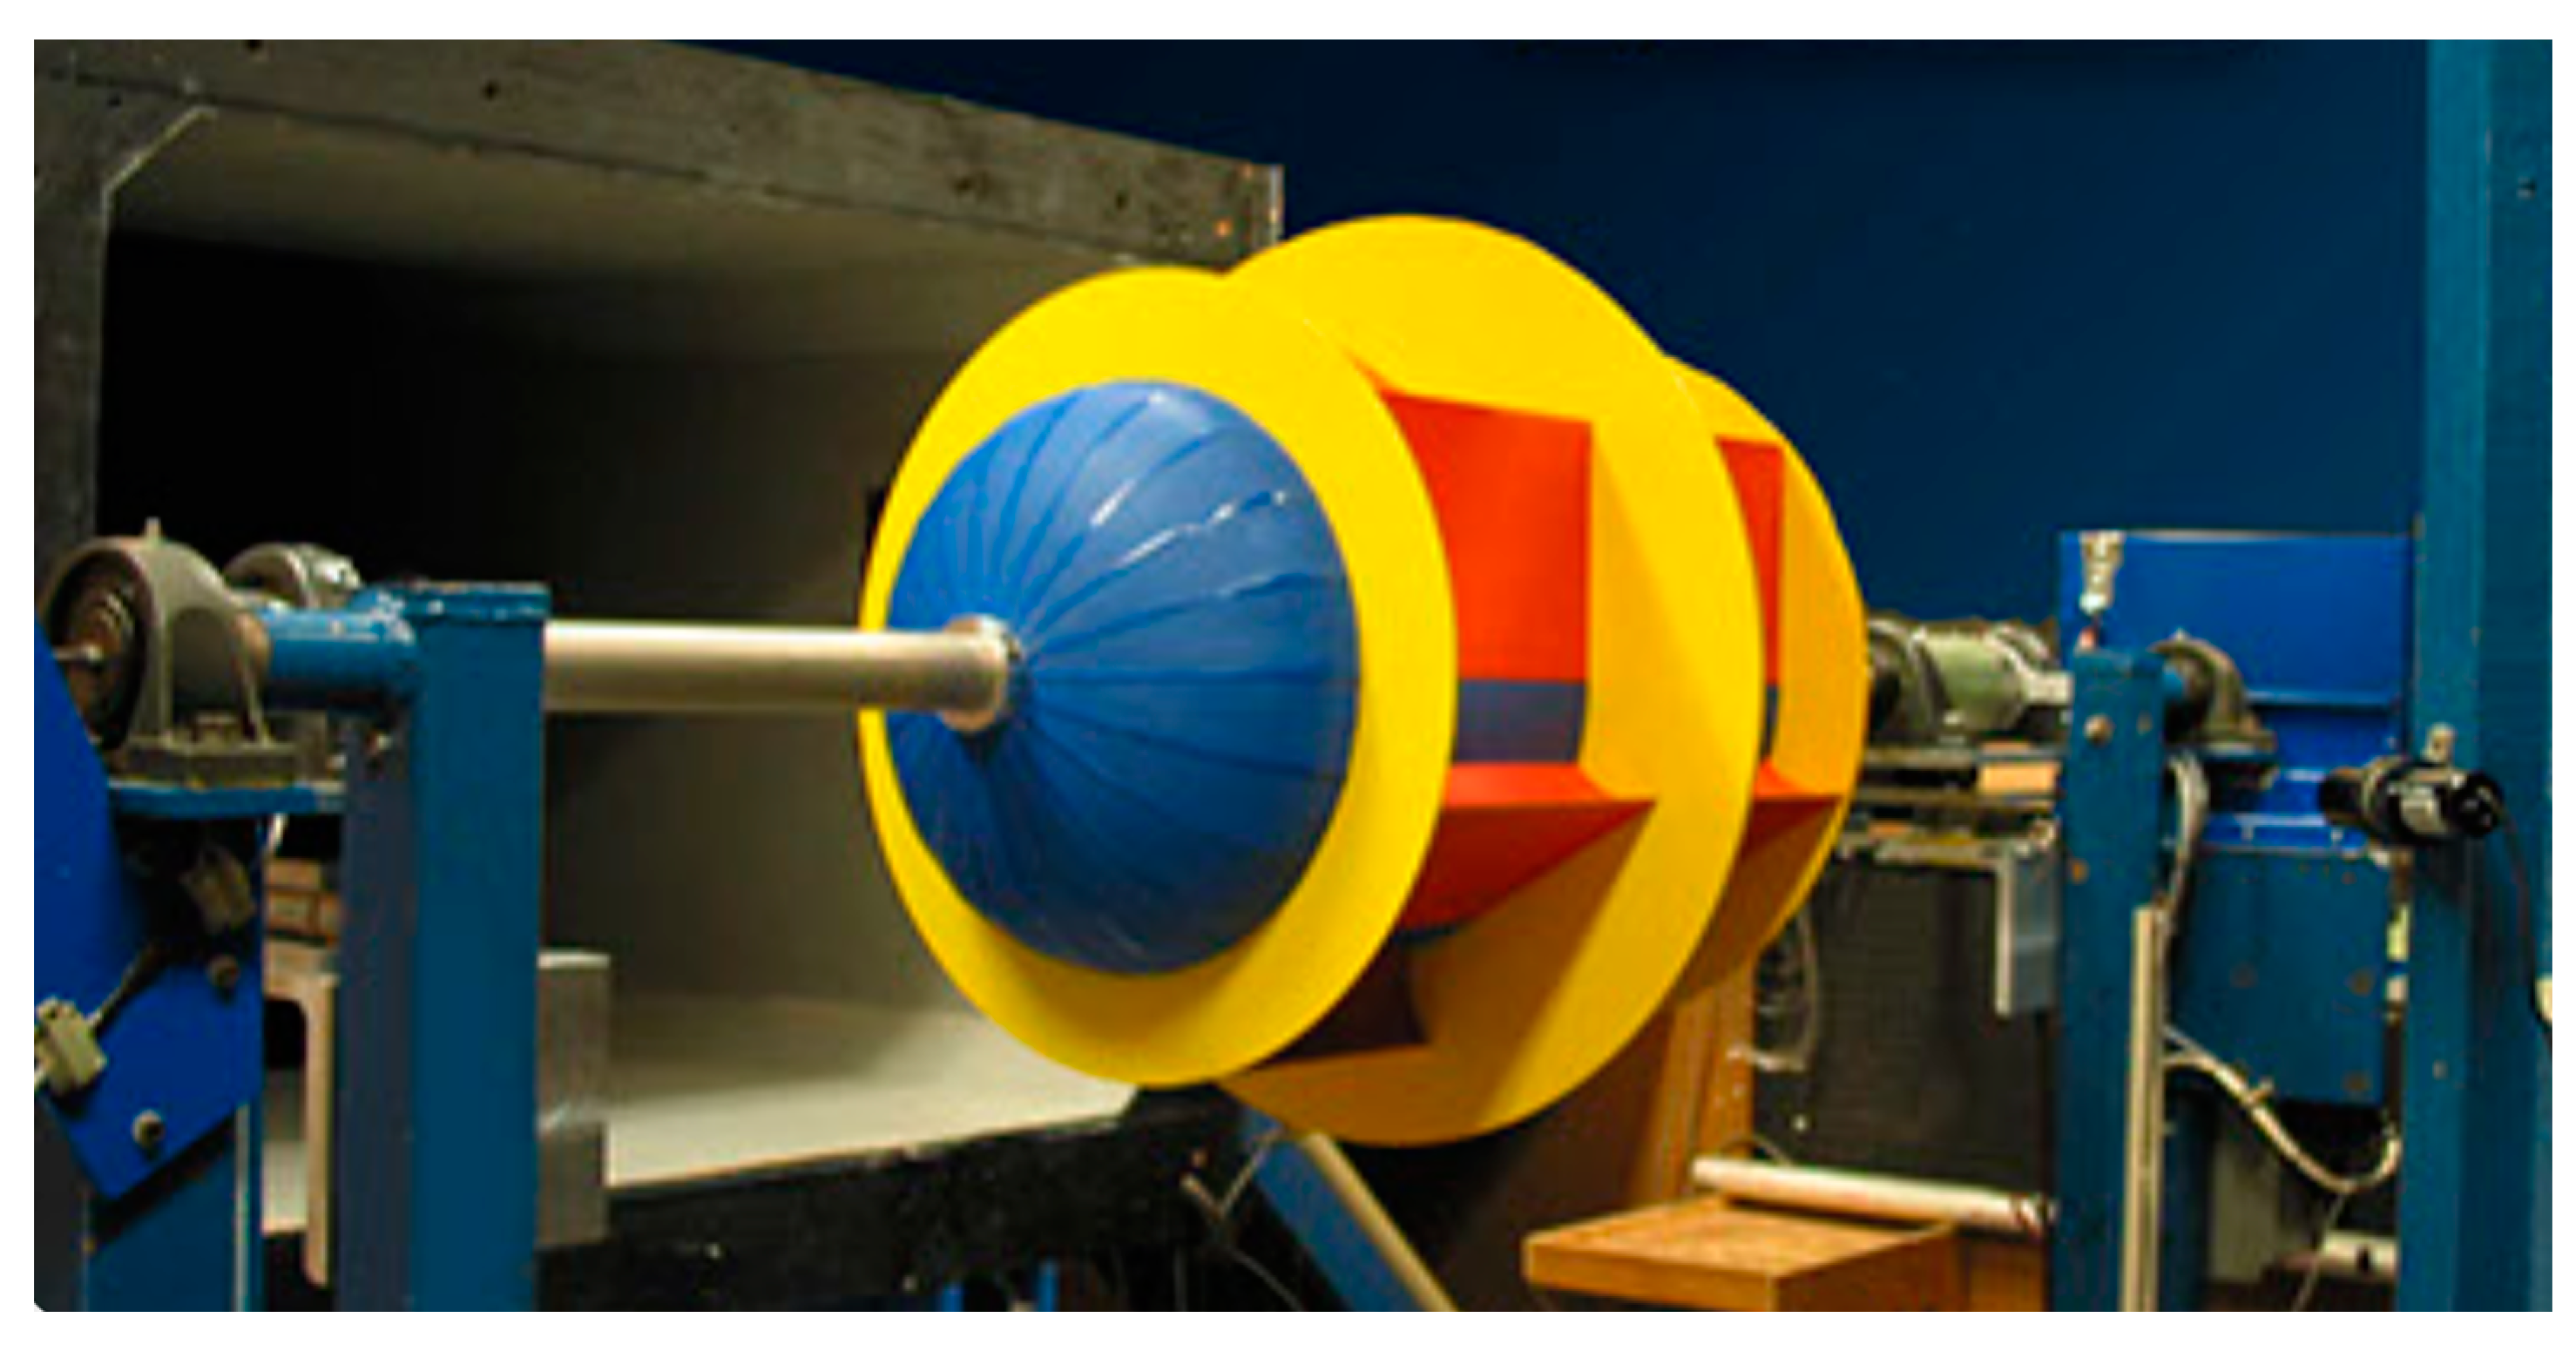
35], there is no clear information on the subject, and the existence of a numerical model is controversial. The only reference is that three different prototypes of MARS were tested for performance in the VIGYAN wind tunnel. One of the prototype tests by VIGYAN Inc. is presented in
Figure 2 [
36]. However, no explicit experimental data or results are presented elsewhere.
In this context, the aim of our investigation, building on our previous work [
31,
33], is to evaluate the accuracy of the stated rated power output for this novel design and to develop a numerical model of the airflow around this airborne rotor configuration. Our work presented at the ICCHMT 2023 Conference [
31] reported the extreme superficial wind velocity results of 12 m/s, which is in line with the rated wind velocity for the company. However, according to the EU wind atlas [
37], the average wind speed is not close to 12 m/s. The wind velocities reach their maximum at limited locations, with values of around 10 to 11 m/s [
5,
37]. Therefore, our extended analysis for superficial wind velocities of 3, 5, 6, and 9 m/s are investigated in this paper. A summary of results is presented to assess the performance analysis of the airborne drag-type VAWT for rating purposes, assuming acceptable wind speed velocities on flat terrain. In this way, our study aims to provide valuable insights into the design, development, and applications of airborne rotor systems, highlighting their potential in the field of renewable energy and transportation.
2. Materials and Methods
In this section, we elaborate on the materials and methods employed in our study to facilitate a comprehensive investigation and analysis. Specifically, we outline the development of a solid model for the experimental airborne turbine, followed by the construction of a numerical model derived from this solid representation.
2.1. Computational Solution Domain Properties
The computational solution domain is established based on the physical scale and operational parameters of the novel wind turbine system, as illustrated in
Figure 1. The dimensions mentioned in this section are derived from patents and references issued by the company [
32,
34,
35]. The cylindrical rotor has a base diameter of 13.7 m (45 feet), with the blade tip height extending 11.58 m (36 feet) from the axis. Additionally, the central disk ensures motion perpendicular to the wind, with a corresponding diameter of 23.16 m.
For computational fluid dynamics (CFD) analysis, the three-dimensional (3D) solid model was imported into ANSYS Workbench, where the mesh structure was generated using ANSYS Meshing. Subsequently, the numerical model was solved by selecting the appropriate models within the Fluent module [
23].
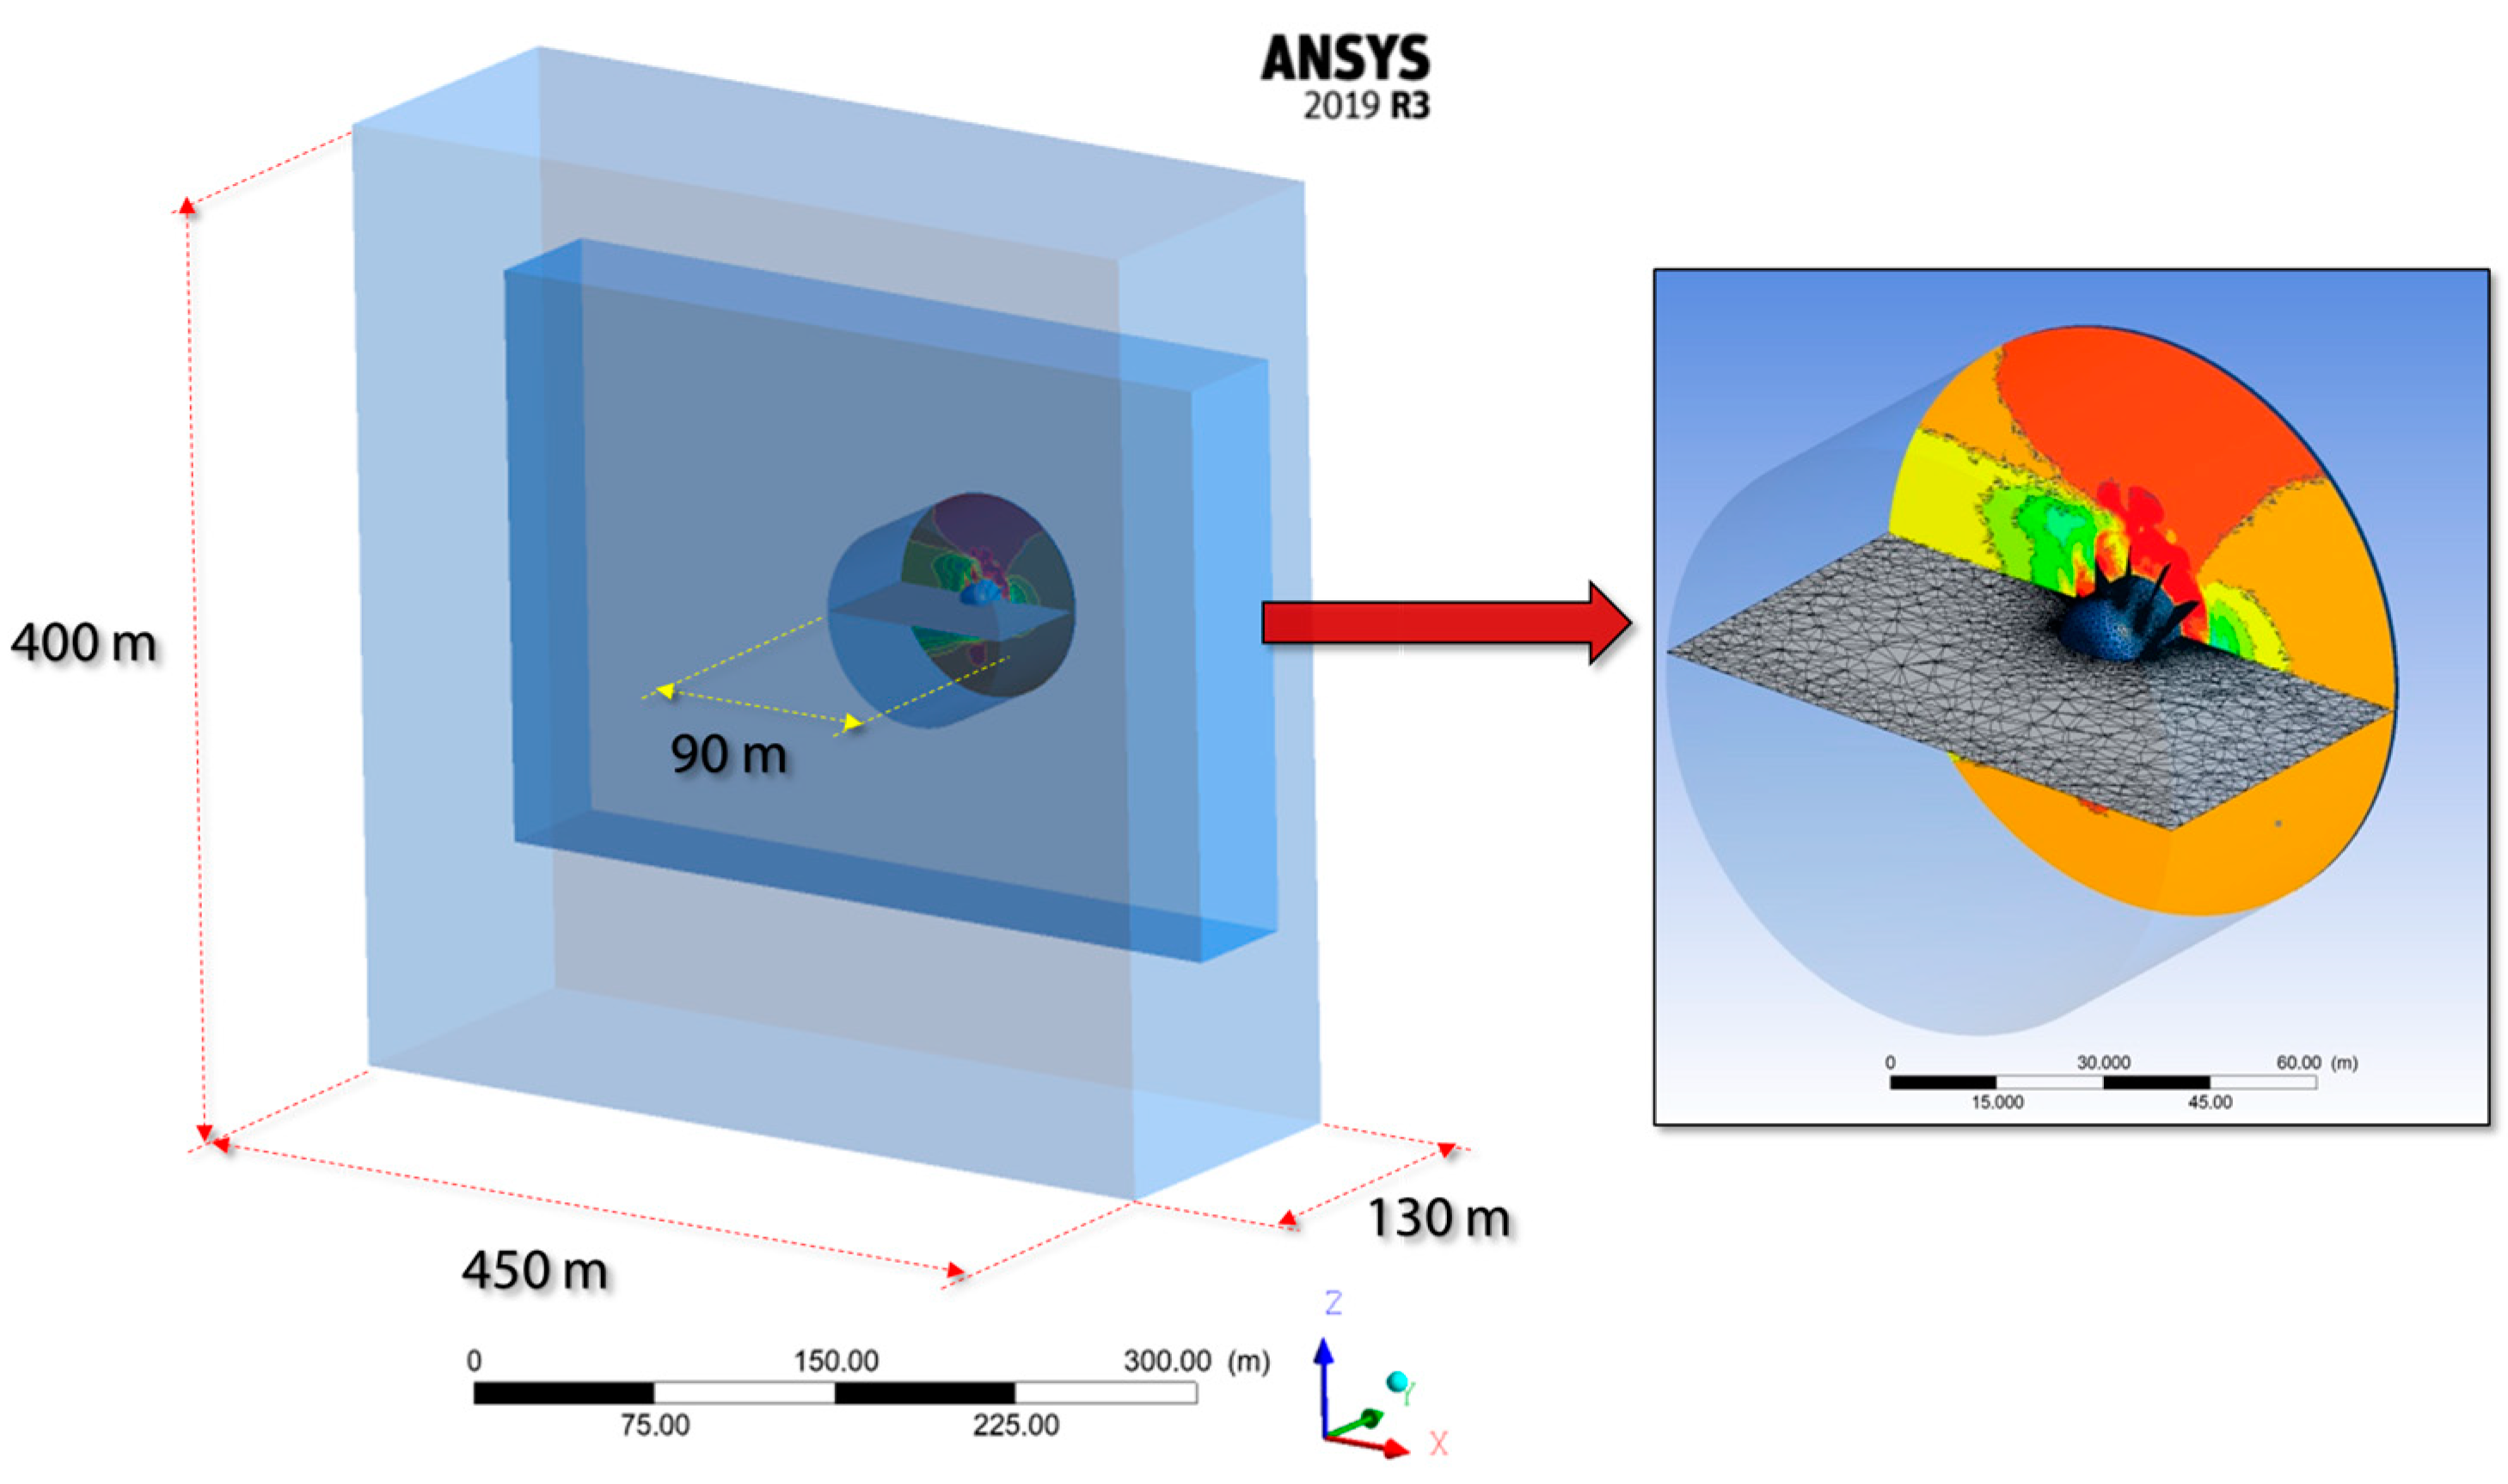
The computational solution domain is organized into a multi-zone configuration to support numerical analysis and facilitate mesh rotation with the rotor. This setup includes two rectangular zones and one cylindrical zone, as illustrated in
Figure 3. The large rectangular zone spans dimensions of 450 × 400 × 130 m, as depicted. Within this rectangular area, there are designated sub-rectangular and cylindrical regions for adjusting mesh density and aiding rotational computations. The rotor, which has a diameter of 13.7 m (
Figure 1), is located at the center of the cylindrical area with a diameter of 90 m.
In the domain, a careful initial adaptation of the mesh structure along the solution procedure is employed to generate a detailed mesh structure for the solution procedures. In total, over 1.2 million nodes and 6.5 million tetrahedral elements are constructed for mesh generation. The validity and quality of the mesh are evaluated through an analysis of mesh skewness and orthogonal quality. The results reveal an average skewness of 0.2, while the orthogonal quality is assessed at 0.8. Additionally, targeted mesh adaptation is implemented for regions prone to high turbulence and proximity to walls. Notably,
Figure 3 illustrates the denser mesh structures strategically positioned near the rotor wall and sections of the flow domain where turbulence levels are anticipated to be elevated.
A moving Reference Frame (MRF) approach with sliding mesh is utilized for the rotating cylinder zone (
Figure 3), while the remaining domain meshes are stationary. Although it requires significant computational resources, this method is widely regarded as the most precise for forecasting flow in multiple moving reference frames. Therefore, it is commonly employed in such CFD models of airborne rotors [
16,
38]. In the sliding mesh methodology, the adjacent zones move relative to each other along the mesh interface, facilitating rotation without the need for cell alignment. This approach is particularly advantageous in accommodating the inherently unsteady flow conditions encountered in the simulation.
To ensure continuous flow, a time-dependent solution procedure is implemented using a moving reference frame as a link between the stationary and rotating zones, given the transient nature of the flow. Hence, we employed unsteady Reynolds Averaged Navier–Stokes (RANS), incorporating a sliding boundary condition for the rotating cylinder. The cylindrical enclosure mesh was assigned different rotational speeds to conduct a parametric study. Specifically, the rotational speed varied to Ω = 0.36 rad/s for V = 3 m/s wind velocity; 0.65 rad/s for V = 5 m/s, 0.7 and 0.8 rad/s for V = 6 m/s; 1.0, 1.06 and 1.1 rad/s for V = 9 m/s; and, finally, 1.2 and 1.4 rad/s for V = 12 m/s.
In the numerical setup, the boundary condition for the prevailing wind direction cross-section of the rectangular domain was designated as velocity inlet, ensuring the entry of air into the computational domain across flat terrain wind velocities ranging from 3 to 12 m/s. Meanwhile, the other outer surfaces of the computational domain are specified as symmetry boundary conditions.
The initial computations commenced with a time step of 0.001 s, ensuring the development of a sufficiently accurate flow field. Subsequently, the time step was progressively increased to 0.002 s, and occasionally to 0.003 and/or 0.005 s, adhering to the Levi–Friedrich–Courant criterion to maintain the Courant number (CFL) below 1 (CFL << 1). Maintaining a CFL value below 1 ensures numerical stability and time-step validation. Time-step validation was verified by monitoring the CFL value to ensure its consistency below this threshold. This adaptive time-step strategy enables efficient computation while upholding numerical stability [
39].
Our study covers a range of wind speeds, from 3 m/s to 12 m/s, resulting in varying characteristic Reynolds numbers, ranging from Re = 2.2 × 10⁶ to 18.8 × 10⁶, depending on the wind velocity. To model turbulence, we employed the realizable k-ε turbulence model in the solver. Additionally, second-order models were used for pressure, momentum, turbulent kinetic energy, and dissipation rate equations.
2.2. Performance Parameters
Turbine performance is assessed on the basis of various specific performance parameters. The available wind power (E
wind) for a given wind velocity refers to the energy potential that can be harnessed from the kinetic energy of the moving air mass. It represents the maximum amount of power that can be extracted by a wind turbine operating under ideal conditions at a specific wind velocity of V. This available power is determined by the wind velocity and the area intercepted by the turbine rotor, as expressed in Equation (1). It is a crucial parameter used for assessing the feasibility and efficiency of wind energy conversion systems, offering insights into the renewable energy potential of a geographical location or wind resource.
For superficial flow velocities (V) of 3, 5, 6, 9, and 12 m/s, the oncoming total energy to the rotor (E
wind) is calculated as 5.3, 24.5, 42.2, 142.6, and 338 kW, respectively. The cross-sectional area (A) is considered in the calculations as the total cross-sectional area perpendicular to the flow cross-section, as shown in
Figure 1.
The aerodynamic forces acting on wind turbine rotors (F
wind) are critical in determining their operational performance. The relation for the superficial forces that are acting on the rotor due to wind is presented in Equation (2).
These forces cause periodic and fluctuating aerodynamic loads on the rotor body and blades, directly impacting the overall performance of the wind turbine. To quantify these effects, the aerodynamic forces are integrated over the length of the blade to determine the instantaneous forces and moments acting on the rotor body and the blades (Mwind). Understanding these aerodynamic forces is essential for assessing the performance, efficiency, and structural integrity of wind turbines, ultimately maximizing their power output and reliability.
Furthermore, the energy generation potential of the rotor is directly related to the moment exerted on the blades, as depicted in Equation (3). The available wind force moment (M
wind) is calculated by multiplying the calculated superficial force (F
wind) by the characteristic length (L).
In the context of rating airborne wind turbines, the lift coefficient (Cl), drag coefficient (Cd), and power coefficient (Cp) are essential performance parameters that are directly related to the efficiency and power generation of these systems.
The lift coefficient is the ratio of total superficial forces and the lift forces acting on the body of the rotor, as presented in Equation (4).
The lift coefficient (Cl) holds significant importance in the context of airborne wind turbines due to its direct influence on the aerodynamic performance and efficiency of these systems. Lift force is also directly related to the Magnus effect, as explained in the previous sections. A higher lift coefficient implies greater lift force production for a given wind speed, leading to enhanced turbine performance and improved power generation capabilities, especially for kite-type or lift-type airborne wind turbines.
On the other hand, the drag coefficient (Cd) represents the dimensionless parameter that quantifies the aerodynamic drag experienced by the turbine body and its components relative to the airflow. It is defined as the ratio of the drag force acting on the turbine to the dynamic pressure of the airflow, as expressed by Equation (5).
In AWESs, the power coefficient (Cp) is the most significant parameter used to assess the system’s efficiency and power generation capabilities. It represents the ratio of the actual power generated by the turbine to the maximum possible power that could be extracted from the wind, given ideal conditions. The power coefficient is presented in Equation (6).
Cp is directly dependent on the rotational velocities and, therefore, the moment developed on the blades. The power coefficient is directly proportional to the moment coefficient (Cm) and tip speed ratio (TSR), denoted as λ. TSR is the ratio of the characteristic moment arm length (R
blade) multiplied by the rotational speed of the blade (Ω) to the corresponding wind velocity (V), and it is calculated using Equation (7).
However, as illustrated in
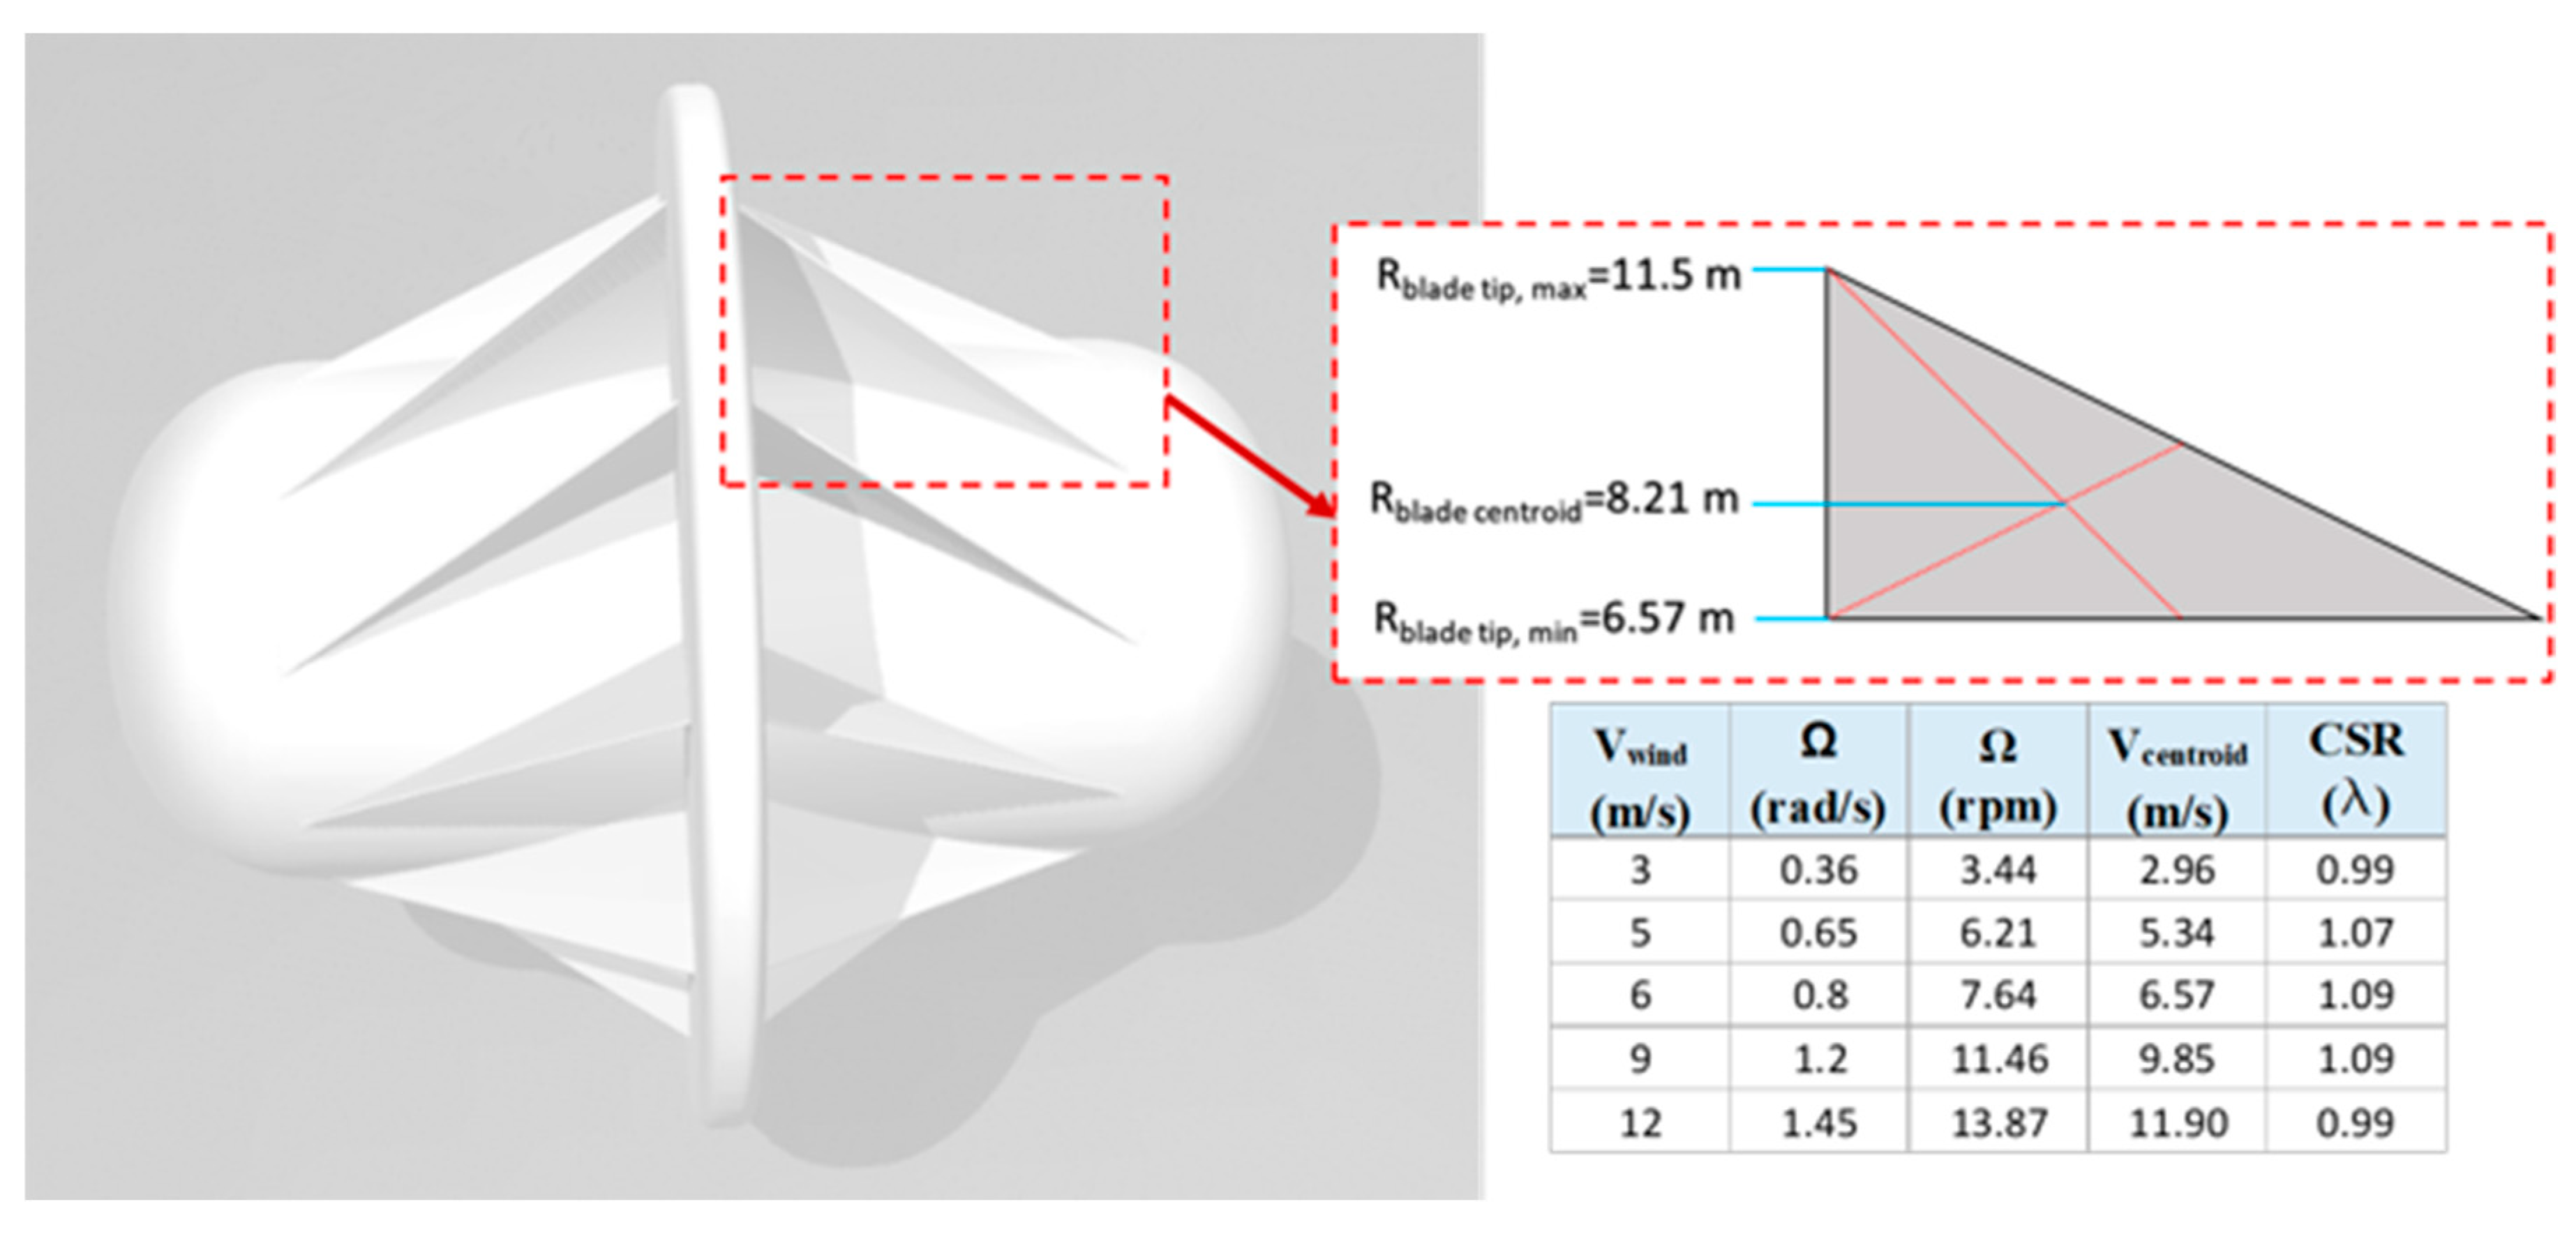
Figure 4, the characteristic length for the moment calculation varies due to the sail-type and triangular area in our study.
The tip of the blade on the cylindrical surface of the rotor (Rblade tip, min) is 6.57 m from the center, while the outermost point of the blade (Rblade tip, max) is 11.5 m from the center. Considering the triangular shape of the blade, the characteristic length is chosen as the centroid of the sail (8.21 m), as depicted in the figure. For this reason, the tip speed ratio will now be referred to as the Centroid Speed Ratio (CSR) throughout the manuscript.
Figure 3 also presents the rotational velocity (Ω), centroid velocity (V
centroid), and CSR values corresponding to the flat terrain wind velocities (V
wind) in our parametric study.
3. Results
In the three-dimensional domain, all computations are conducted for specified wind velocities of 3, 5, 6, 9, and 12 m/s using ANSYS Fluent 19.R3 and 21.R2 modules. The rotational speed of the rotor (and, accordingly, the cylindrical rotating mesh zone) is set based on the CSR values, which are addressed in
Figure 4. To ensure the development and stability of the flow in the solution area, particularly in the wake behind the rotor, we considered results after the rotor completed three rotations. Subsequently, data were collected on the drag coefficient (Cd), lift coefficient (Cl), moment coefficient (Cm), power coefficient (Cp), and power per unit time, along with the corresponding angular position of the rotor. The results are presented and addressed separately for each flat terrain wind velocity.
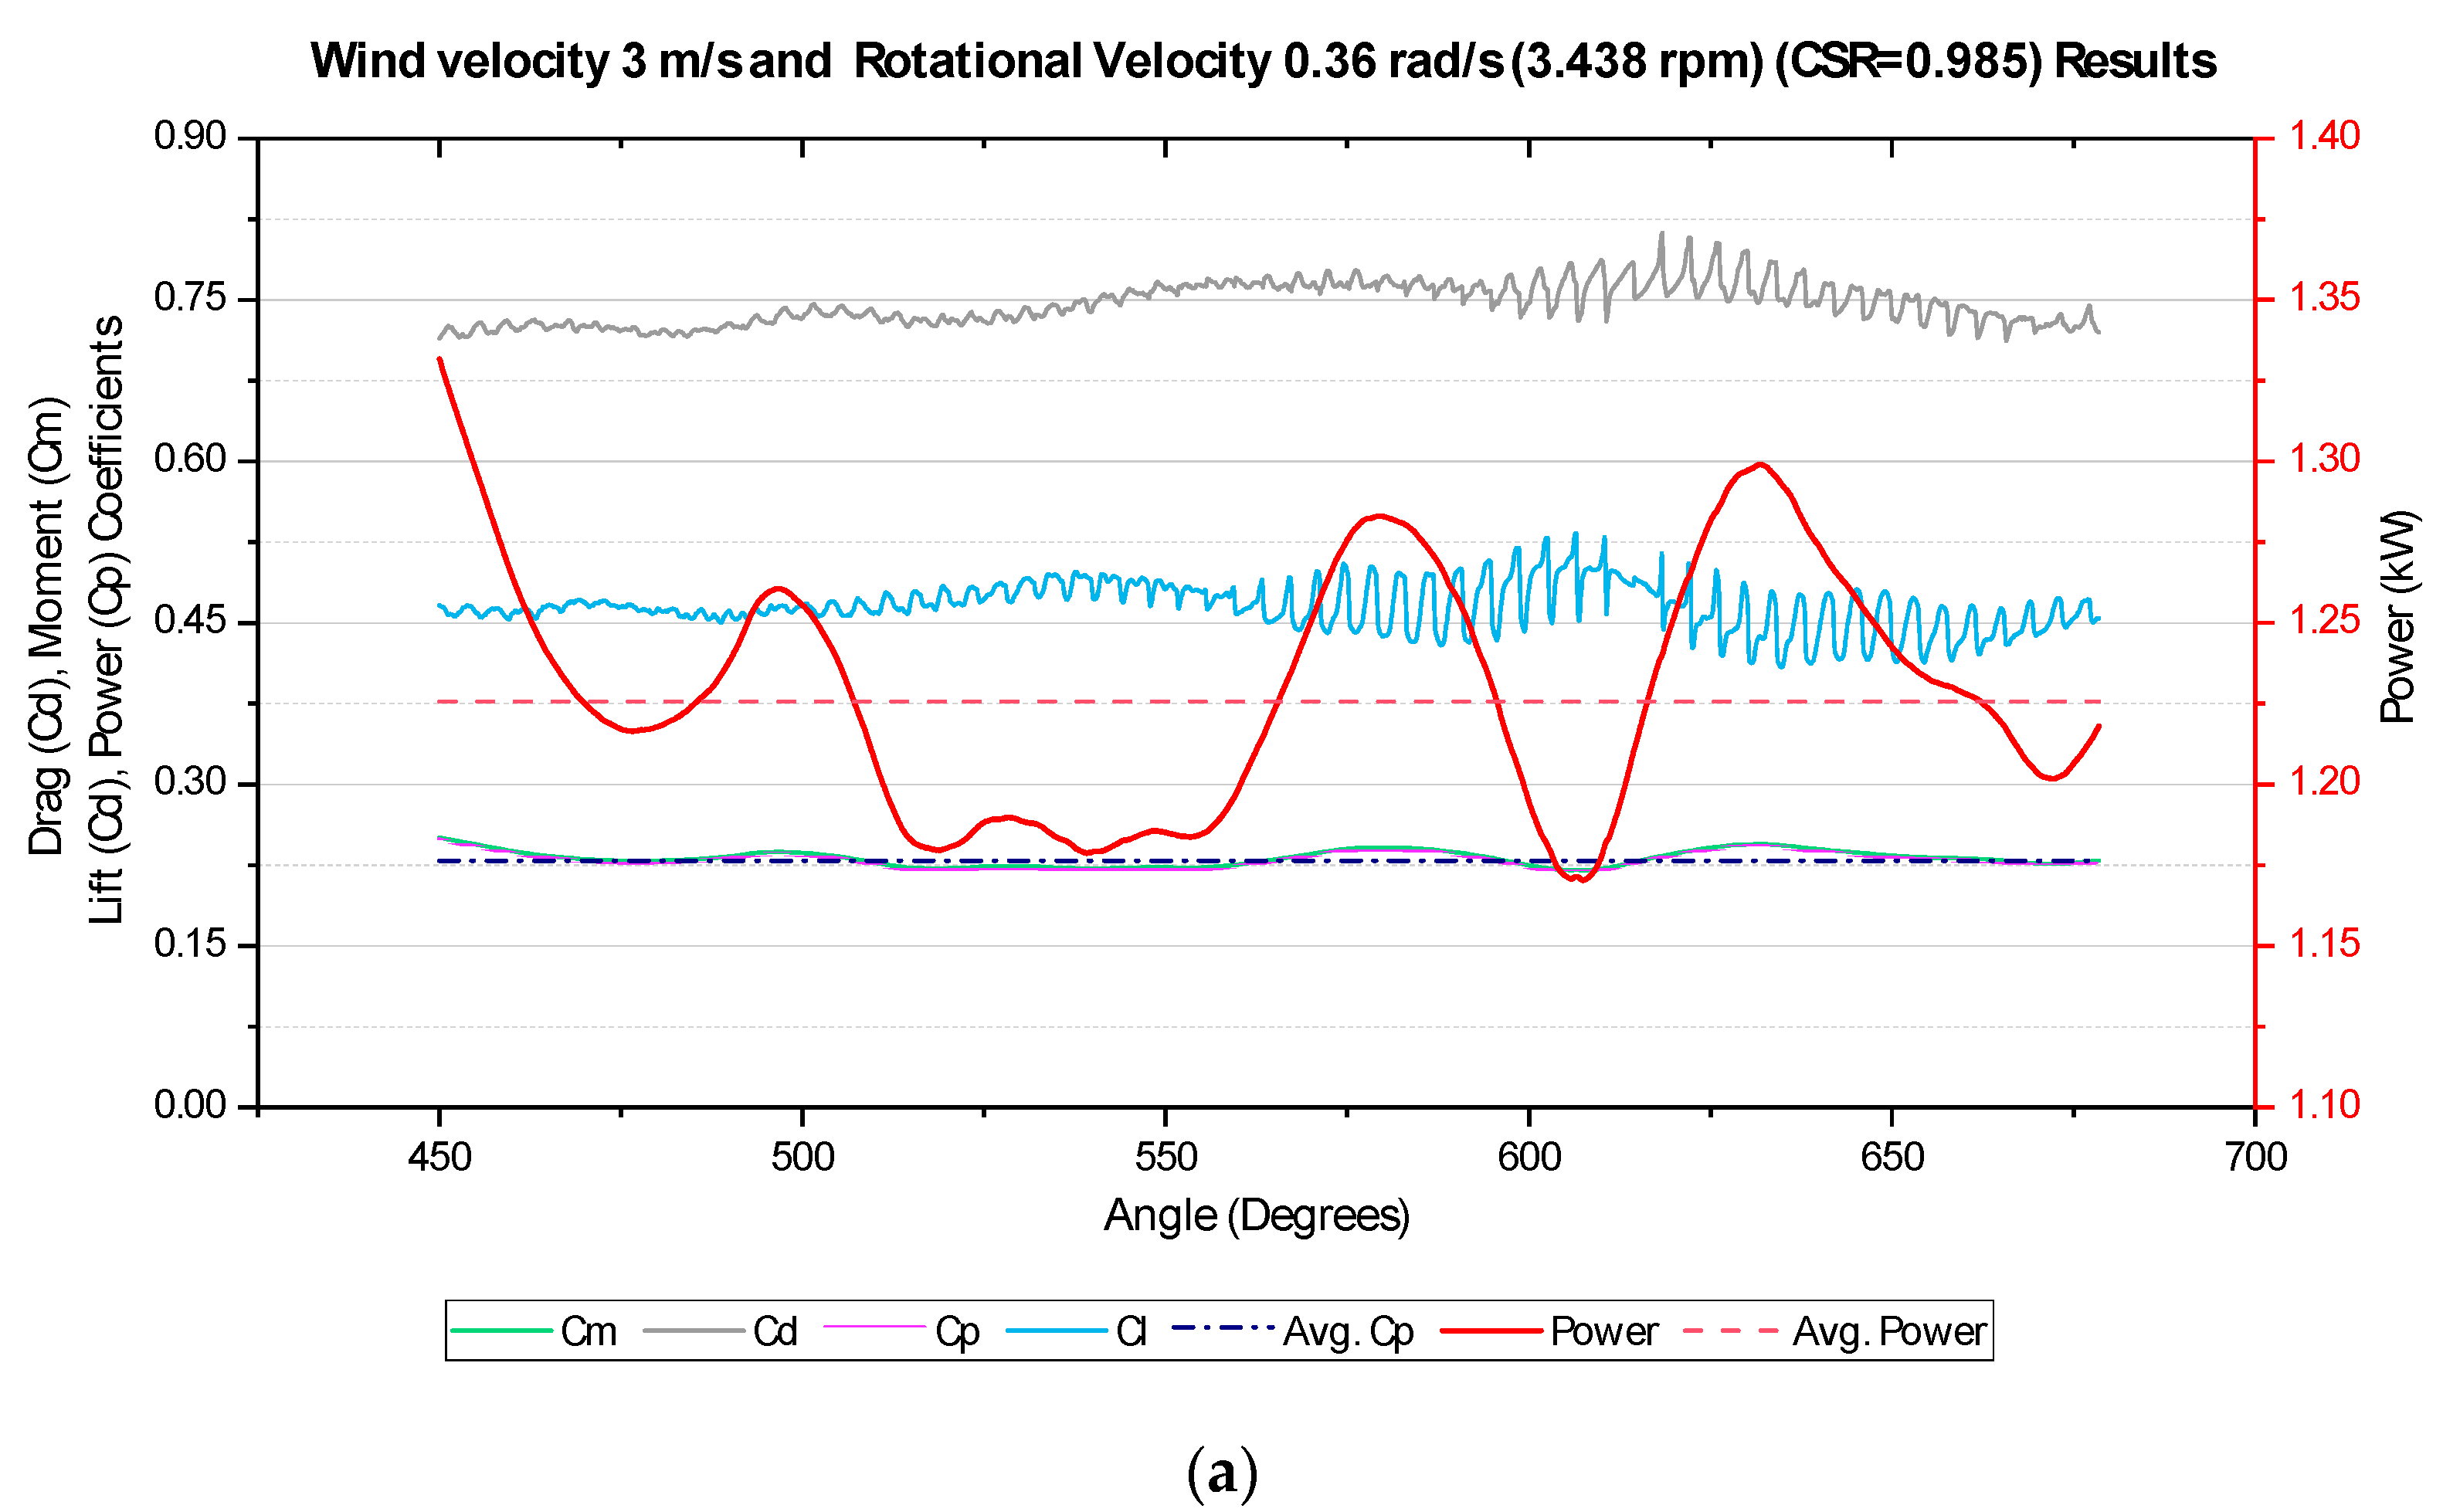
Our initial set of results is derived from a flat terrain wind velocity of 3 m/s, which is applicable within heights ranging from 0 to 50 m, as per the European Wind Atlas [
37]. Utilizing Equation (7) with a wind velocity of 3 m/s and a corresponding rotational velocity of 0.36 rad/s (equivalent to 3.438 rpm), the centroid speed ratio is calculated to be 0.985.
The numerical results obtained are plotted in
Figure 5a, illustrating the flow-related parameters per degree. These parameters were described in detail in the earlier sections. Furthermore, velocity magnitude and static pressure distributions on the rotor and in the flow field are obtained. The velocity magnitude and static pressure contours are presented in
Figure 5b and
Figure 5c, respectively. For a clearer observation of the flow field and the section after the rotor, an XZ midplane was defined in the contour plots precisely at the center point of the rotor.
Figure 5a illustrates that the total power generated (in kW) peaks every 36 degrees due to the presence of 10 blades distributed along the 360-degree circumference. The cross-sectional area perpendicular to the flow varies with the position of the blade, repeating every 36 degrees owing to the utilization of a time-dependent transient solution. However, since the wind turbine analyzed in our study is of the drag type, the condition where the cross-sectional area is tangentially perpendicular to the centerline experiences the greatest drag, resulting in the highest power extraction. It is noteworthy that as the blade rotates in the direction of the force applied by the drag, the drag acting on the blade diminishes, consequently reducing the extracted power. This cycle repeats at every 36 degrees.
The cycle, however, does not exactly follow an identical pattern of repeated peaks and troughs for a result of 3 m/s. This variation primarily arises from the flow instability due to the low speed and the constant evolution of wakes in the rear area of the rotor cross-section. The wakes behind the flow are clearly visible in the velocity contours presented in
Figure 5b. While a wake develops from the bottom to the rear of the rotor, superficial velocities in the domain and on the rotor reach 6 m/s in the upper sections.
The drag coefficient on the rotor varies between 0.72 and 0.80, while the lift coefficient varies between 0.42 and 0.52. At an air velocity of 3 m/s, the average power produced is 1.22 kW out of a total potential power of 5.4 kW. Therefore, the ratio of these two terms, the average power coefficient, is found to be 0.228.
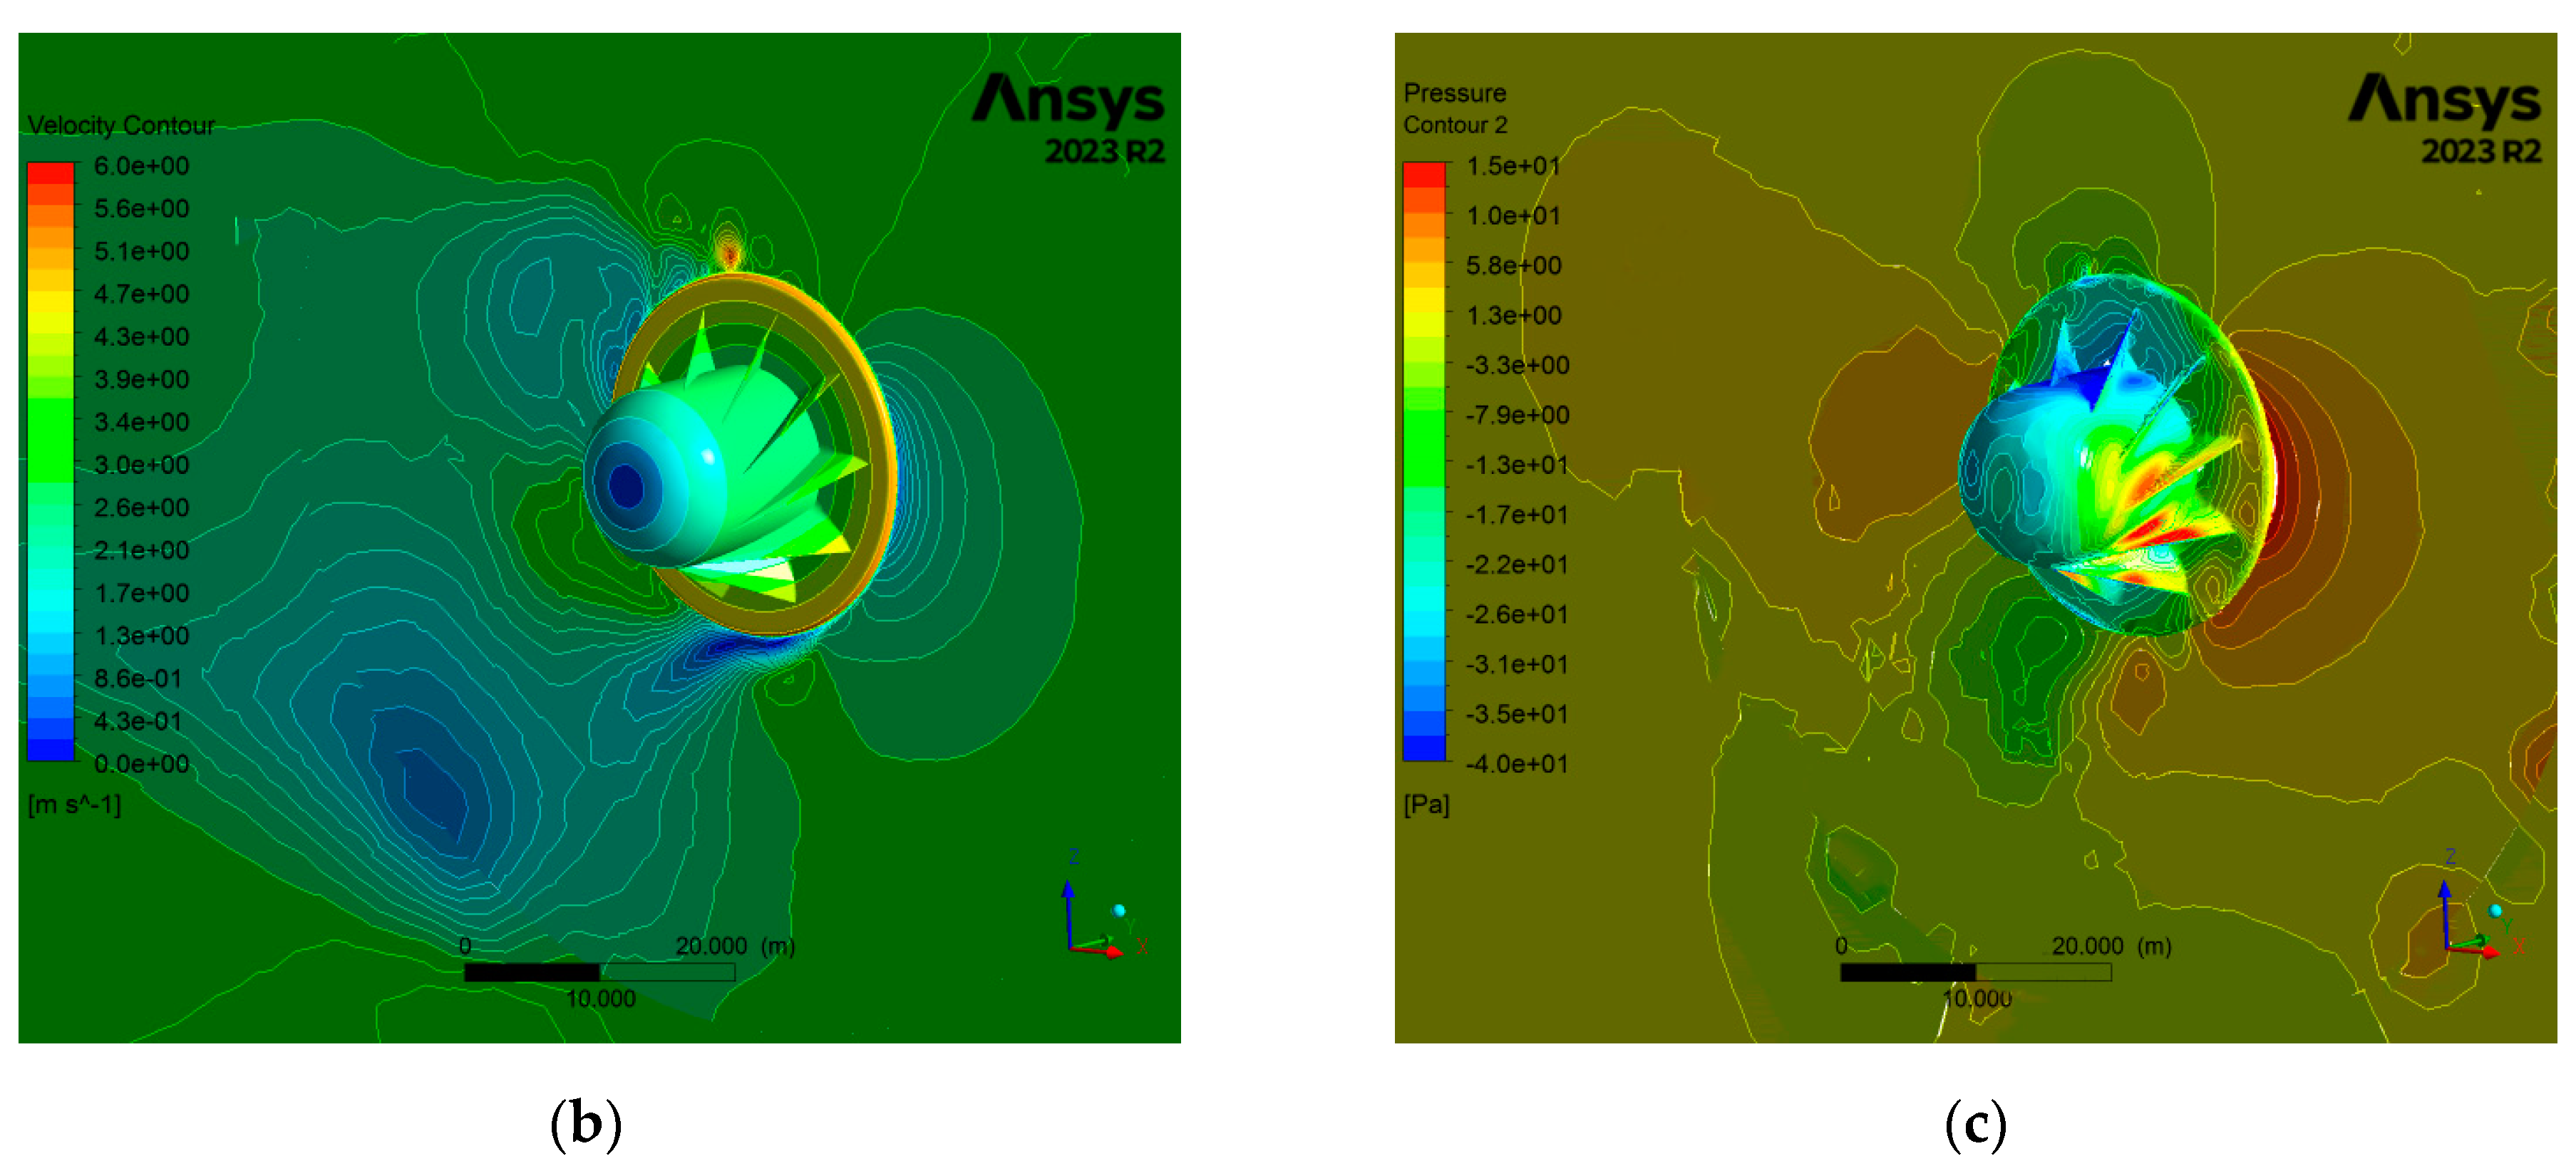
Secondly, results were obtained for a flat terrain wind velocity of 5 m/s. According to the European Wind Atlas, a wind velocity of 5 m/s is commonly observed at altitudes ranging from 50 to 100 m [
37]. At this velocity, the rotational velocity was determined to be 0.65 rad/s (equivalent to 6.207 rpm). Consequently, the Centroid Speed Ratio (CSR) value was calculated as 1.067.
The results for a wind velocity of 5 m/s are presented in
Figure 6a for power and performance coefficients, and in
Figure 6b and
Figure 6c for velocity and pressure coefficients, respectively.
The estimated power generation and drag coefficient shown in
Figure 6a exhibit greater stability and cyclic behavior compared to the wind velocity of 3 m/s. Specifically, the estimated power generation varies between 6 and 7.5 kW. With the available potential power calculated at 24.9 kW for 5 m/s wind velocity, the average power coefficient is determined to be 0.277 for this case. Additionally, the lift coefficient fluctuates between 0.50 and 0.70, and the drag coefficient is observed to range from 0.38 to 0.45.
In the contour plots presented in
Figure 6b,c, it is evident that the wake forms and translates in the upper rear part of the rotor compared to the results obtained at a 3 m/s wind velocity. The velocity magnitudes increase up to 10 m/s in the outer diameter of the cylindrical disc and in the upper top sections of the rotor. Upon analyzing the static pressure, positive pressure is found on the blade surfaces as expected.
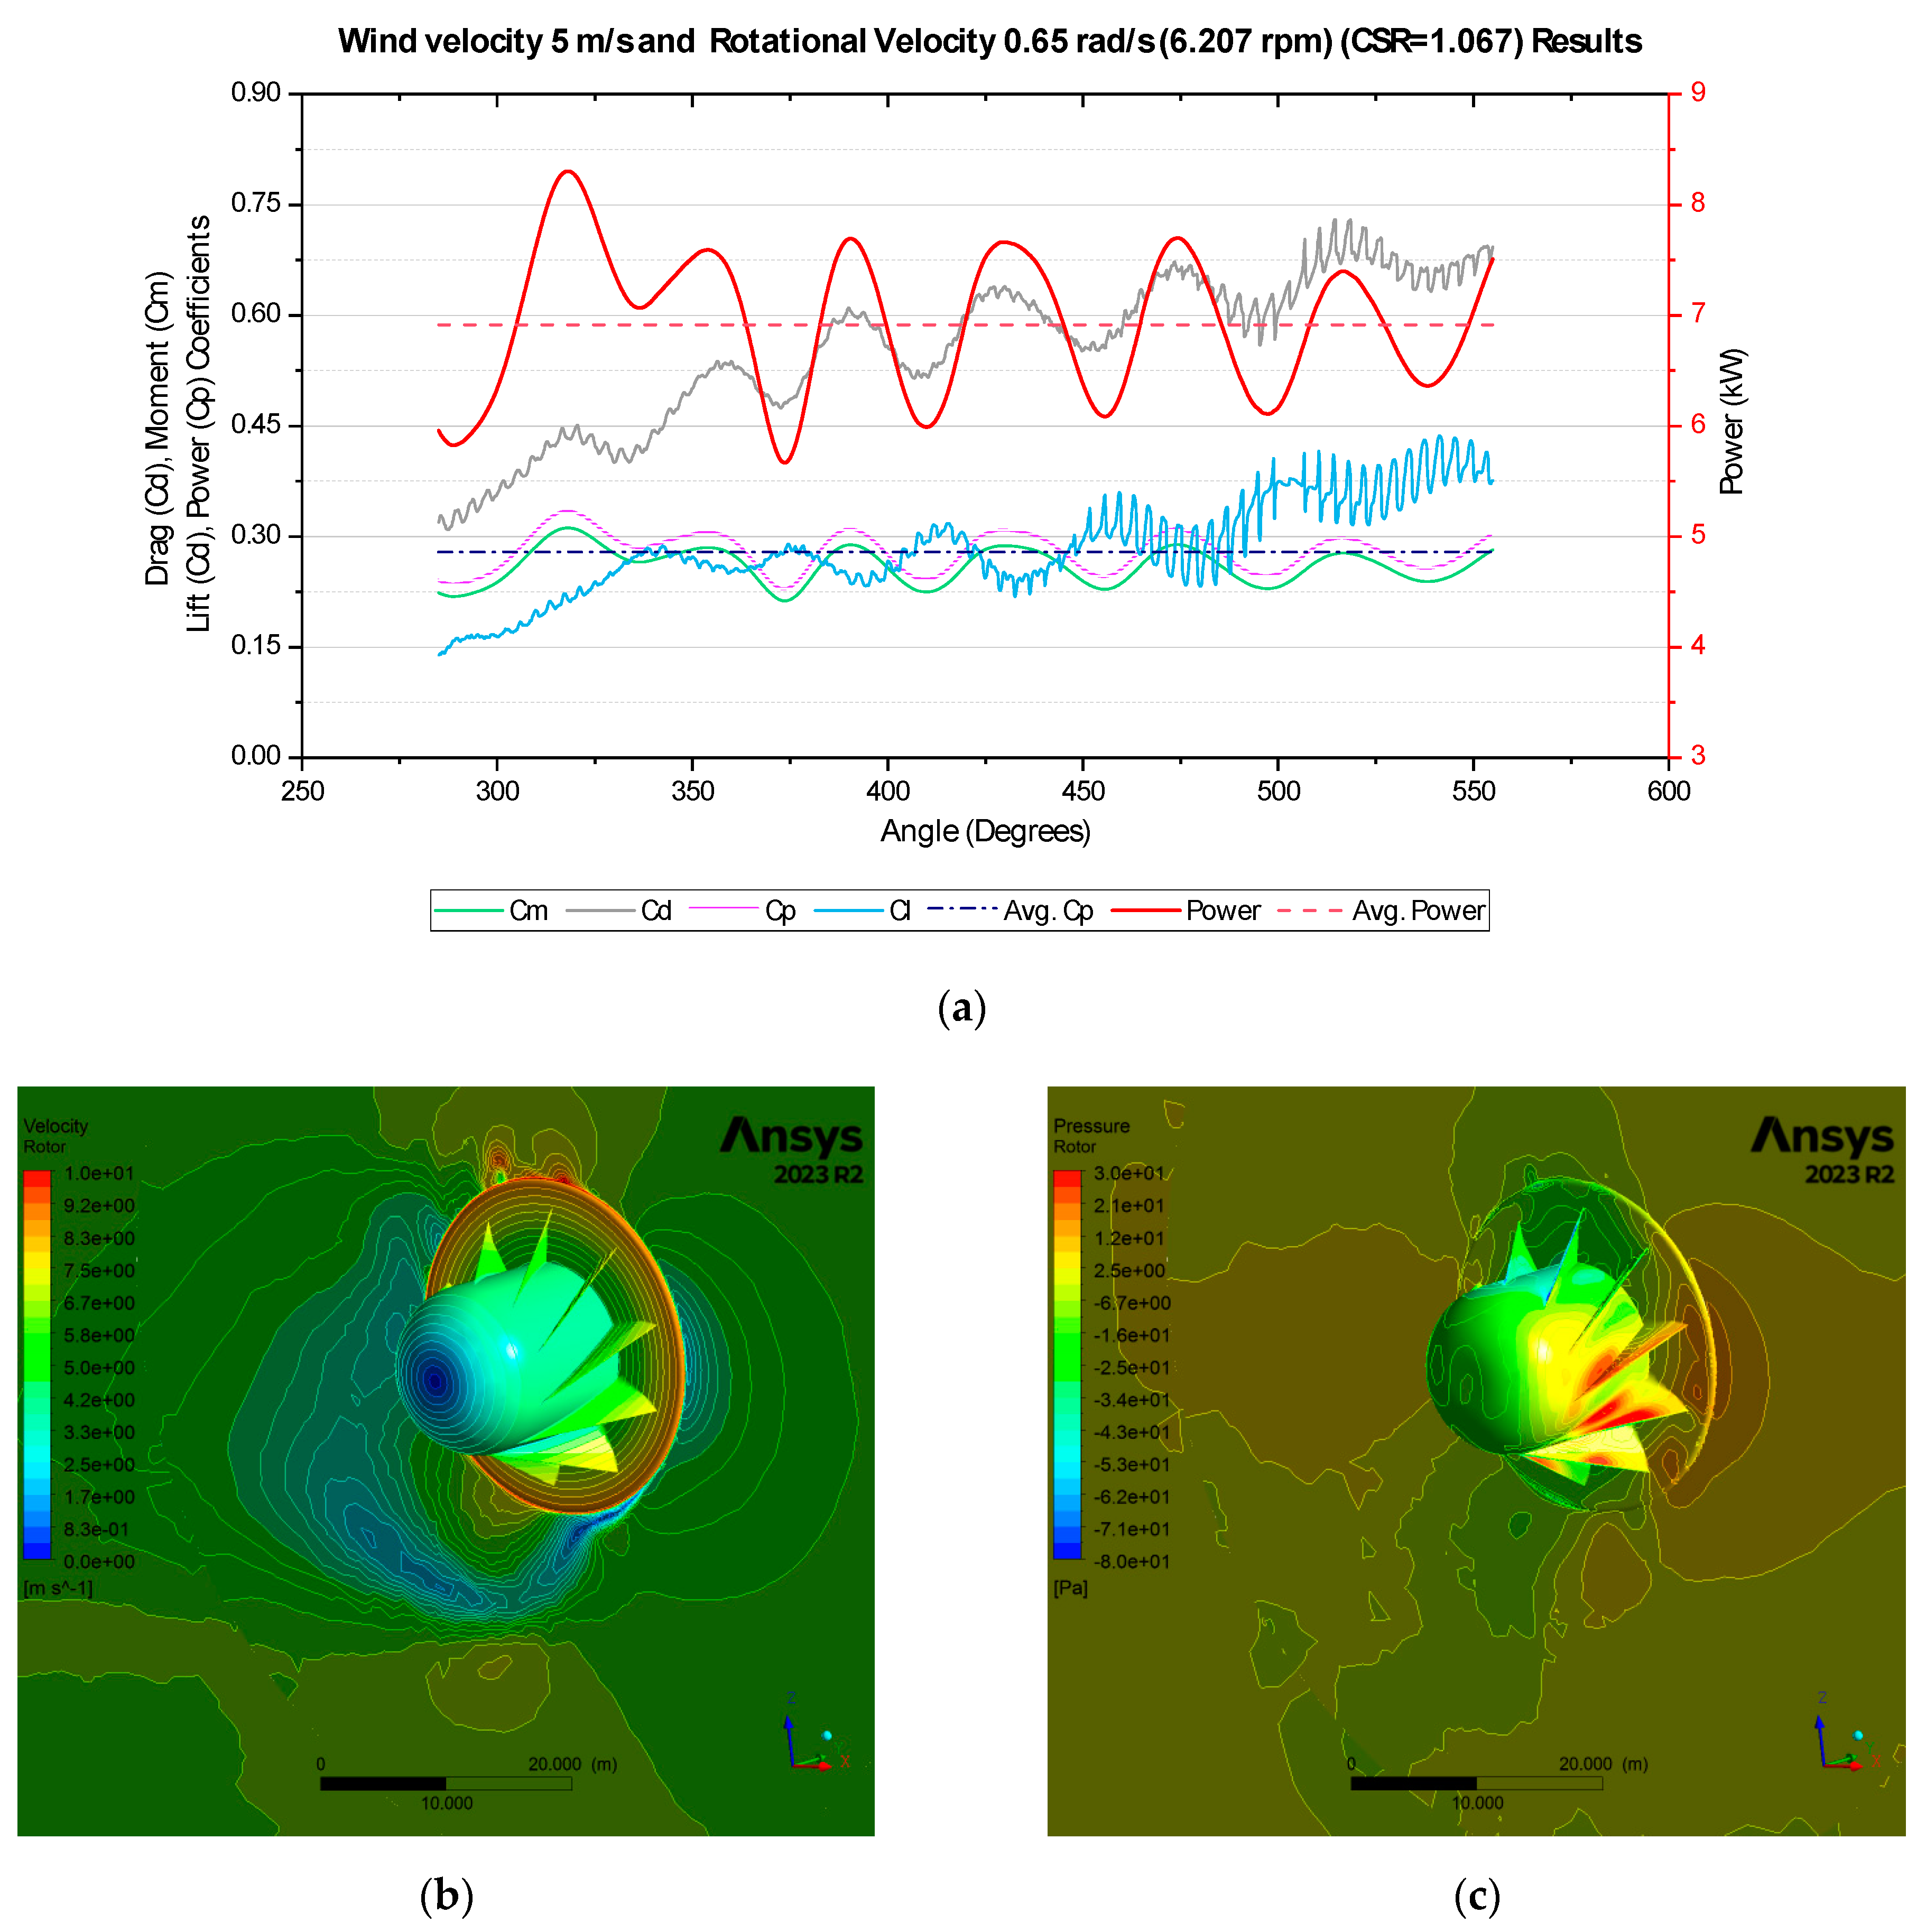
Our study presents two sets of results for the Centroid Speed Ratio (CSR) and rotational speed corresponding to a superficial wind velocity of 6 m/s. Wind velocities of 6 m/s are commonly observed on a large scale, ranging from 100 m to 150 m altitudes with reference to ground in Europe [
37]. The first set of results consists of a CSR value of 0.958, achieved with a rotational velocity of 0.70 rad/s (equivalent to 6.685 rpm). These results for CSR = 0.958 are comprehensively presented in
Figure 7.
Analyzing the variation of performance parameters in
Figure 7a concerning time and the instantaneous position of the rotor reveals that the estimated power potential ranges from 8 to 9.5 kW. Considering the total harvestable power of 43.1 kW, these values correspond to relatively low power coefficient values (Cp = 0.198).
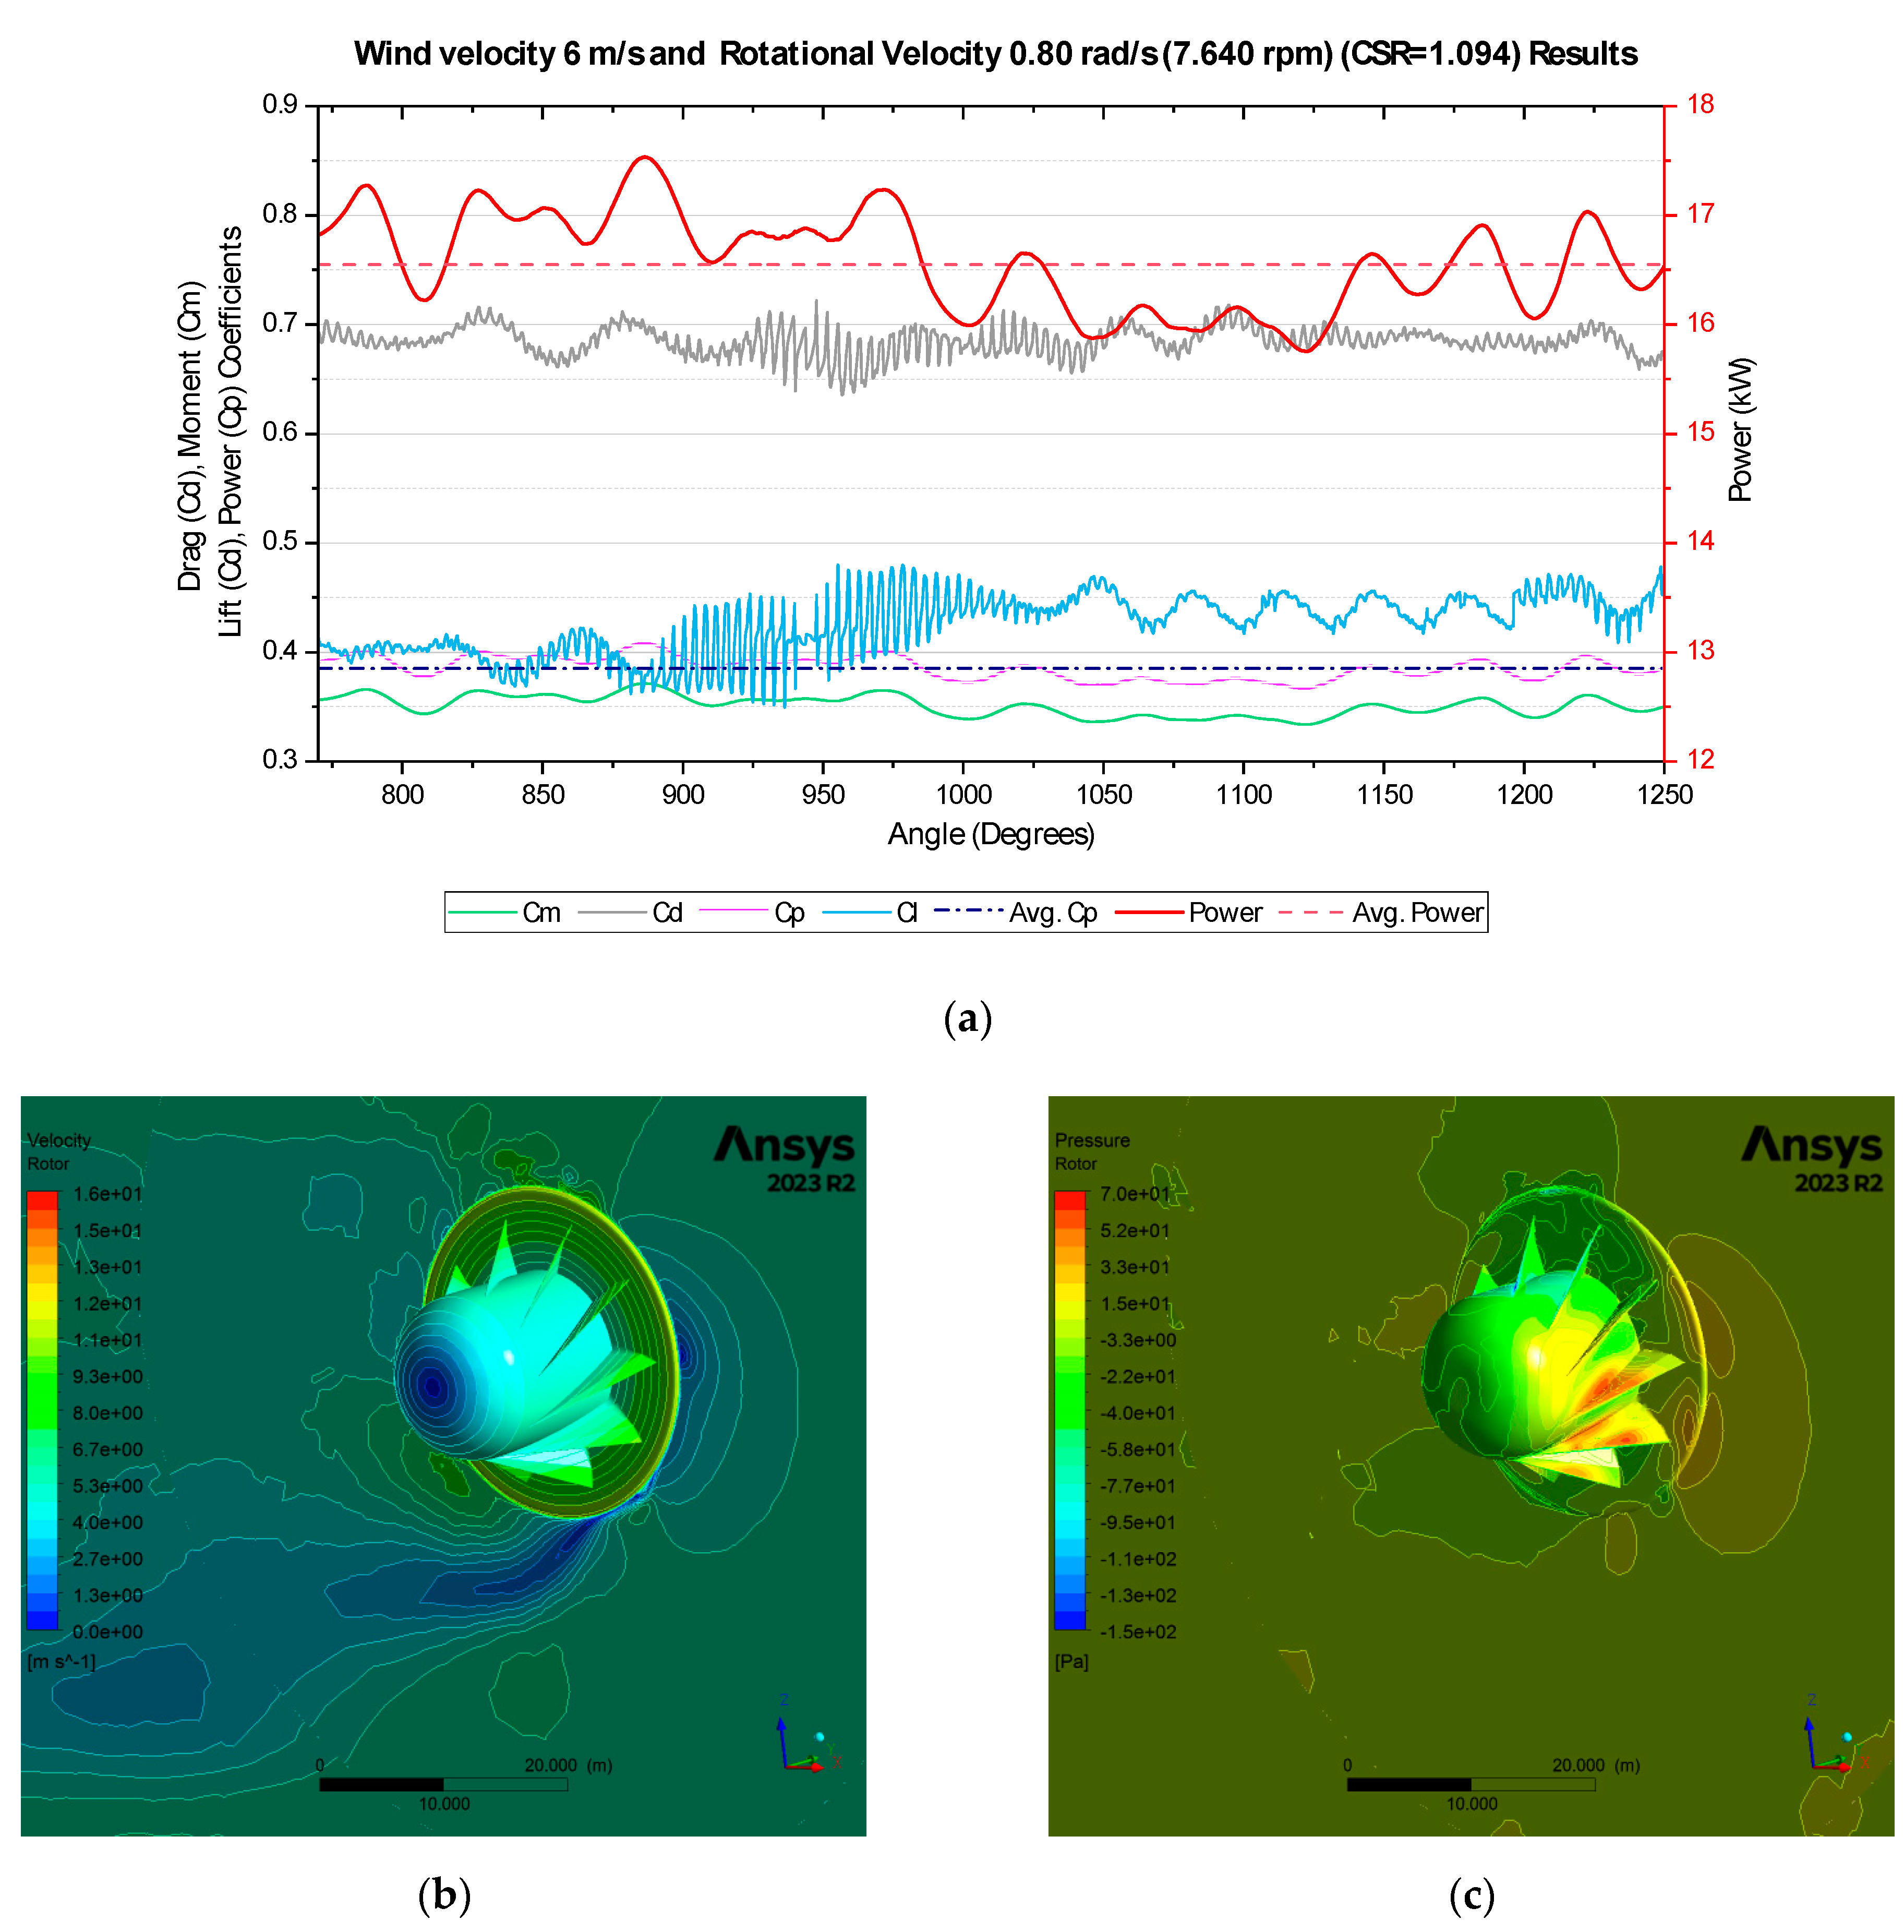
Therefore, a further case for a 6 m/s flat terrain velocity was assessed as a new scenario by incrementally increasing the rotational speed to explore instances with a higher Center Speed Ratio (CSR). The condition with a rotational velocity of 0.80 rad/s, applicable to the case with CSR = 1.094, was evaluated, and the results are similarly presented in
Figure 8.
According to the results depicted in
Figure 8, the instantaneous power obtained for a wind velocity of 6 m/s and a rotational speed of 0.8 rad/s ranges between 16.0 and 17.5 kW. The coefficient of performance (Cp) notably increased compared to the results obtained at 0.7 rad/s, averaging 0.384. The drag coefficient remained consistent with an average of 0.70, while the lift coefficient exhibited a slight increase due to the higher rotation speed, rising from the 0.43–0.45 range to 0.48.
The contour results reveal that, at lower rotational speeds for the same air velocity, the wake typically forms and translates in the upper rear part of the rotor. However, with increasing rotational speed, the wake may shift and become more pronounced in specific areas behind the rotor. Additionally, the wake extends further downstream due to the increased momentum of the airflow passing through the rotor.
These changes in the wake characteristics also influence the pressure distribution in the surrounding airflow. Examination of the static pressure demonstrates variations, often resulting in positive pressure observed on the blade surfaces, as expected. Specifically, for the 6 m/s results, this positive pressure ranges from 70 to 80 Pa, indicating the aerodynamic forces acting on the rotor blades.
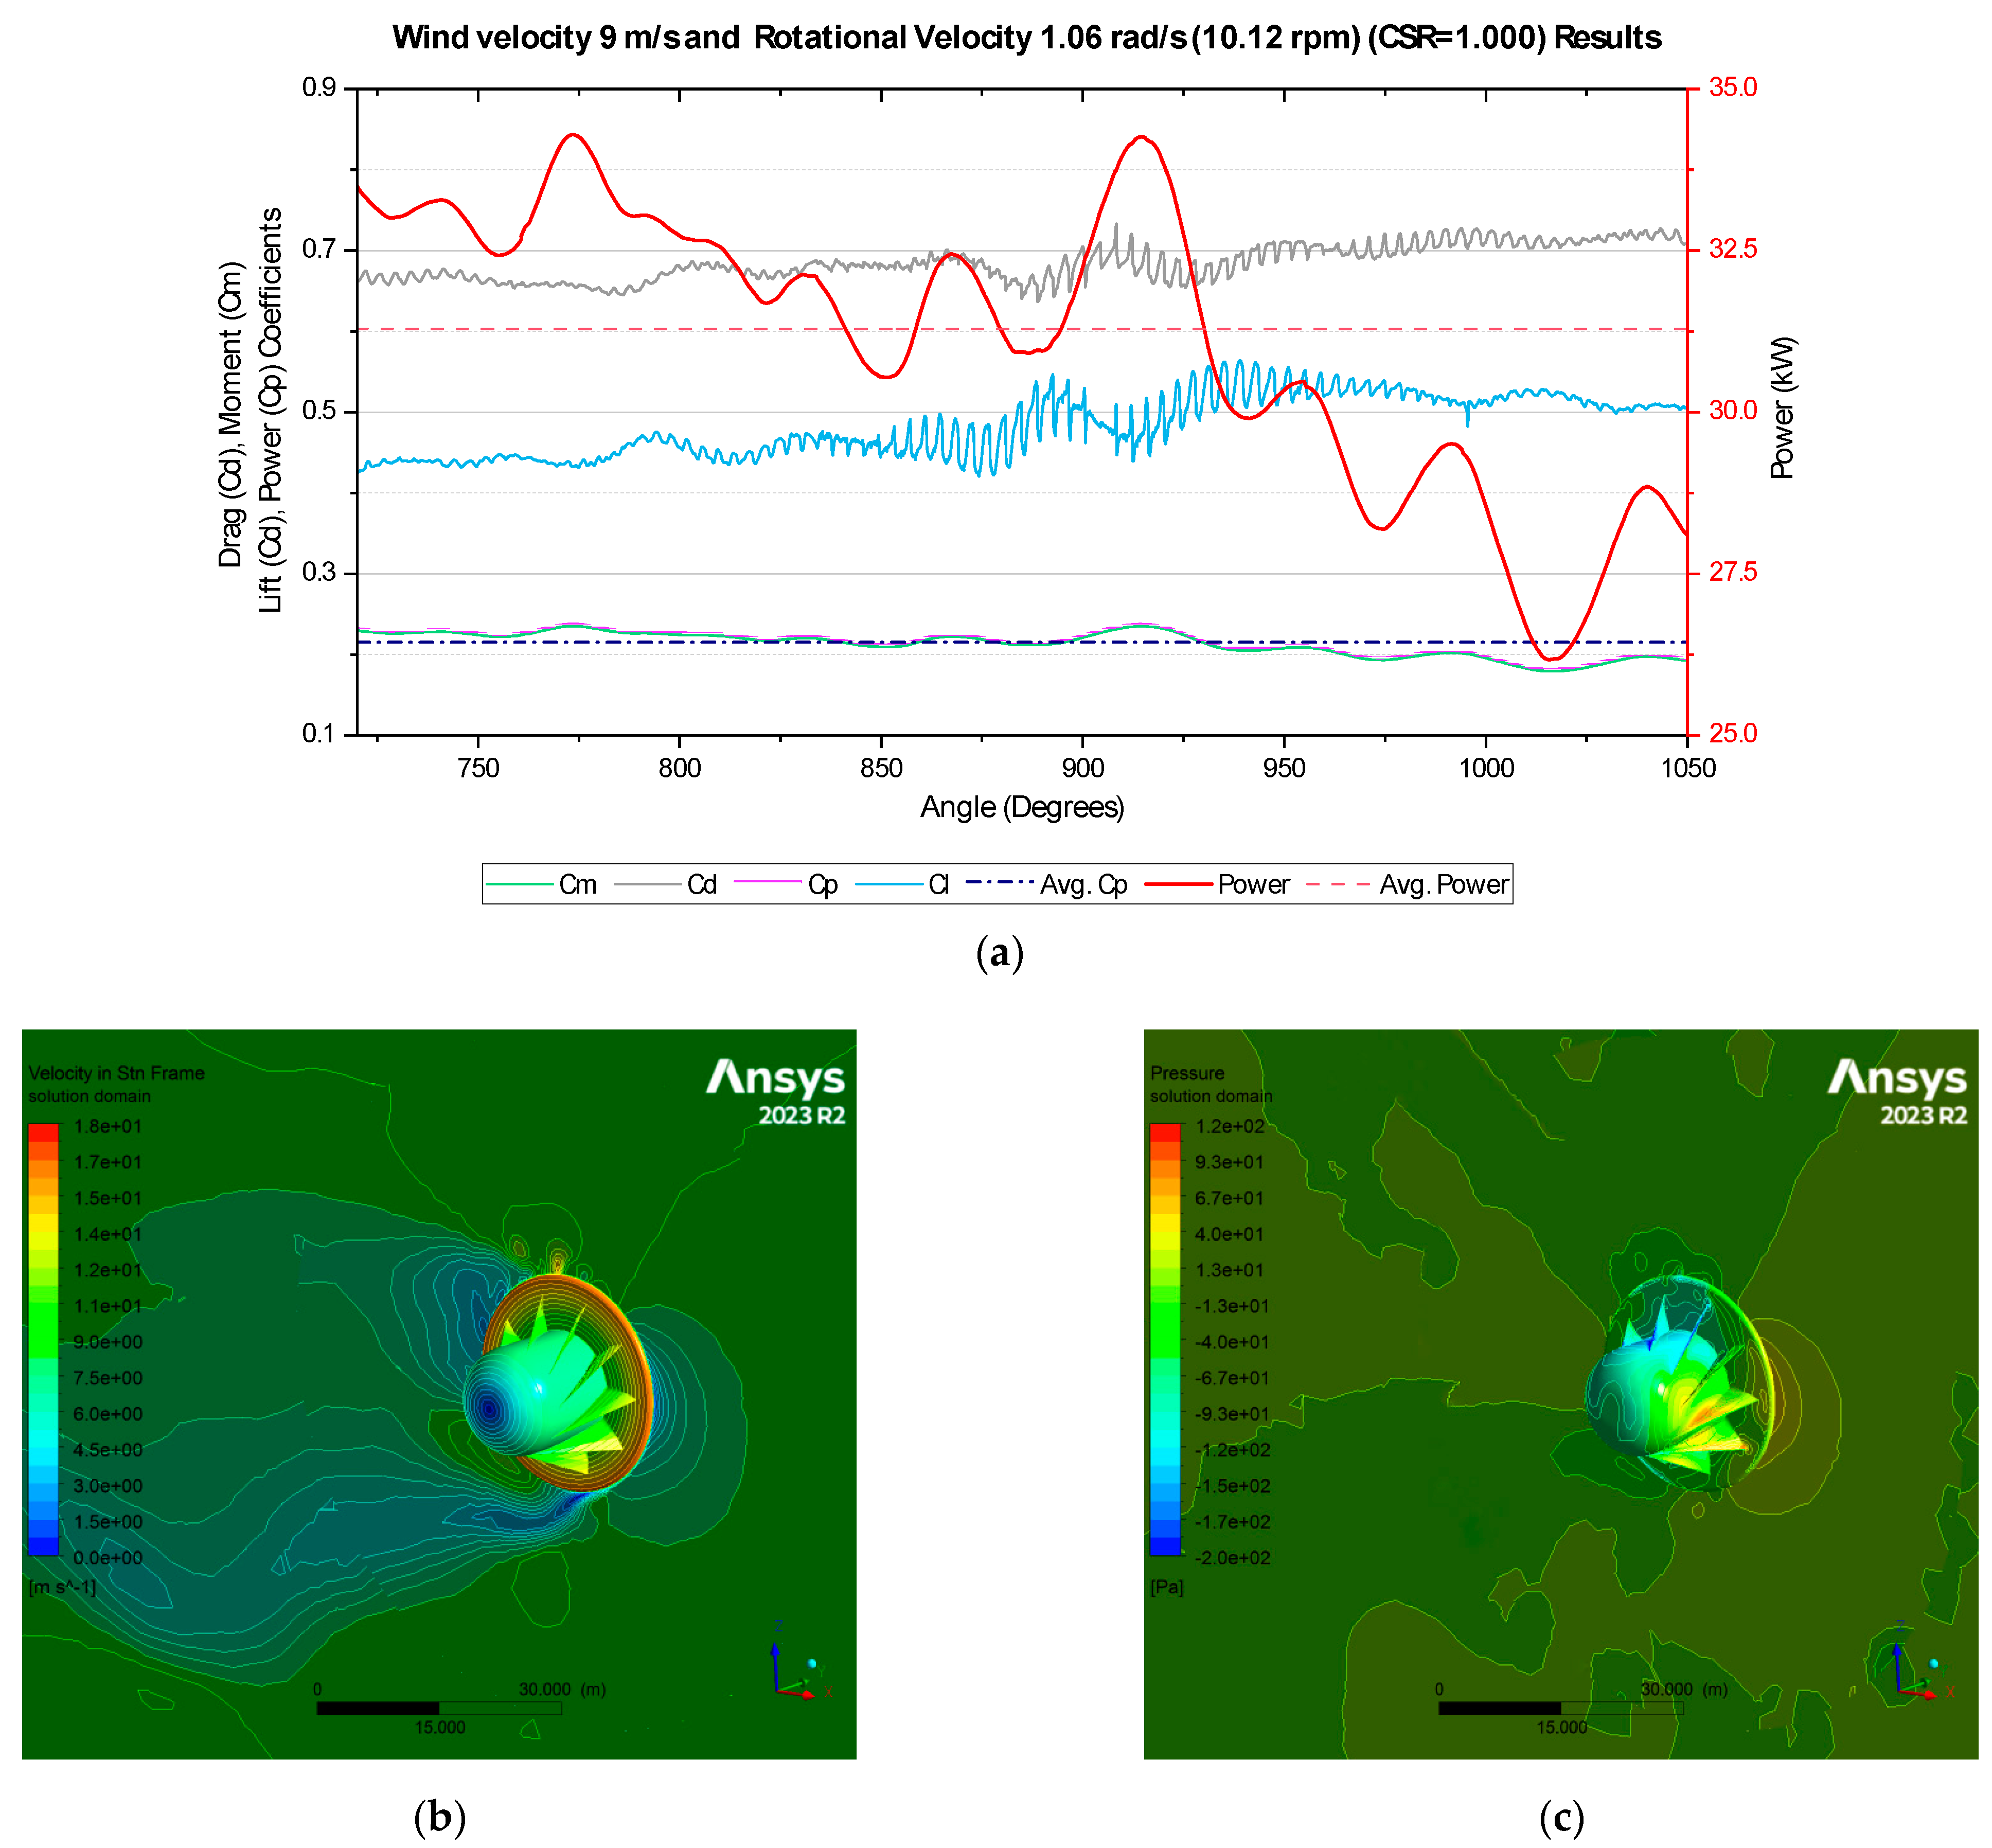
In this section, we present the results obtained for a wind velocity of 9 m/s. Wind velocities of 9 m/s are achievable onshore during specific periods, particularly at heights of 150 to 200 m and above ground level. Conversely, for offshore applications, this wind speed is commonly encountered, especially in regions like the North Sea [
37]. Wind speeds of this magnitude offer considerable energy potential, with a total harvestable energy estimated at 142 kW.
In this context, initial analyses were conducted with a rotational speed of 1.06 rad/s (equivalent to 10.12 rpm), corresponding to a Centroid Speed Ratio (CSR) of 1.00. The resulting outputs are presented in
Figure 9.
For a rotational velocity of 1.06 rad/s, it is observed that the obtainable energy varies widely, ranging from 26 to 33 kW, with an average of 31.3 kW. Consequently, the power coefficient is calculated to be 0.213. The drag coefficient remains consistent at 0.70, as observed in previous results.
A wide range of velocities is observed on the rotor surfaces, reaching up to 18 m/s. Additionally, the static pressure is measured at −200 Pa on the rear blade surfaces and at 120 Pa on the front surfaces.
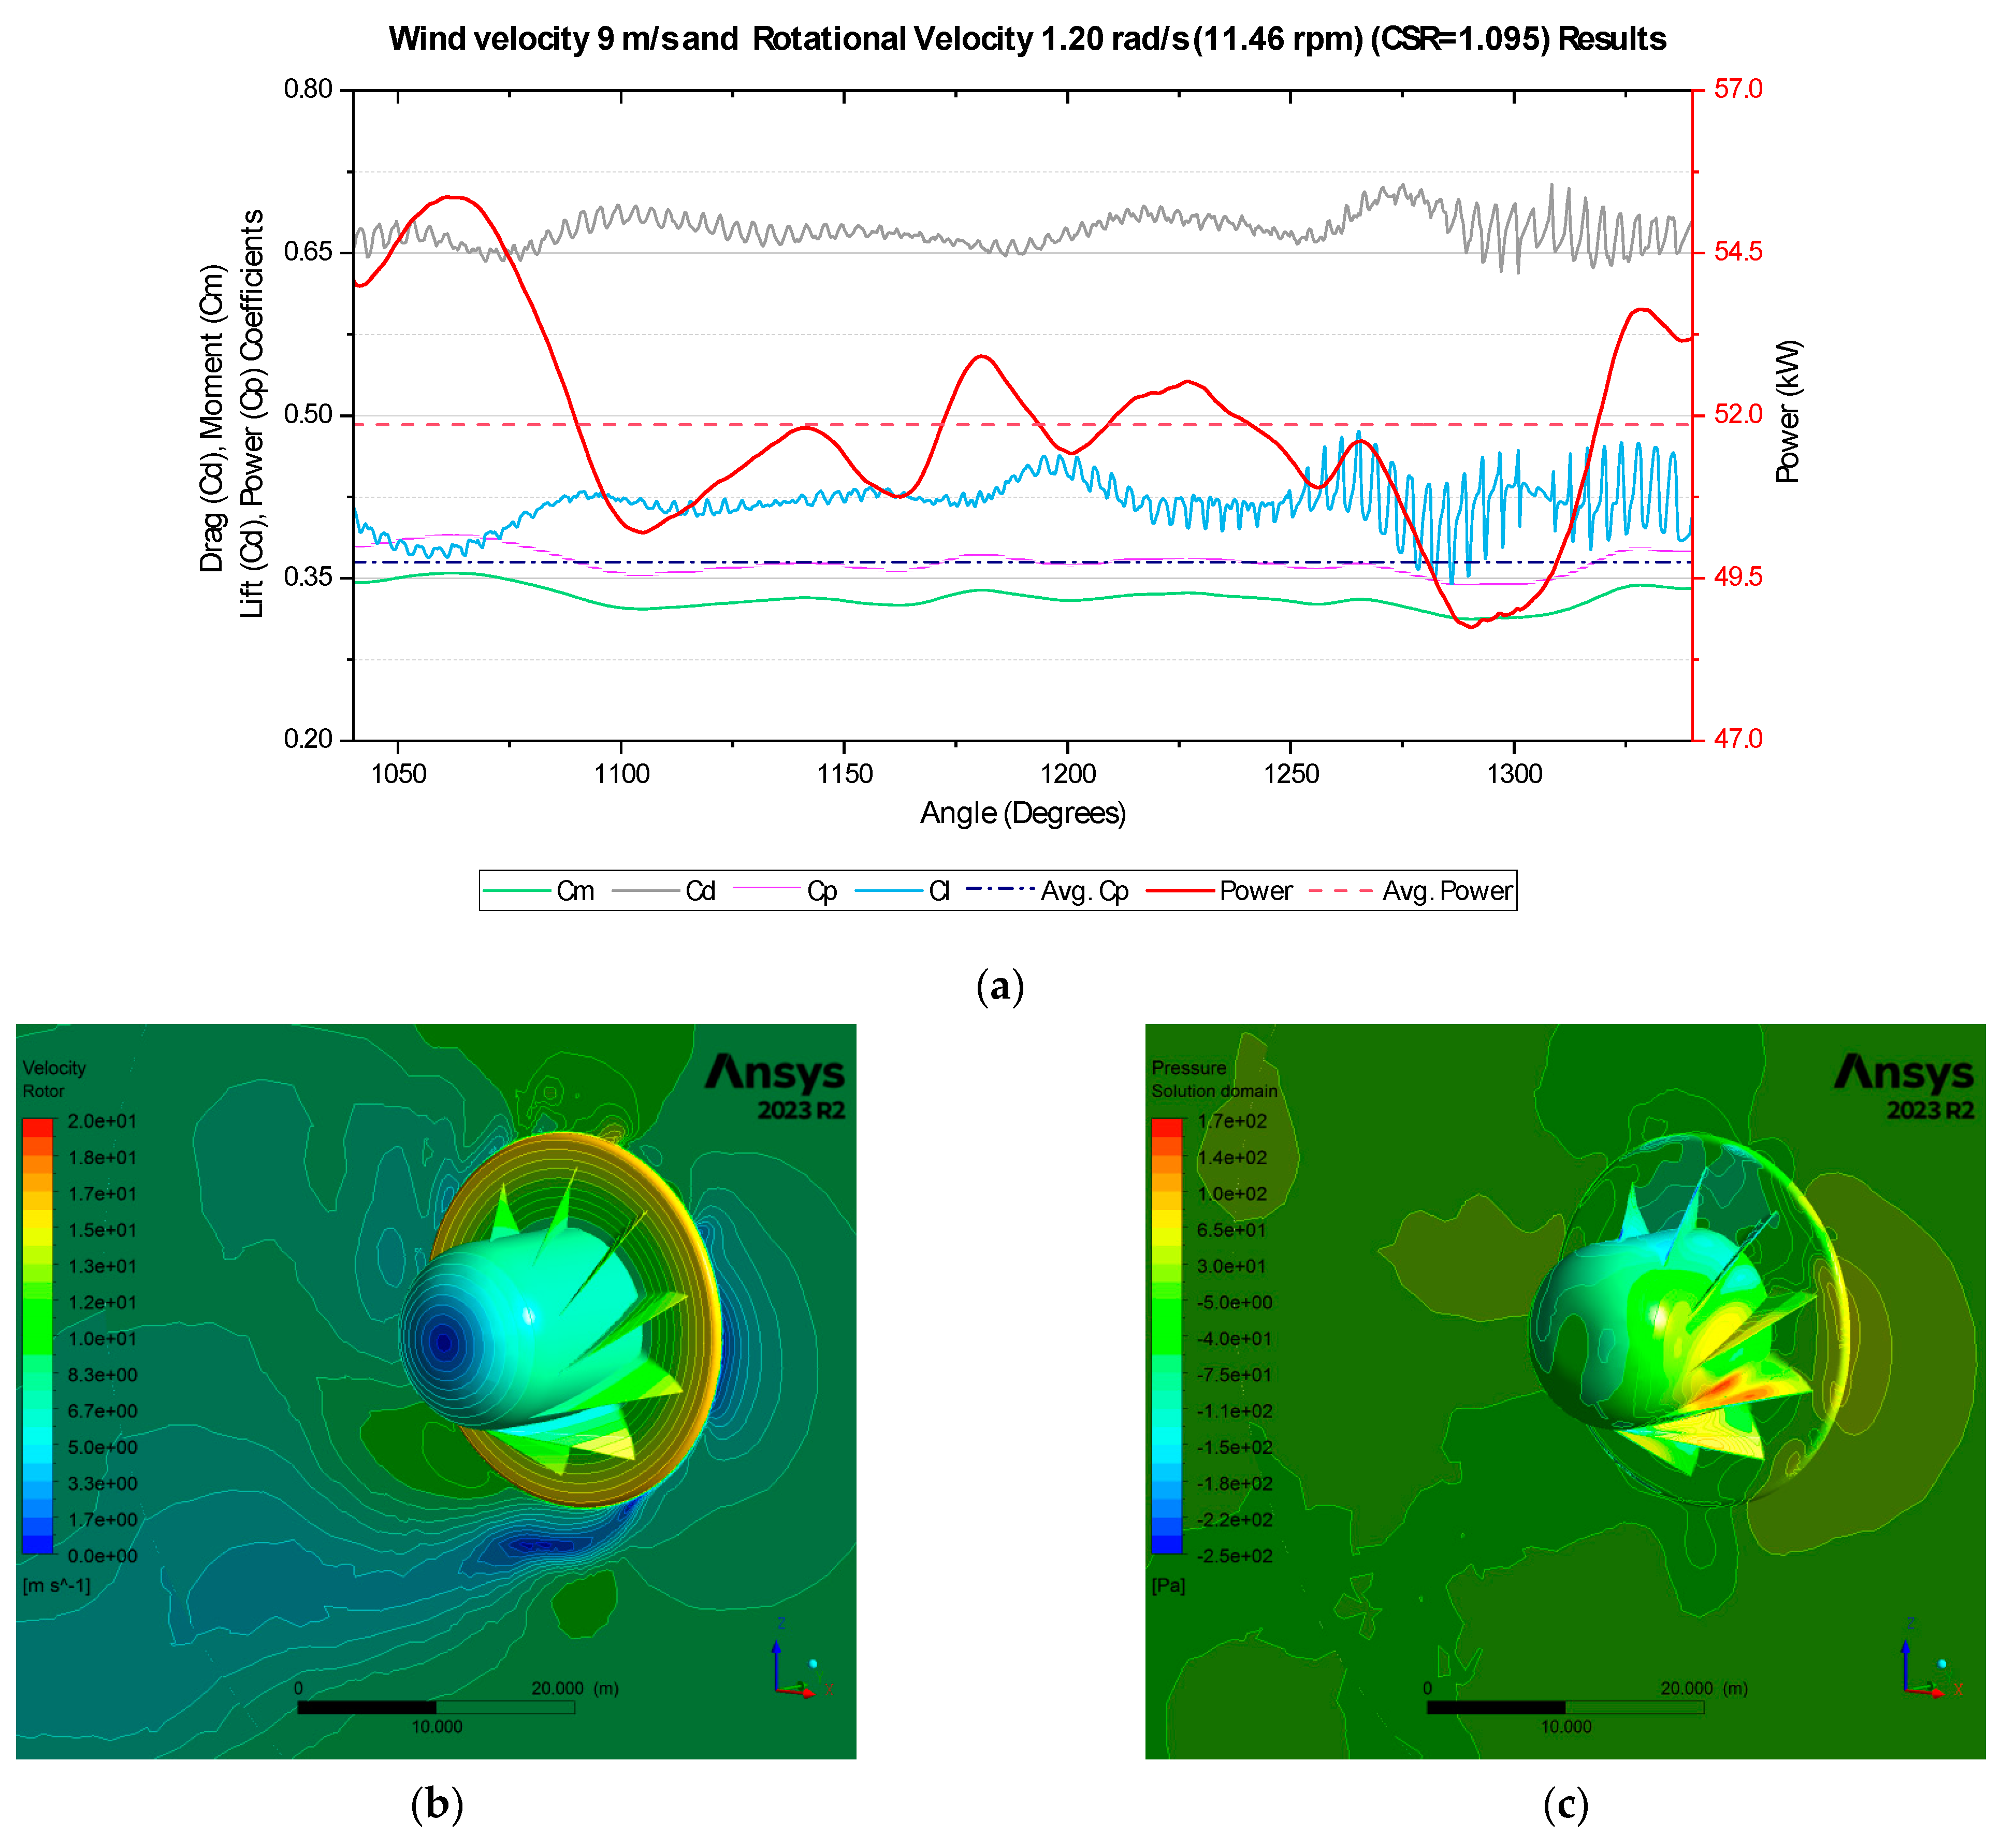
The case involving a rotational speed of 1.20 rad/s (rpm) for the same wind speed is analyzed as a subsequent step. The corresponding CSR value calculated for this case is 1.095. The results obtained for a rotation speed of 1.20 rad/s are presented in
Figure 10.
As depicted in
Figure 10, an increase in rotational velocity leads to a significant rise in the power coefficient, reaching 0.364, similar to the previous case. The estimated power obtained ranges between 48 and 55 kW. The drag coefficient remains constant at 0.70, while the lift coefficient stabilizes at approximately 0.40.
Similarly to the observations at 6 m/s, the heightened rotational speed causes a further downstream extension of the wake due to the increased momentum of the airflow passing through the rotor.
Furthermore, it was observed that as the rotational speed increased, the static pressure on the front surface of the rotor blades exceeded 170 Pa.
In our study, we evaluated the results for wind speed conditions of 12 m/s as the highest wind velocity scenario by extending our previous conference work [
31]. Wind speeds of 12 m/s can typically be observed in regions with favorable wind conditions, such as coastal areas or elevated terrains (>300 m above ground level). However, the availability of such high wind speeds may vary depending on the geographical location, local topography, and weather patterns.
A wind speed of 12 m/s is considered relatively high and falls within the category of strong winds. According to the Beaufort scale [
40], which classifies wind speeds based on observed effects on land and sea, 12 m/s corresponds to a Beaufort scale force of 6, indicating strong breeze conditions. Notably, such strong breeze conditions are unlikely to persist stably for extended periods.
However, despite the infrequency of stable 12 m/s wind conditions, it was essential to evaluate the performance of wind energy systems under such circumstances. This is particularly significant considering that the MARS airborne rotor system manufacturer provided estimated power output figures based on the rated 12 m/s wind speed. Therefore, in our study, we tested scenarios where 12 m/s wind speeds occur and analyzed the results accordingly.
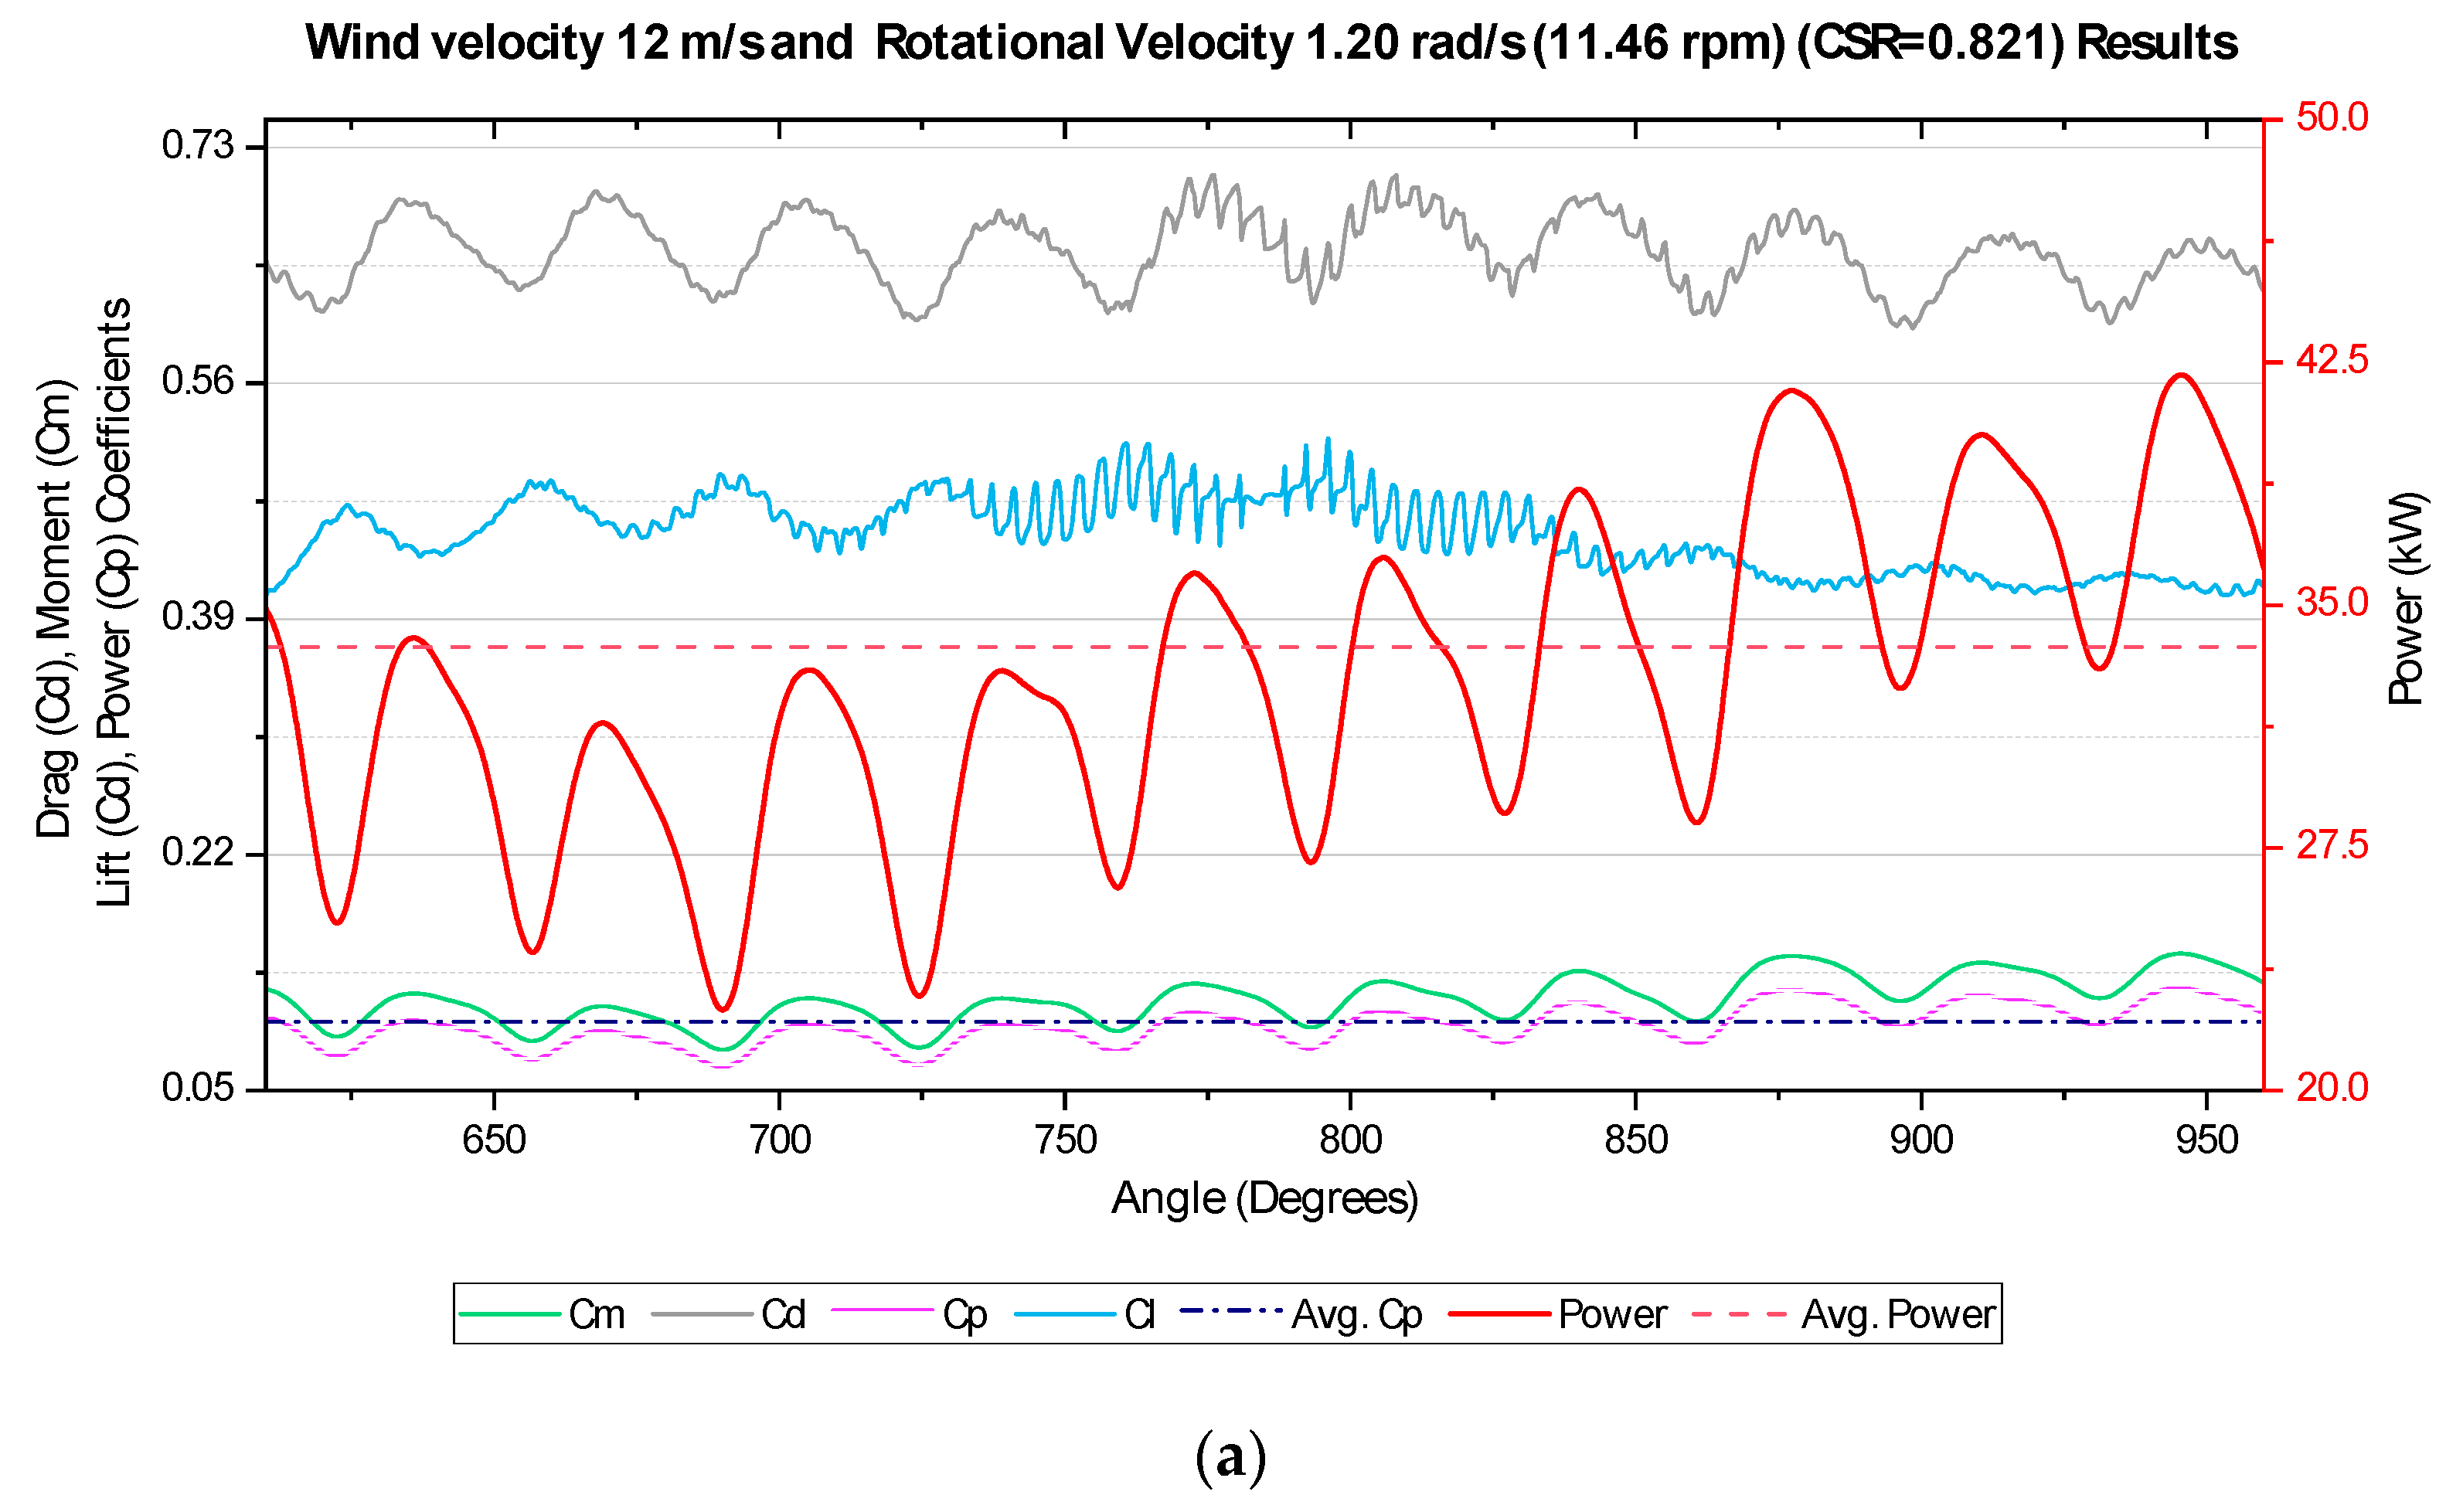
For a wind velocity of 12 m/s, the results obtained for a rotational speed of 1.20 rad/s (11.46 rpm) are depicted in
Figure 11.
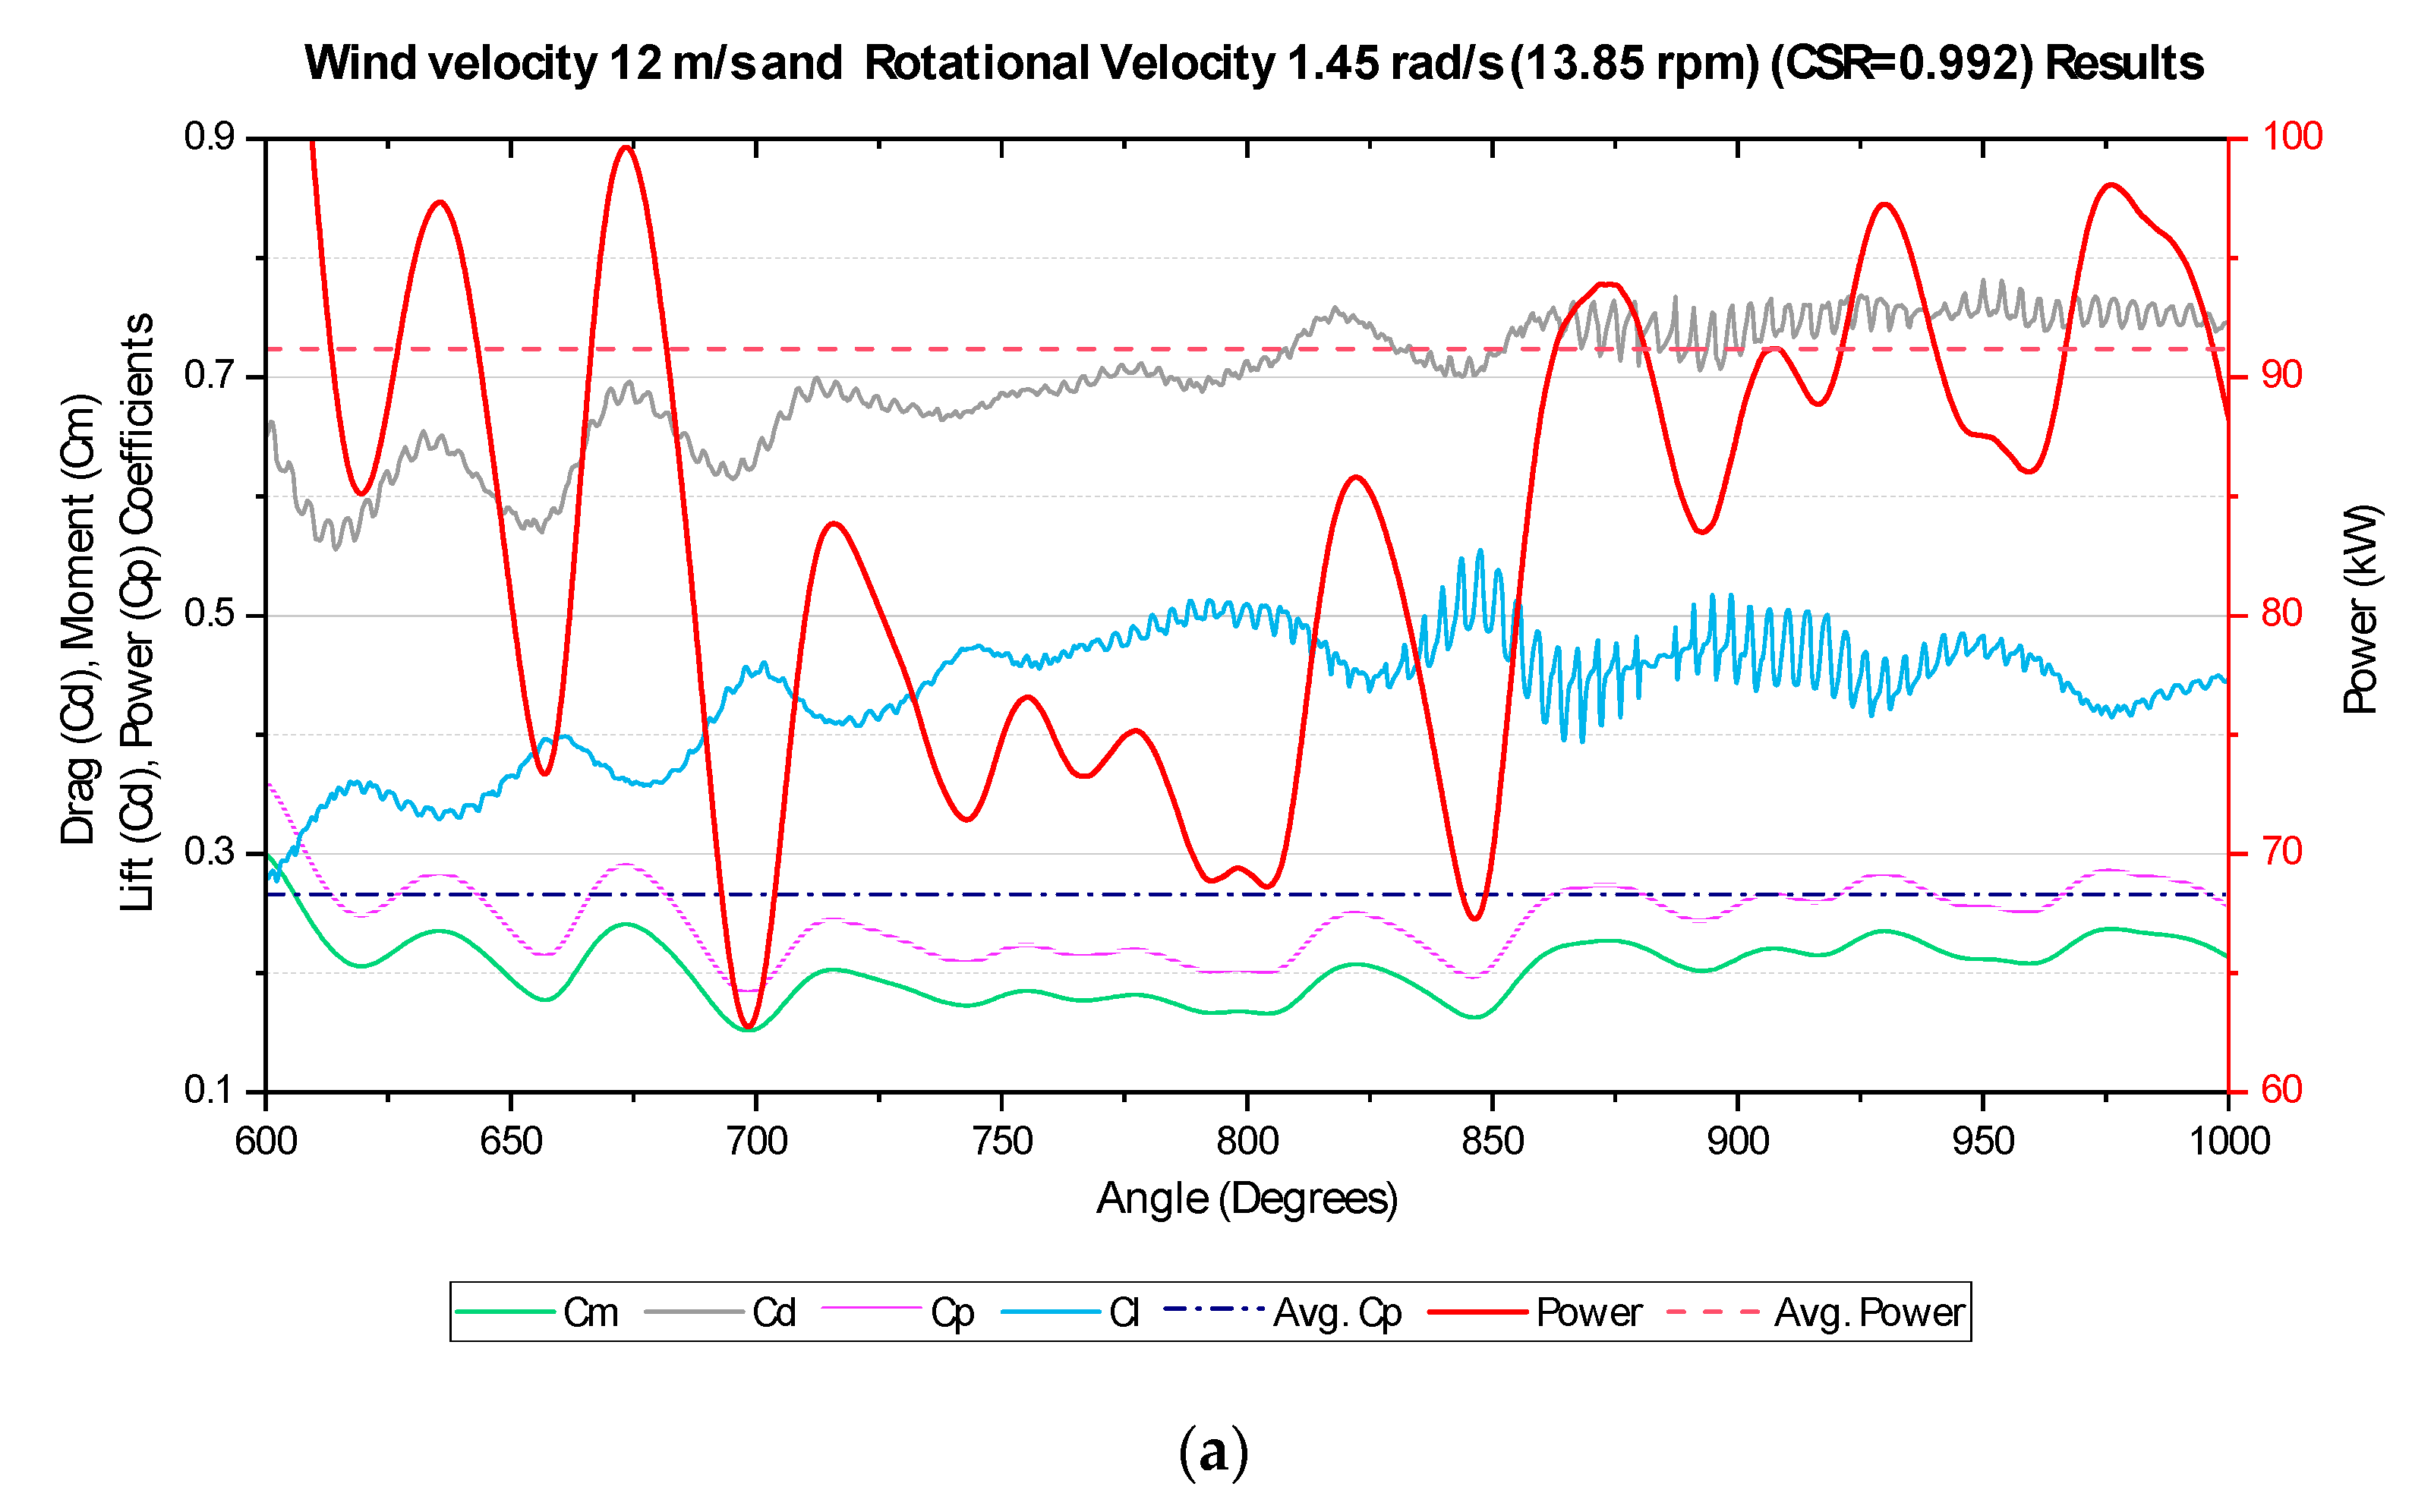
For a wind velocity of 12 m/s and a rotational speed of 1.20 rad/s (corresponding to CSR = 0.821), the power generation results exhibit a wide range, spanning from 23 to 43 kW. The average calculated power is 33.7 kW, which is relatively low considering the potential energy of 12 m/s air, estimated at 345 kW. The power coefficient is indirectly determined to be 0.098, marking the lowest value in our study. Therefore, to explore cases with higher CSR values, the scenario involving a rotational speed of 1.45 rad/s (CSR = 0.992) was also examined, and the results are illustrated in
Figure 12.
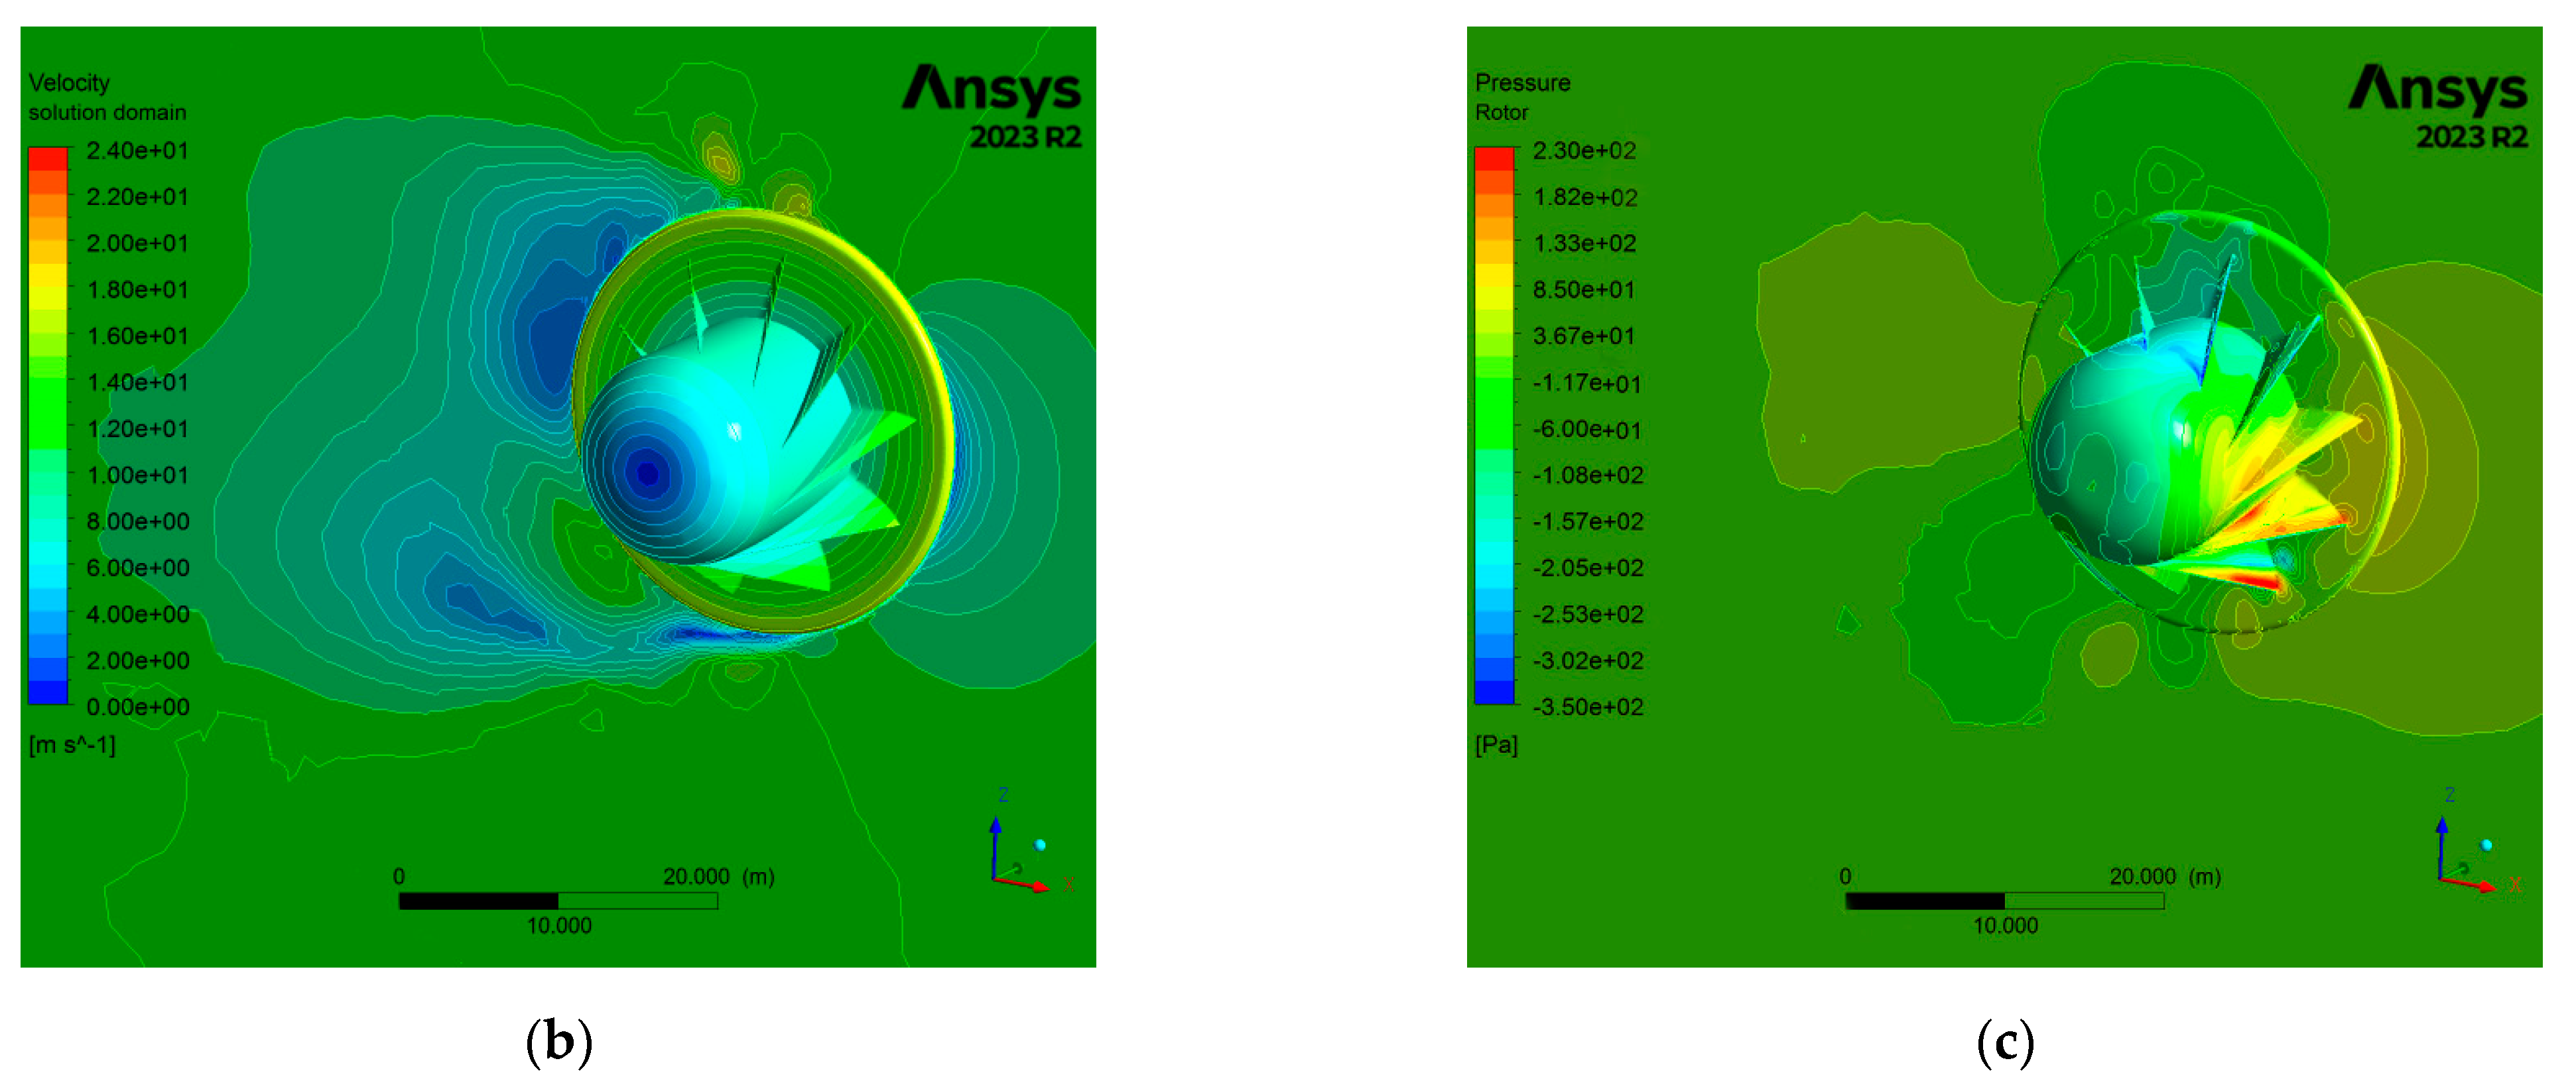
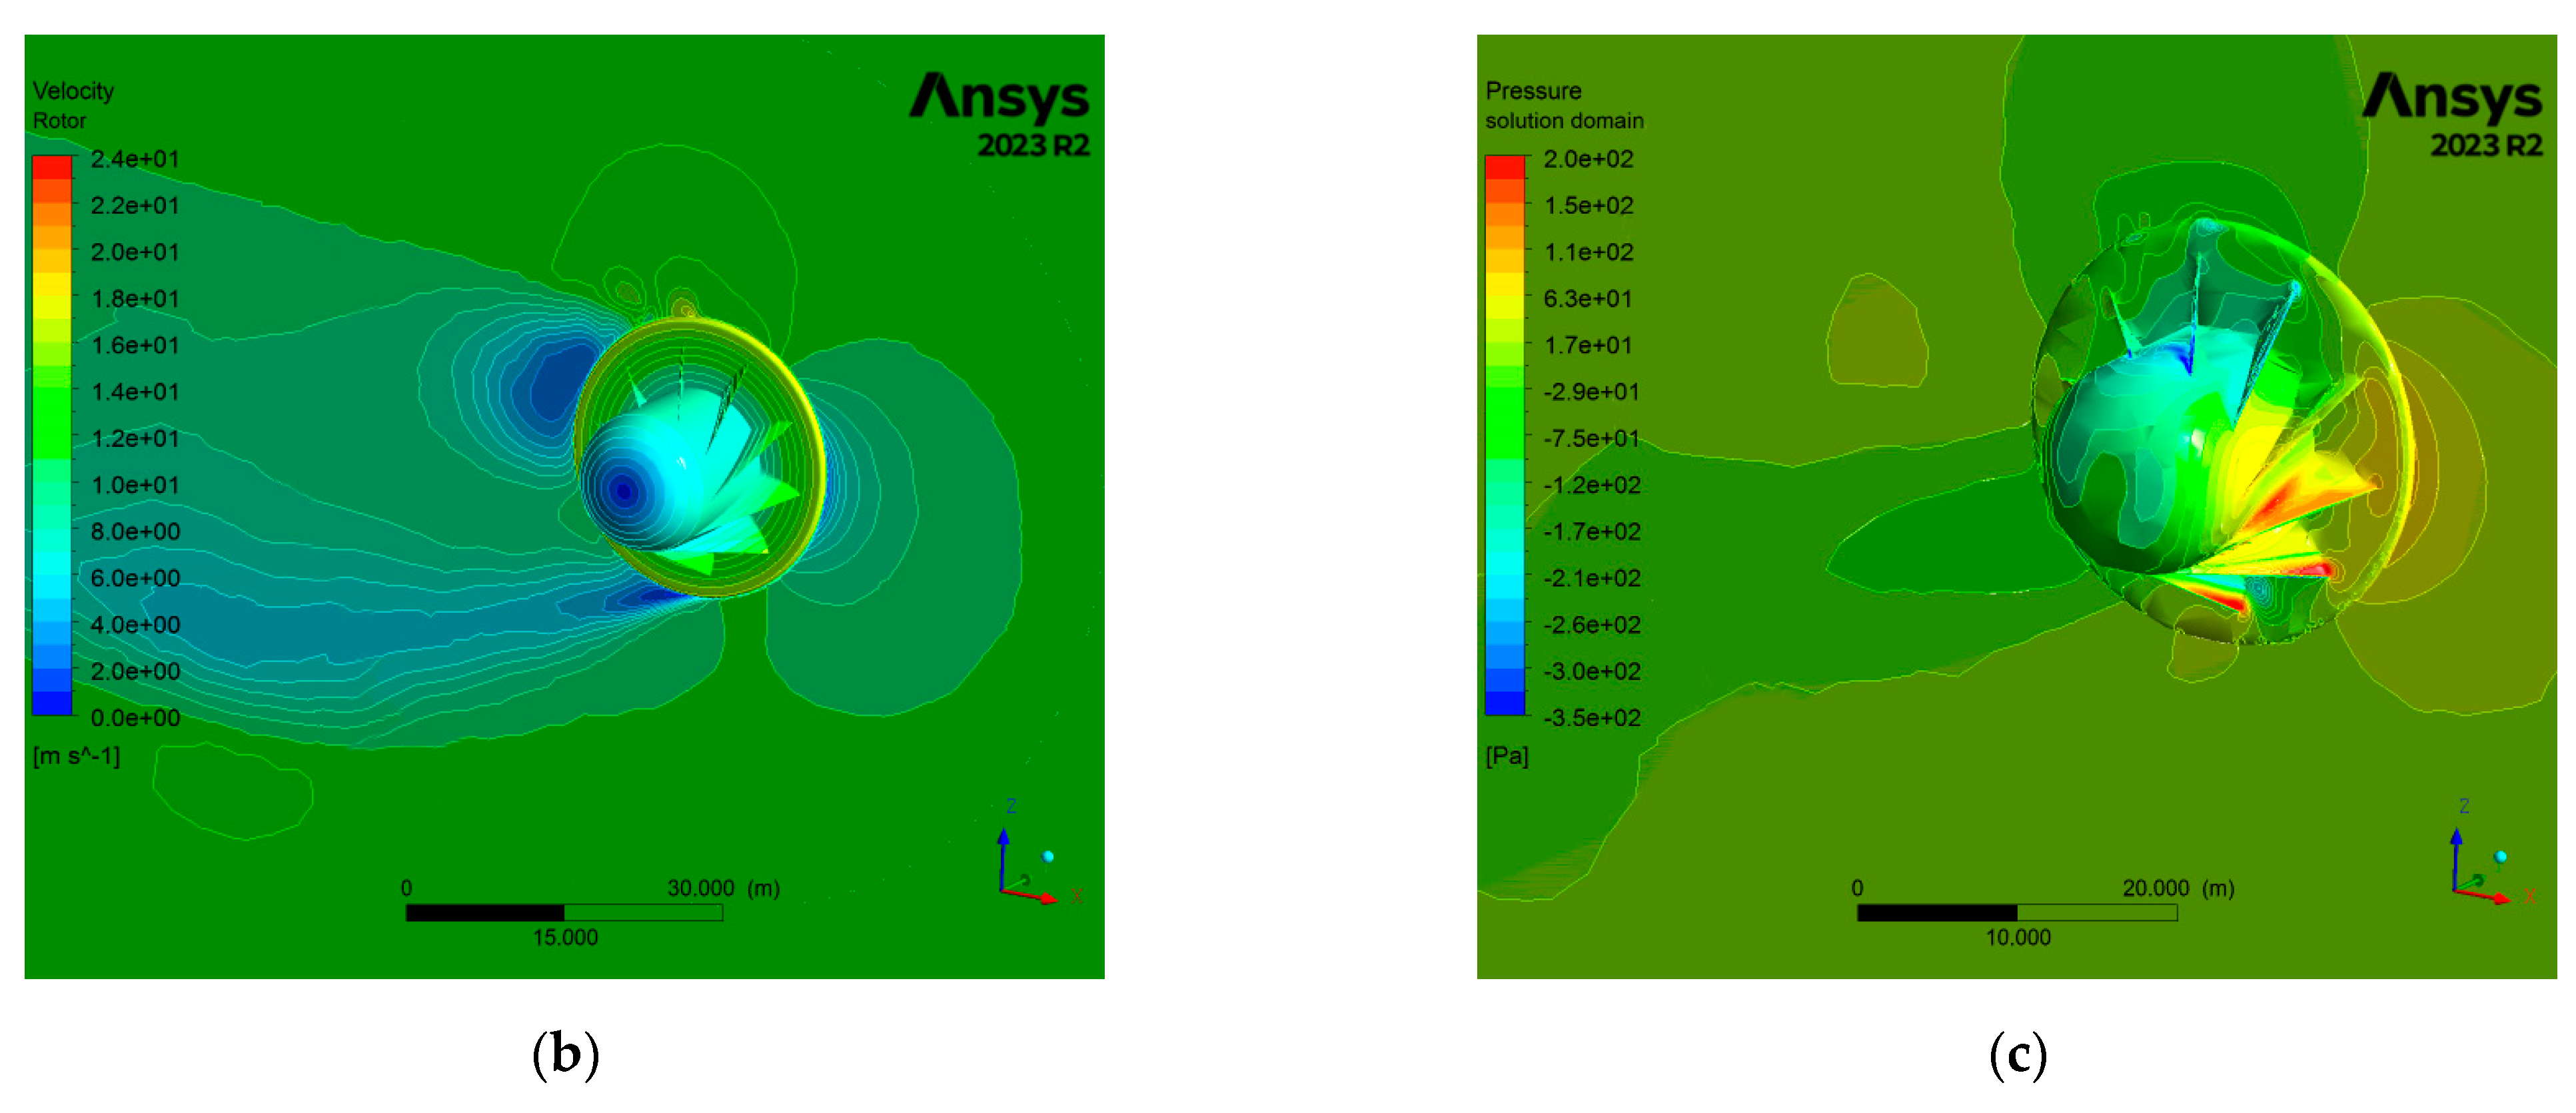
As anticipated, the increase in rotational speed corresponded to a rise in potential power output. The estimated power generation ranged between 70 and 100 kW, aligning with the rated energy output of 100 kW provided by the patented manufacturer of the MAGENN Airborne Rotor System (MARS). However, it is worth noting that achieving stable wind speeds of 12 m/s poses a significant challenge for the project.
Furthermore, with higher wind speeds and rotation rates, the lift coefficient exceeded the 0.50 threshold, slightly surpassing values observed in previous cases, which typically ranged between 0.40 and 0.45. Similarly, the drag coefficient also showed a slight increase, hovering slightly above 0.70.
Another noteworthy observation from the contour plots is the elongation of the wake behind the rotor with increasing wind speed. This phenomenon arises from the accelerated airflow, creating a larger disturbed air zone downstream, which persists longer. This correlation between wind speed and wake behavior underscores the complex nature of airflow dynamics around airborne rotor systems.


