
PVA-Based Nanofibers Containing Chitosan Modified with Graphene Oxide and Carbon Quantum Dot-Doped TiO2 Enhance Wound Healing in a Rat Model
 , ,
, ,  and
and
Abstract
:1. Introduction
2. Material and Methods
2.1. Chemicals and Materials
2.2. Synthesis of Nanoparticles
2.2.1. CQD Synthesis by Hydrothermal Method
2.2.2. Synthesis of Graphene Oxide (GO)
2.2.3. Indirect CQD-TiO2 Synthesis Method
2.2.4. GO-CQD-TiO2 Synthesis Method
2.2.5. CS-GO-CQD-TiO2 Synthesis Method
2.3. CS-GO-CQD-TiO2 NC Electrospinning Process
2.4. Cross-Link Process of Nanofibers
2.5. Morphological, Chemical, and Microstructural Characterization
2.6. Static Water Contact Angles (WCA)
2.7. Degradability of CS-GO-CQD-TiO2
2.8. Antibacterial Properties of CS-GO-CQD-TiO2 Nanofibers
2.9. Cytotoxicity Induced by CS-GO-CQD-TiO2 Nanofibers
2.10. Tensile Strength and Elongation Tests
2.11. Cell Migration Inhibition Study by Scratch Wound Assay
2.12. Animal Study
2.13. Histological Analysis
2.14. Statistical Analysis
3. Results and Discussion
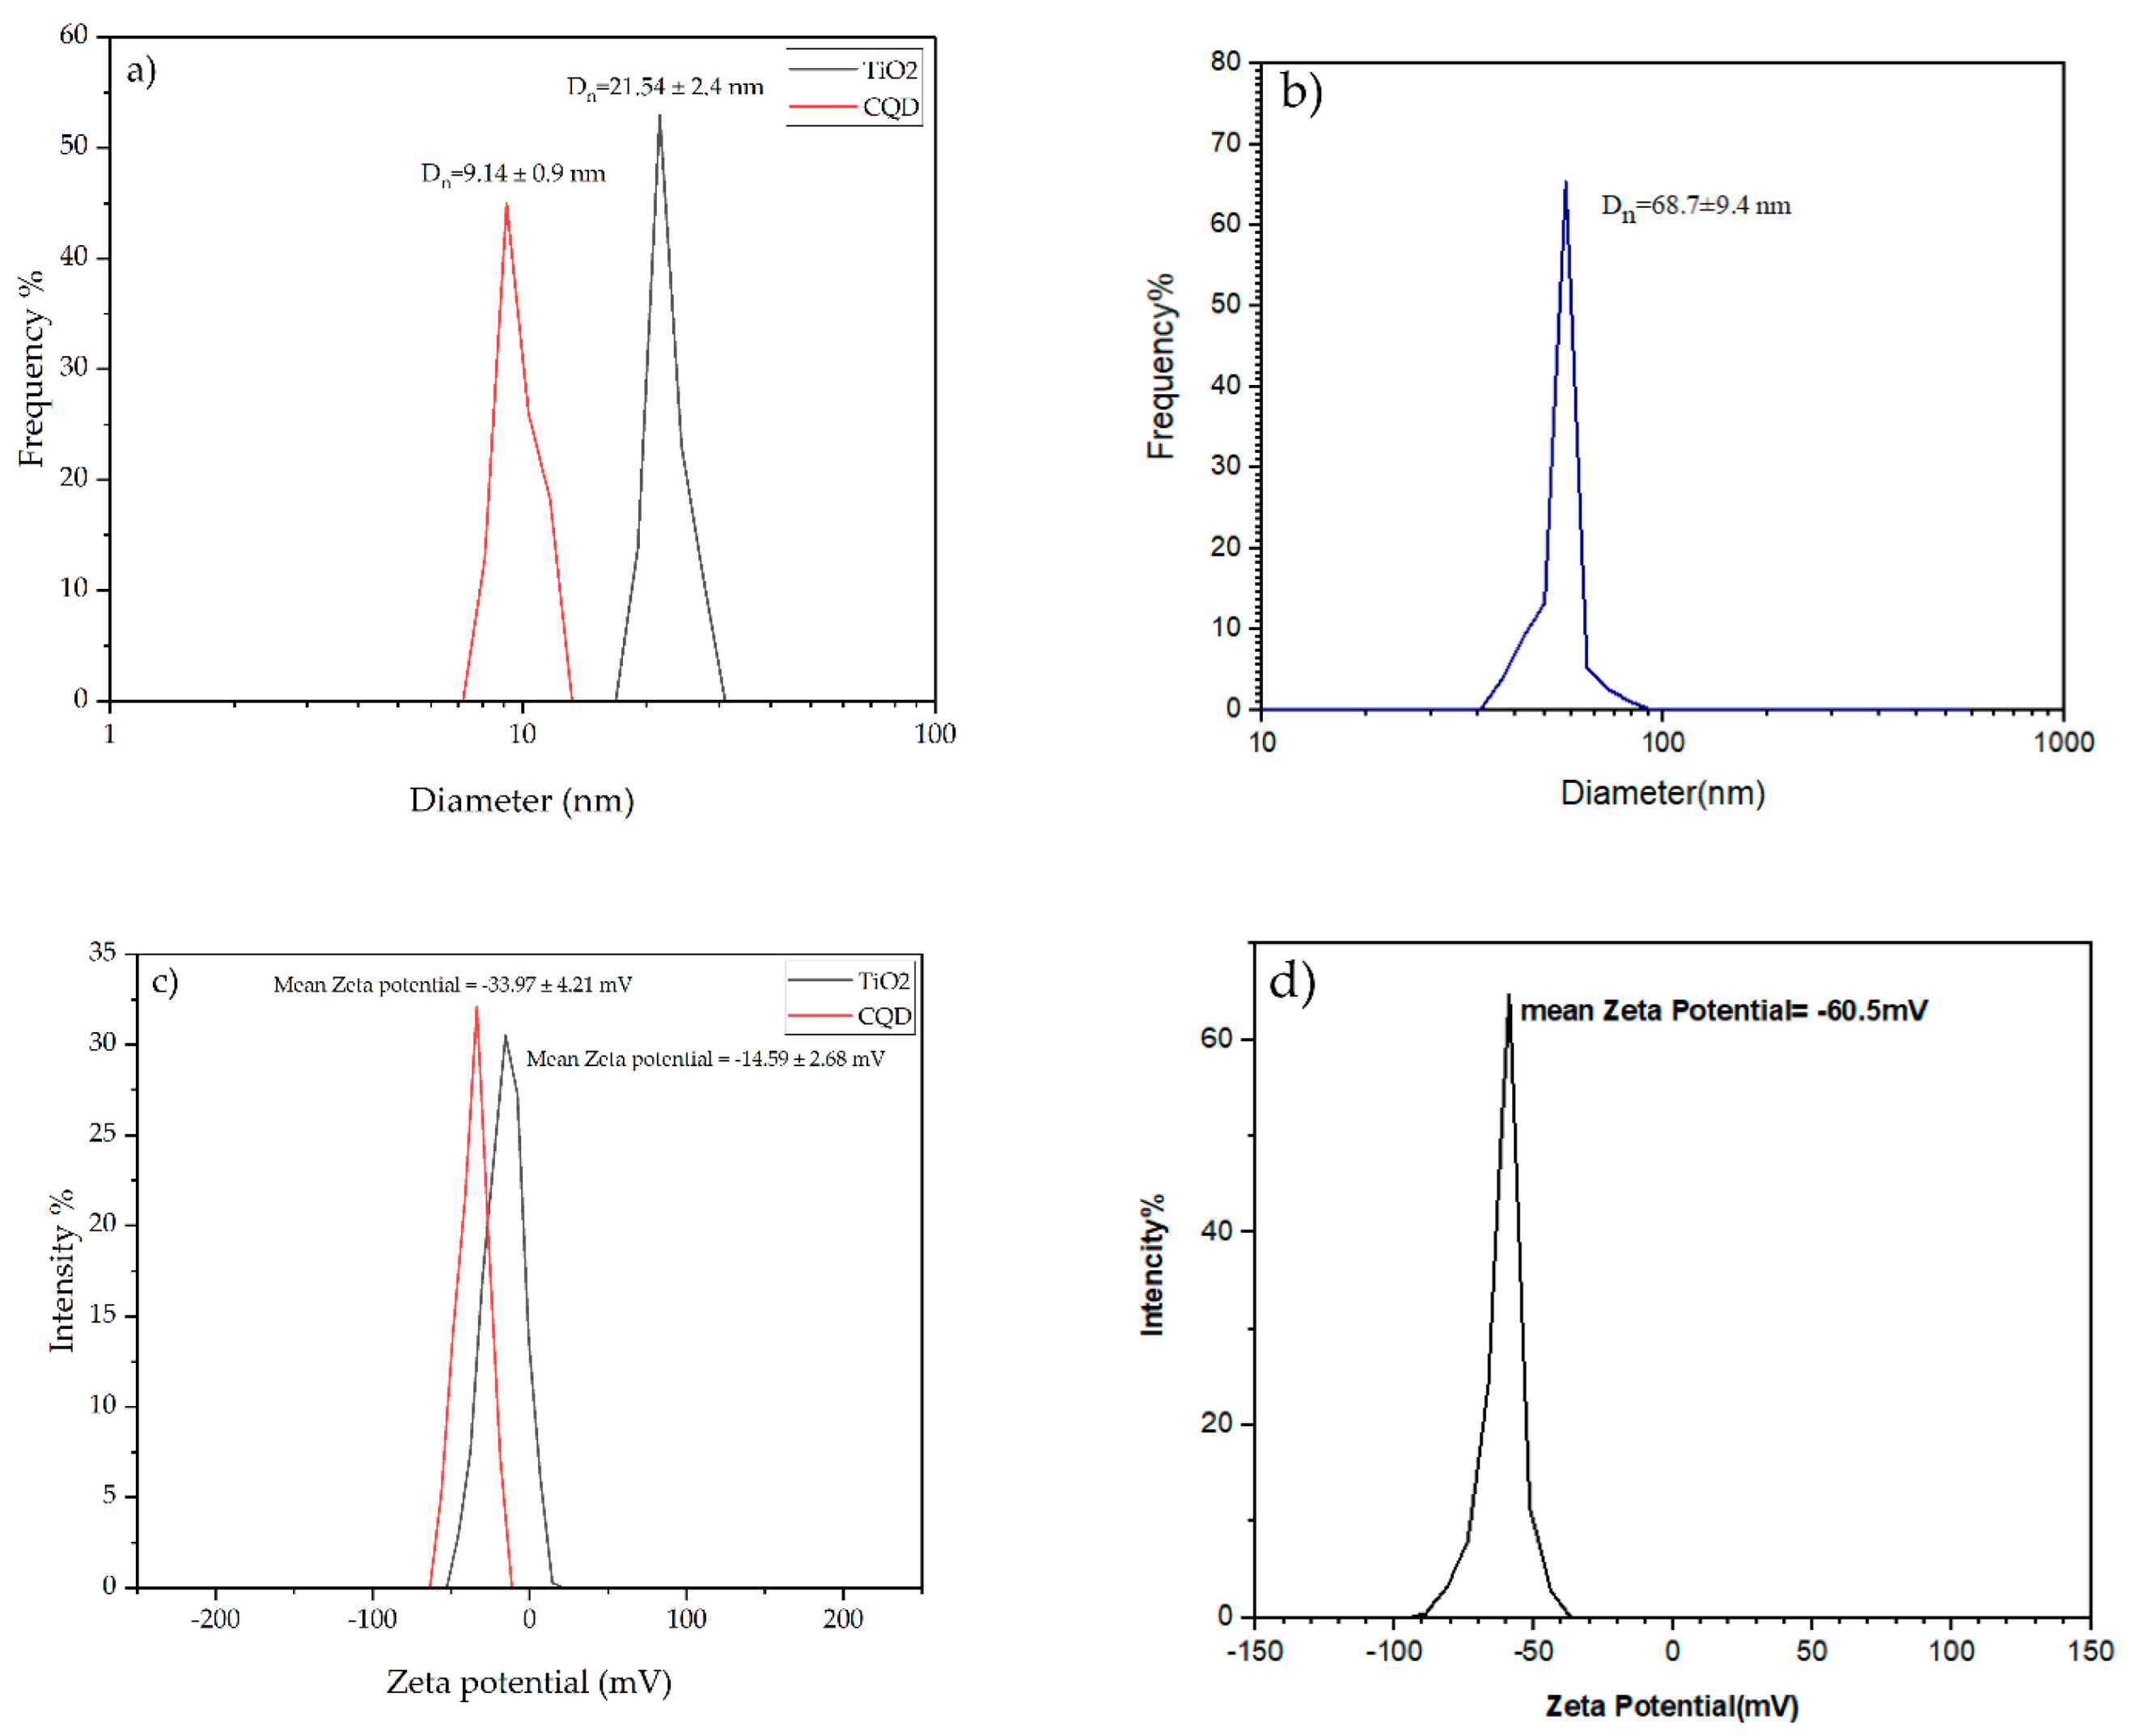
3.1. Particle Size and Zeta Potential of CQD-TiO2
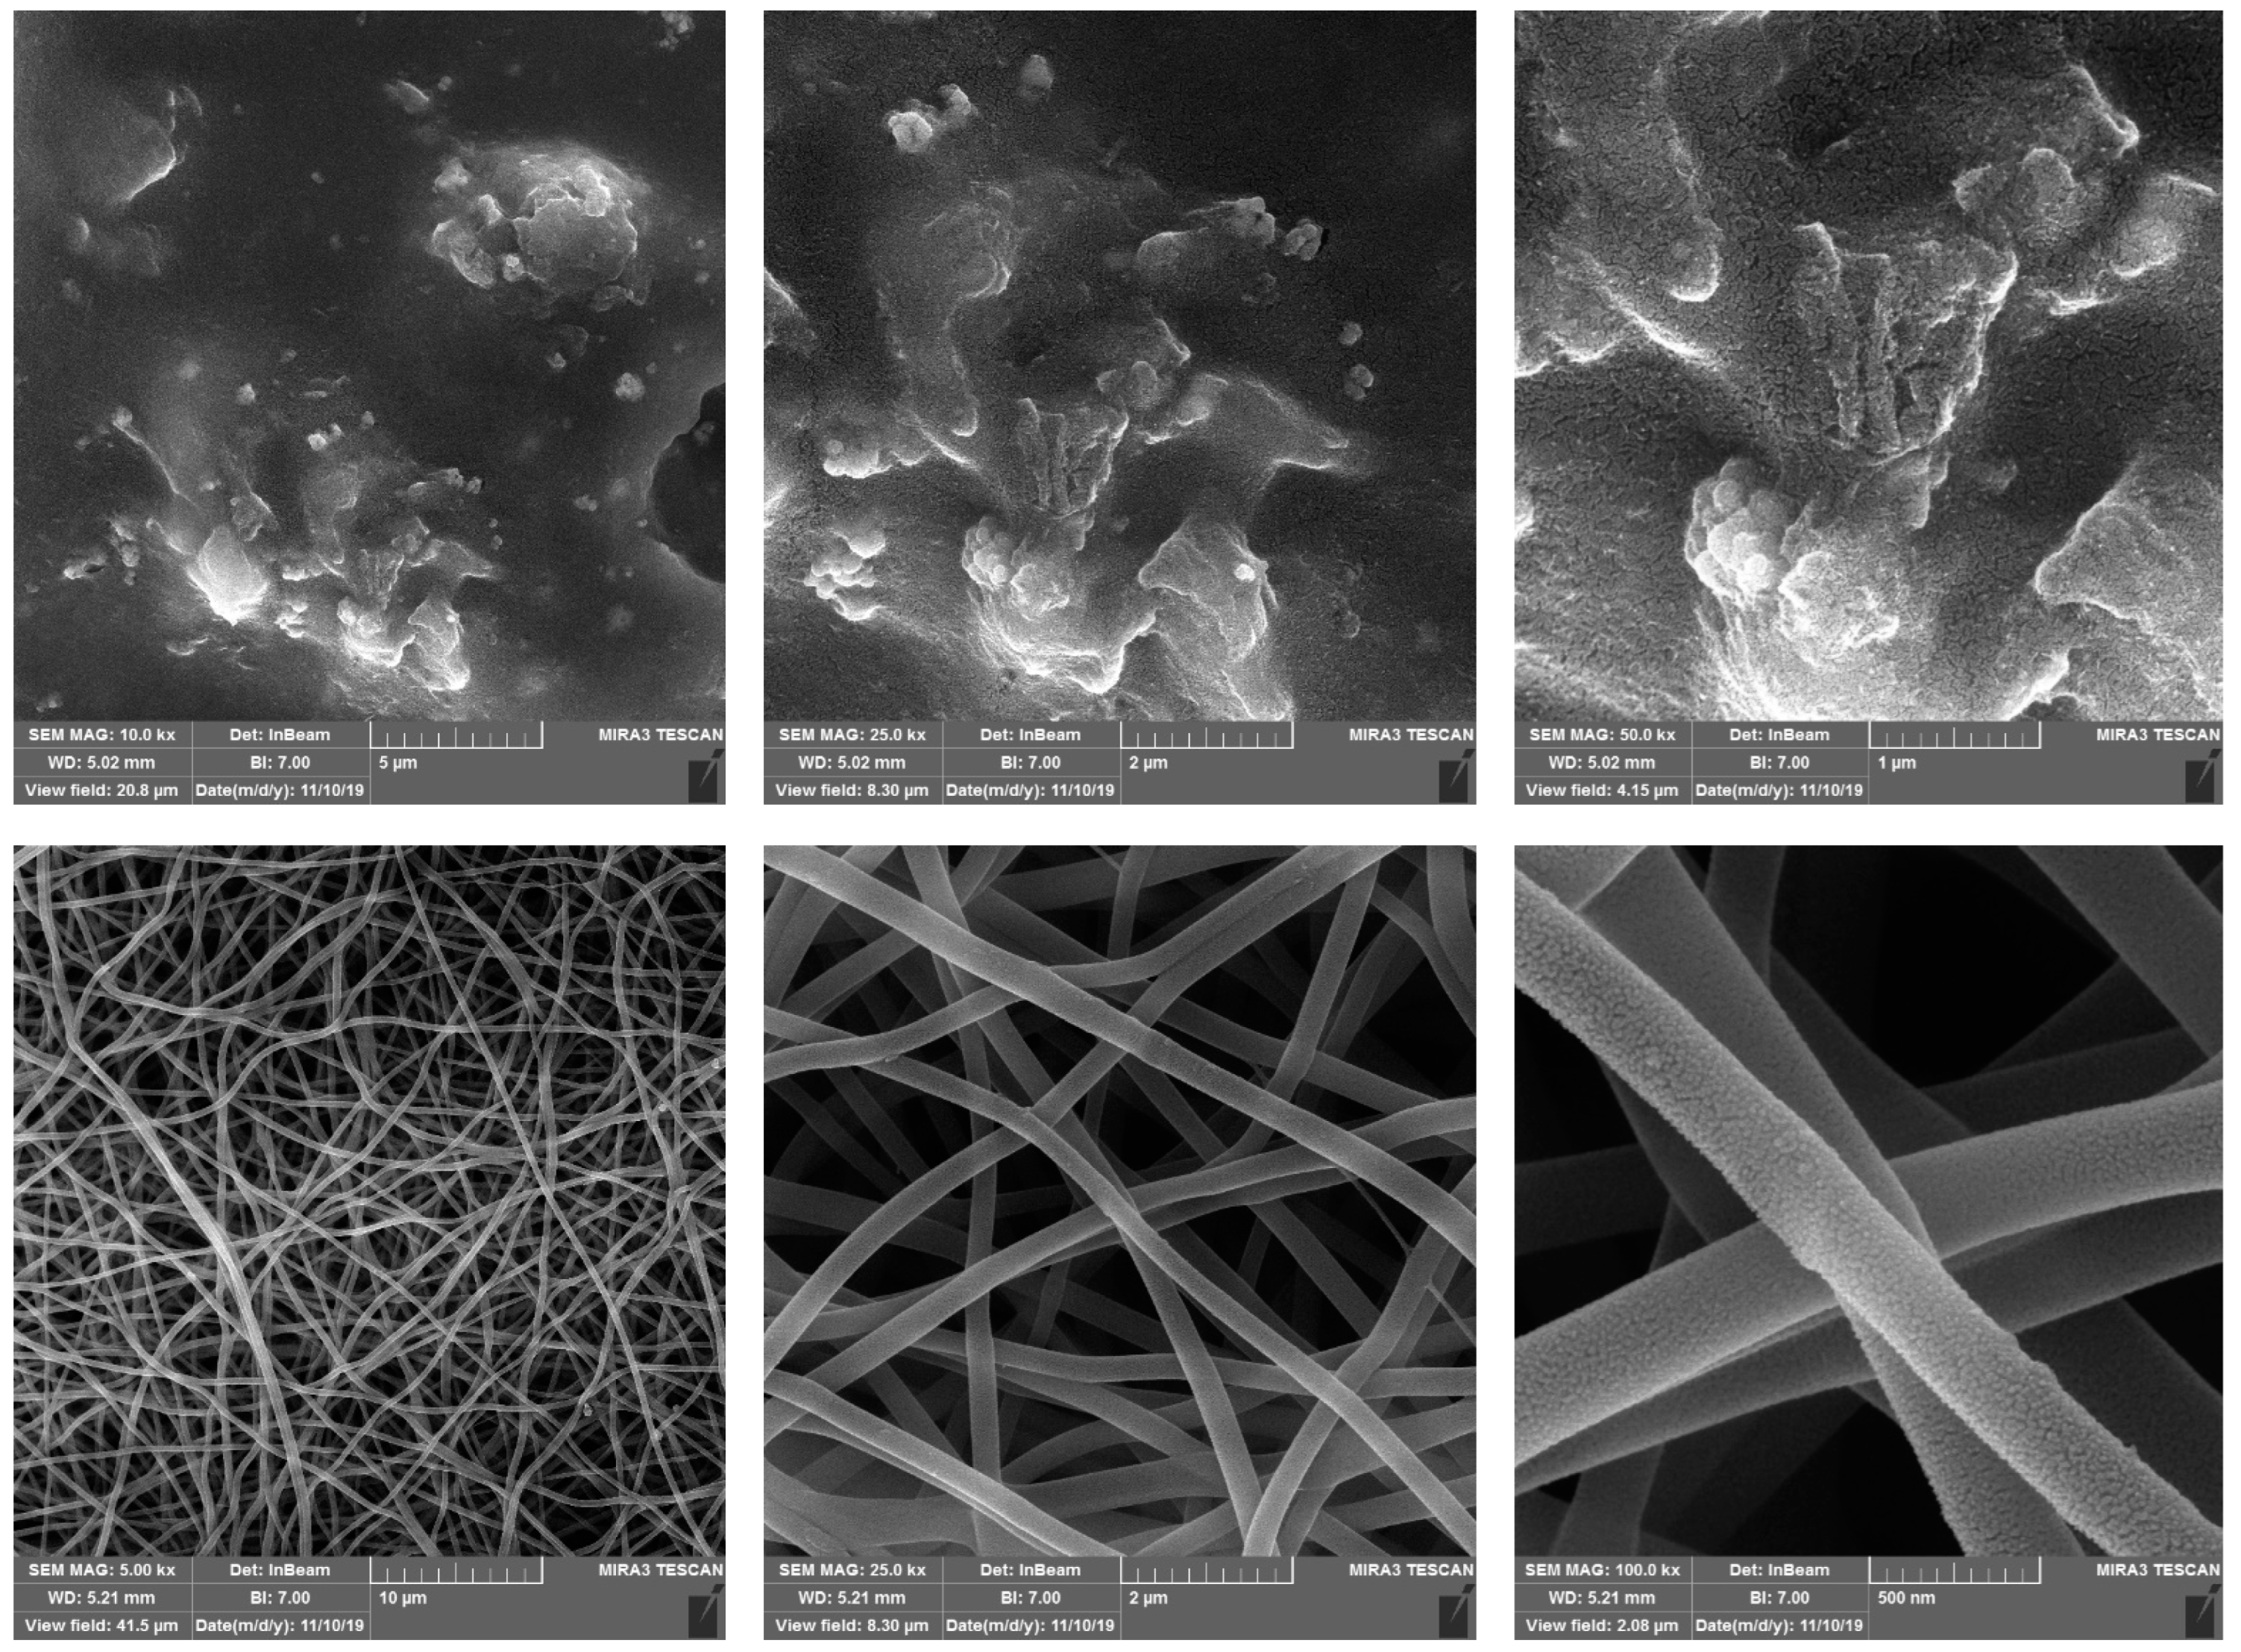
3.2. Morphology of CS-GO-CQD-TiO2
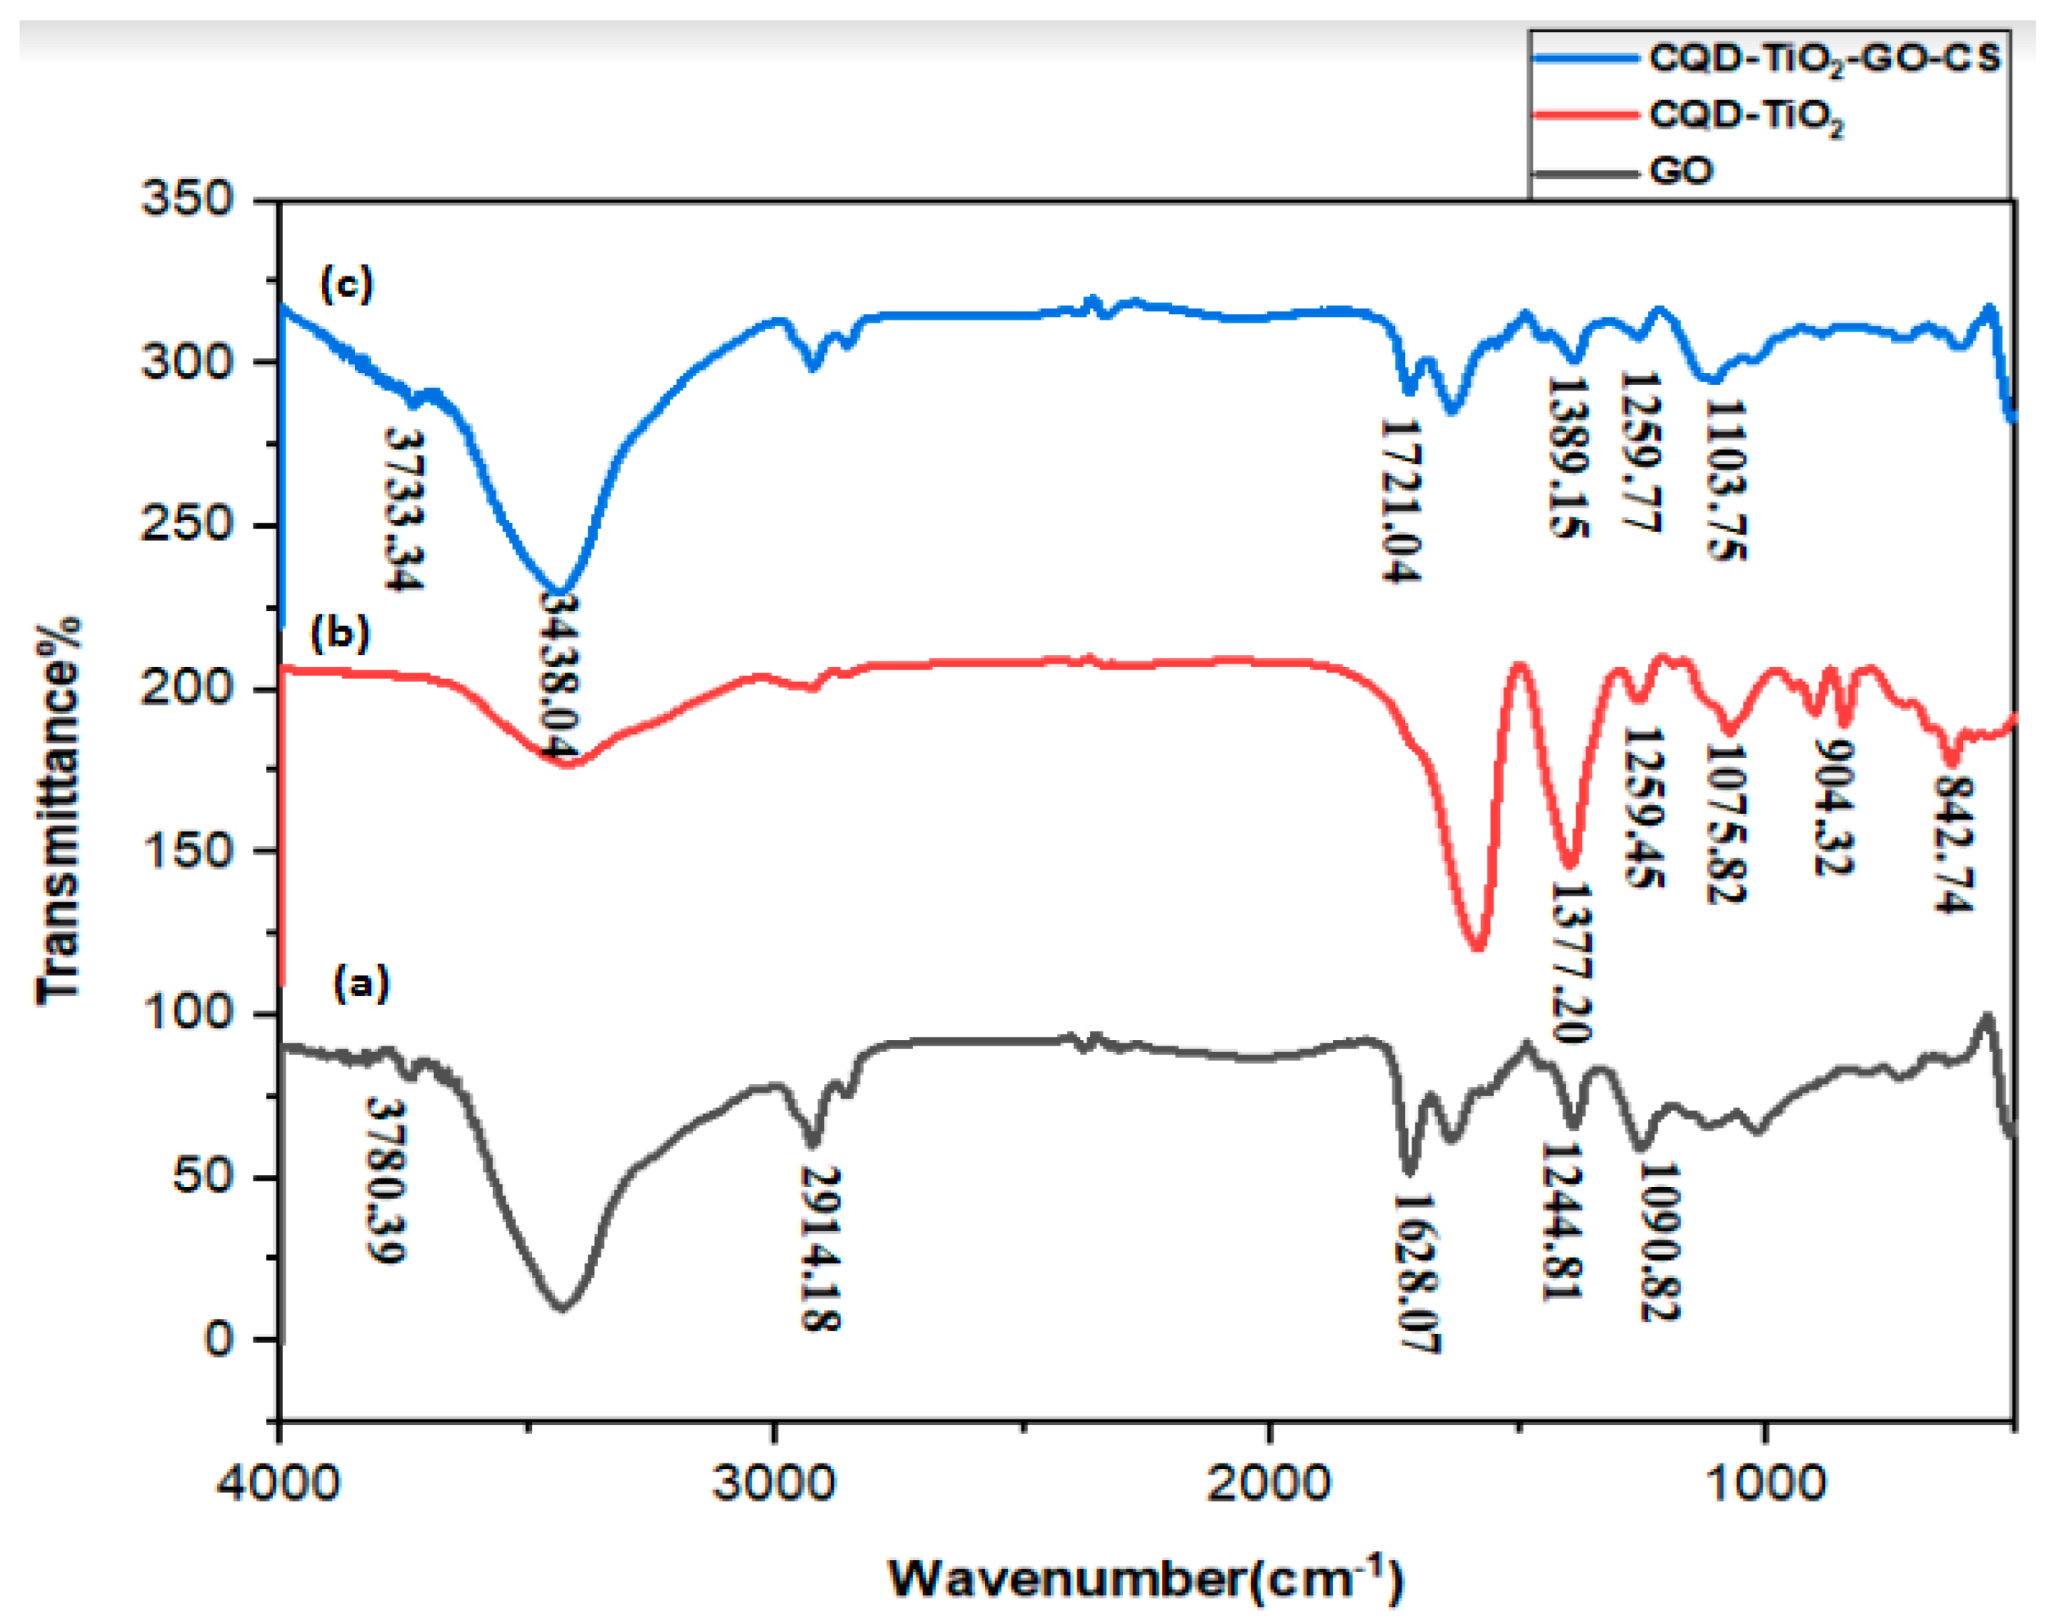
3.3. FTIR Analysis of Materials and Nanocomposites
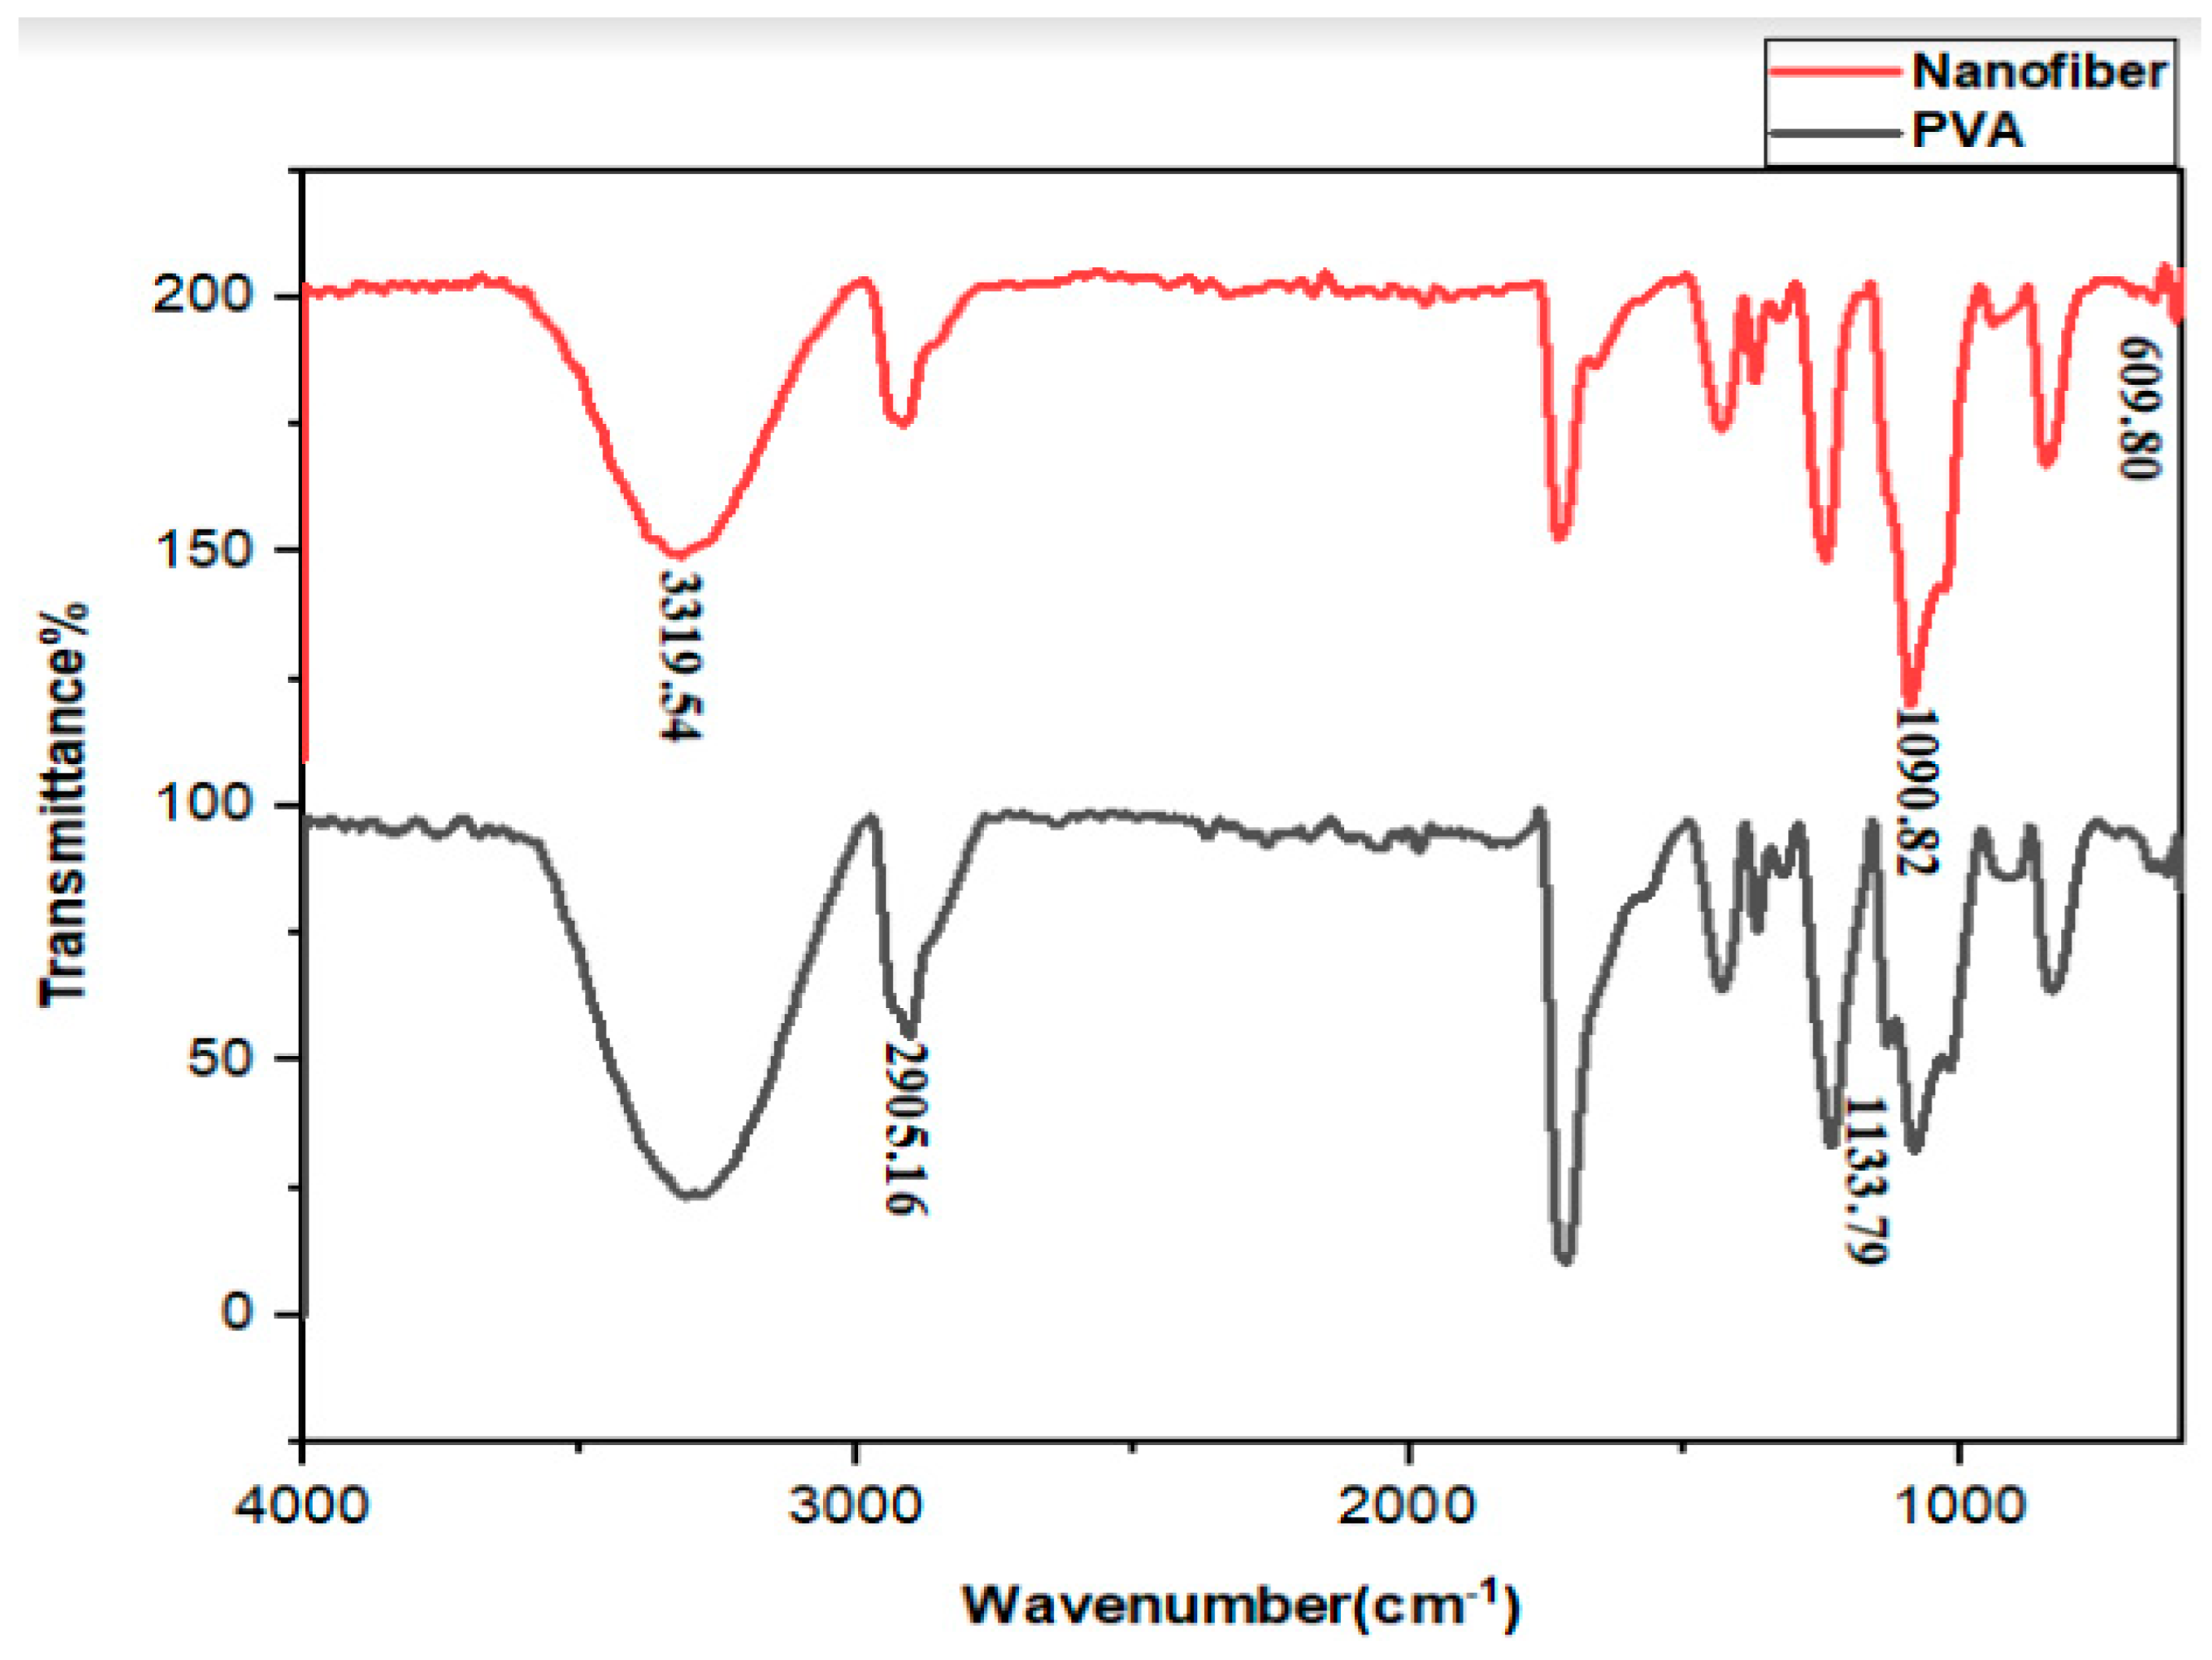
3.4. FTIR Analysis of Nanofibers
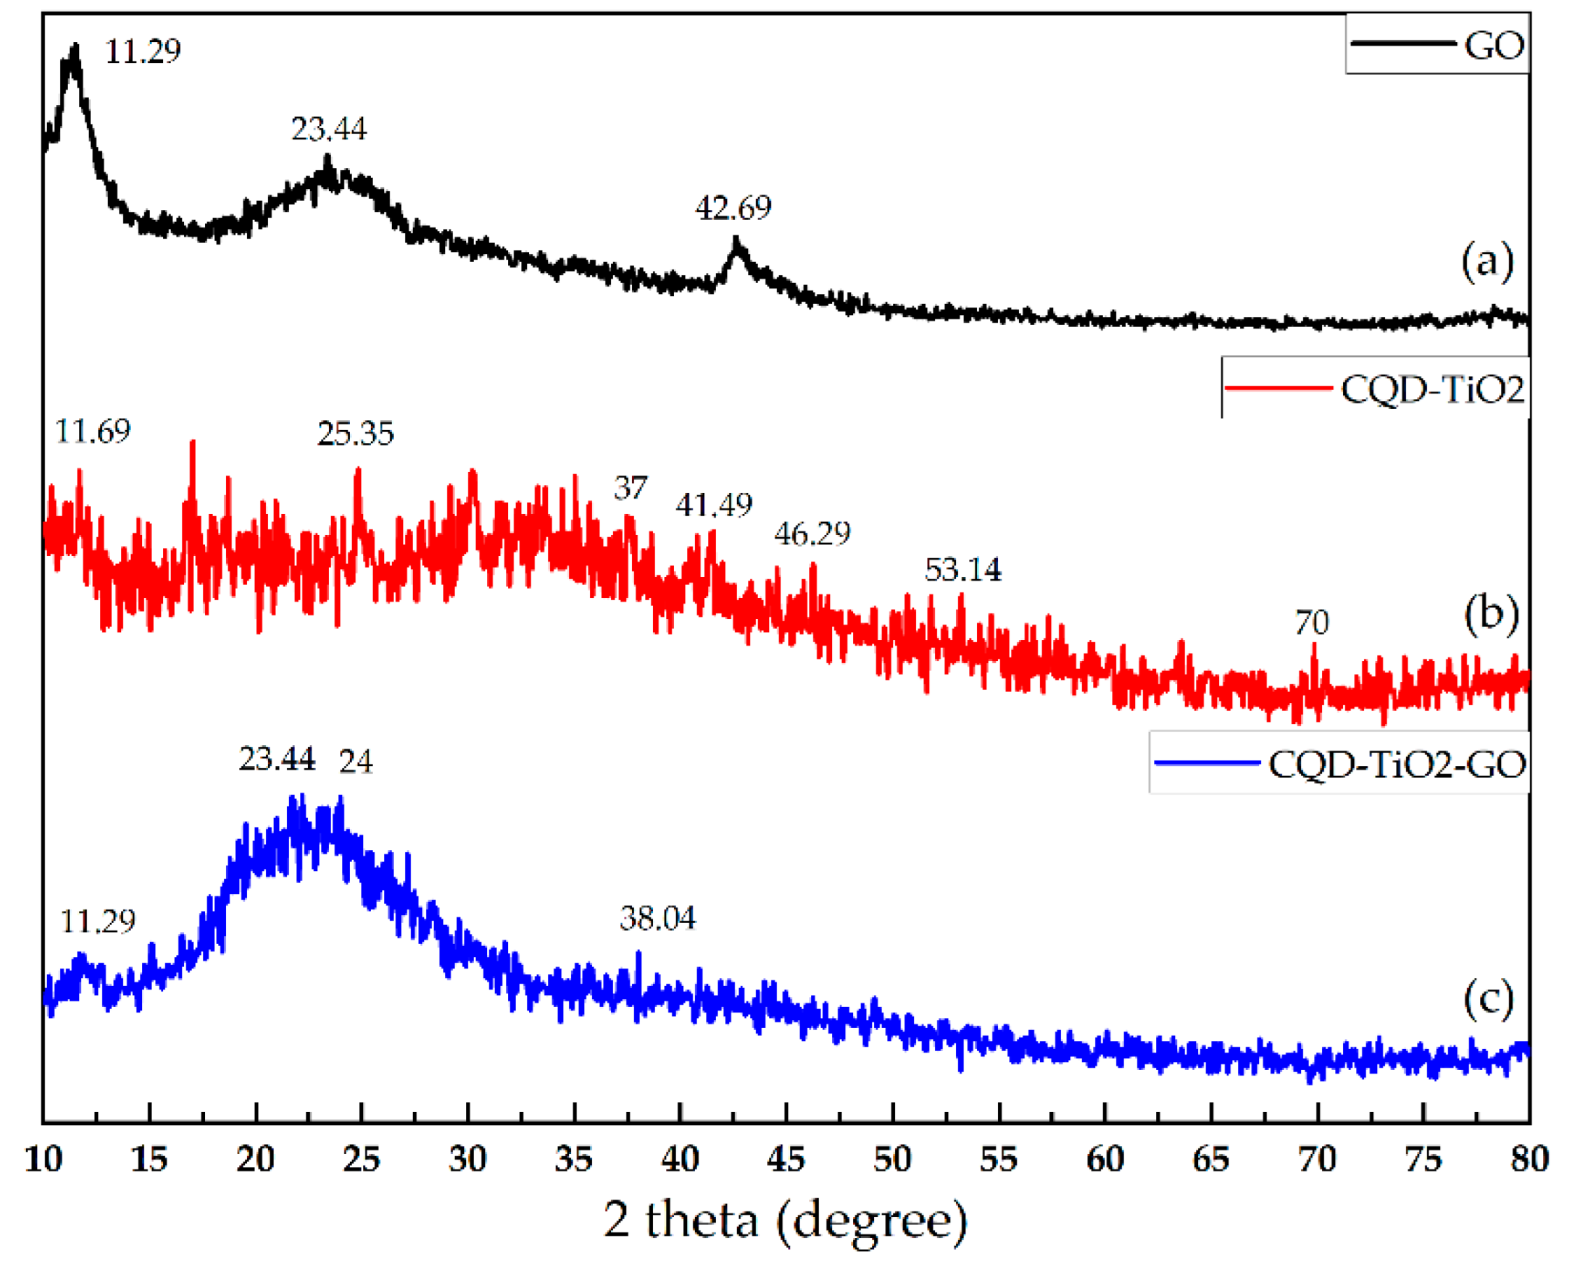
3.5. XRD Analysis
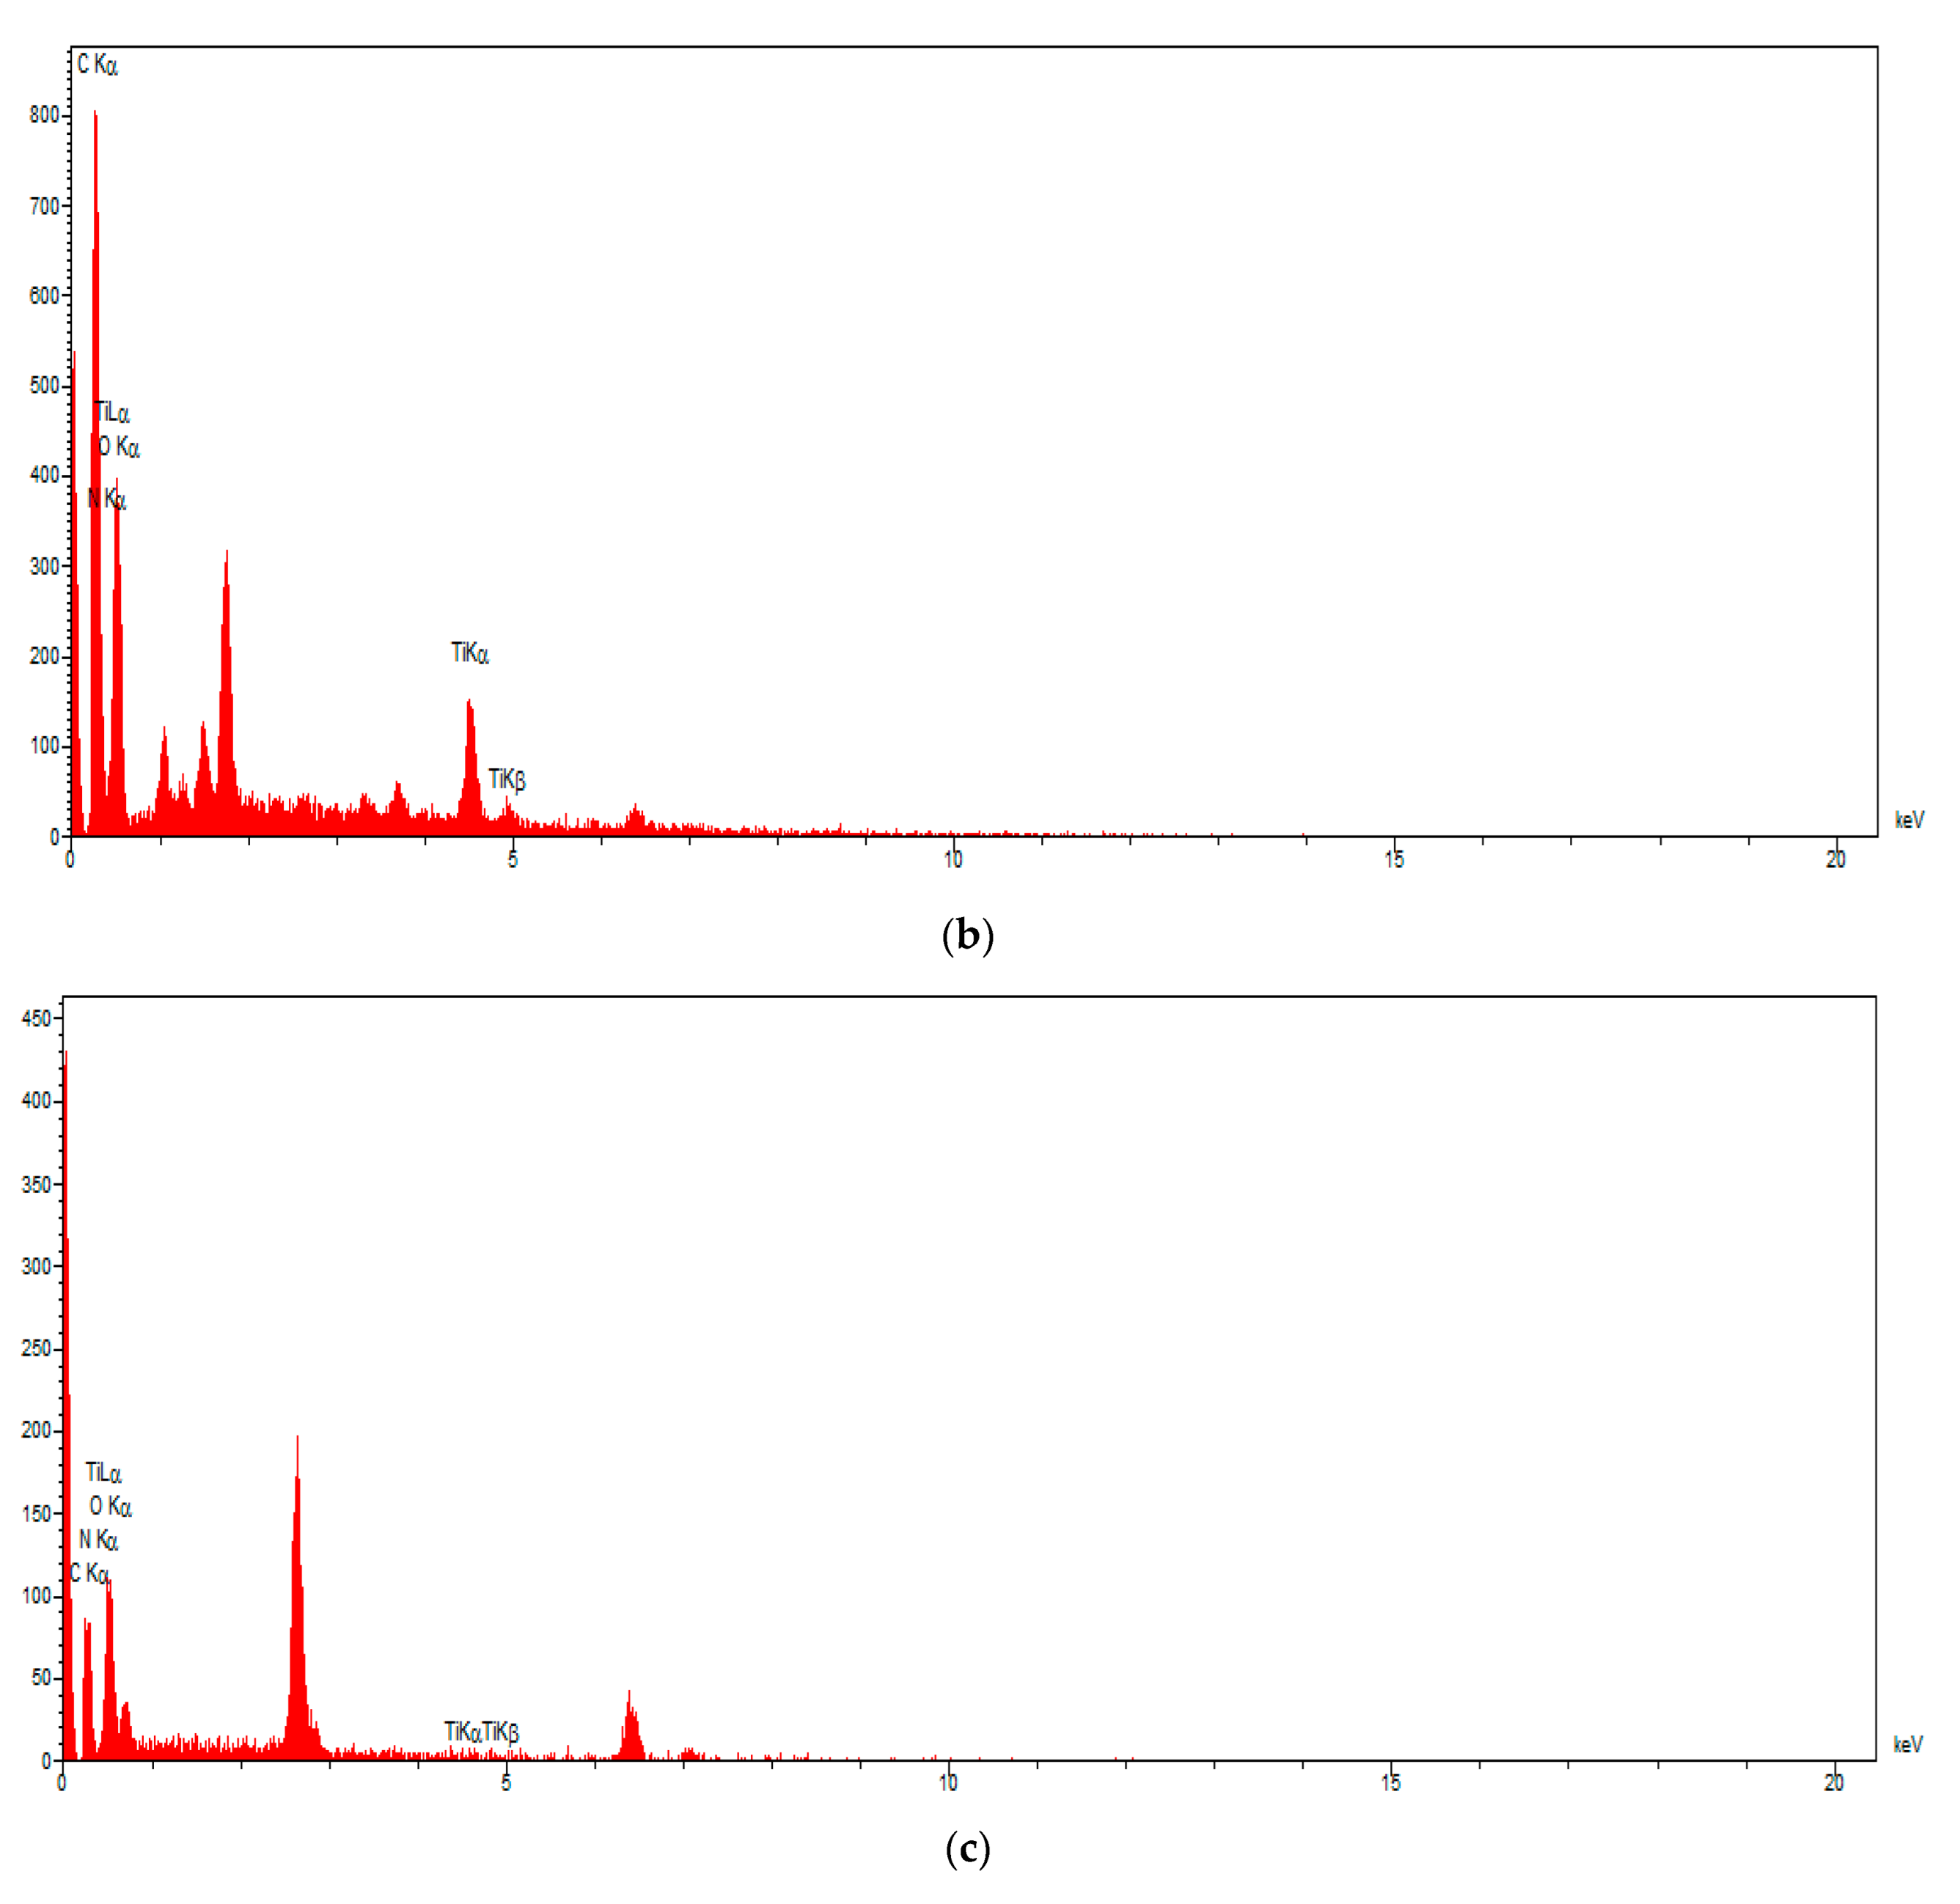
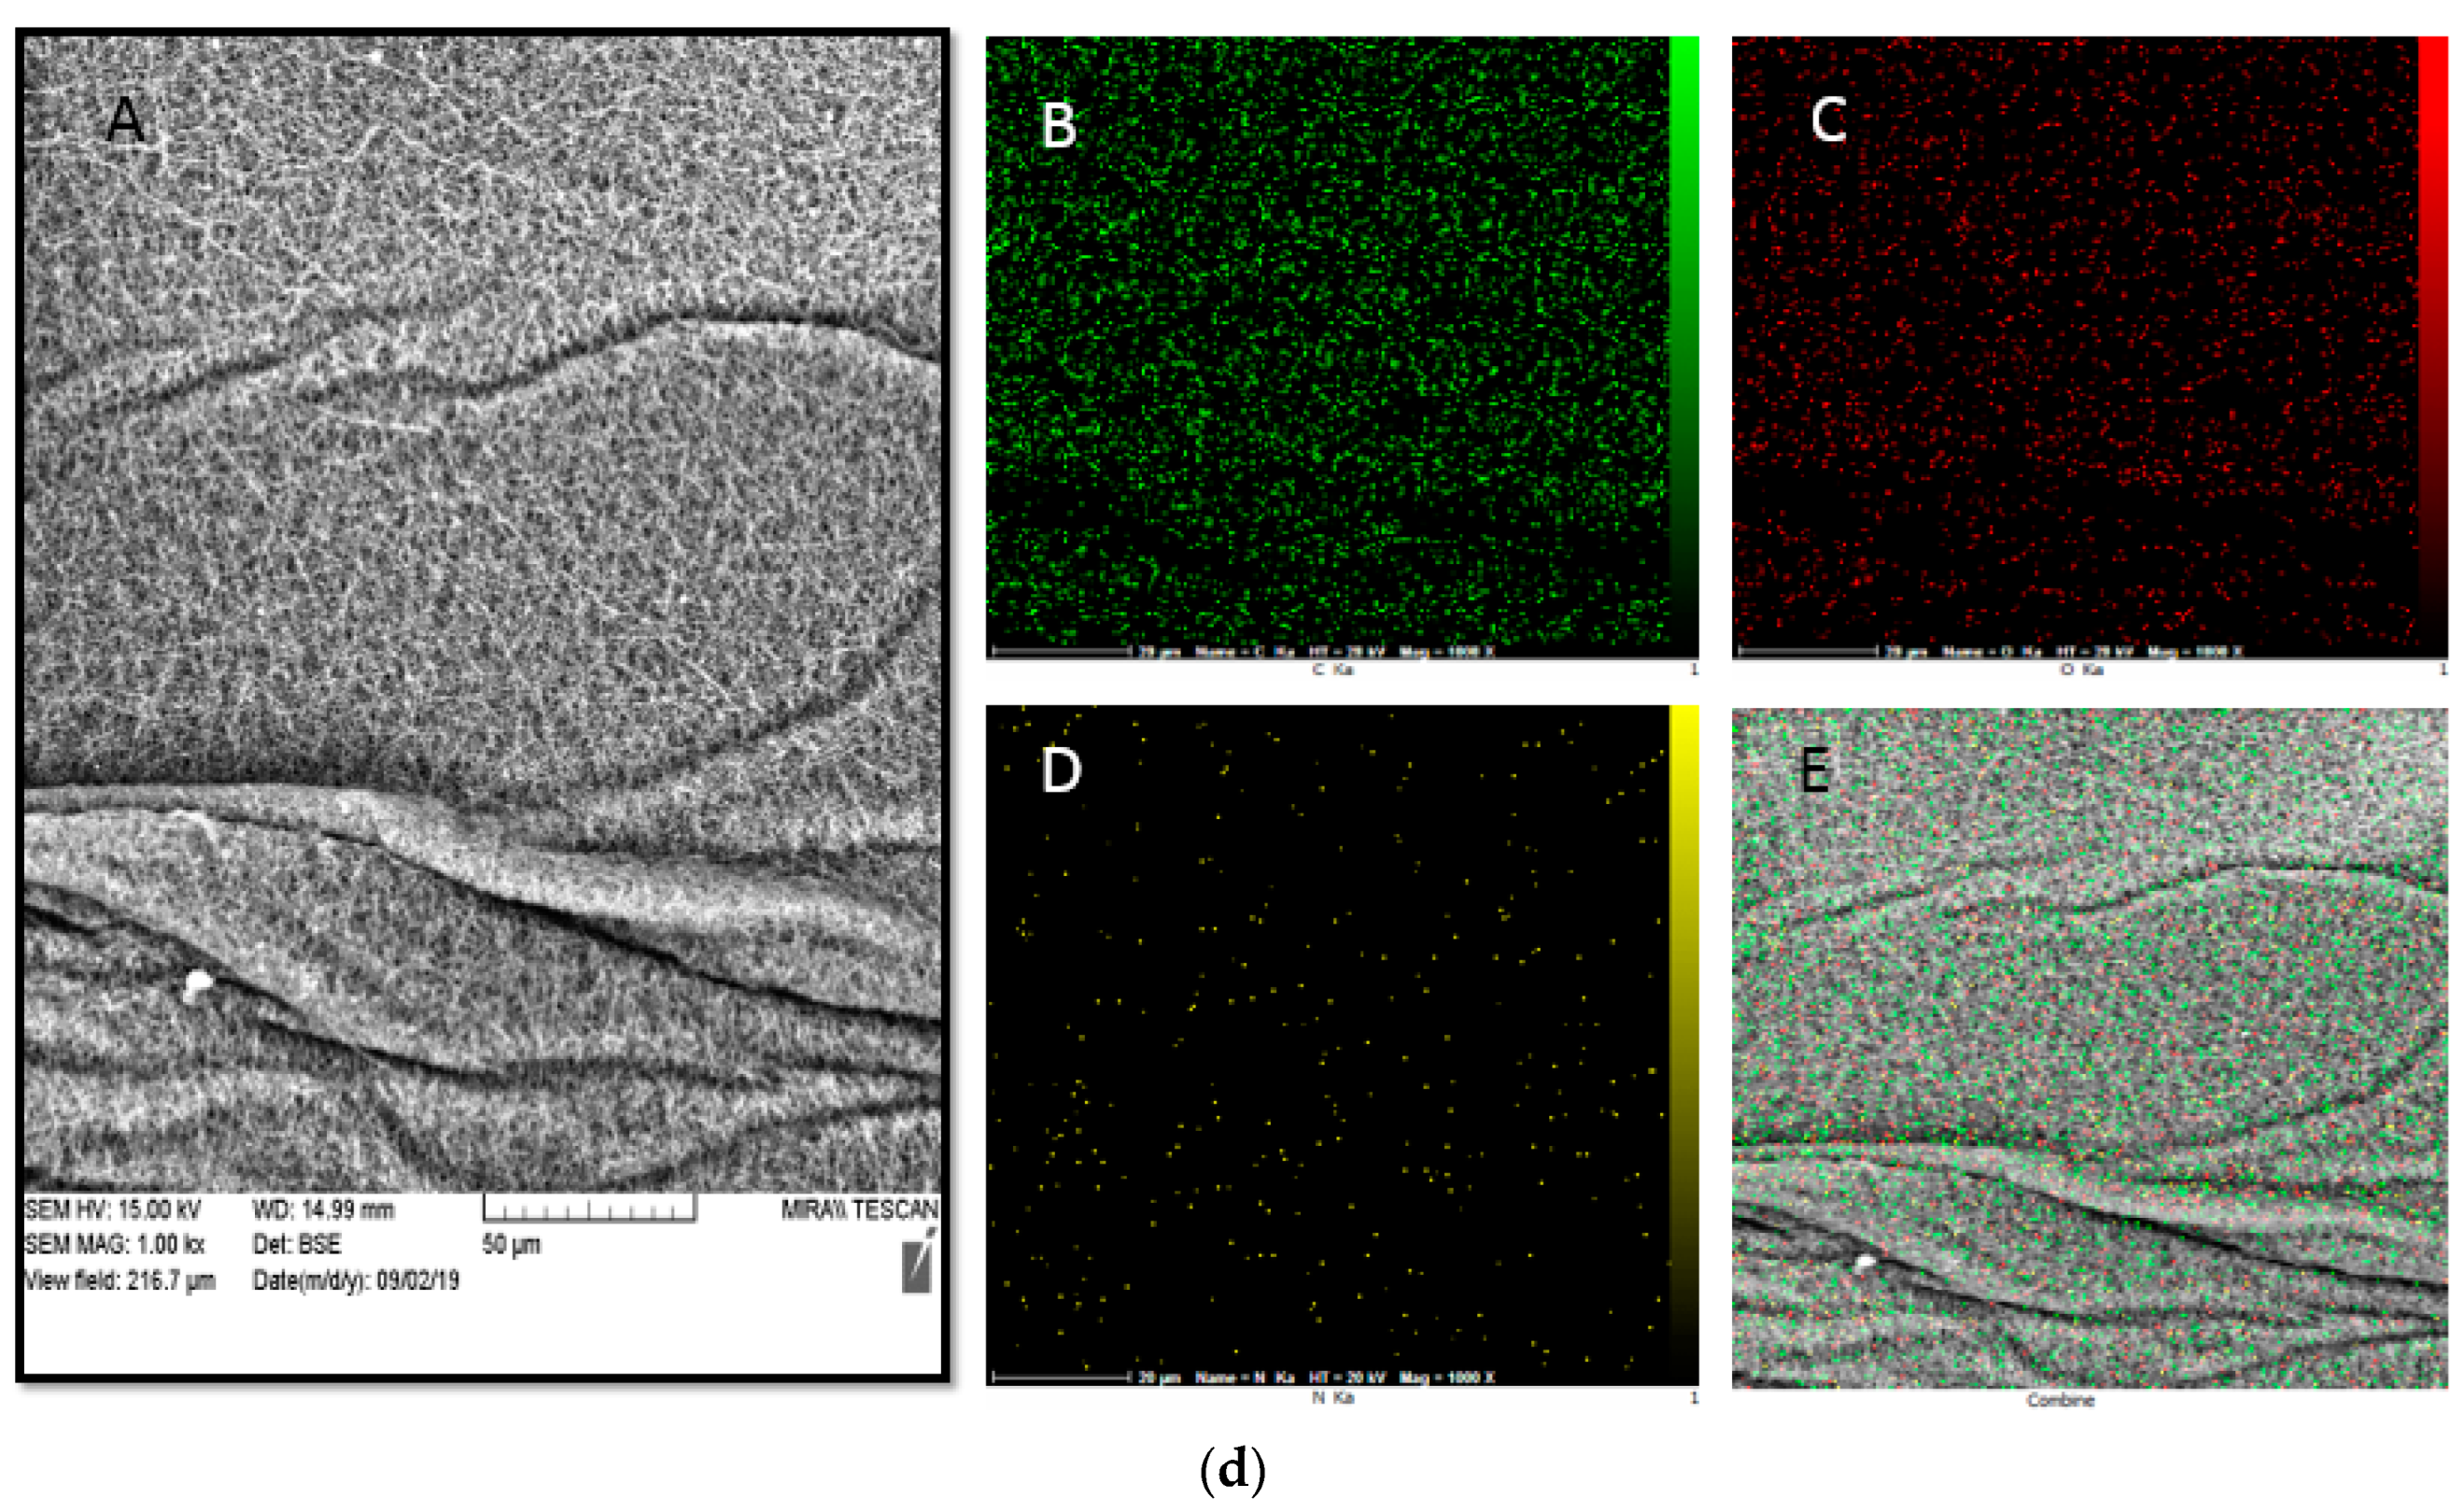
3.6. SEM Mapping and EDS Analysis
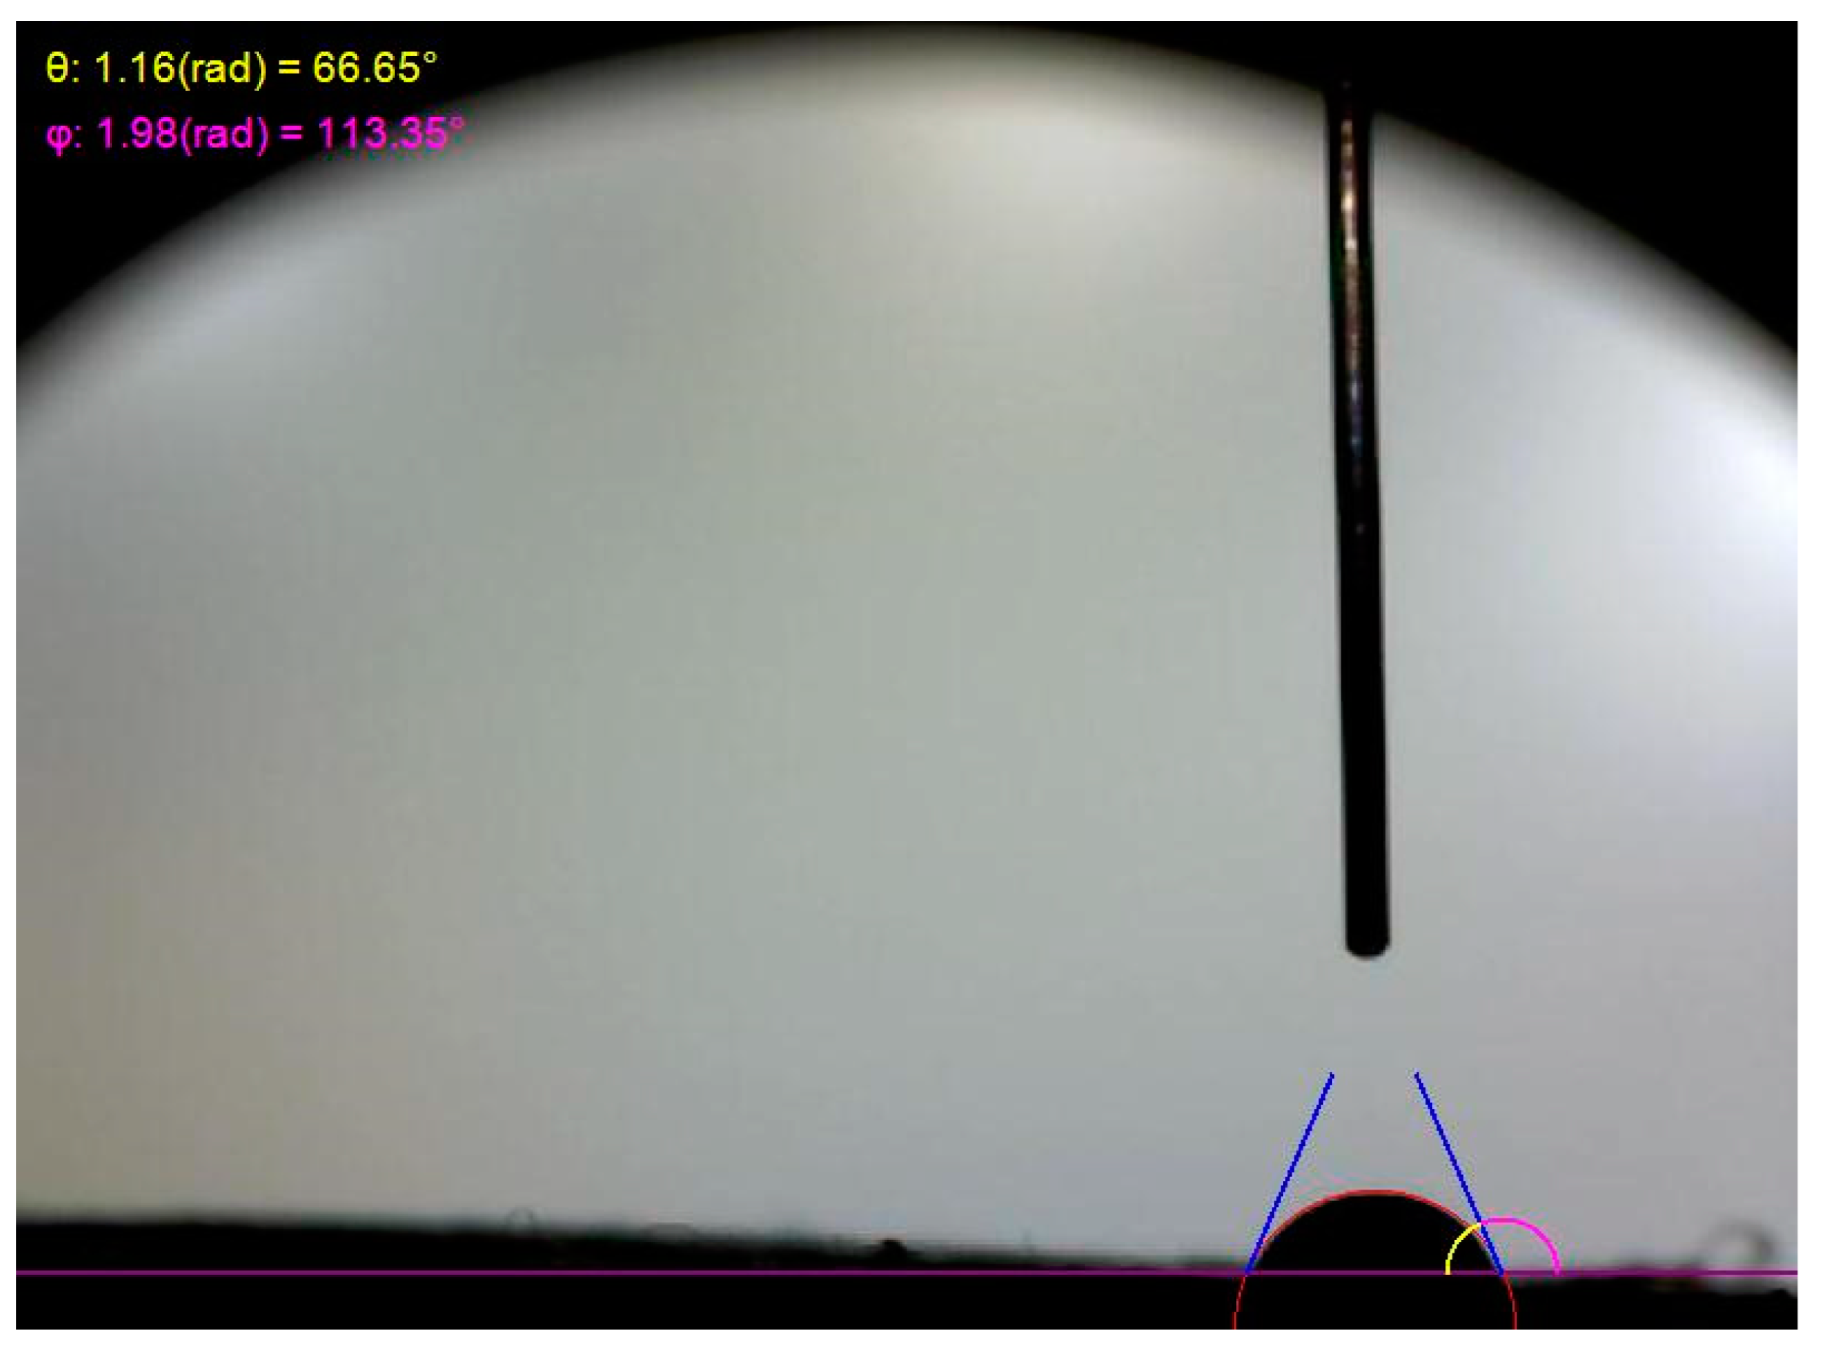
3.7. The Hydrophilicity of Different Electrospun Nanofibres
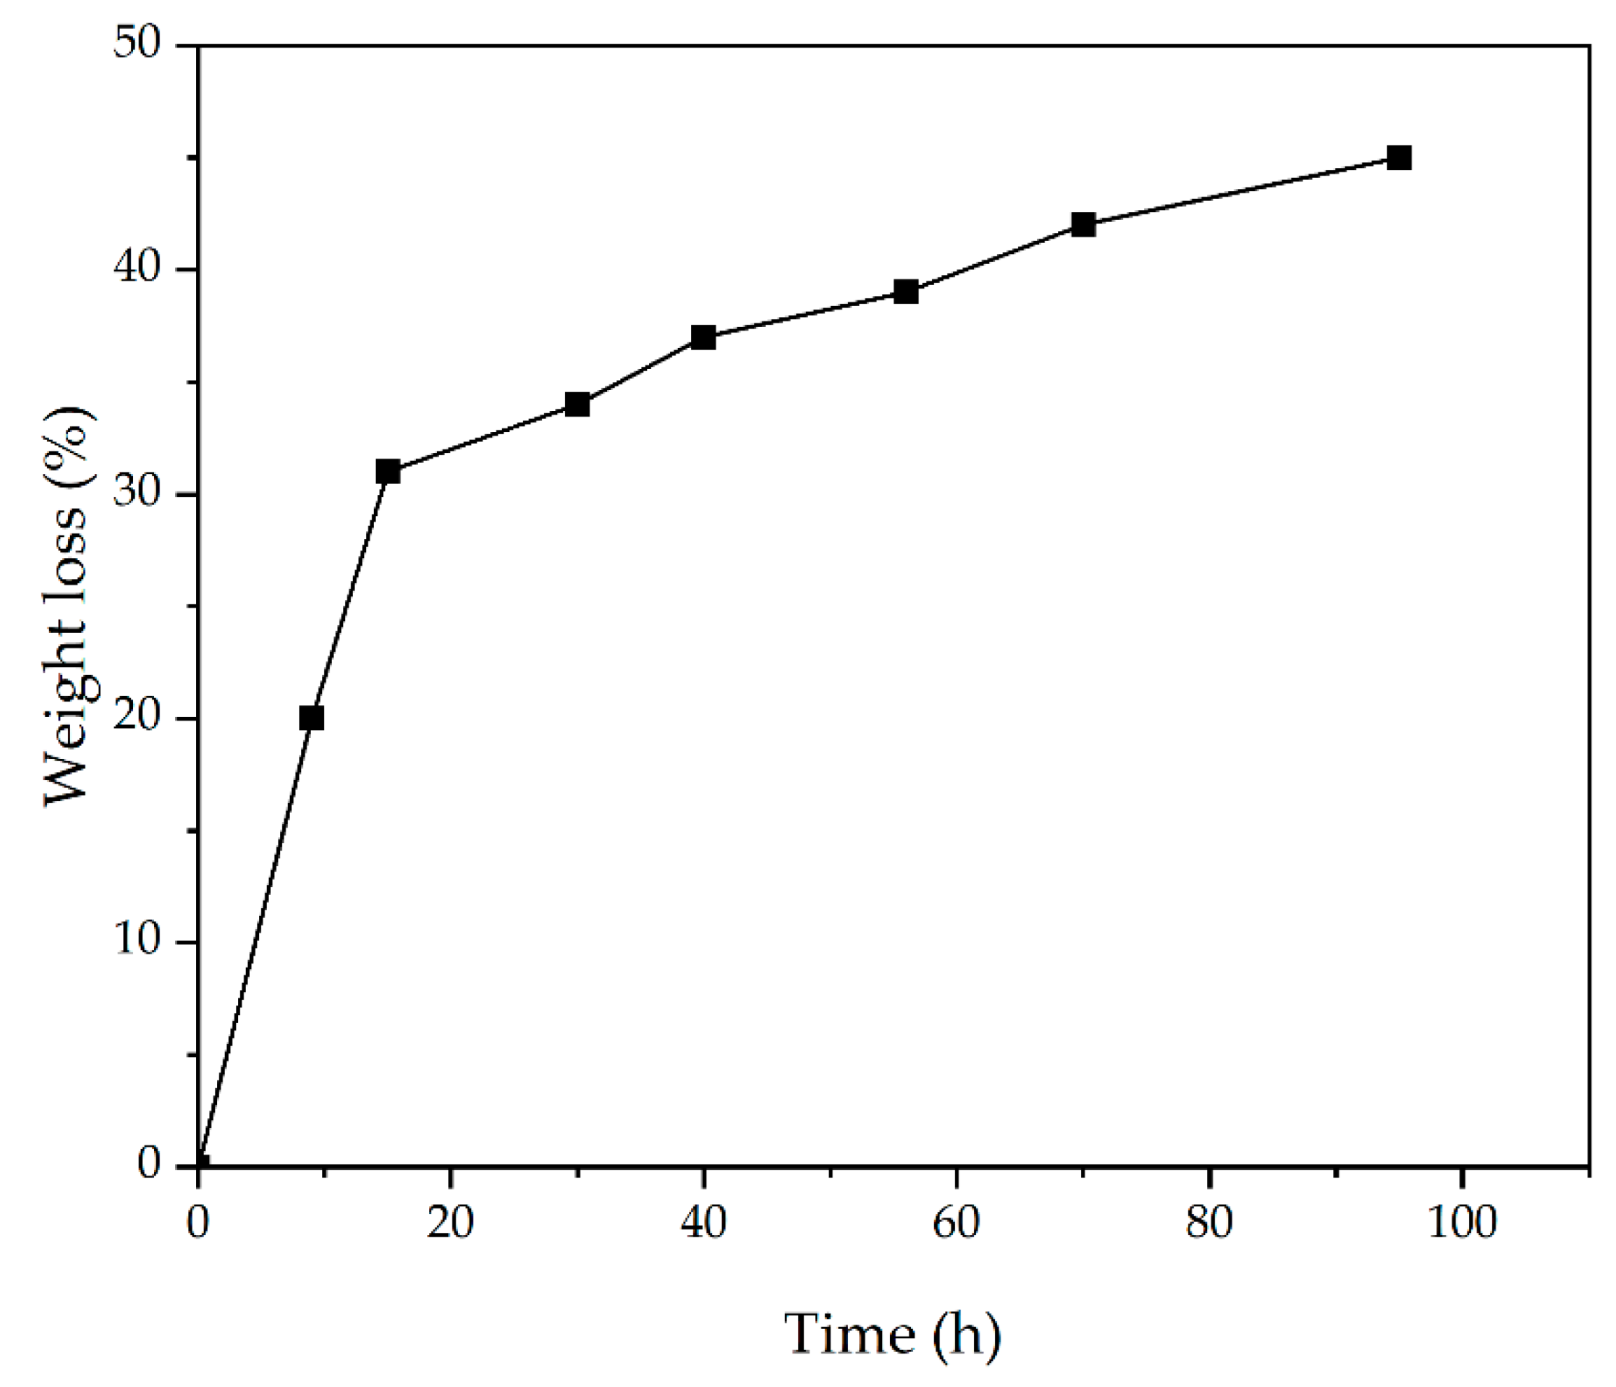
3.8. Weight Loss
3.9. Mechanical Properties
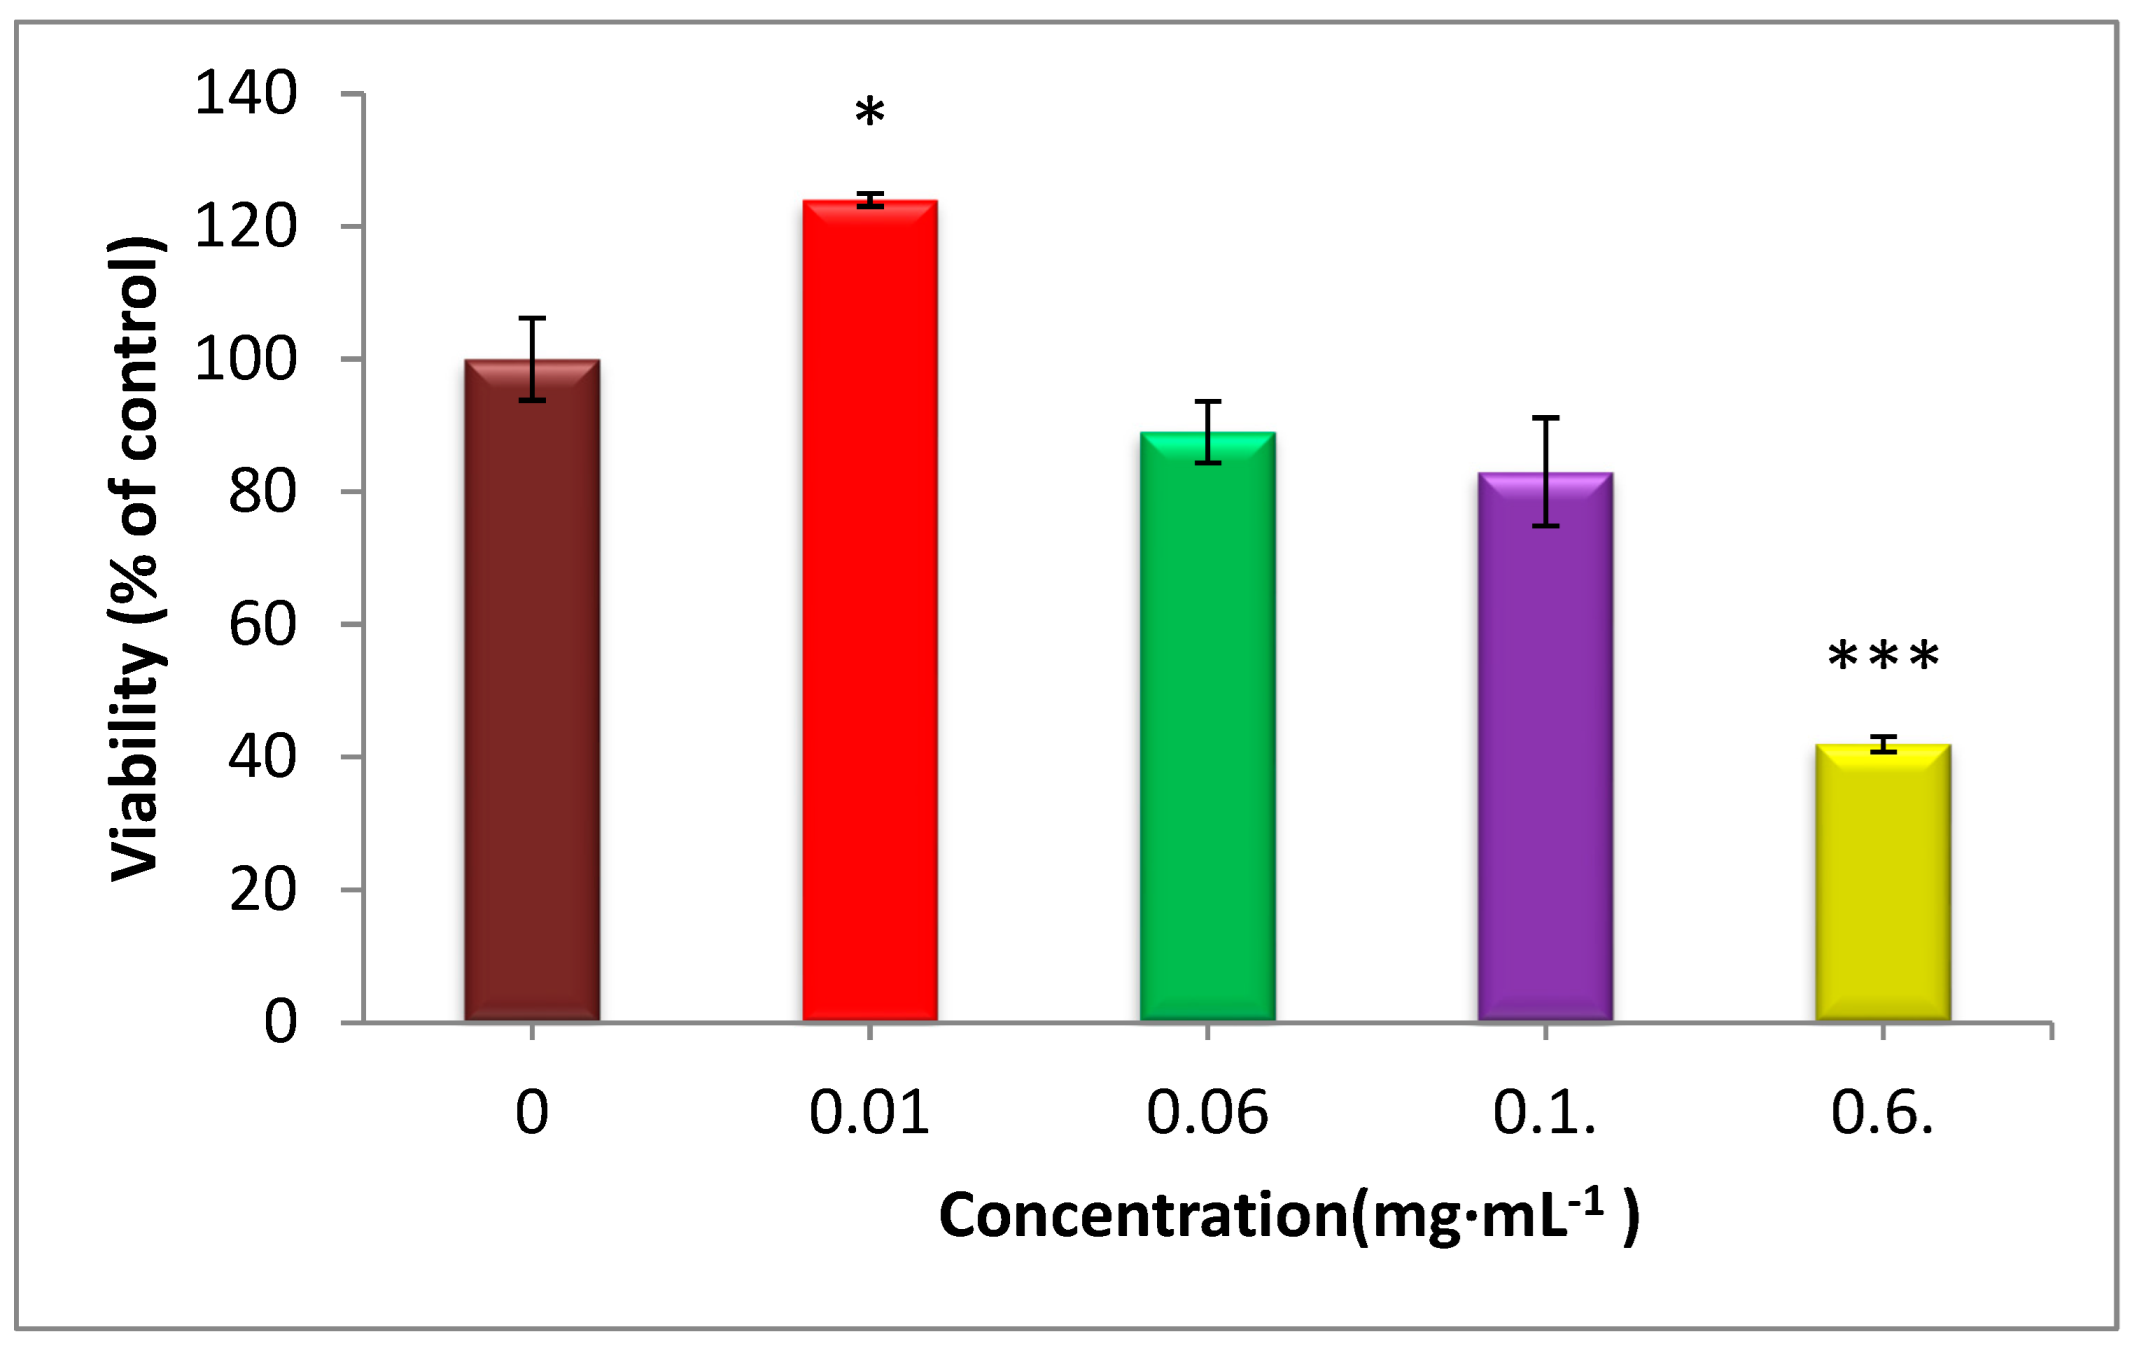
3.10. Cell Viability
3.11. Antibacterial Test
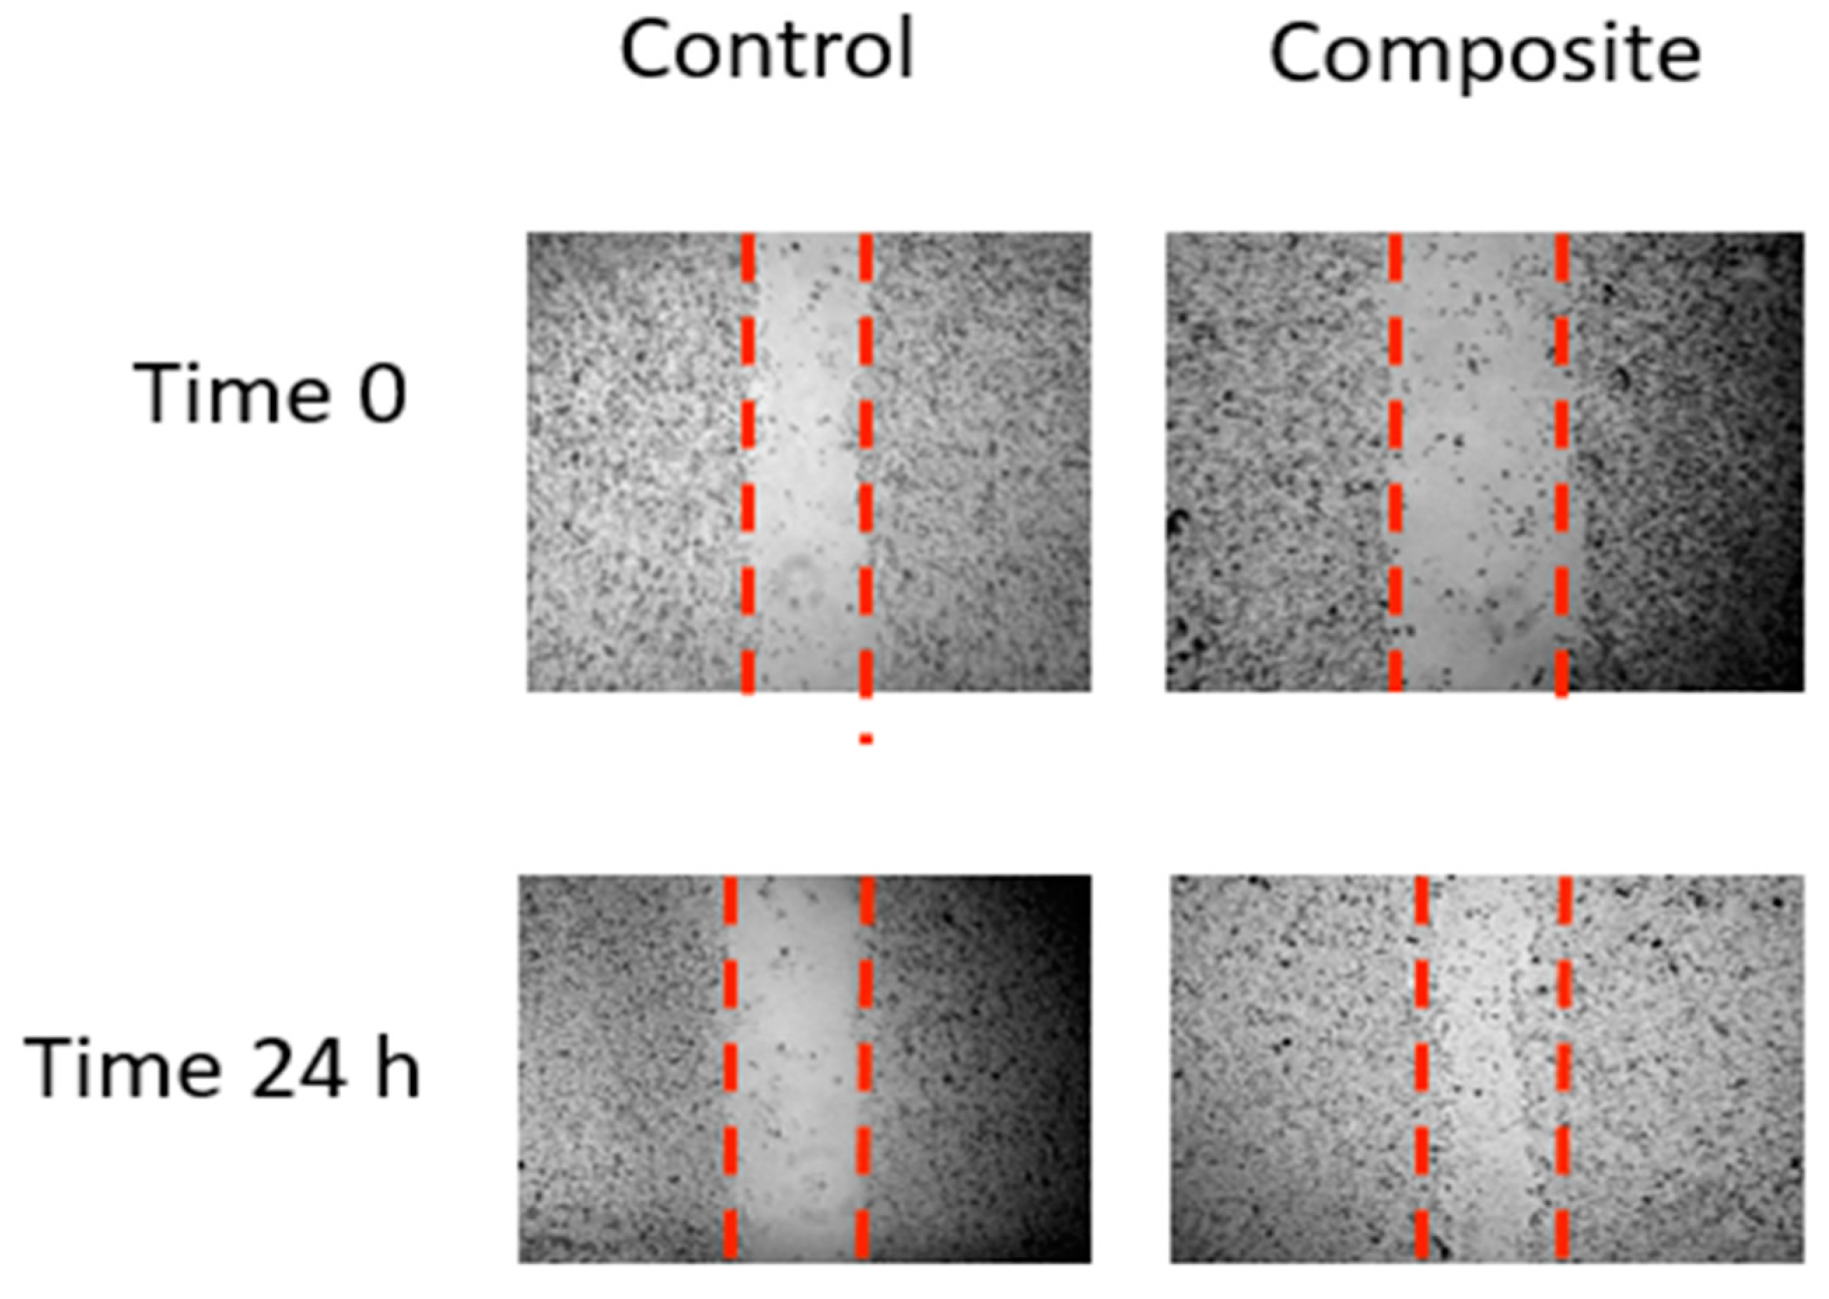
3.12. Inhibition of Cell Migration and Invasion
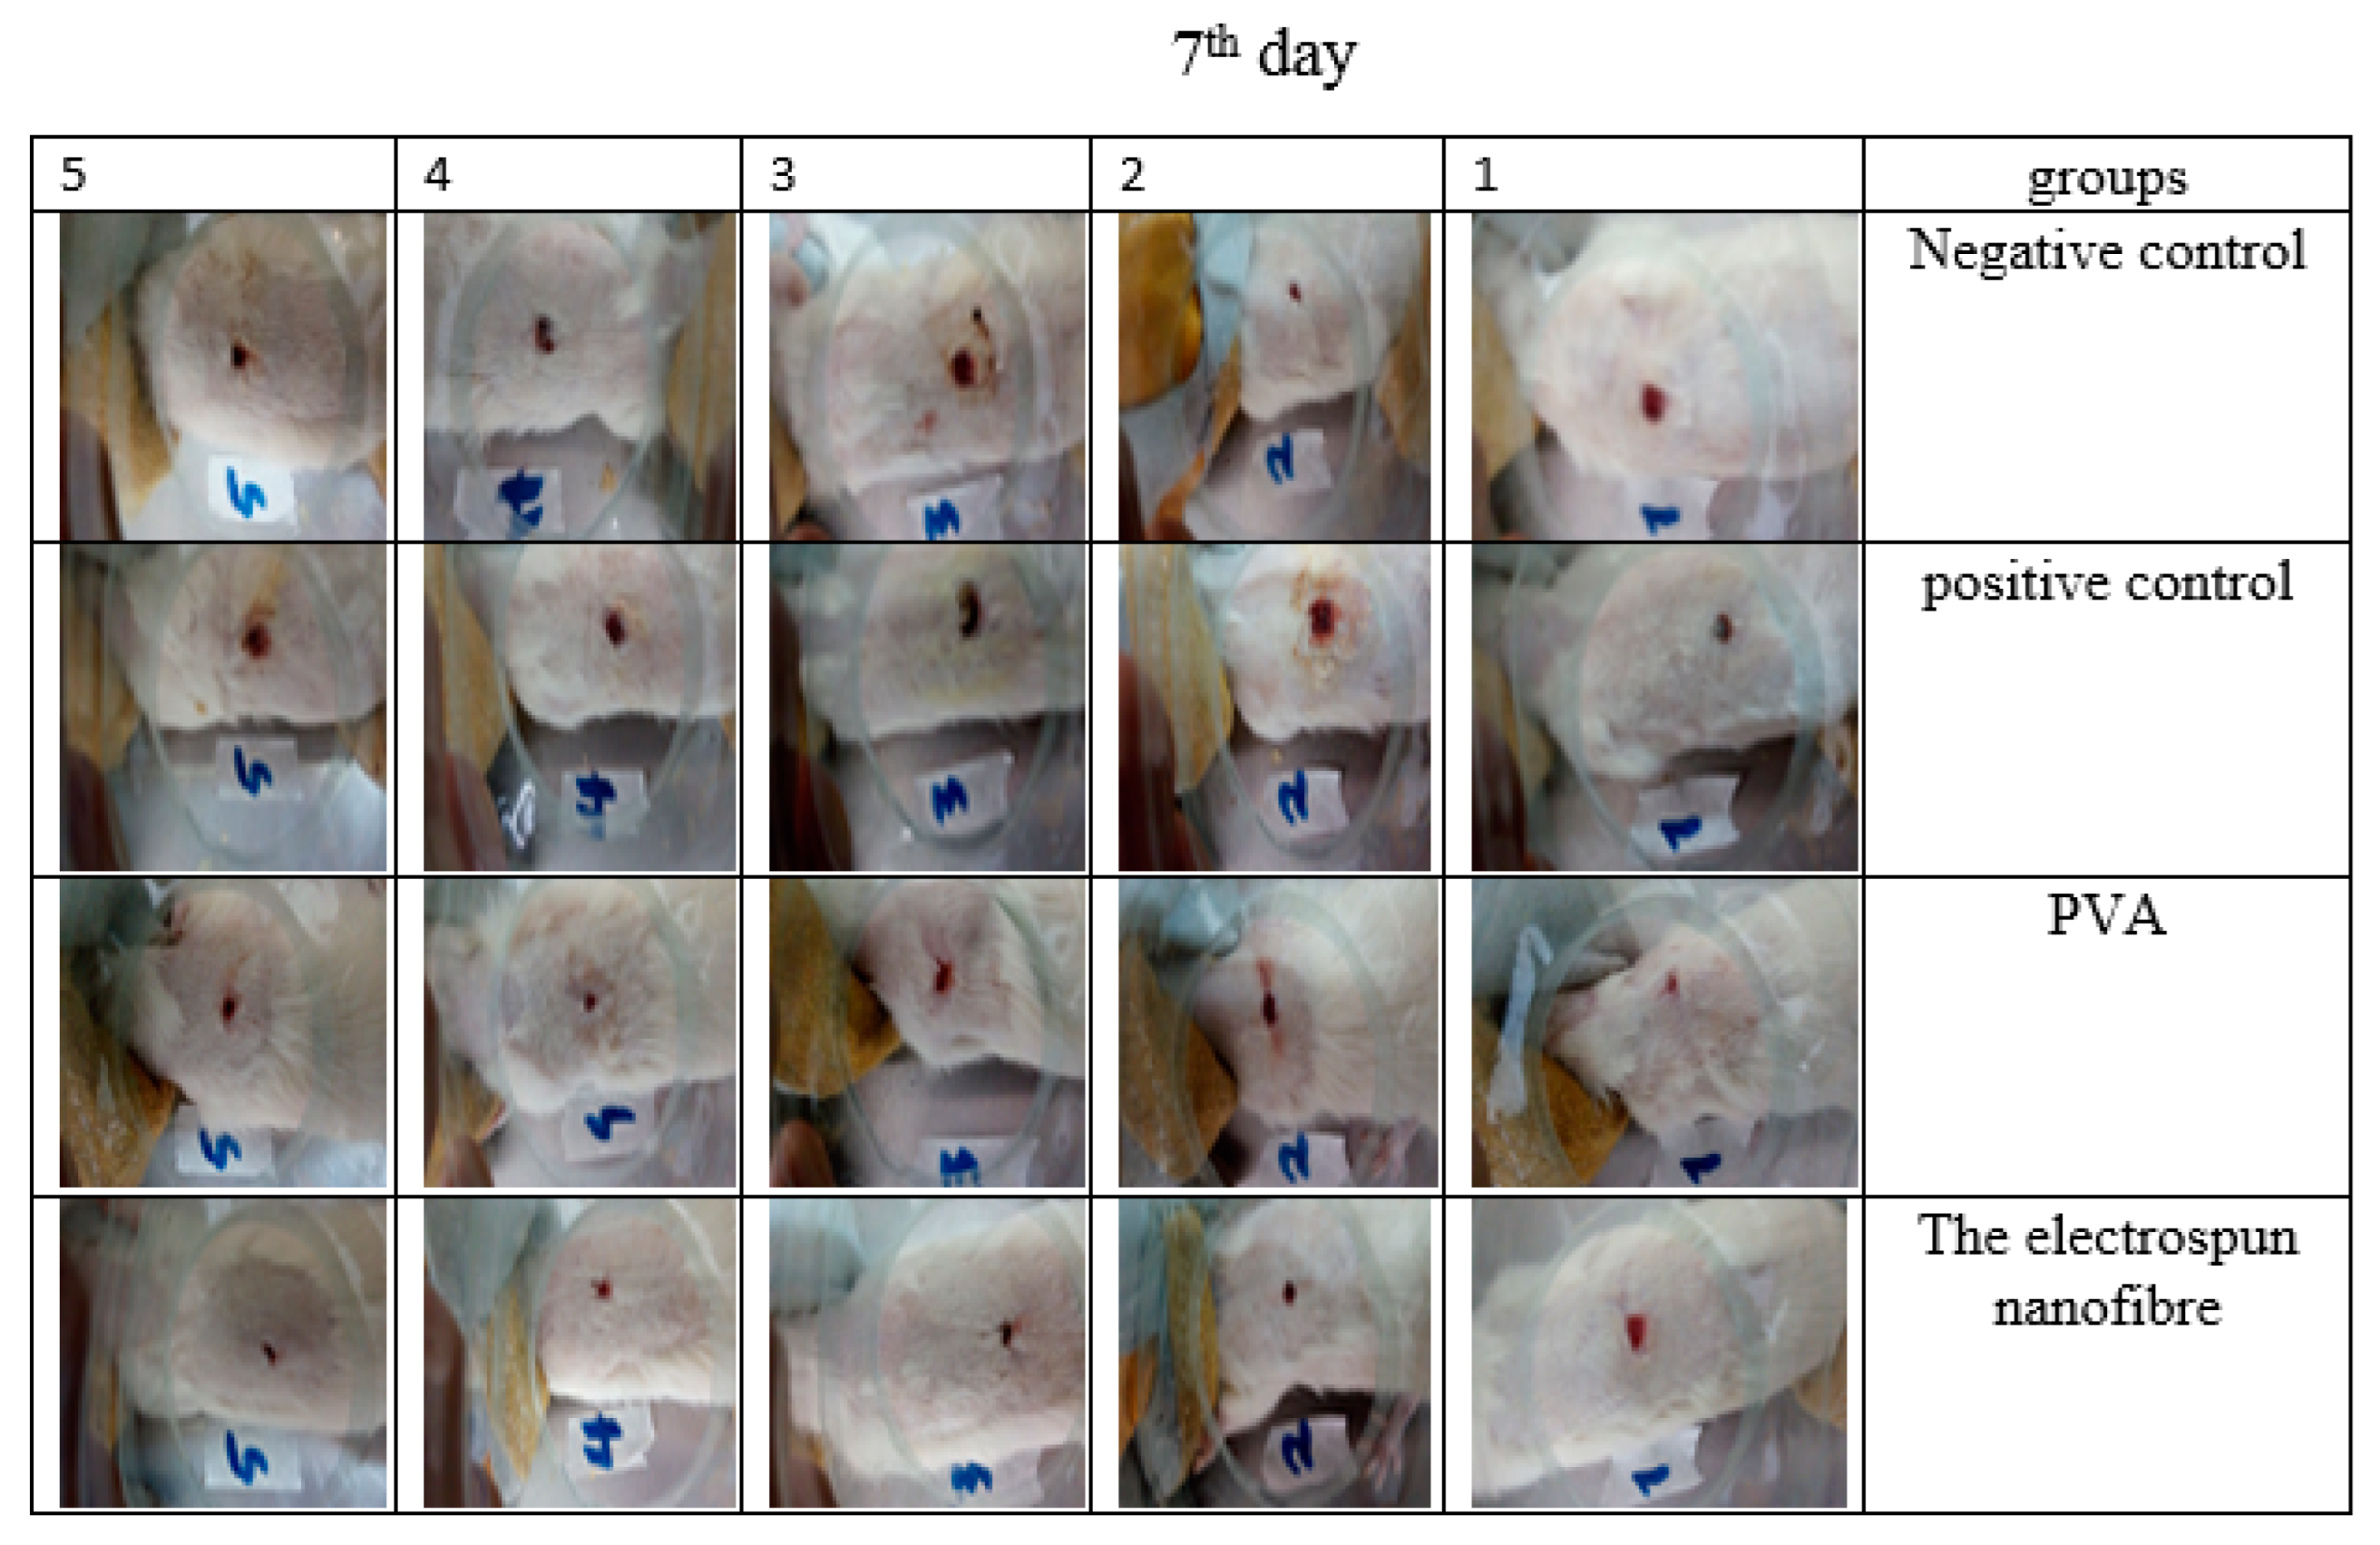
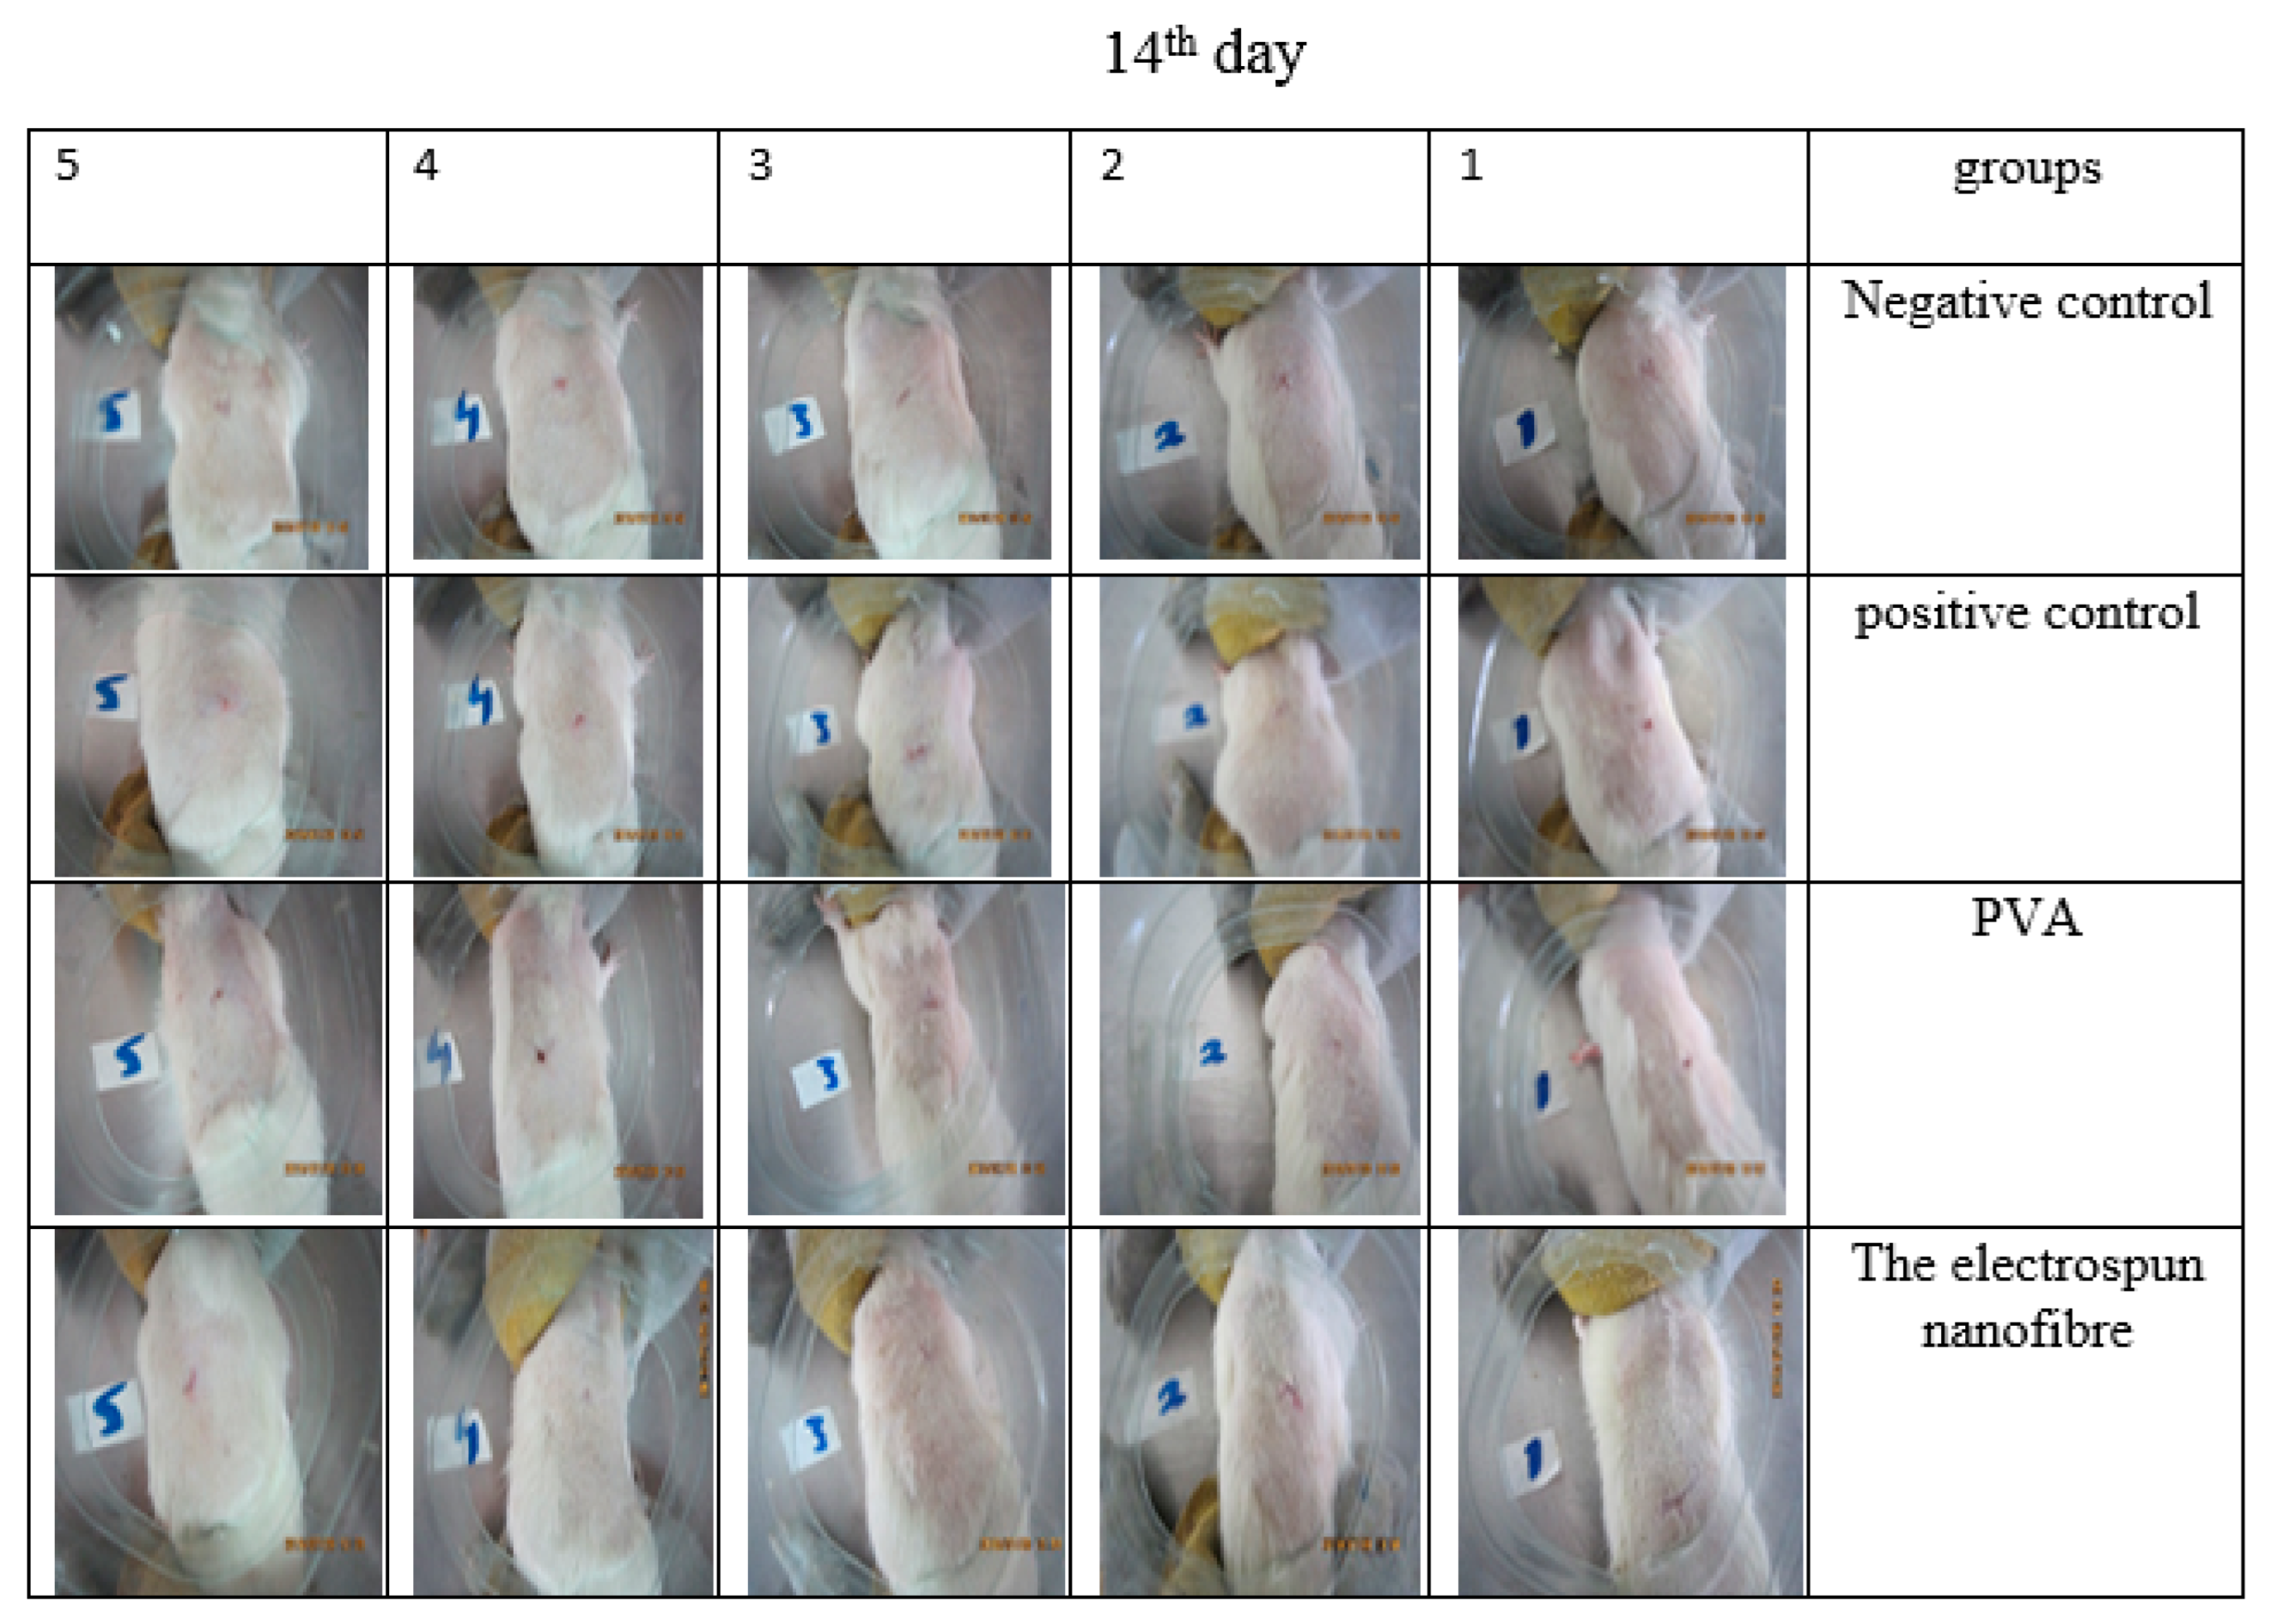
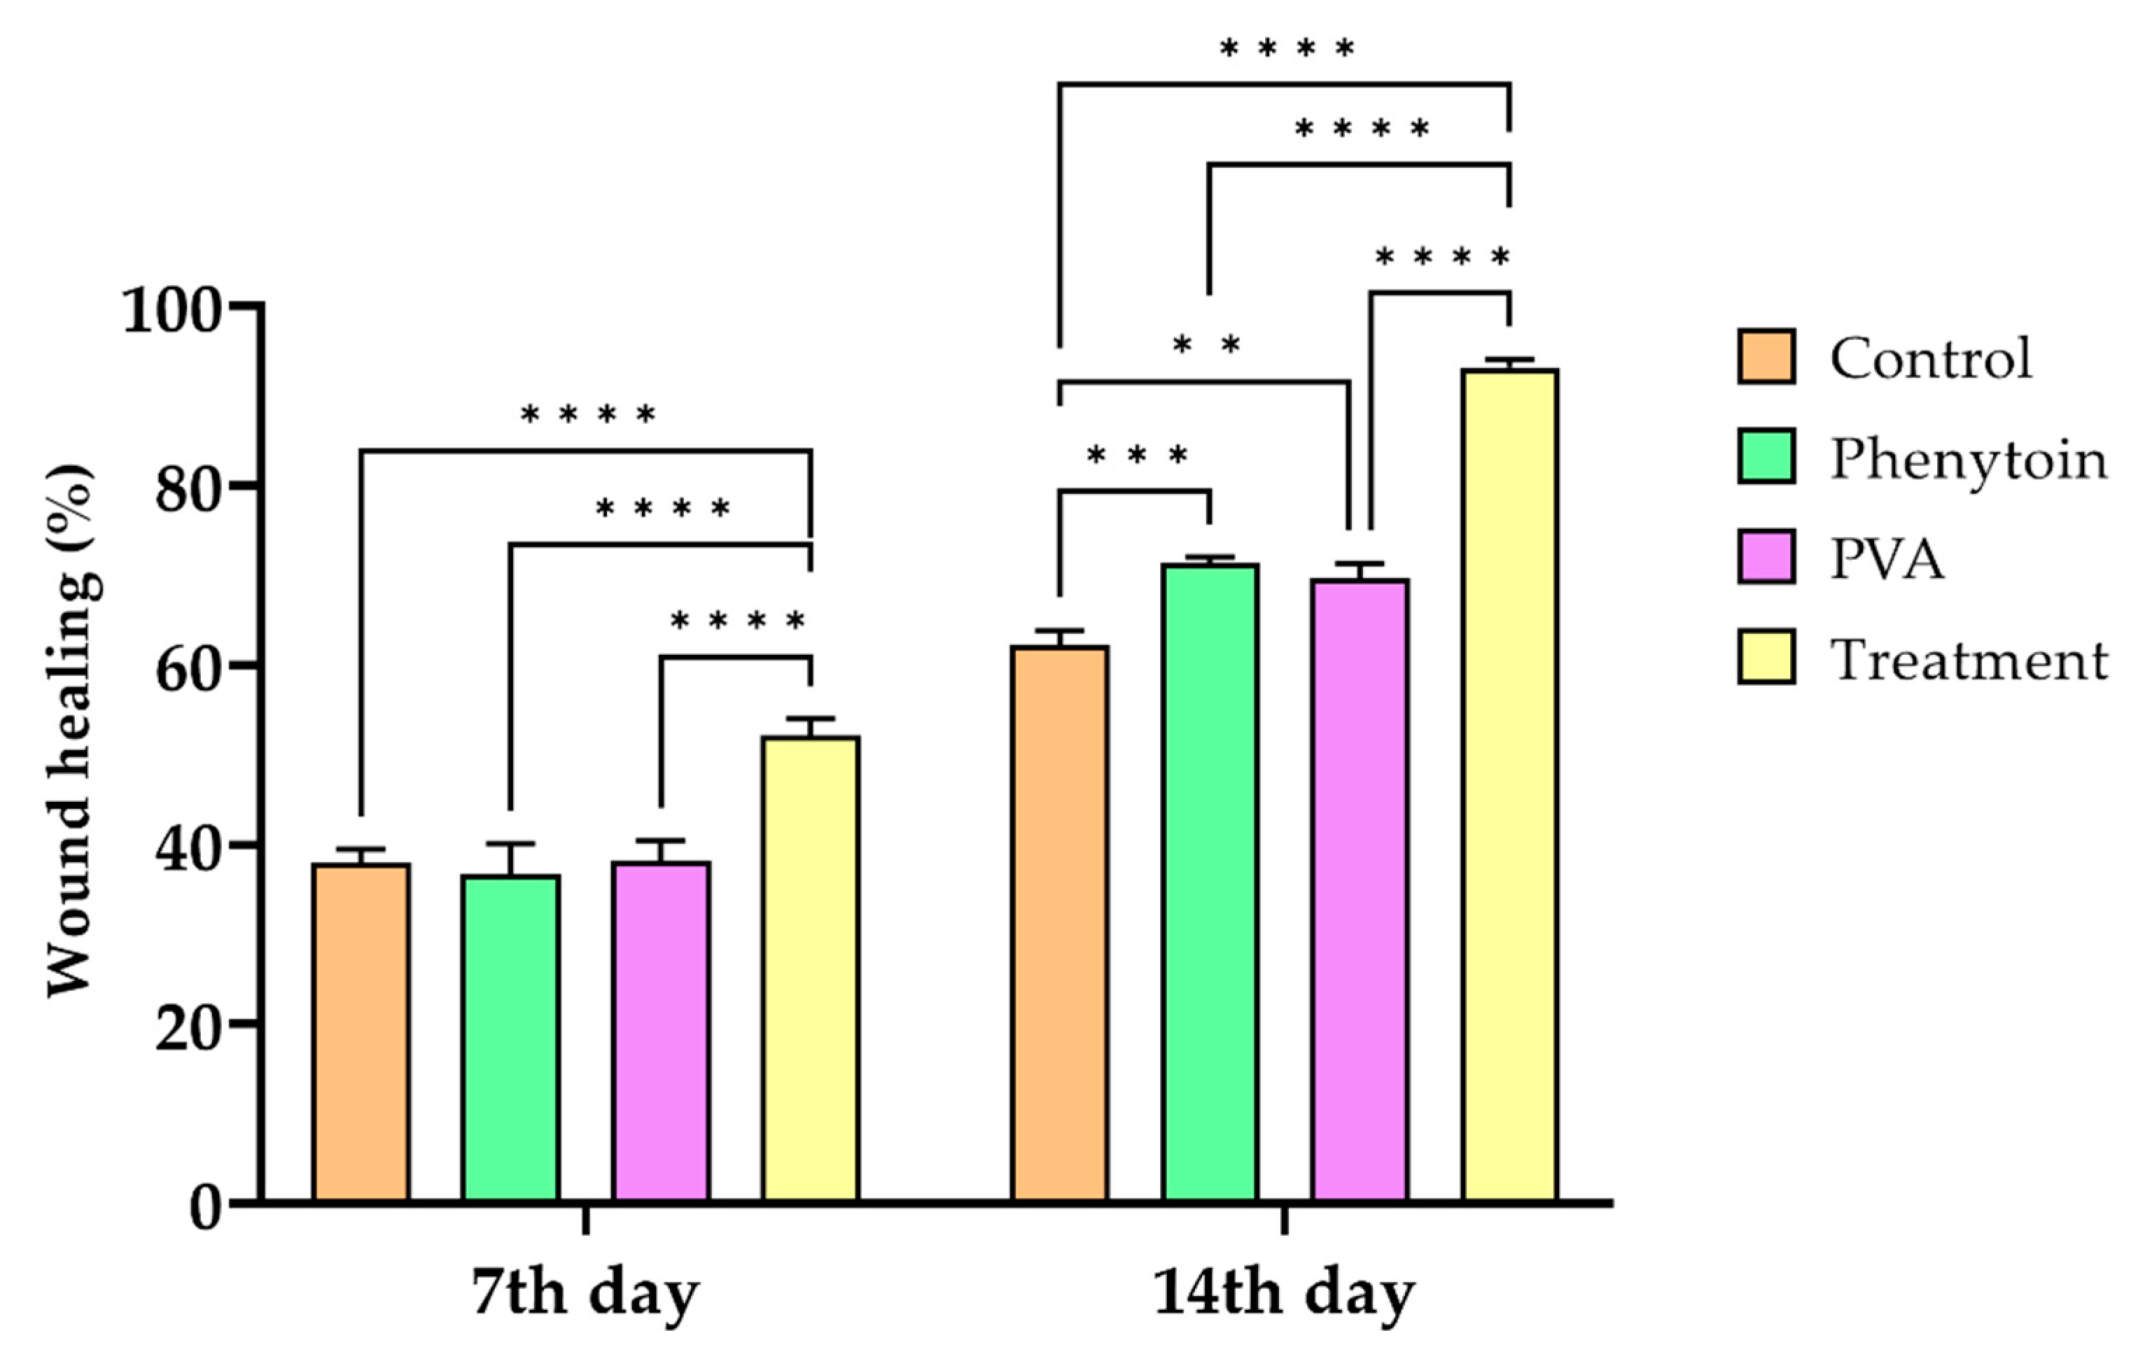
3.13. Animal Study
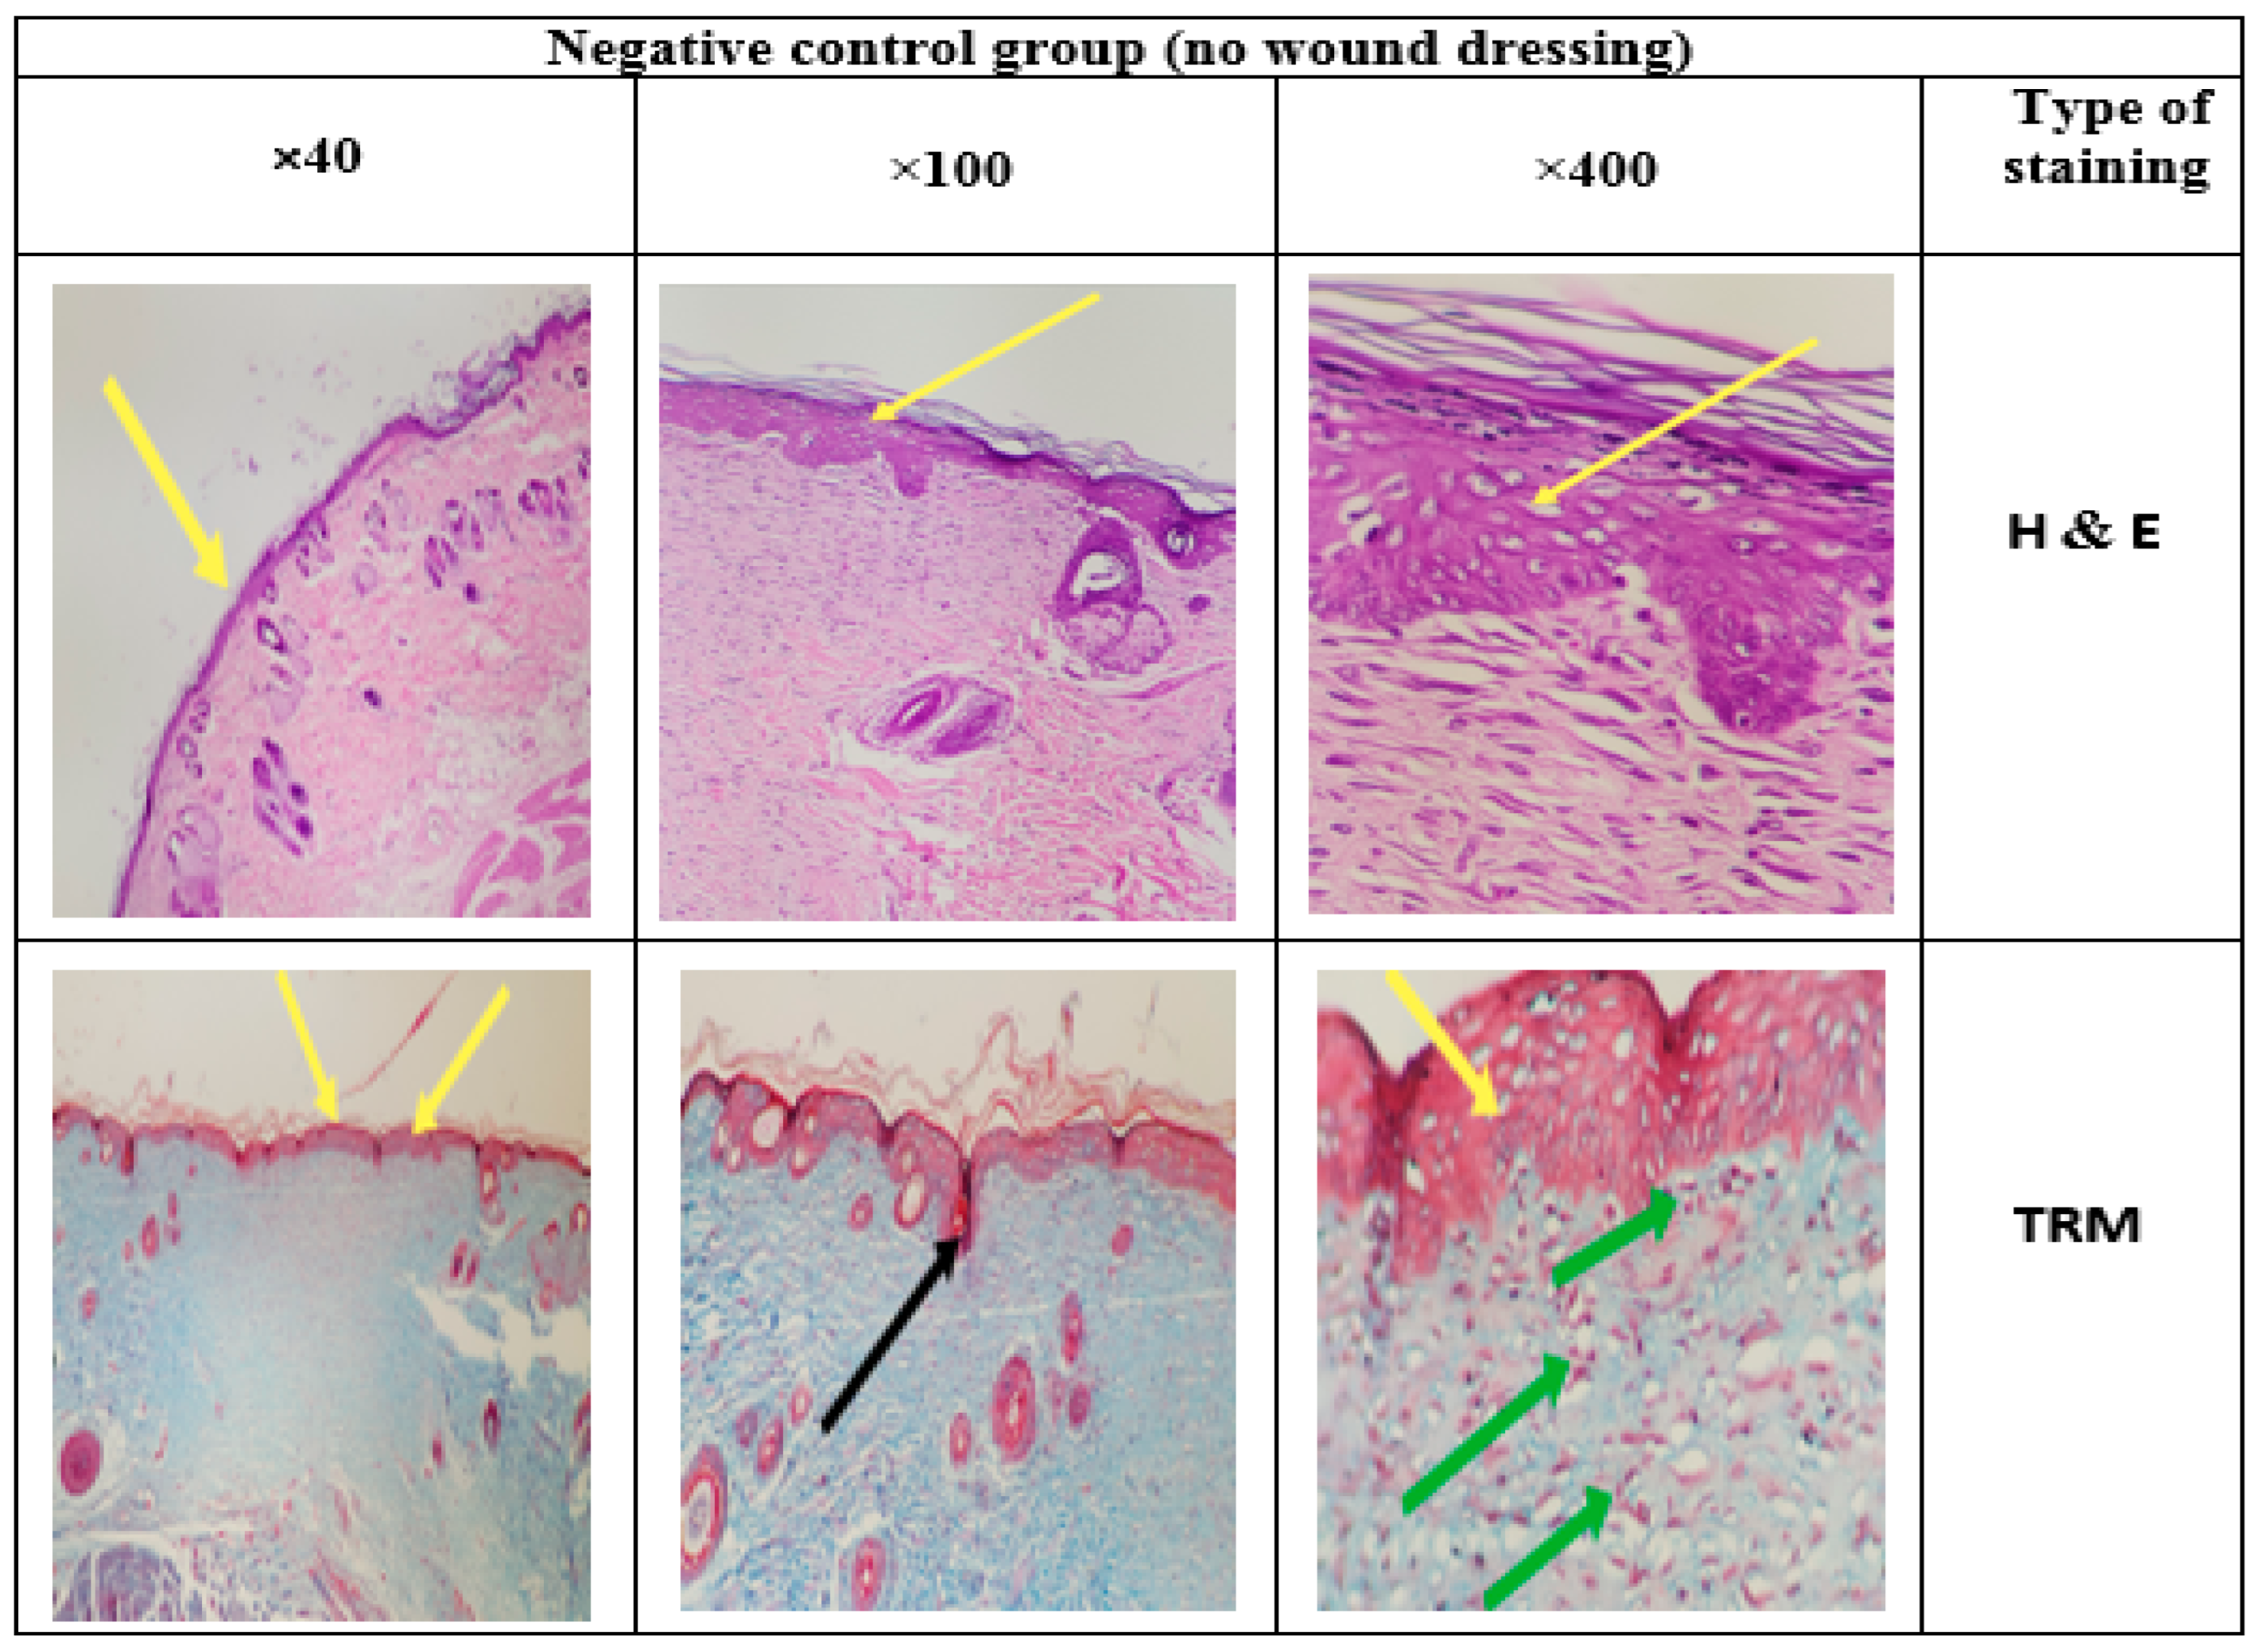
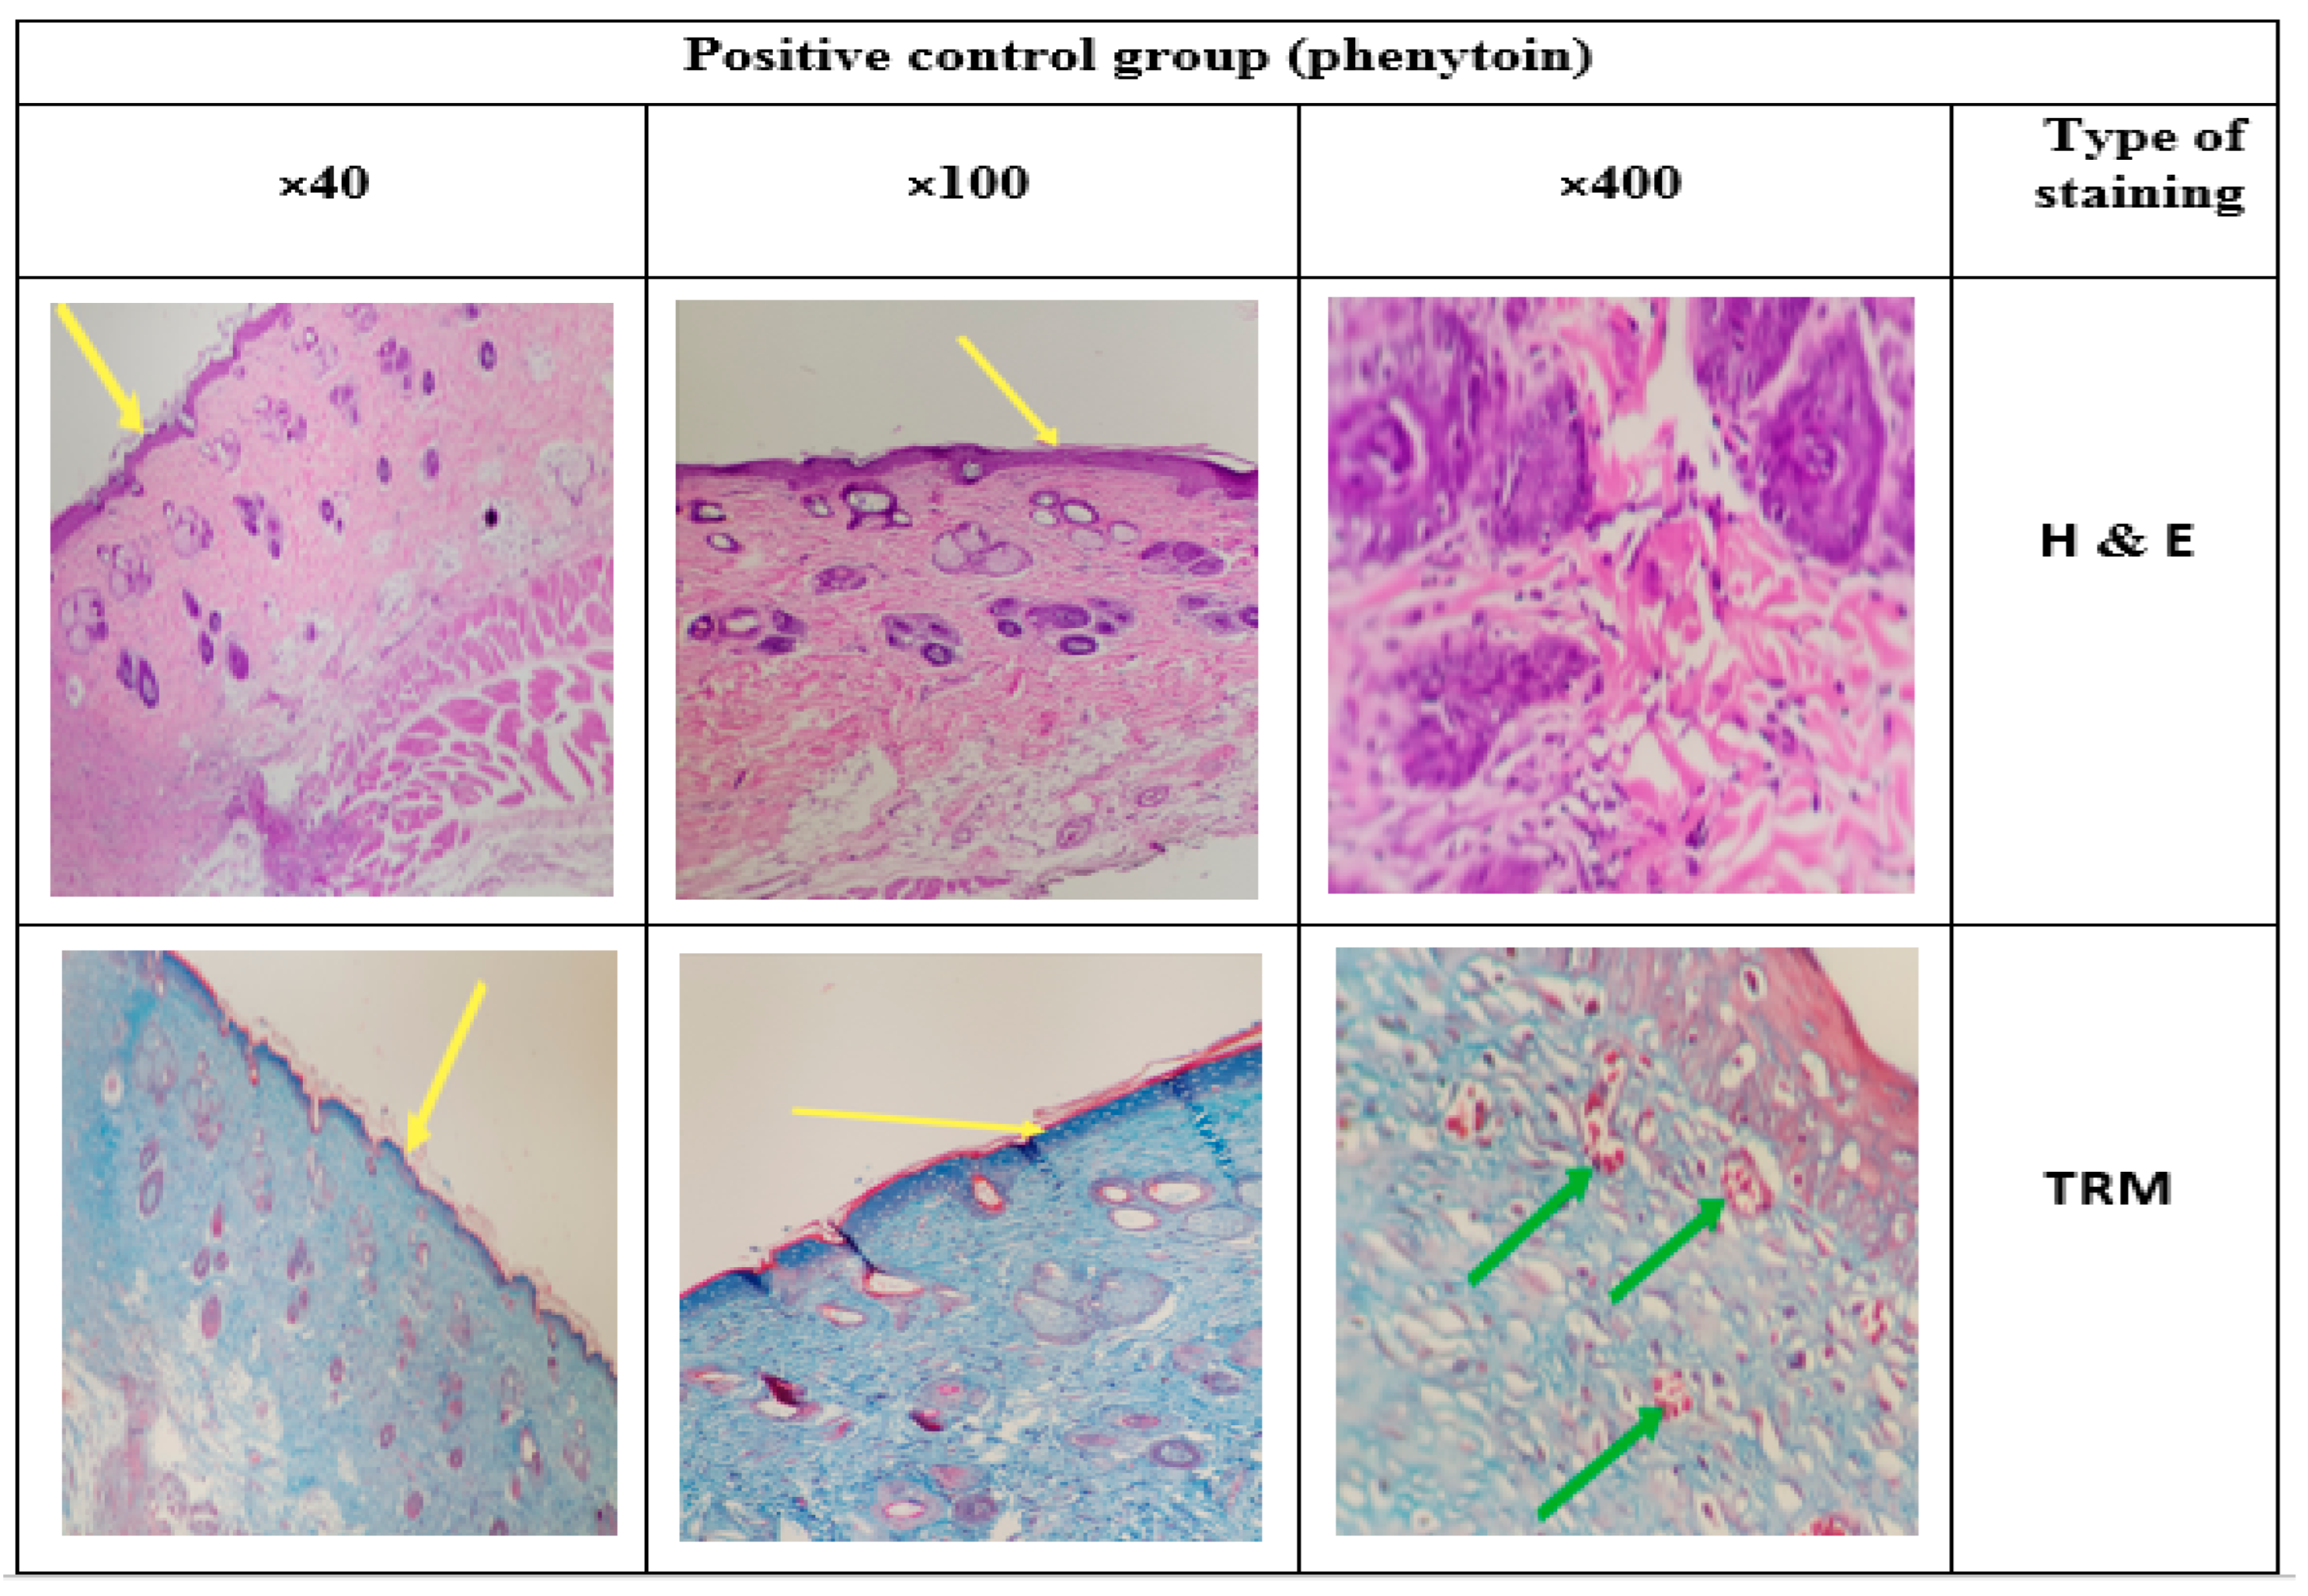
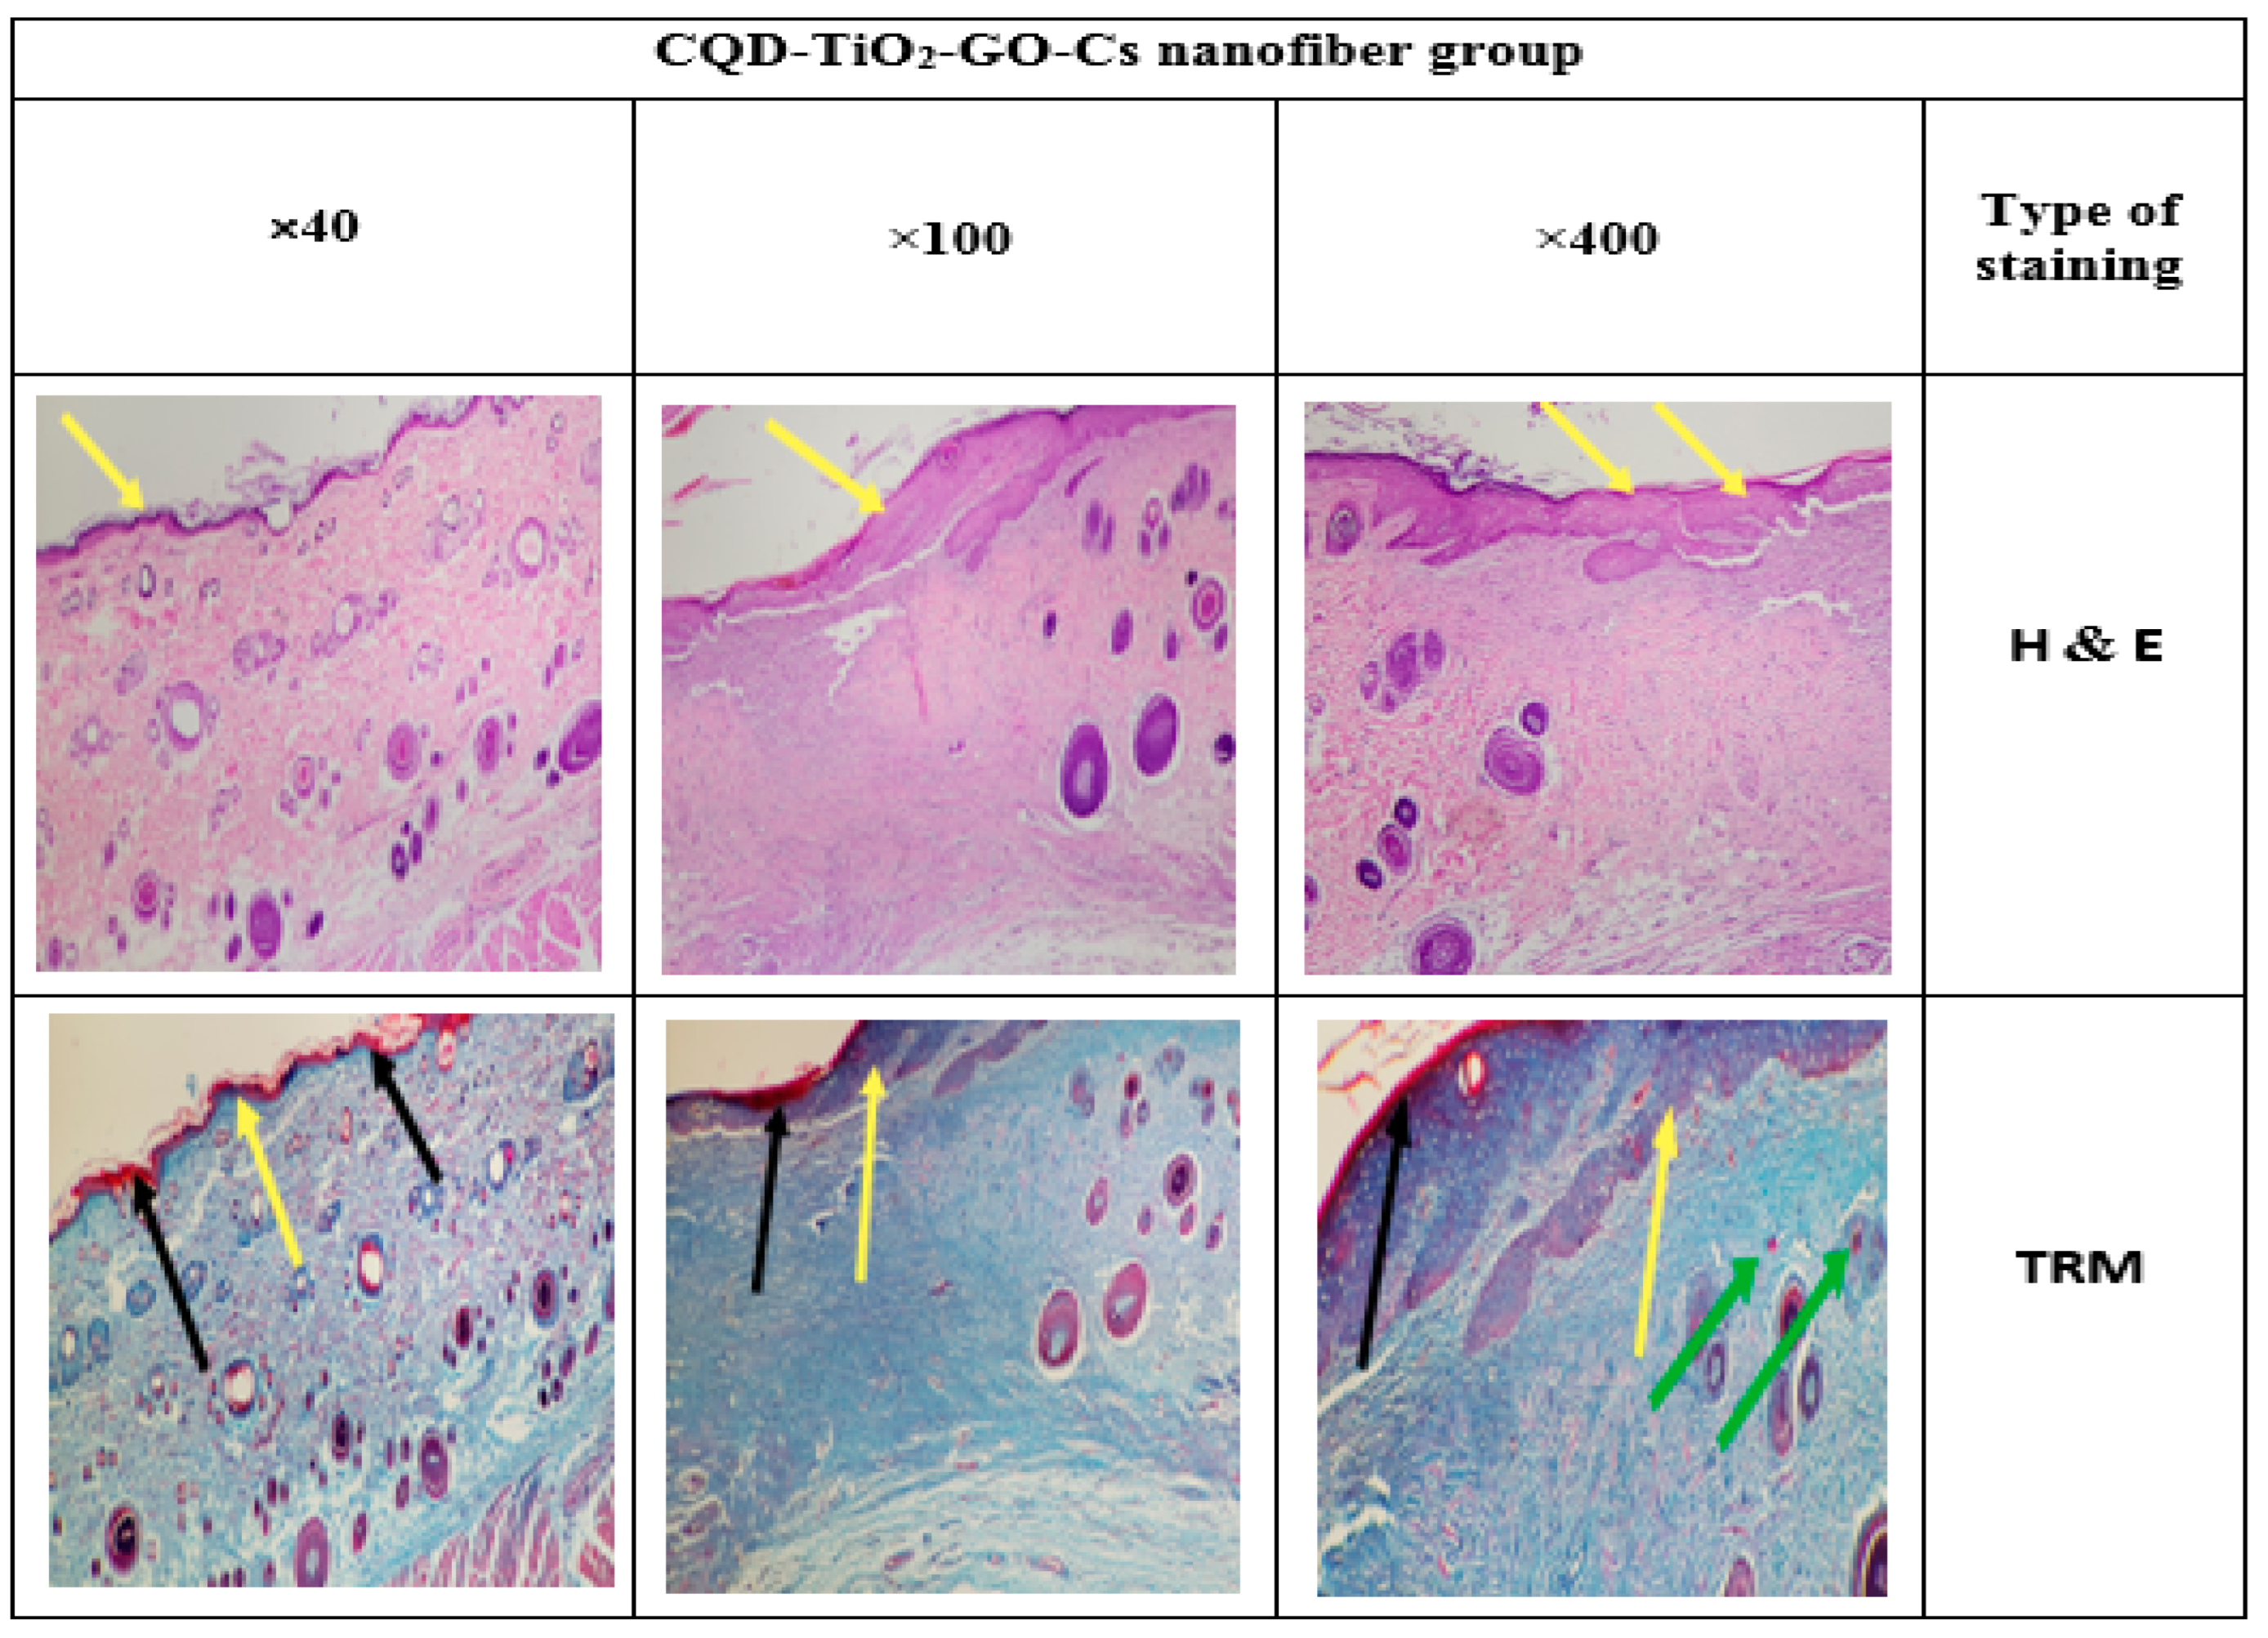
3.14. Histology
4. Conclusions
Author Contributions
Funding
Data Availability Statement
Conflicts of Interest
References
- Lamboni, L.; Li, Y.; Liu, J.; Yang, G. Silk sericin-functionalized bacterial cellulose as a potential wound-healing biomaterial. Biomacromolecules 2016, 17, 3076–3084. [Google Scholar] [CrossRef] [PubMed]
- Wulff, B.C.; Wilgus, T.A. Mast cell activity in the healing wound: More than meets the eye? Exp. Dermatol. 2013, 22, 507–510. [Google Scholar] [CrossRef] [PubMed] [Green Version]
- Mohammadnejad, J.; Yazdian, F.; Omidi, M.; Rostami, A.D.; Rasekh, B.; Fathinia, A. Graphene oxide/silver nanohybrid: Optimization, antibacterial activity and its impregnation on bacterial cellulose as a potential wound dressing based on GO-Ag nanocomposite-coated BC. Eng. Life Sci. 2018, 18, 298–307. [Google Scholar] [CrossRef] [PubMed] [Green Version]
- Cheng, G.; Li, B. Nanoparticle-based photodynamic therapy: New trends in wound healing applications. Mater. Today Adv. 2020, 6, 100049. [Google Scholar] [CrossRef]
- Khan, S.; Ul-Islam, M.; Khattak, W.A.; Ullah, M.W.; Park, J.K. Bacterial cellulose-titanium dioxide nanocomposites: Nanostructural characteristics, antibacterial mechanism, and biocompatibility. Cellulose 2015, 22, 565–579. [Google Scholar] [CrossRef]
- Gutiérrez, D.J.R.; Mathews, N.R.; Martínez, S.S. Photocatalytic activity enhancement of TiO2 thin films with silver doping under visible light. J. Photochem. Photobiol. A Chem. 2013, 262, 57–63. [Google Scholar] [CrossRef]
- Harikishore, M.; Sandhyarani, M.; Venkateswarlu, K.; Nellaippan, T.; Rameshbabu, N. Effect of Ag doping on antibacterial and photocatalytic activity of nanocrystalline TiO2. Procedia Mater. Sci. 2014, 6, 557–566. [Google Scholar] [CrossRef] [Green Version]
- Akhavan, O.; Abdolahad, M.; Abdi, Y.; Mohajerzadeh, S. Synthesis of titania/carbon nanotube heterojunction arrays for photoinactivation of E. coli in visible light irradiation. Carbon 2009, 47, 3280–3287. [Google Scholar] [CrossRef]
- Shahmoradi, S.; Golzar, H.; Hashemi, M.; Mansouri, V.; Omidi, M.; Yazdian, F.; Yadegari, A.; Tayebi, L. Optimizing the nanostructure of graphene oxide/silver/arginine for effective wound healing. Nanotechnology 2018, 29, 475101. [Google Scholar] [CrossRef]
- Behboudi, H.; Mehdipour, G.; Safari, N.; Pourmadadi, M.; Saei, A.; Omidi, M.; Tayebi, L.; Rahmandoust, M. Carbon Quantum Dots in Nanobiotechnology. In Nanomaterials for Advanced Biological Applications; Springer: Berlin/Heidelberg, Germany, 2019; pp. 145–179. [Google Scholar]
- Gao, M.X.; Liu, C.F.; Wu, Z.L.; Zeng, Q.L.; Yang, X.X.; Wu, W.B.; Li, Y.F.; Huang, C.Z. A surfactant-assisted redox hydrothermal route to prepare highly photoluminescent carbon quantum dots with aggregation-induced emission enhancement properties. Chem. Commun. 2013, 49, 8015–8017. [Google Scholar] [CrossRef]
- Rahmandoust, M.; Ayatollahi, M.R. Nanomaterials for Advanced Biological Applications; Springer: Berlin/Heidelberg, Germany, 2019; Volume 104. [Google Scholar]
- Tao, H.; Yang, K.; Ma, Z.; Wan, J.; Zhang, Y.; Kang, Z.; Liu, Z. In vivo NIR fluorescence imaging, biodistribution, and toxicology of photoluminescent carbon dots produced from carbon nanotubes and graphite. Small 2012, 8, 281–290. [Google Scholar] [CrossRef]
- Malmir, S.; Karbalaei, A.; Pourmadadi, M.; Hamedi, J.; Yazdian, F.; Navaee, M. Antibacterial properties of a bacterial cellulose CQD-TiO2 nanocomposite. Carbohydr. Polym. 2020, 234, 115835. [Google Scholar] [CrossRef]
- Hashemi, M.; Yadegari, A.; Yazdanpanah, G.; Omidi, M.; Jabbehdari, S.; Haghiralsadat, F.; Yazdian, F.; Tayebi, L. Normalization of doxorubicin release from graphene oxide: New approach for optimization of effective parameters on drug loading. Biotechnol. Appl. Biochem. 2017, 64, 433–442. [Google Scholar] [CrossRef]
- Rehman, S.R.U.; Augustine, R.; Zahid, A.A.; Ahmed, R.; Tariq, M.; Hasan, A. Reduced Graphene Oxide Incorporated GelMA Hydrogel Promotes Angiogenesis For Wound Healing Applications. Int. J. Nanomed. 2019, 14, 9603–9617. [Google Scholar] [CrossRef] [Green Version]
- Smith, A.T.; LaChance, A.M.; Zeng, S.; Liu, B.; Sun, L. Synthesis, properties, and applications of graphene oxide/reduced graphene oxide and their nanocomposites. Nano Mater. Sci. 2019, 1, 31–47. [Google Scholar] [CrossRef]
- Mukherjee, S.; Sriram, P.; Barui, A.K.; Nethi, S.K.; Veeriah, V.; Chatterjee, S.; Suresh, K.I.; Patra, C.R. Graphene oxides show angiogenic properties. Adv. Healthc. Mater. 2015, 4, 1722–1732. [Google Scholar] [CrossRef]
- Ushio-Fukai, M.; Alexander, R.W. Reactive oxygen species as mediators of angiogenesis signaling. Role of NAD (P) H oxidase. Mol. Cell. Biochem. 2004, 264, 85–97. [Google Scholar] [CrossRef]
- Liu, J.; Yu, Q.; Yu, M.; Li, S.; Zhao, K.; Xue, B.; Zu, H. Silane modification of titanium dioxide-decorated graphene oxide nanocomposite for enhancing anticorrosion performance of epoxy coatings on AA-2024. J. Alloy. Compd. 2018, 744, 728–739. [Google Scholar] [CrossRef]
- Koosha, M.; Mirzadeh, H. Electrospinning, mechanical properties, and cell behavior study of chitosan/PVA nanofibers. J. Biomed. Mater. Res. Part A 2015, 103, 3081–3093. [Google Scholar] [CrossRef]
- Dubey, P.; Bhushan, B.; Sachdev, A.; Matai, I.; Uday Kumar, S.; Gopinath, P. Silver-nanoparticle-incorporated composite nanofibers for potential wound-dressing applications. J. Appl. Polym. Sci. 2015, 132, 42473. [Google Scholar] [CrossRef]
- Koosha, M.; Mirzadeh, H.; Shokrgozar, M.A.; Farokhi, M. Nanoclay-reinforced electrospun chitosan/PVA nanocomposite nanofibers for biomedical applications. RSC Adv. 2015, 5, 10479–10487. [Google Scholar] [CrossRef]
- Jatoi, A.W.; Ogasawara, H.; Kim, I.S.; Ni, Q.-Q. Polyvinyl alcohol nanofiber based three phase wound dressings for sustained wound healing applications. Mater. Lett. 2019, 241, 168–171. [Google Scholar] [CrossRef]
- Norouzi, M.A.; Montazer, M.; Harifi, T.; Karimi, P. Flower buds like PVA/ZnO composite nanofibers assembly: Antibacterial, in vivo wound healing, cytotoxicity and histological studies. Polym. Test. 2021, 93, 106914. [Google Scholar] [CrossRef]
- Dubey, P.; Gopinath, P. PEGylated graphene oxide-based nanocomposite-grafted chitosan/polyvinyl alcohol nanofiber as an advanced antibacterial wound dressing. RSC Adv. 2016, 6, 69103–69116. [Google Scholar] [CrossRef]
- Dash, M.; Chiellini, F.; Ottenbrite, R.M.; Chiellini, E. Chitosan—A versatile semi-synthetic polymer in biomedical applications. Prog. Polym. Sci. 2011, 36, 981–1014. [Google Scholar] [CrossRef]
- Abolghasemzade, S.; Pourmadadi, M.; Rashedi, H.; Yazdian, F.; Kianbakht, S.; Navaei-Nigjeh, M. PVA based nanofiber containing CQDs modified with silica NPs and silk fibroin accelerates wound healing in a rat model. J. Mater. Chem. B 2021, 9, 658–676. [Google Scholar] [CrossRef]
- Mahmoodi, N.M.; Oveisi, M.; Taghizadeh, A.; Taghizadeh, M. Synthesis of pearl necklace-like ZIF-8@ chitosan/PVA nanofiber with synergistic effect for recycling aqueous dye removal. Carbohydr. Polym. 2020, 227, 115364. [Google Scholar] [CrossRef]
- Gerami, S.E.; Pourmadadi, M.; Fatoorehchi, H.; Yazdian, F.; Rashedi, H.; Nigjeh, M.N. Preparation of pH-sensitive chitosan/polyvinylpyrrolidone/α-Fe2O3 nanocomposite for drug delivery application: Emphasis on ameliorating restrictions. Int. J. Biol. Macromolecules 2021, 173, 409–420. [Google Scholar] [CrossRef]
- Samadian, S.; Karbalaei, A.; Pourmadadi, M.; Yazdian, F.; Rashedi, H.; Omidi, M.; Malmir, S. A novel alginate-gelatin microcapsule to enhance bone differentiation of mesenchymal stem cells. Int. J. Polym. Mater. Polym. Biomater. 2021, 71, 395–402. [Google Scholar] [CrossRef]
- Zavareh, H.S.; Pourmadadi, M.; Moradi, A.; Yazdian, F.; Omidi, M. Chitosan/carbon quantum dot/aptamer complex as a potential anticancer drug delivery system towards the release of 5-fluorouracil. Int. J. Biol. Macromol. 2020, 165, 1422–1430. [Google Scholar] [CrossRef]
- Pourmadadi, M.; Shayeh, J.S.; Arjmand, S.; Omidi, M.; Fatemi, F. An electrochemical sandwich immunosensor of vascular endothelial growth factor based on reduced graphene oxide/gold nanoparticle composites. Microchem. J. 2020, 159, 105476. [Google Scholar] [CrossRef]
- Salmeh, M.A.; Pourmadadi, M.; Yazdian, F.; Rashedi, H. Antibacterial Polymeric Wound Dressing Based On PVA/Graphene Oxide-Nigella Sativa-Arginine. In Proceedings of the 2020 27th National and 5th International Iranian Conference on Biomedical Engineering (ICBME), Tehran, Iran, 26–27 November 2020; pp. 61–66. [Google Scholar]
- Pourmadadi, M.; Shayeh, J.S.; Omidi, M.; Yazdian, F.; Alebouyeh, M.; Tayebi, L. A glassy carbon electrode modified with reduced graphene oxide and gold nanoparticles for electrochemical aptasensing of lipopolysaccharides from Escherichia coli bacteria. Microchim. Acta 2019, 186, 787. [Google Scholar] [CrossRef]
- Naderian, N.; Pourmadadi, M.; Rashedi, H.; Yazdian, F. Design of a Novel Nanobiosensor for the Diagnosis of Acute Lymphoid Leukemia (ALL) by Measurement of miRNA-128. In Proceedings of the 2020 27th National and 5th International Iranian Conference on Biomedical Engineering (ICBME), Tehran, Iran, 26–27 November 2020; pp. 41–46. [Google Scholar]
- Tabar, F.S.; Pourmadadi, M.; Rashedi, H.; Yazdian, F. Design of Electrochemical Nanobiosensor in the Diagnosis of Prostate Specific Antigen (PSA) Using Nanostructures. In Proceedings of the 2020 27th National and 5th International Iranian Conference on Biomedical Engineering (ICBME), Tehran, Iran, 26–27 November 2020; pp. 35–40. [Google Scholar]
- Dinani, H.S.; Pourmadadi, M.; Rashedi, H.; Yazdian, F. Fabrication of nanomaterial-based biosensor for measurement of a microRNA involved in cancer. In Proceedings of the 2020 27th National and 5th International Iranian Conference on Biomedical Engineering (ICBME), Tehran, Iran, 26–27 November 2020; pp. 47–54. [Google Scholar]
- Mansur, H.S.; Sadahira, C.M.; Souza, A.N.; Mansur, A.A. FTIR spectroscopy characterization of poly (vinyl alcohol) hydrogel with different hydrolysis degree and chemically crosslinked with glutaraldehyde. Mater. Sci. Eng. C 2008, 28, 539–548. [Google Scholar] [CrossRef]
- Adeli, H.; Khorasani, M.T.; Parvazinia, M. Wound dressing based on electrospun PVA/chitosan/starch nanofibrous mats: Fabrication, antibacterial and cytocompatibility evaluation and in vitro healing assay. Int. J. Biol. Macromol. 2019, 122, 238–254. [Google Scholar] [CrossRef]
- Damayanti, N. Preparation of superhydrophobic PET fabric from Al 2 O 3–SiO 2 hybrid: Geometrical approach to create high contact angle surface from low contact angle materials. J. Sol-Gel Sci. Technol. 2010, 56, 47–52. [Google Scholar] [CrossRef]
- Golzar, H.; Yazdian, F.; Hashemi, M.; Omidi, M.; Mohammadrezaei, D.; Rashedi, H.; Farahani, M.; Ghasemi, N.; Tayebi, L. Optimizing the hybrid nanostructure of functionalized reduced graphene oxide/silver for highly efficient cancer nanotherapy. New J. Chem. 2018, 42, 13157–13168. [Google Scholar] [CrossRef]
- Sothornvit, R.; Olsen, C.; McHugh, T.; Krochta, J. Tensile properties of compression-molded whey protein sheets: Determination of molding condition and glycerol-content effects and comparison with solution-cast films. J. Food Eng. 2007, 78, 855–860. [Google Scholar] [CrossRef]
- Kang, E.B.; Choi, C.A.; Mazrad, Z.A.I.; Kim, S.H.; In, I.; Park, S.Y. Determination of Cancer Cell-Based pH-Sensitive Fluorescent Carbon Nanoparticles of Cross-Linked Polydopamine by Fluorescence Sensing of Alkaline Phosphatase Activity on Coated Surfaces and Aqueous Solution. Anal. Chem. 2017, 89, 13508–13517. [Google Scholar] [CrossRef]
- Irfan, M.; Ahmad, T.; Moniruzzaman, M.; Bhattacharjee, S.; Abdullah, B. Size and stability modulation of ionic liquid functionalized gold nanoparticles synthesized using Elaeis guineensis (oil palm) kernel extract. Arab. J. Chem. 2020, 13, 75–85. [Google Scholar] [CrossRef]
- Batista, K.A.; Lopes, F.M.; Yamashita, F.; Fernandes, K.F. Lipase entrapment in PVA/Chitosan biodegradable film for reactor coatings. Mater. Sci. Eng. C 2013, 33, 1696–1701. [Google Scholar] [CrossRef]
- Liu, Y.; Wang, S.; Lan, W. Fabrication of antibacterial chitosan-PVA blended film using electrospray technique for food packaging applications. Int. J. Biol. Macromol. 2018, 107, 848–854. [Google Scholar] [CrossRef] [PubMed]
- Ahmed, J.; Luciano, G.; Schizzi, I.; Arfat, Y.A.; Maggiore, S.; Thai, T.L.A. Non-isothermal crystallization behavior, rheological properties and morphology of poly (ε-caprolactone)/graphene oxide nanosheets composite films. Thermochim. Acta 2018, 659, 96–104. [Google Scholar] [CrossRef]
- Yang, Y.; Wang, Q.; Qiu, W.; Guo, H.; Gao, F. Covalent immobilization of Cu3 (btc) 2 at chitosan–electroreduced graphene oxide hybrid film and its application for simultaneous detection of dihydroxybenzene isomers. J. Phys. Chem. C 2016, 120, 9794–9803. [Google Scholar] [CrossRef]
- Abdelrazek, E.; Elashmawi, I.; Labeeb, S. Chitosan filler effects on the experimental characterization, spectroscopic investigation and thermal studies of PVA/PVP blend films. Phys. B Condens. Matter 2010, 405, 2021–2027. [Google Scholar] [CrossRef]
- Zhang, Y.; Wang, X.; Cao, M. Confinedly implanted NiFe 2 O 4-rGO: Cluster tailoring and highly tunable electromagnetic properties for selective-frequency microwave absorption. Nano Res. 2018, 11, 1426–1436. [Google Scholar] [CrossRef] [Green Version]
- Li, W.; Song, B.; Zhang, S.; Zhang, F.; Liu, C.; Zhang, N.; Yao, H.; Shi, Y. Using 3-Isocyanatopropyltrimethoxysilane to decorate graphene oxide with nano-titanium dioxide for enhancing the anti-corrosion properties of epoxy coating. Polymers 2020, 12, 837. [Google Scholar] [CrossRef] [Green Version]
- Osman, Z.; Arof, A.K. FTIR studies of chitosan acetate based polymer electrolytes. Electrochim. Acta 2003, 48, 993–999. [Google Scholar] [CrossRef]
- Lawrie, G.; Keen, I.; Drew, B.; Chandler-Temple, A.; Rintoul, L.; Fredericks, P.; Grøndahl, L. Interactions between alginate and chitosan biopolymers characterized using FTIR and XPS. Biomacromolecules 2007, 8, 2533–2541. [Google Scholar] [CrossRef]
- Santos, C.; Silva, C.J.; Büttel, Z.; Guimarães, R.; Pereira, S.B.; Tamagnini, P.; Zille, A. Preparation and characterization of polysaccharides/PVA blend nanofibrous membranes by electrospinning method. Carbohydr. Polym. 2014, 99, 584–592. [Google Scholar] [CrossRef] [Green Version]
- Sanchez-Alvarado, D.I.; Guzmán-Pantoja, J.; Páramo-García, U.; Maciel-Cerda, A.; Martínez-Orozco, R.D.; Vera-Graziano, R. Morphological study of Chitosan/Poly (vinyl alcohol) nanofibers prepared by electrospinning, collected on reticulated vitreous carbon. Int. J. Mol. Sci. 2018, 19, 1718. [Google Scholar] [CrossRef]
- Gonçalves, R.P.; Ferreira, W.H.; Gouvêa, R.F.; Andrade, C.T. Effect of chitosan on the properties of electrospun fibers from mixed poly (vinyl alcohol)/chitosan solutions. Mater. Res. 2017, 20, 984–993. [Google Scholar] [CrossRef]
- Stankovich, S.; Dikin, D.A.; Piner, R.D.; Kohlhaas, K.A.; Kleinhammes, A.; Jia, Y.; Wu, Y.; Nguyen, S.T.; Ruoff, R.S. Synthesis of graphene-based nanosheets via chemical reduction of exfoliated graphite oxide. Carbon 2007, 45, 1558–1565. [Google Scholar] [CrossRef]
- Štengl, V.; Bakardjieva, S.; Grygar, T.M.; Bludská, J.; Kormunda, M. TiO 2-graphene oxide nanocomposite as advanced photocatalytic materials. Chem. Cent. J. 2013, 7, 41. [Google Scholar] [CrossRef] [Green Version]
- Jung, H.-G.; Myung, S.-T.; Yoon, C.S.; Son, S.-B.; Oh, K.H.; Amine, K.; Scrosati, B.; Sun, Y.-K. Microscale spherical carbon-coated Li 4 Ti 5 O 12 as ultra high power anode material for lithium batteries. Energy Environ. Sci. 2011, 4, 1345–1351. [Google Scholar] [CrossRef]
- Debrah, P.; Kwapong, A.A.; Fredua-Agyeman, M. Treatment of Biofilms in Infected Wounds. In Therapeutic Dressings and Wound Healing Applications; John Wiley & Sons: Hoboken, NJ, USA, 2020; pp. 115–136. [Google Scholar]
- Li, H.; Shi, W.; Zeng, X.; Huang, S.; Zhang, H.; Qin, X. Improved desalination properties of hydrophobic GO-incorporated PVDF electrospun nanofibrous composites for vacuum membrane distillation. Sep. Purif. Technol. 2020, 230, 115889. [Google Scholar] [CrossRef]
- Li, H.; Shi, W.; Zhang, H.; Zhou, R.; Qin, X. Preparation of internally pressurized polyamide thin-film composite hollow fiber nanofiltration membrane with high ions selectivity by a facile coating method. Prog. Org. Coat. 2019, 139, 105456. [Google Scholar] [CrossRef]
- Zahirifar, J.; Karimi-Sabet, J.; Moosavian, S.M.A.; Hadi, A.; Khadiv-Parsi, P. Fabrication of a novel octadecylamine functionalized graphene oxide/PVDF dual-layer flat sheet membrane for desalination via air gap membrane distillation. Desalination 2018, 428, 227–239. [Google Scholar] [CrossRef]
- Agrawal, P.; Pramanik, K. Chitosan-poly (vinyl alcohol) nanofibers by free surface electrospinning for tissue engineering applications. Tissue Eng. Regen. Med. 2016, 13, 485–497. [Google Scholar] [CrossRef]
- Alhosseini, S.N.; Moztarzadeh, F.; Mozafari, M.; Asgari, S.; Dodel, M.; Samadikuchaksaraei, A.; Kargozar, S.; Jalali, N. Synthesis and characterization of electrospun polyvinyl alcohol nanofibrous scaffolds modified by blending with chitosan for neural tissue engineering. Int. J. Nanomed. 2012, 7, 25. [Google Scholar]
- Zahouani, H.; Pailler-Mattei, C.; Sohm, B.; Vargiolu, R.; Cenizo, V.; Debret, R. Characterization of the mechanical properties of a dermal equivalent compared with human skin in vivo by indentation and static friction tests. Ski. Res. Technol. 2009, 15, 68–76. [Google Scholar] [CrossRef]
- Tobin, D.J. Introduction to skin aging. J. Tissue Viability 2017, 26, 37–46. [Google Scholar] [CrossRef] [PubMed]
- Bagher, Z.; Ehterami, A.; Safdel, M.H.; Khastar, H.; Semiari, H.; Asefnejad, A.; Davachi, S.M.; Mirzaii, M.; Salehi, M. Wound healing with alginate/chitosan hydrogel containing hesperidin in rat model. J. Drug Deliv. Sci. Technol. 2020, 55, 101379. [Google Scholar] [CrossRef]
- Alavarse, A.C.; de Oliveira Silva, F.W.; Colque, J.T.; da Silva, V.M.; Prieto, T.; Venancio, E.C.; Bonvent, J.-J. Tetracycline hydrochloride-loaded electrospun nanofibers mats based on PVA and chitosan for wound dressing. Mater. Sci. Eng. C 2017, 77, 271–281. [Google Scholar] [CrossRef] [PubMed]
- Abdelgawad, A.M.; Hudson, S.M.; Rojas, O.J. Antimicrobial wound dressing nanofiber mats from multicomponent (chitosan/silver-NPs/polyvinyl alcohol) systems. Carbohydr. Polym. 2014, 100, 166–178. [Google Scholar] [CrossRef] [PubMed]
- Zhou, L.; Yu, K.; Lu, F.; Lan, G.; Dai, F.; Shang, S.; Hu, E. Minimizing antibiotic dosage through in situ formation of gold nanoparticles across antibacterial wound dressings: A facile approach using silk fabric as the base substrate. J. Clean. Prod. 2020, 243, 118604. [Google Scholar] [CrossRef]
- Motawea, A.; Abd El, A.E.-G.H.; Borg, T.; Motawea, M.; Tarshoby, M. The impact of topical phenytoin loaded nanostructured lipid carriers in diabetic foot ulceration. Foot 2019, 40, 14–21. [Google Scholar] [CrossRef]
- Motealleh, B.; Zahedi, P.; Rezaeian, I.; Moghimi, M.; Abdolghaffari, A.H.; Zarandi, M.A. Morphology, drug release, antibacterial, cell proliferation, and histology studies of chamomile-loaded wound dressing mats based on electrospun nanofibrous poly (ɛ-caprolactone)/polystyrene blends. J. Biomed. Mater. Res. Part B Appl. Biomater. 2014, 102, 977–987. [Google Scholar] [CrossRef]
- Marulasiddeshwara, R.; Jyothi, M.; Soontarapa, K.; Keri, R.S.; Velmurugan, R. Nonwoven fabric supported, chitosan membrane anchored with curcumin/TiO2 complex: Scaffolds for MRSA infected wound skin reconstruction. Int. J. Biol. Macromol. 2020, 144, 85–93. [Google Scholar] [CrossRef]
- Bolle, E.C.; Bartnikowski, N.; Haridas, P.; Parker, T.J.; Fraser, J.F.; Gregory, S.D.; Dargaville, T.R. Improving skin integration around long-term percutaneous devices using fibrous scaffolds in a reconstructed human skin equivalent model. J. Biomed. Mater. Res. Part B Appl. Biomater. 2020, 108, 738–749. [Google Scholar] [CrossRef]
- Murphy, S.V.; Skardal, A.; Nelson Jr, R.A.; Sunnon, K.; Reid, T.; Clouse, C.; Kock, N.D.; Jackson, J.; Soker, S.; Atala, A. Amnion membrane hydrogel and amnion membrane powder accelerate wound healing in a full thickness porcine skin wound model. Stem Cells Transl. Med. 2020, 9, 80–92. [Google Scholar] [CrossRef]


| Bacterium Name | Standard Number | Gram Reaction |
|---|---|---|
| Staphylococcus aureus | PTCC1431 | positive |
| Escherichia coli O157:H7 | PTCC700728 | negative |
| NC | CS-CQD-TiO2-GO Electrospun Nanofiber | ||
|---|---|---|---|
| Element | wt.% | Element | wt.% |
| C | 44.21 | C | 37.75 |
| N | 6.42 | N | 7.43 |
| O | 49.37 | O | 54.52 |
| Ti | - | Ti | 0.31 |
| Groups | ||
|---|---|---|
| 7th Day | 14th Day | |
| Control | 38.025 ± 1.484 | 62.175 ± 1.583 |
| Phenytoin | 36.675 ± 3.435 | 71.34 ± 0.669 a |
| PVA | 38.163 ± 2.257 | 69.659 ± 1.597 a,e |
| CS-CQD-TiO2-GO nanofibrous mats | 52.102 ± 1.861 c | 93.137 ± 0.885 b,d |
Publisher’s Note: MDPI stays neutral with regard to jurisdictional claims in published maps and institutional affiliations. |
© 2022 by the authors. Licensee MDPI, Basel, Switzerland. This article is an open access article distributed under the terms and conditions of the Creative Commons Attribution (CC BY) license (https://creativecommons.org/licenses/by/4.0/).
Share and Cite
Norouzi, F.; Pourmadadi, M.; Yazdian, F.; Khoshmaram, K.; Mohammadnejad, J.; Sanati, M.H.; Chogan, F.; Rahdar, A.; Baino, F. PVA-Based Nanofibers Containing Chitosan Modified with Graphene Oxide and Carbon Quantum Dot-Doped TiO2 Enhance Wound Healing in a Rat Model. J. Funct. Biomater. 2022, 13, 300. https://doi.org/10.3390/jfb13040300
Norouzi F, Pourmadadi M, Yazdian F, Khoshmaram K, Mohammadnejad J, Sanati MH, Chogan F, Rahdar A, Baino F. PVA-Based Nanofibers Containing Chitosan Modified with Graphene Oxide and Carbon Quantum Dot-Doped TiO2 Enhance Wound Healing in a Rat Model. Journal of Functional Biomaterials. 2022; 13(4):300. https://doi.org/10.3390/jfb13040300
Chicago/Turabian StyleNorouzi, Fatemeh, Mehrab Pourmadadi, Fatemeh Yazdian, Keyvan Khoshmaram, Javad Mohammadnejad, Mohammad Hossein Sanati, Faraz Chogan, Abbas Rahdar, and Francesco Baino. 2022. "PVA-Based Nanofibers Containing Chitosan Modified with Graphene Oxide and Carbon Quantum Dot-Doped TiO2 Enhance Wound Healing in a Rat Model" Journal of Functional Biomaterials 13, no. 4: 300. https://doi.org/10.3390/jfb13040300