
Fluorescent Probes with Förster Resonance Energy Transfer Function for Monitoring the Gelation and Formation of Nanoparticles Based on Chitosan Copolymers


Abstract
:1. Introduction
2. Materials and Methods
2.1. Reagents
2.2. Chitosan PEGylation and Pyrene Modification
2.3. Obtaining and Characterizing Nanoparticles
2.4. Fluorescence Approach to Study of Nanoparticles and Gel Formation
2.5. FTIR Spectroscopy
3. Results and Discussion
3.1. Polymer and Particle Characterization
3.2. Grafting of Polymers with Pyrene
3.2.1. FTIR Spectroscopy
3.2.2. UV and Fluorescence Spectroscopy
3.3. Gel or Nanoparticle Formation
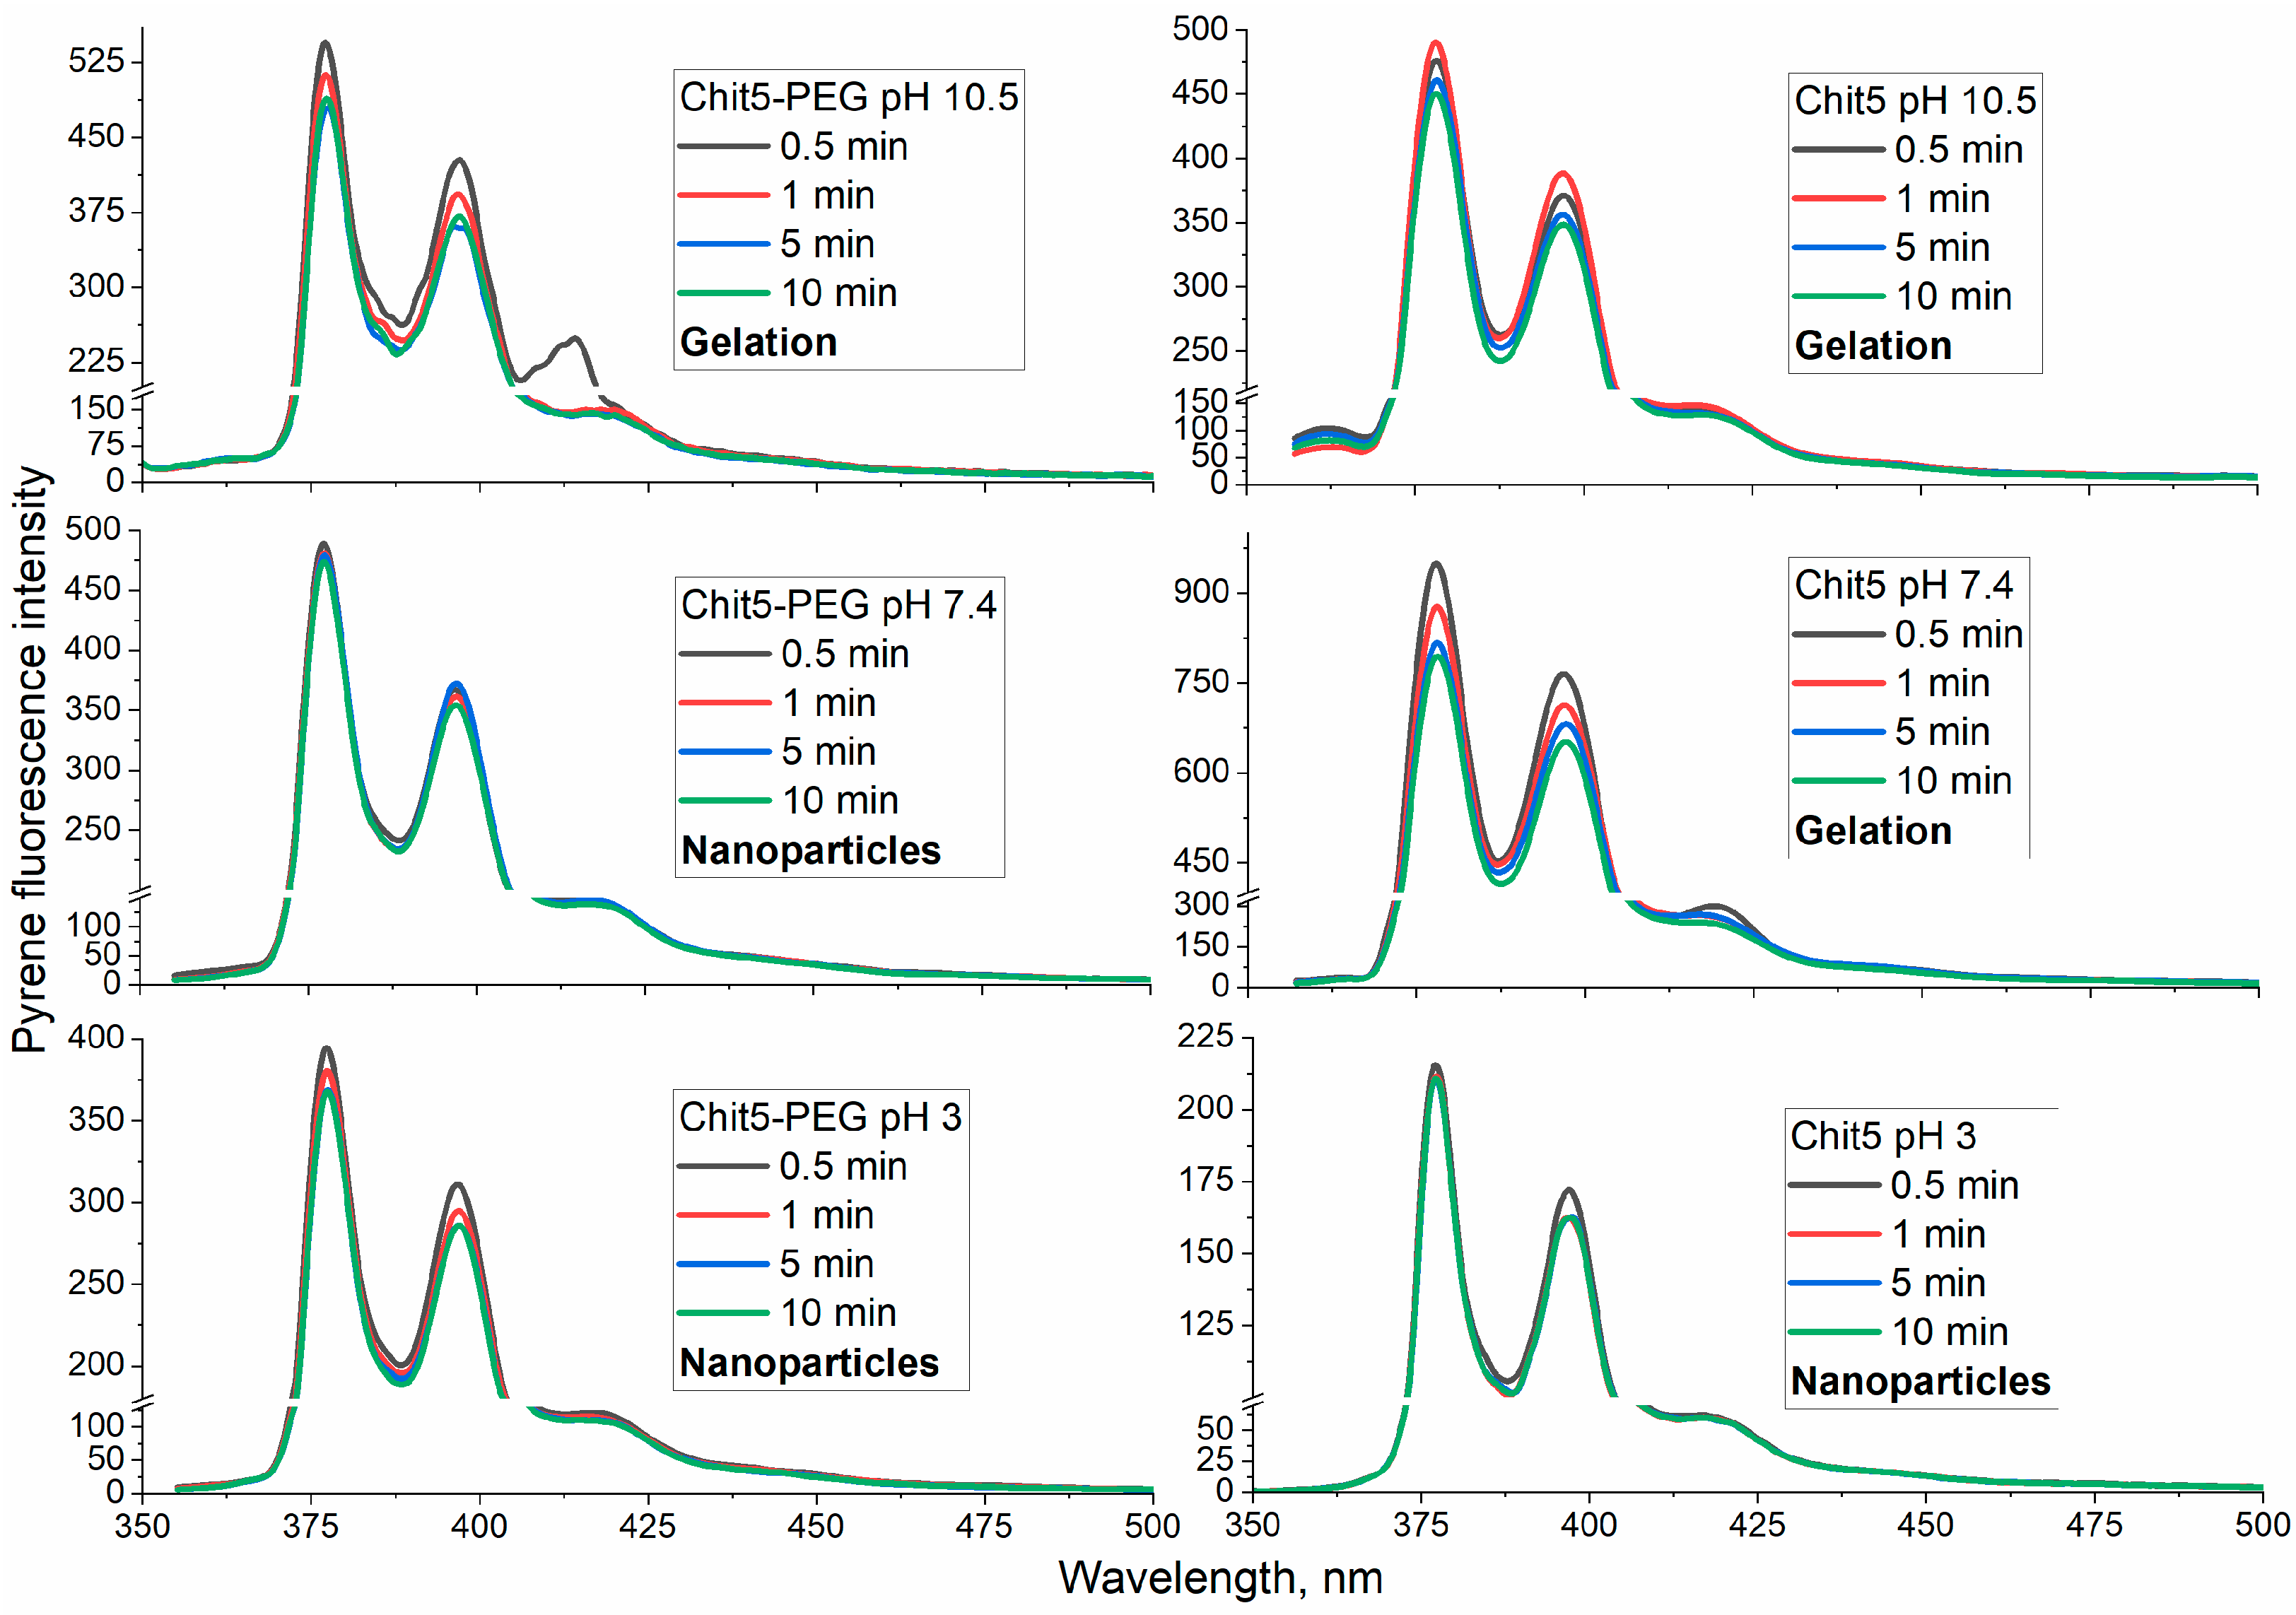
3.3.1. Using a Pyrene Probe to Optimize the Conditions for the Formation of Macrogels (in Volume Phase)
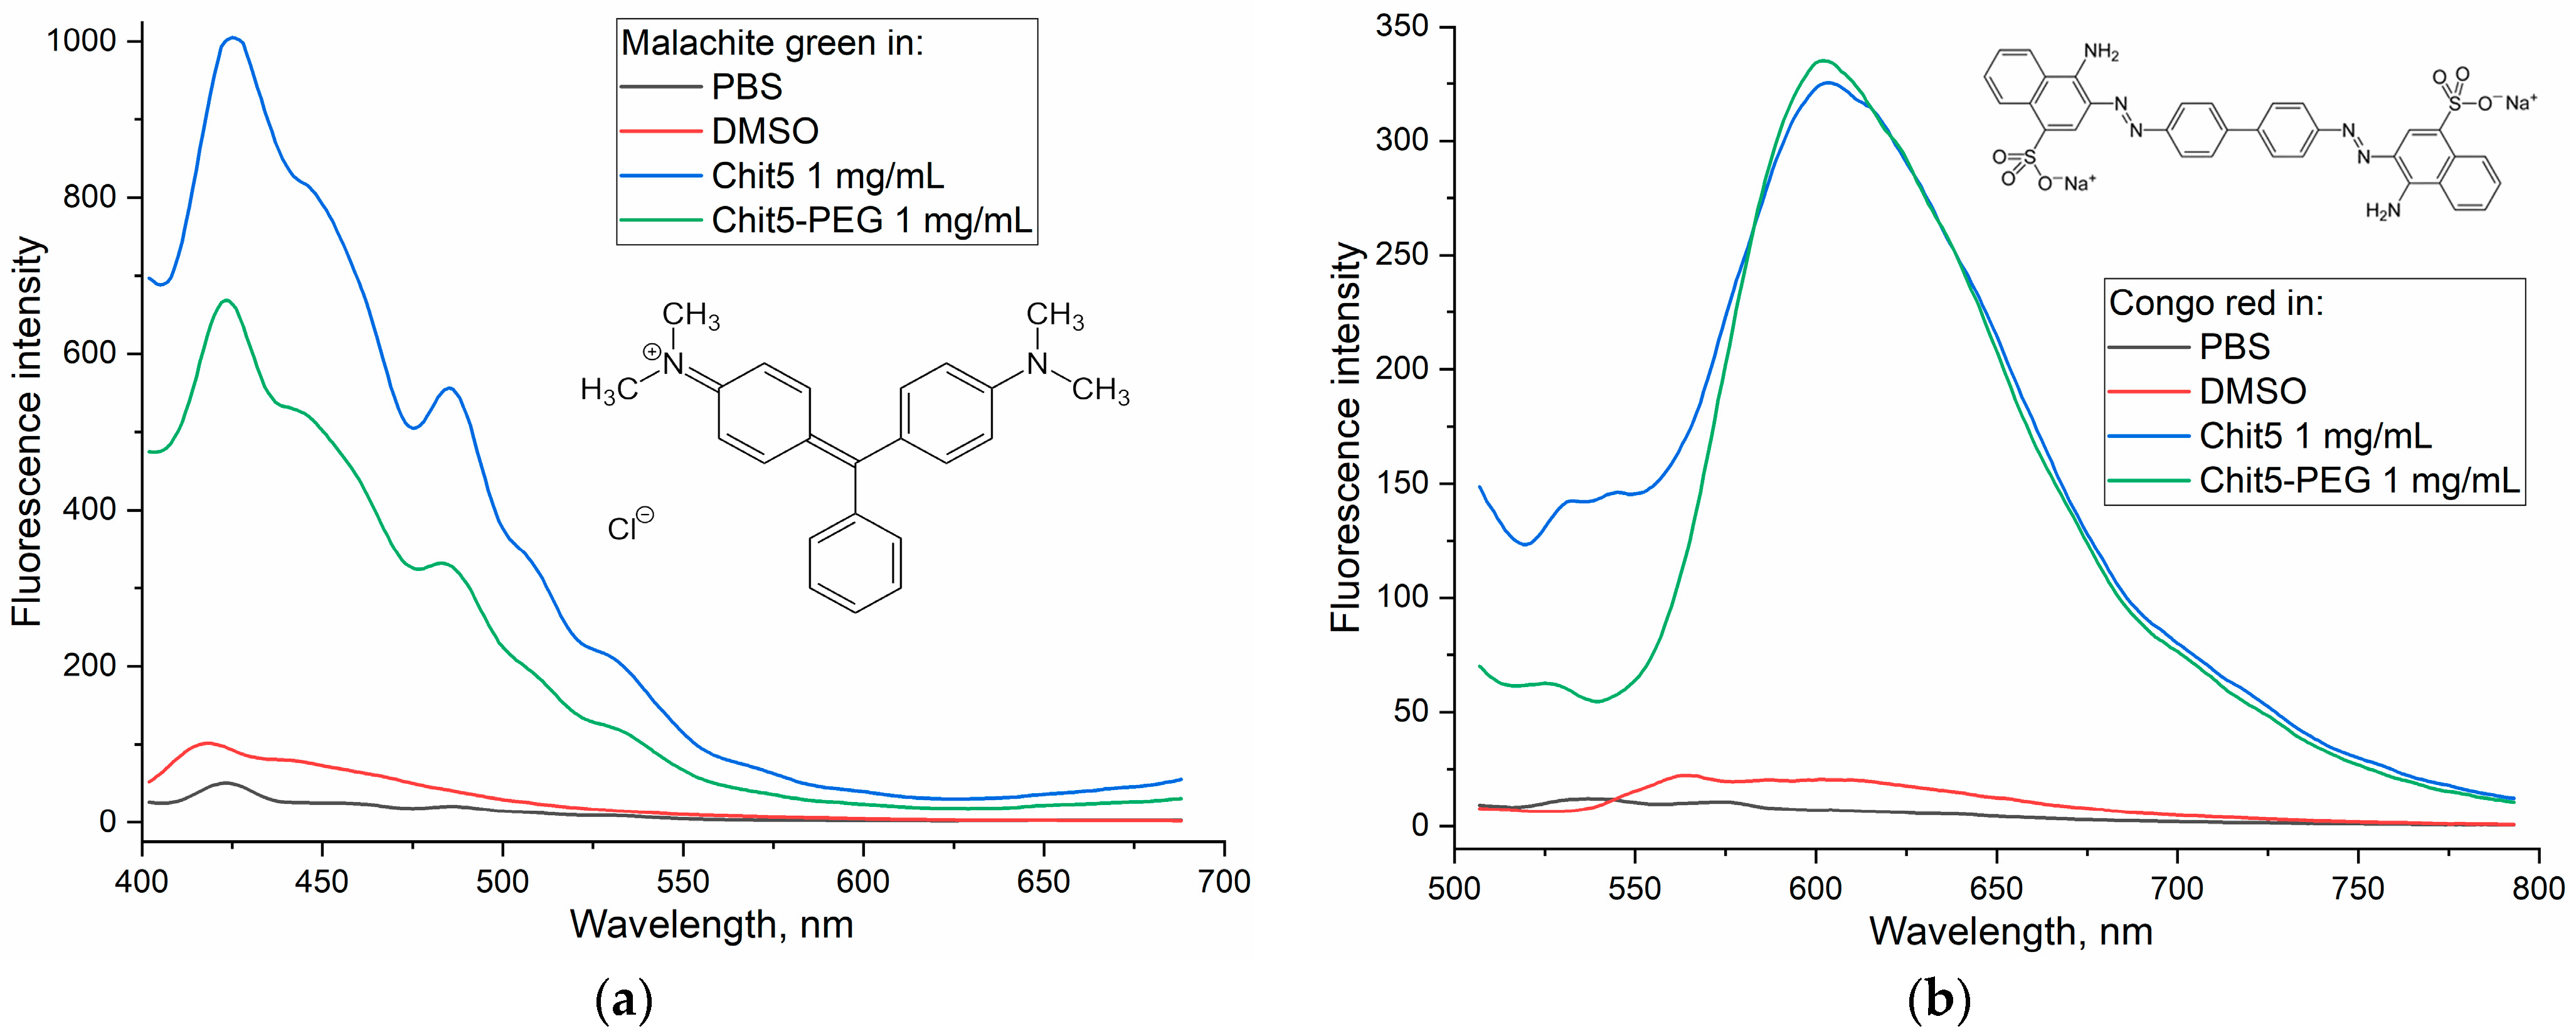
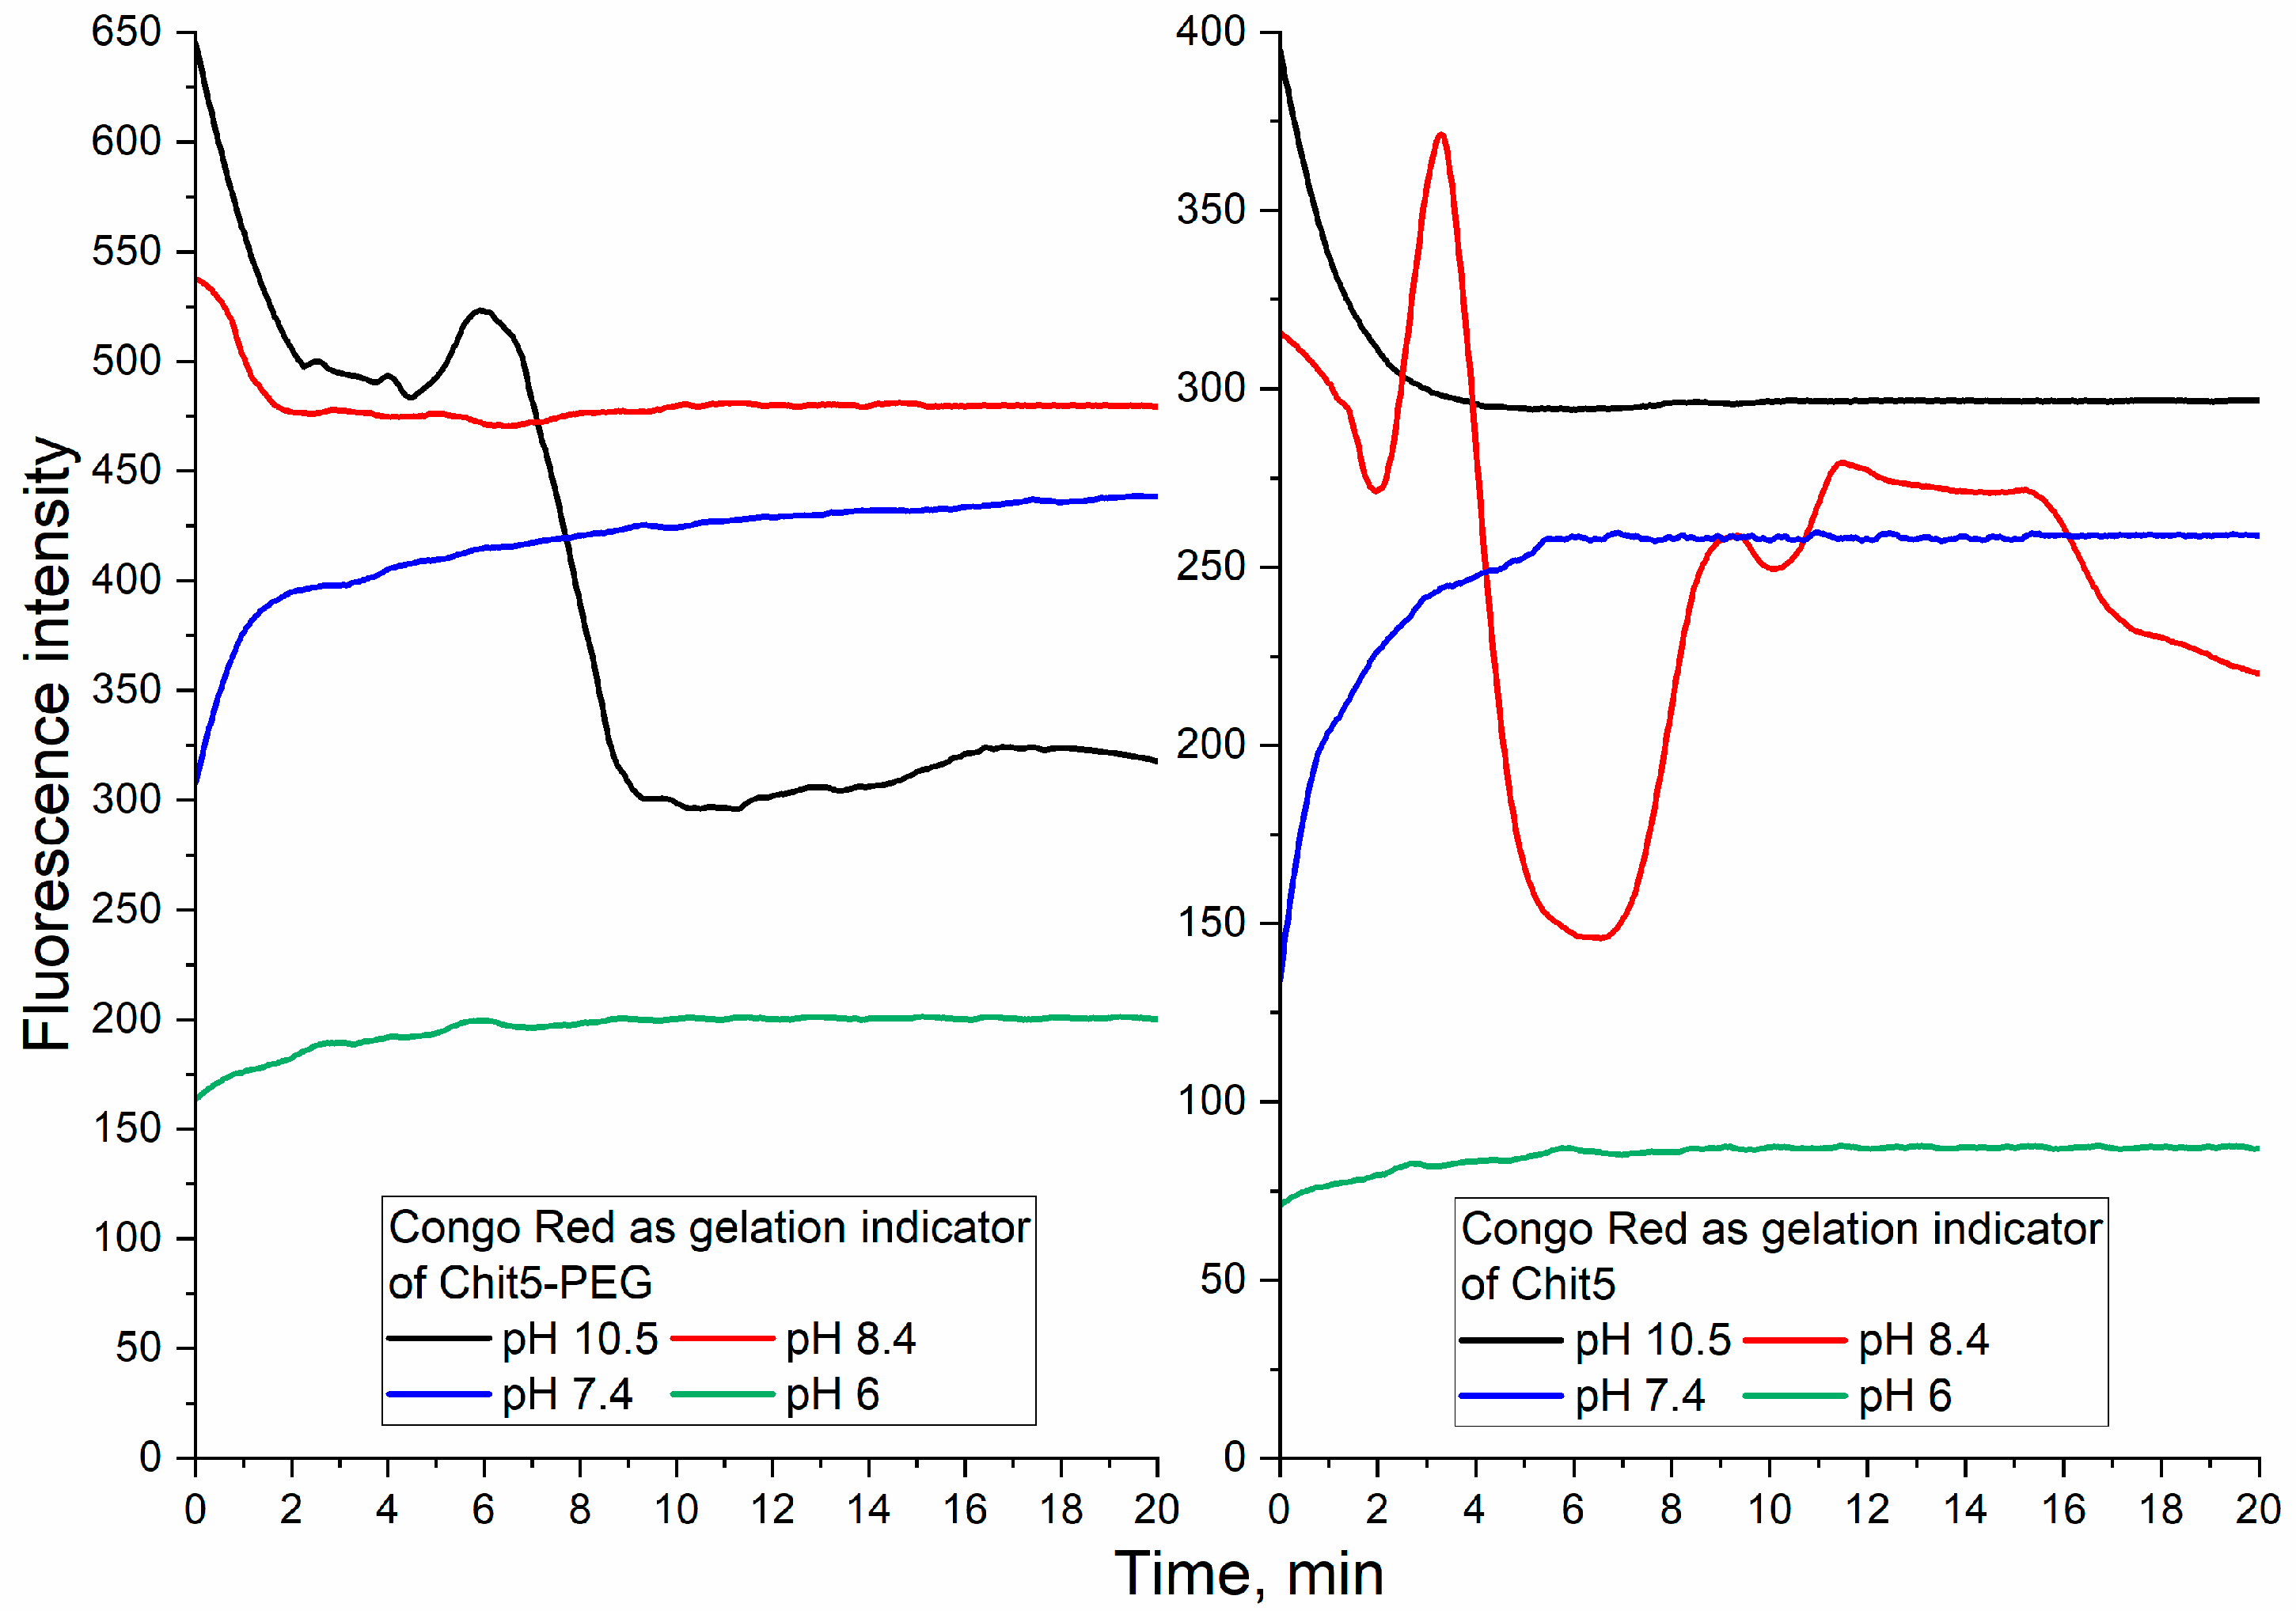
3.3.2. Ignition of Dye Fluorescence as Indicator of Volume-Phase Macrogel Formation
3.3.3. pH-Sensitive Volume-Phase Gel Formation
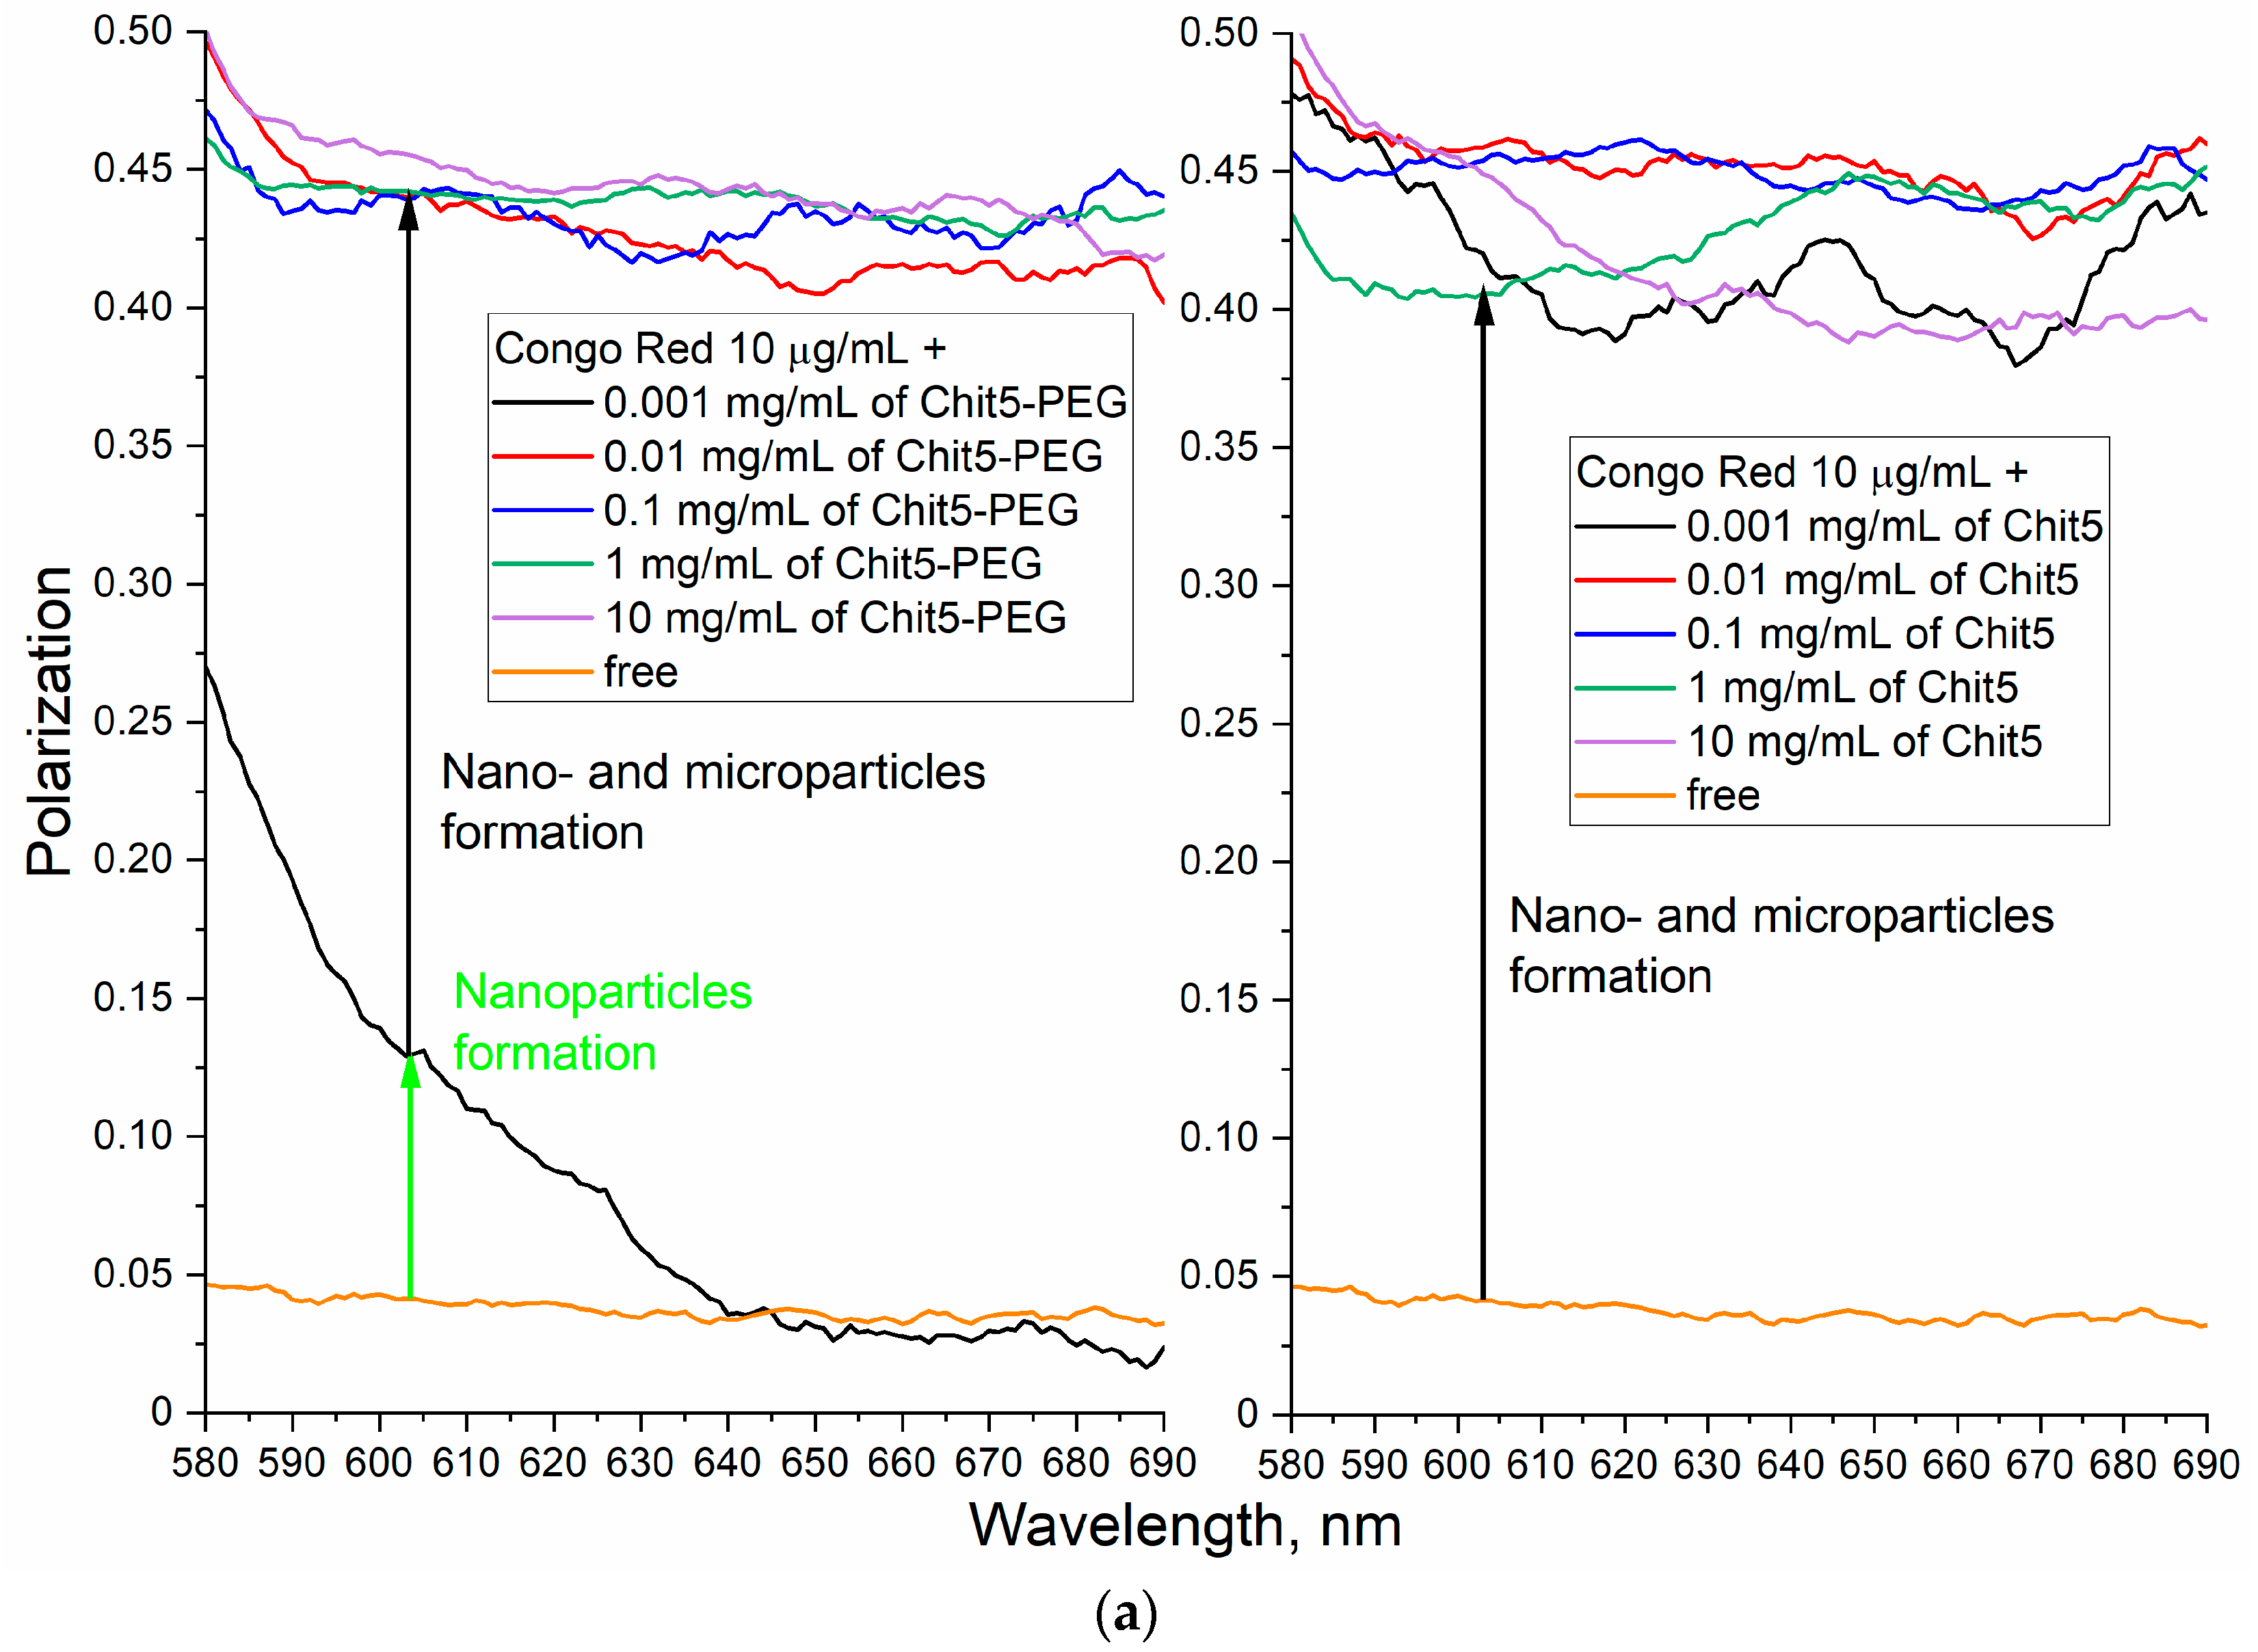
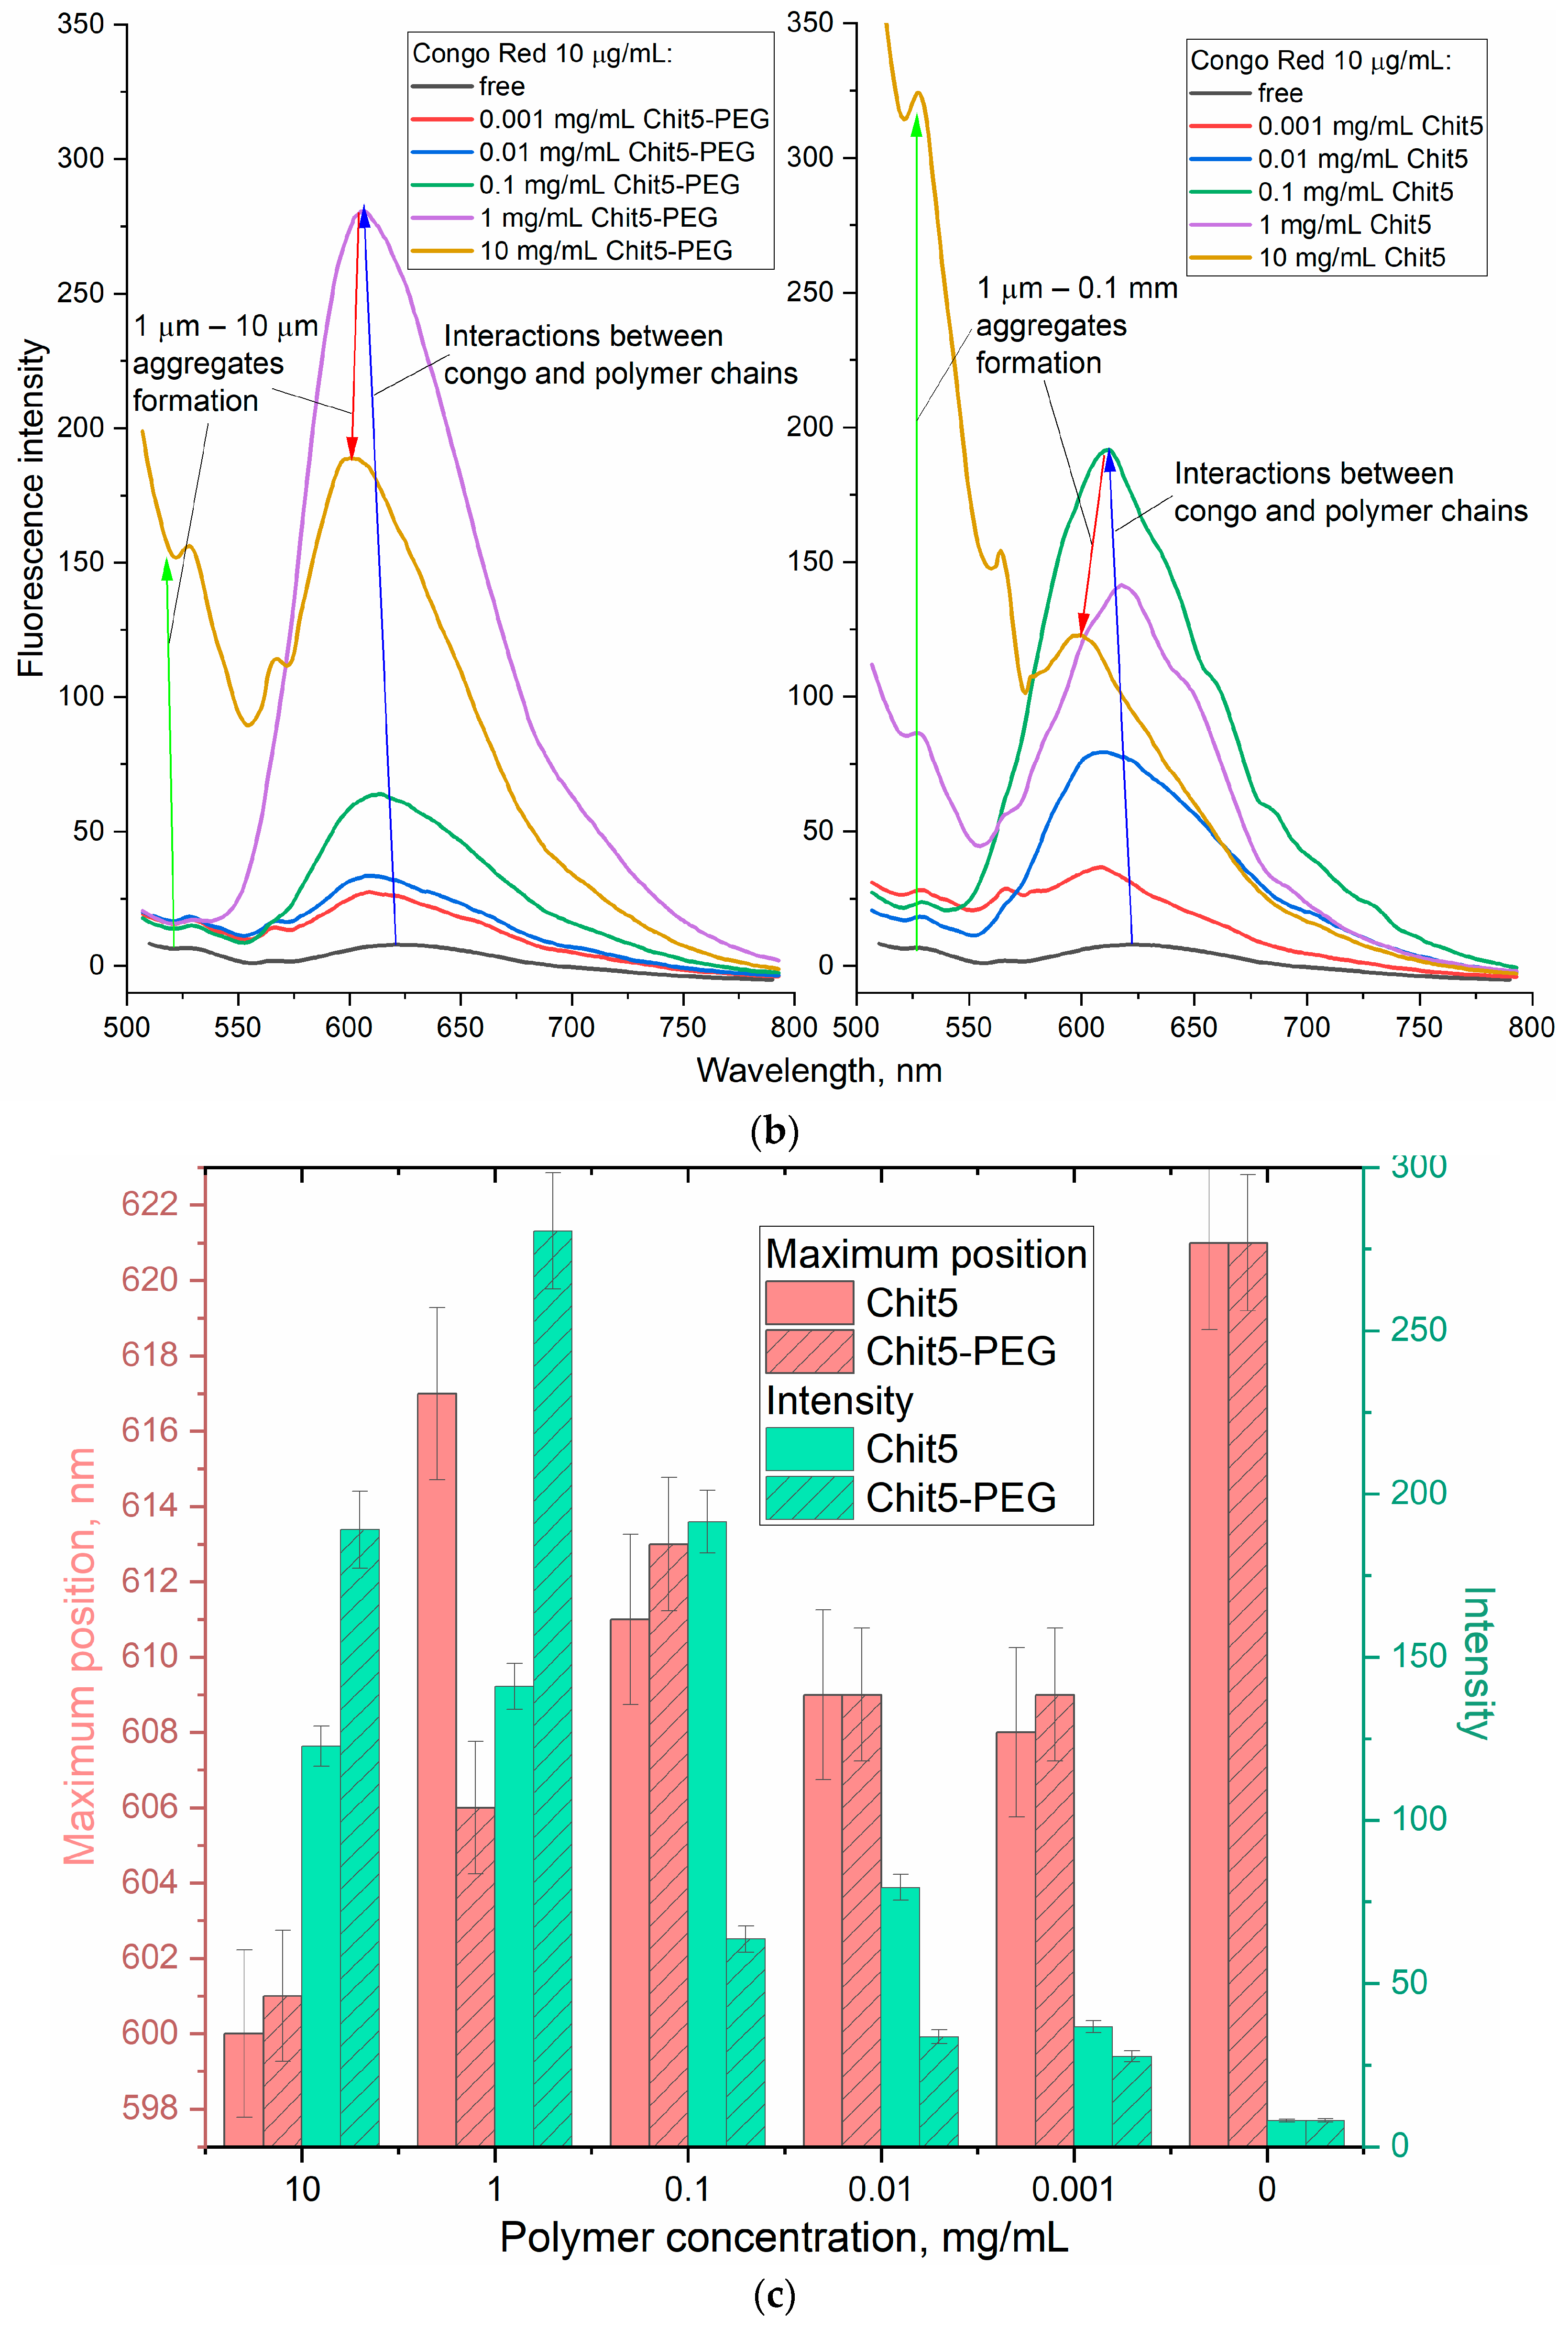
3.3.4. Concentration Dependences of Gelation
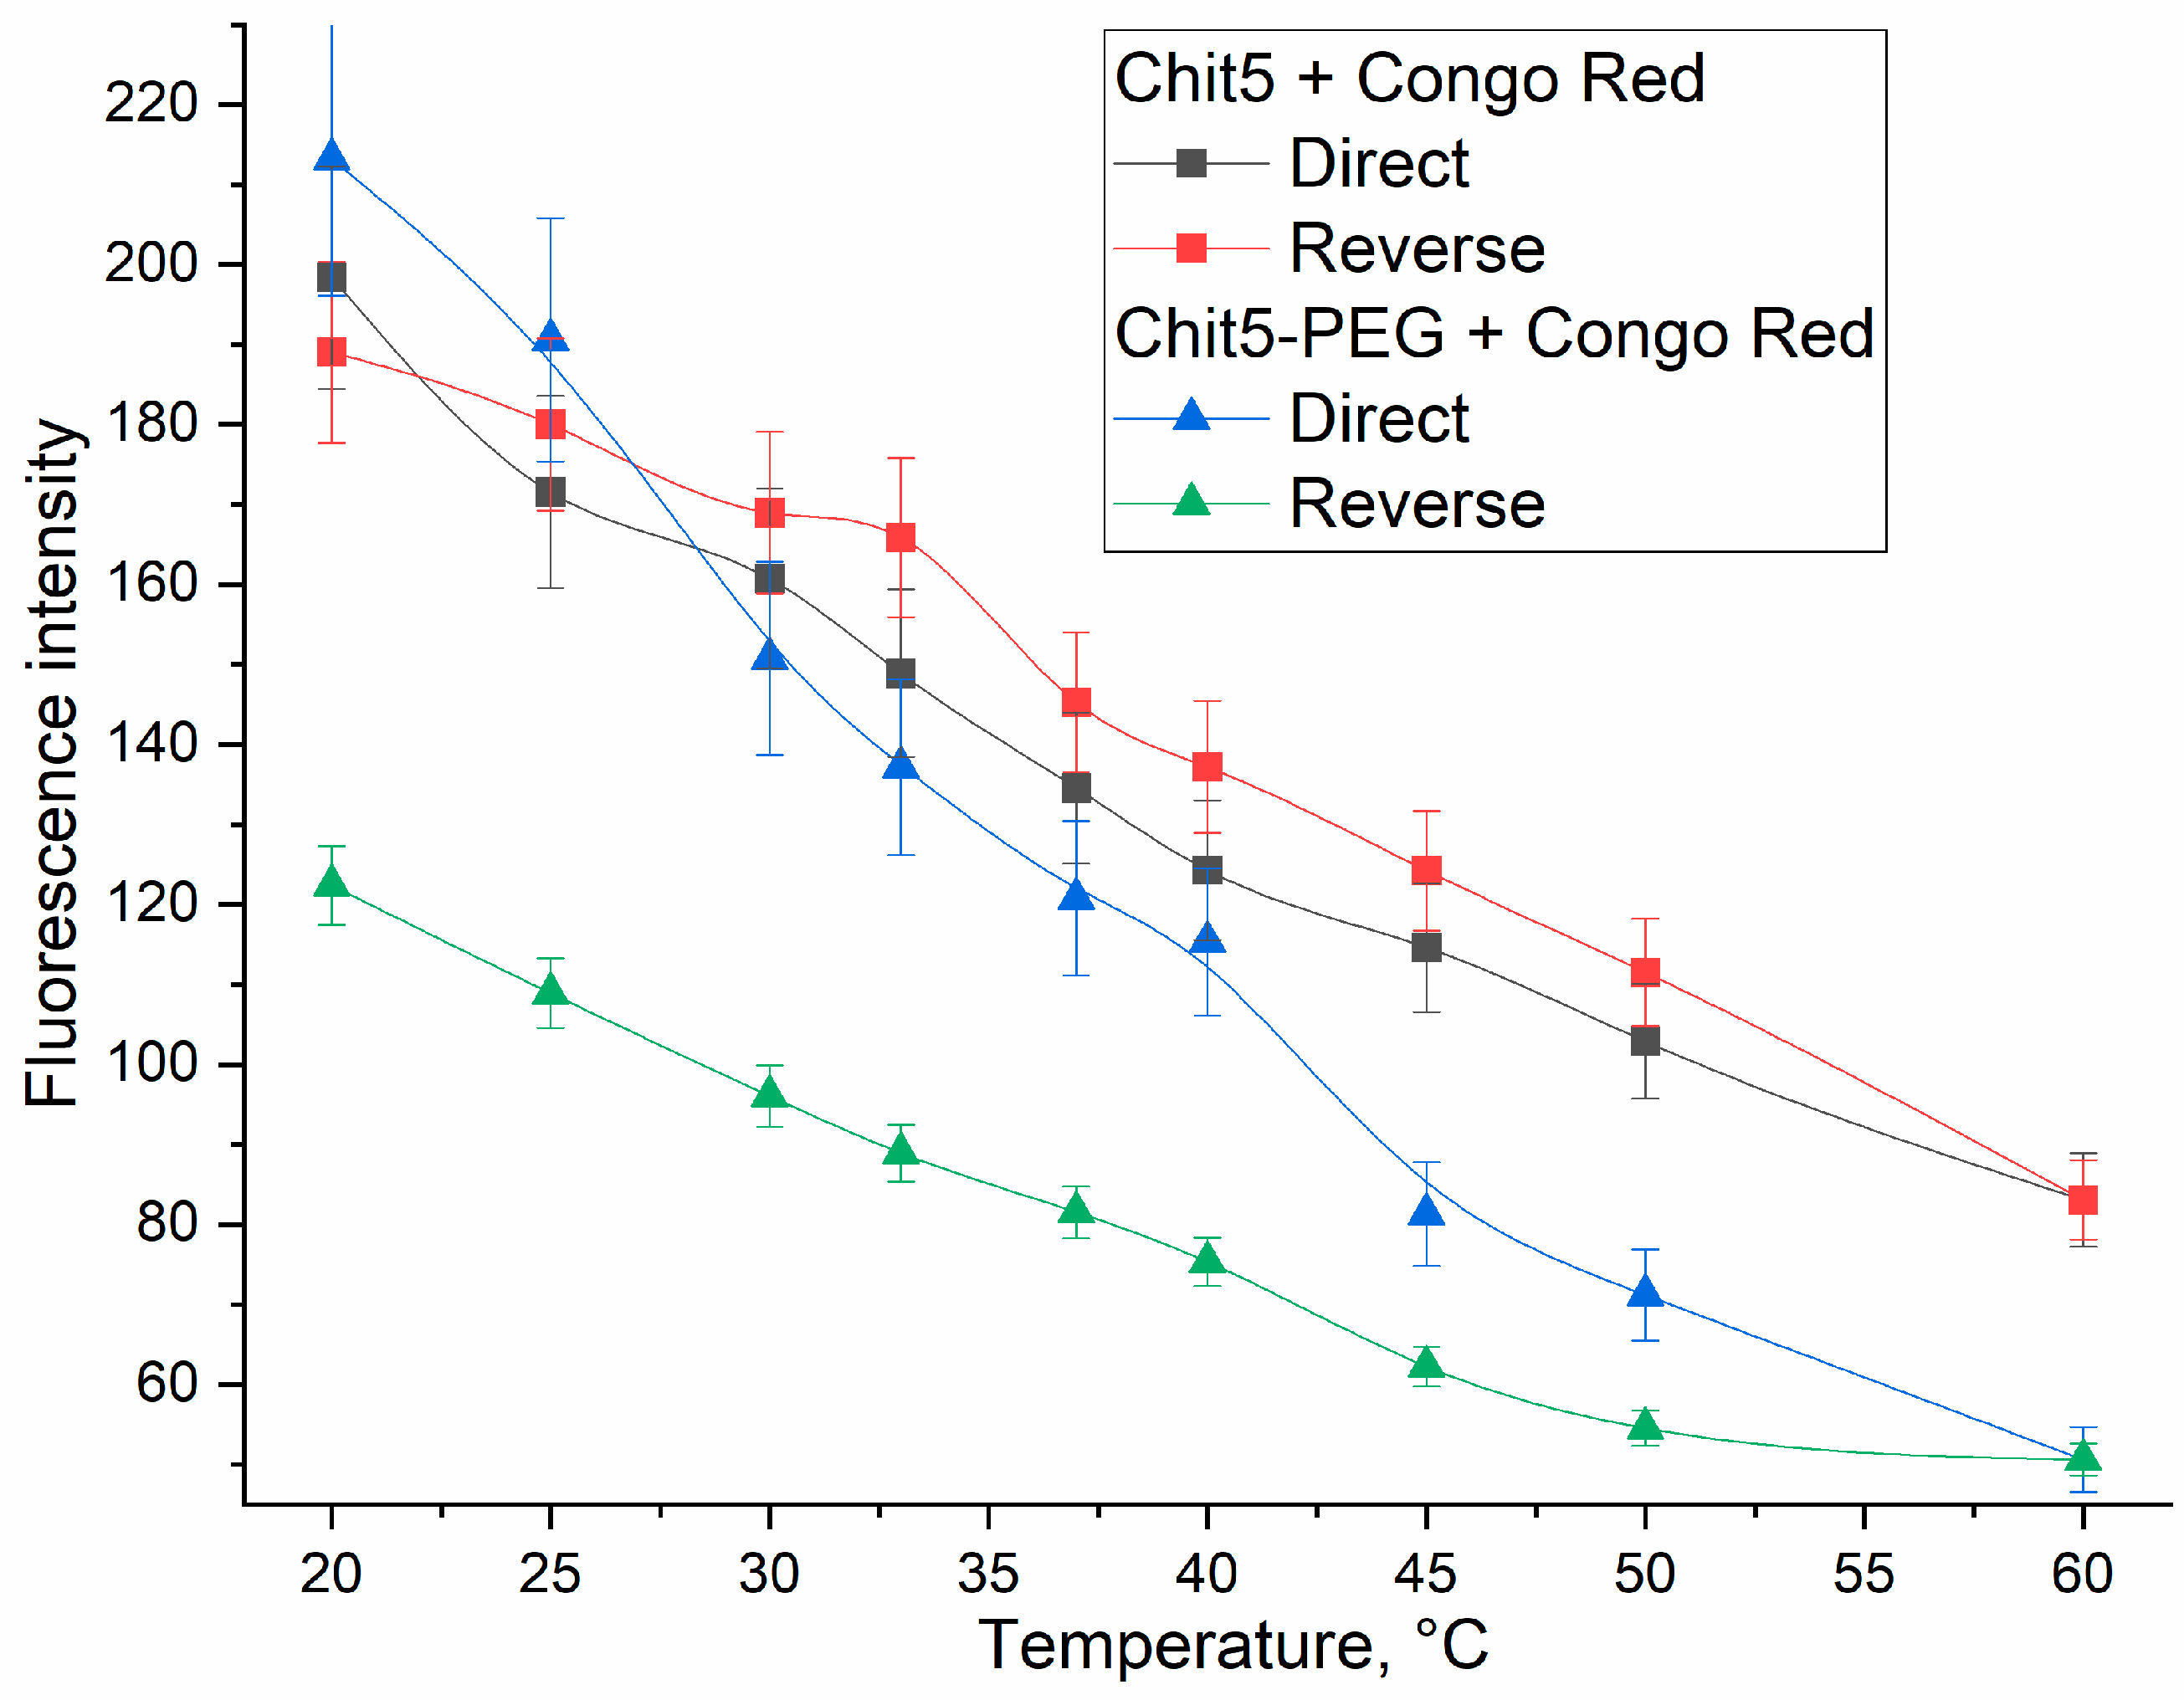
3.3.5. Temperature Dependences of Gelation
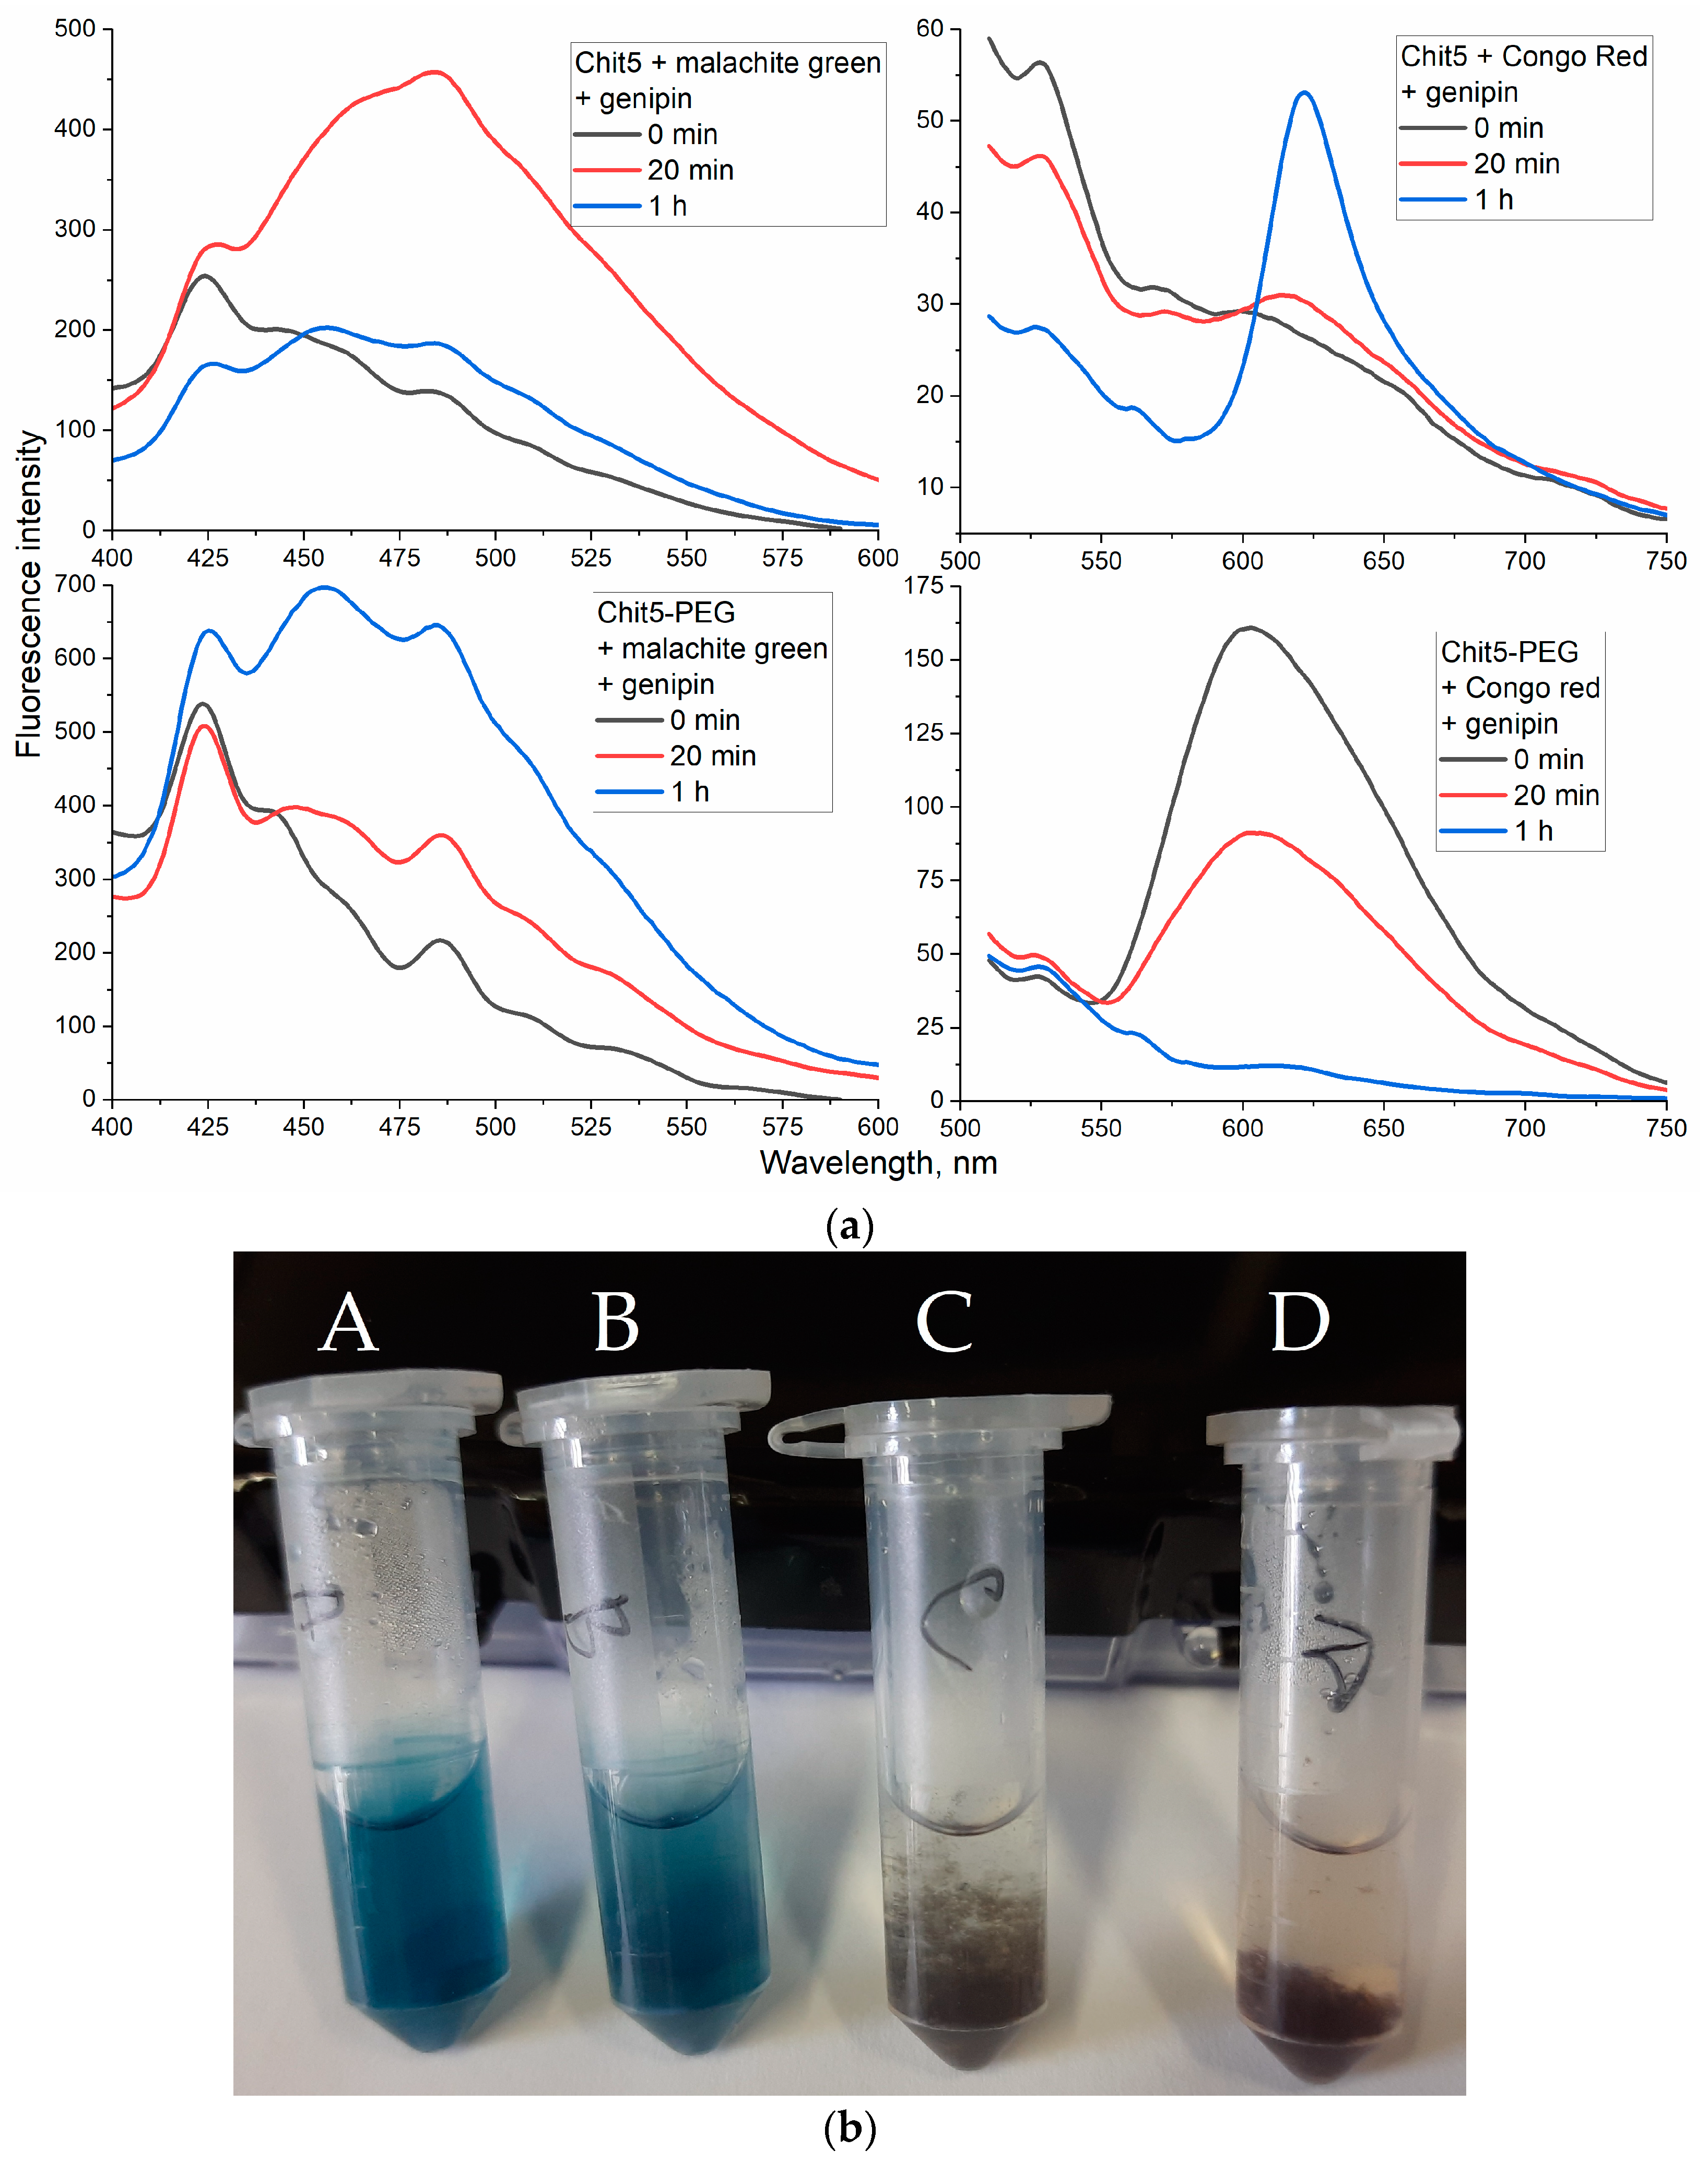
3.3.6. Genipin Crosslinked Polymers
3.4. Using Förster Resonance Energy Transfer (FRET) as a Tool for Studying Gel Formation and Drug Molecule Encapsulation
3.4.1. Tryptophan as a Model of Small (Aromatic) Drug Molecule Encapsulation with FRET Options
Volume-Phase Macrogel Formation
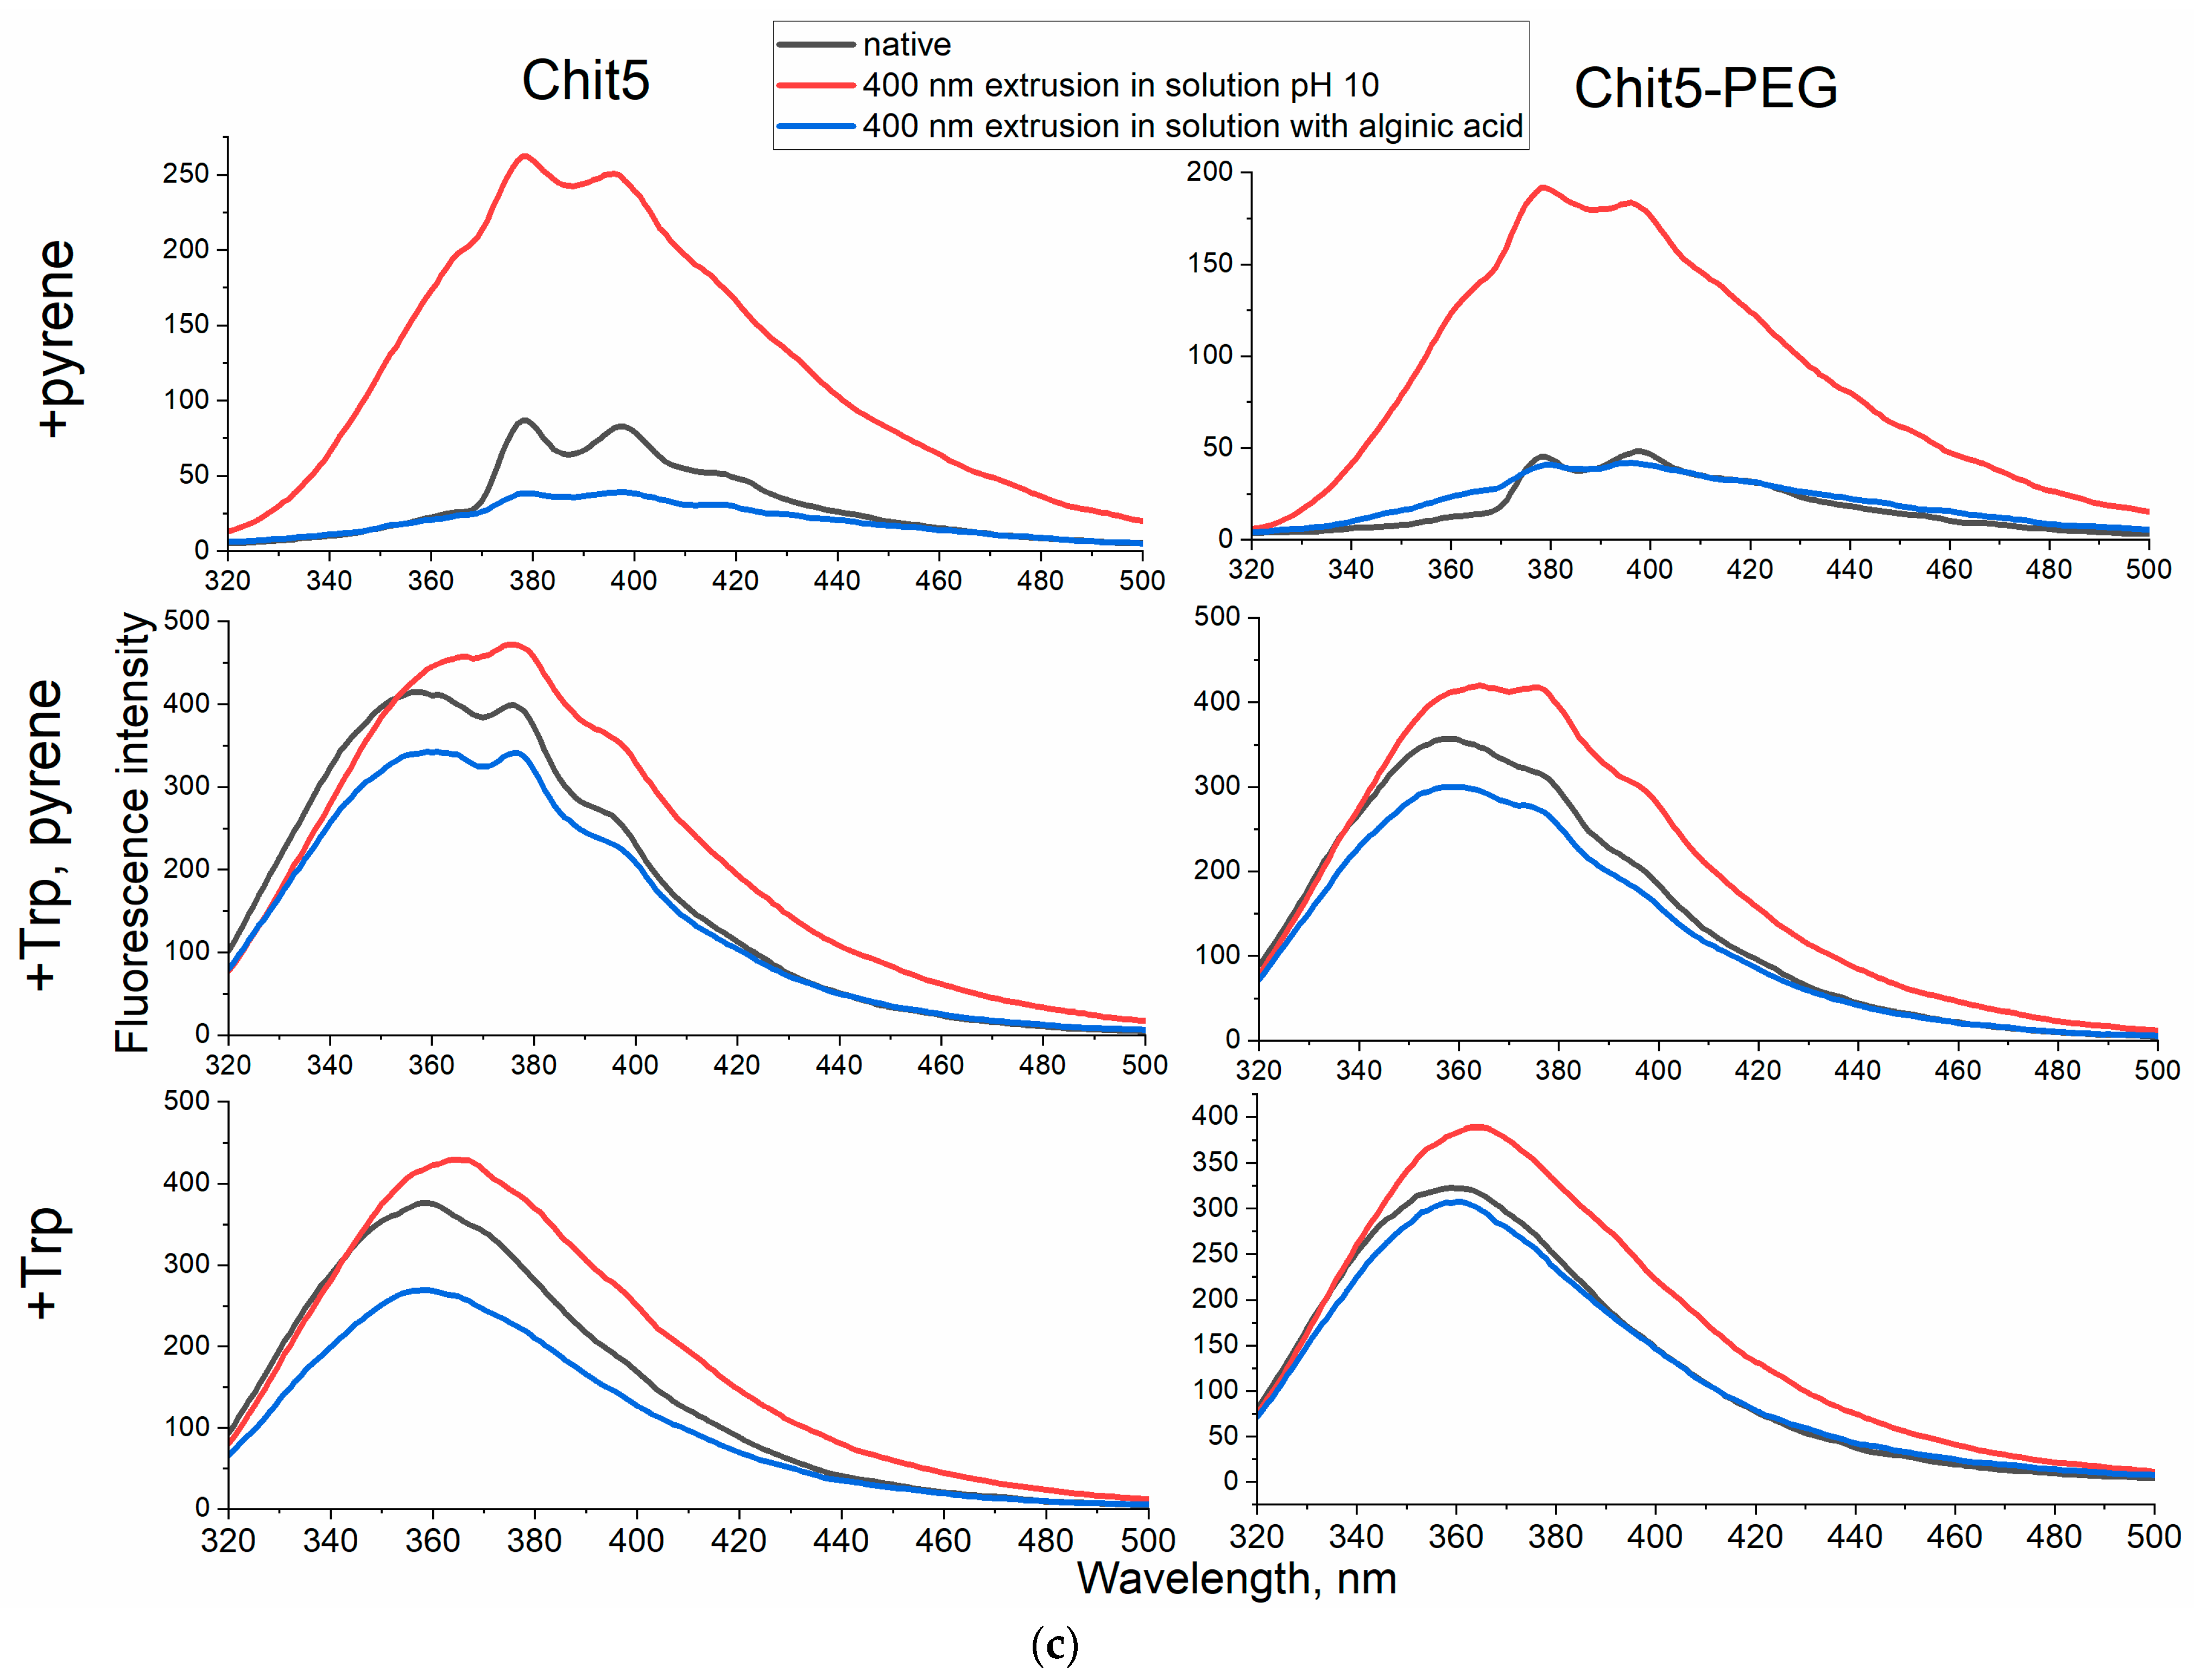
FRET in Nanogels
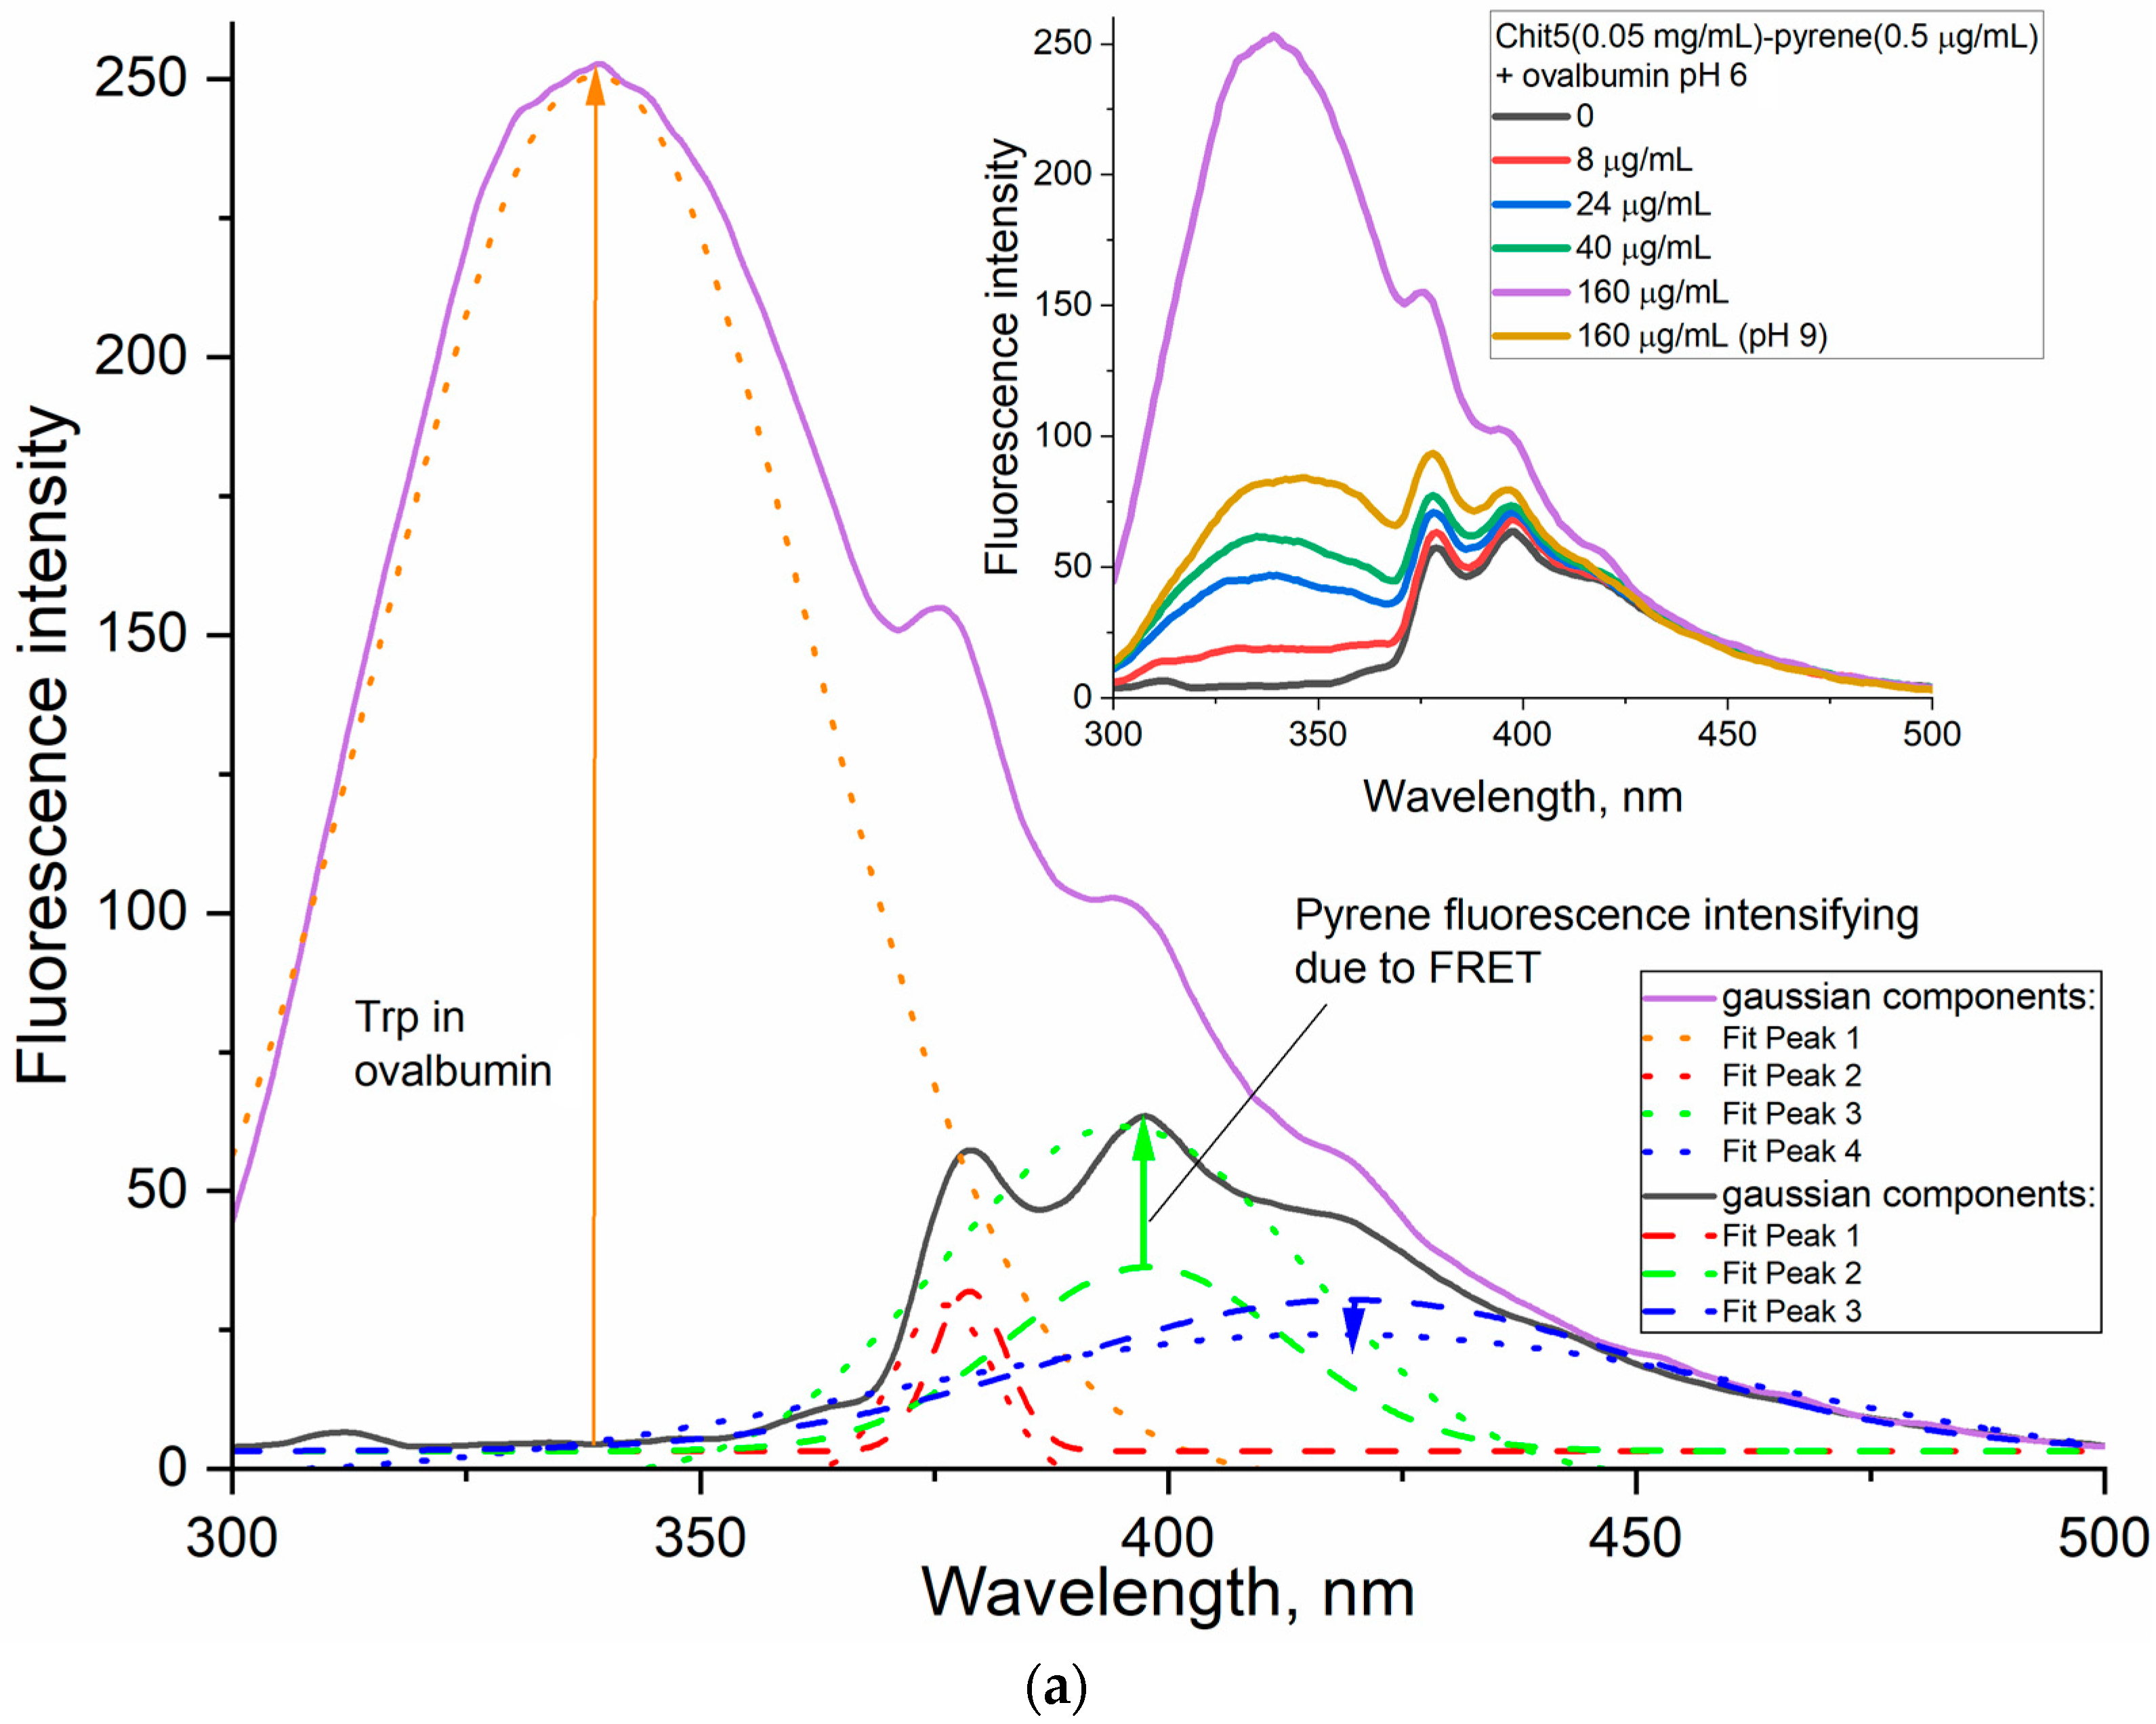
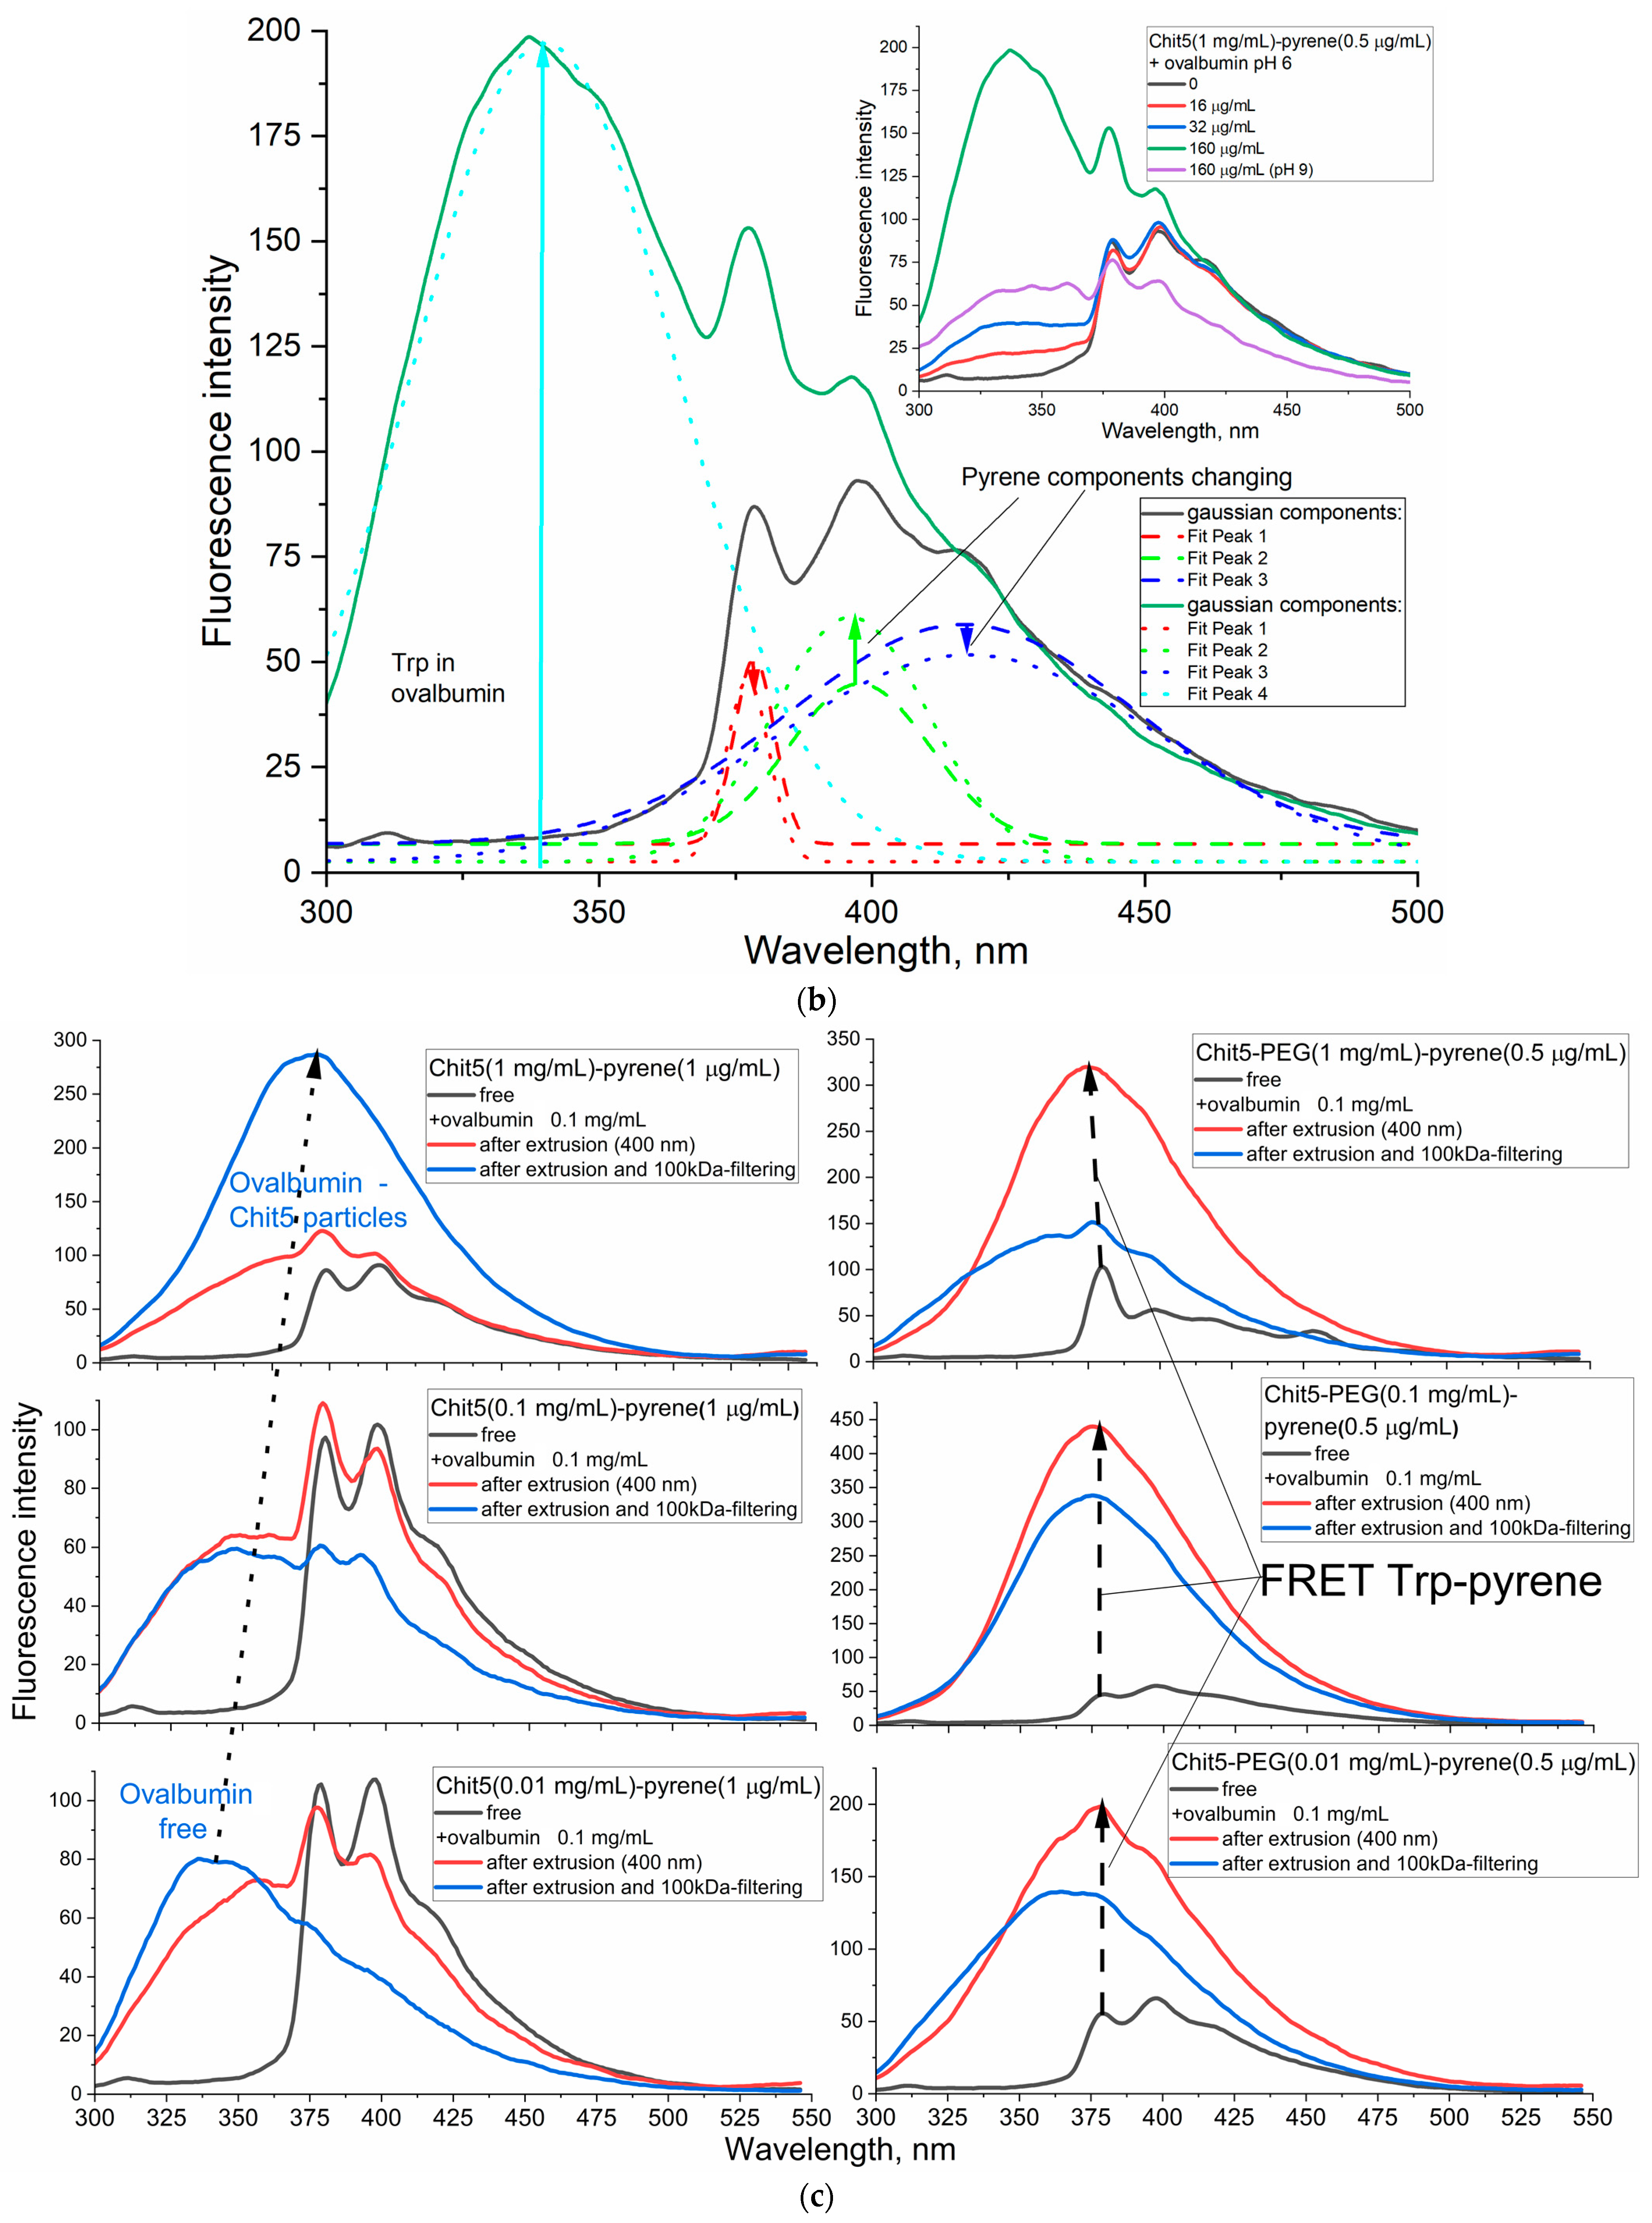
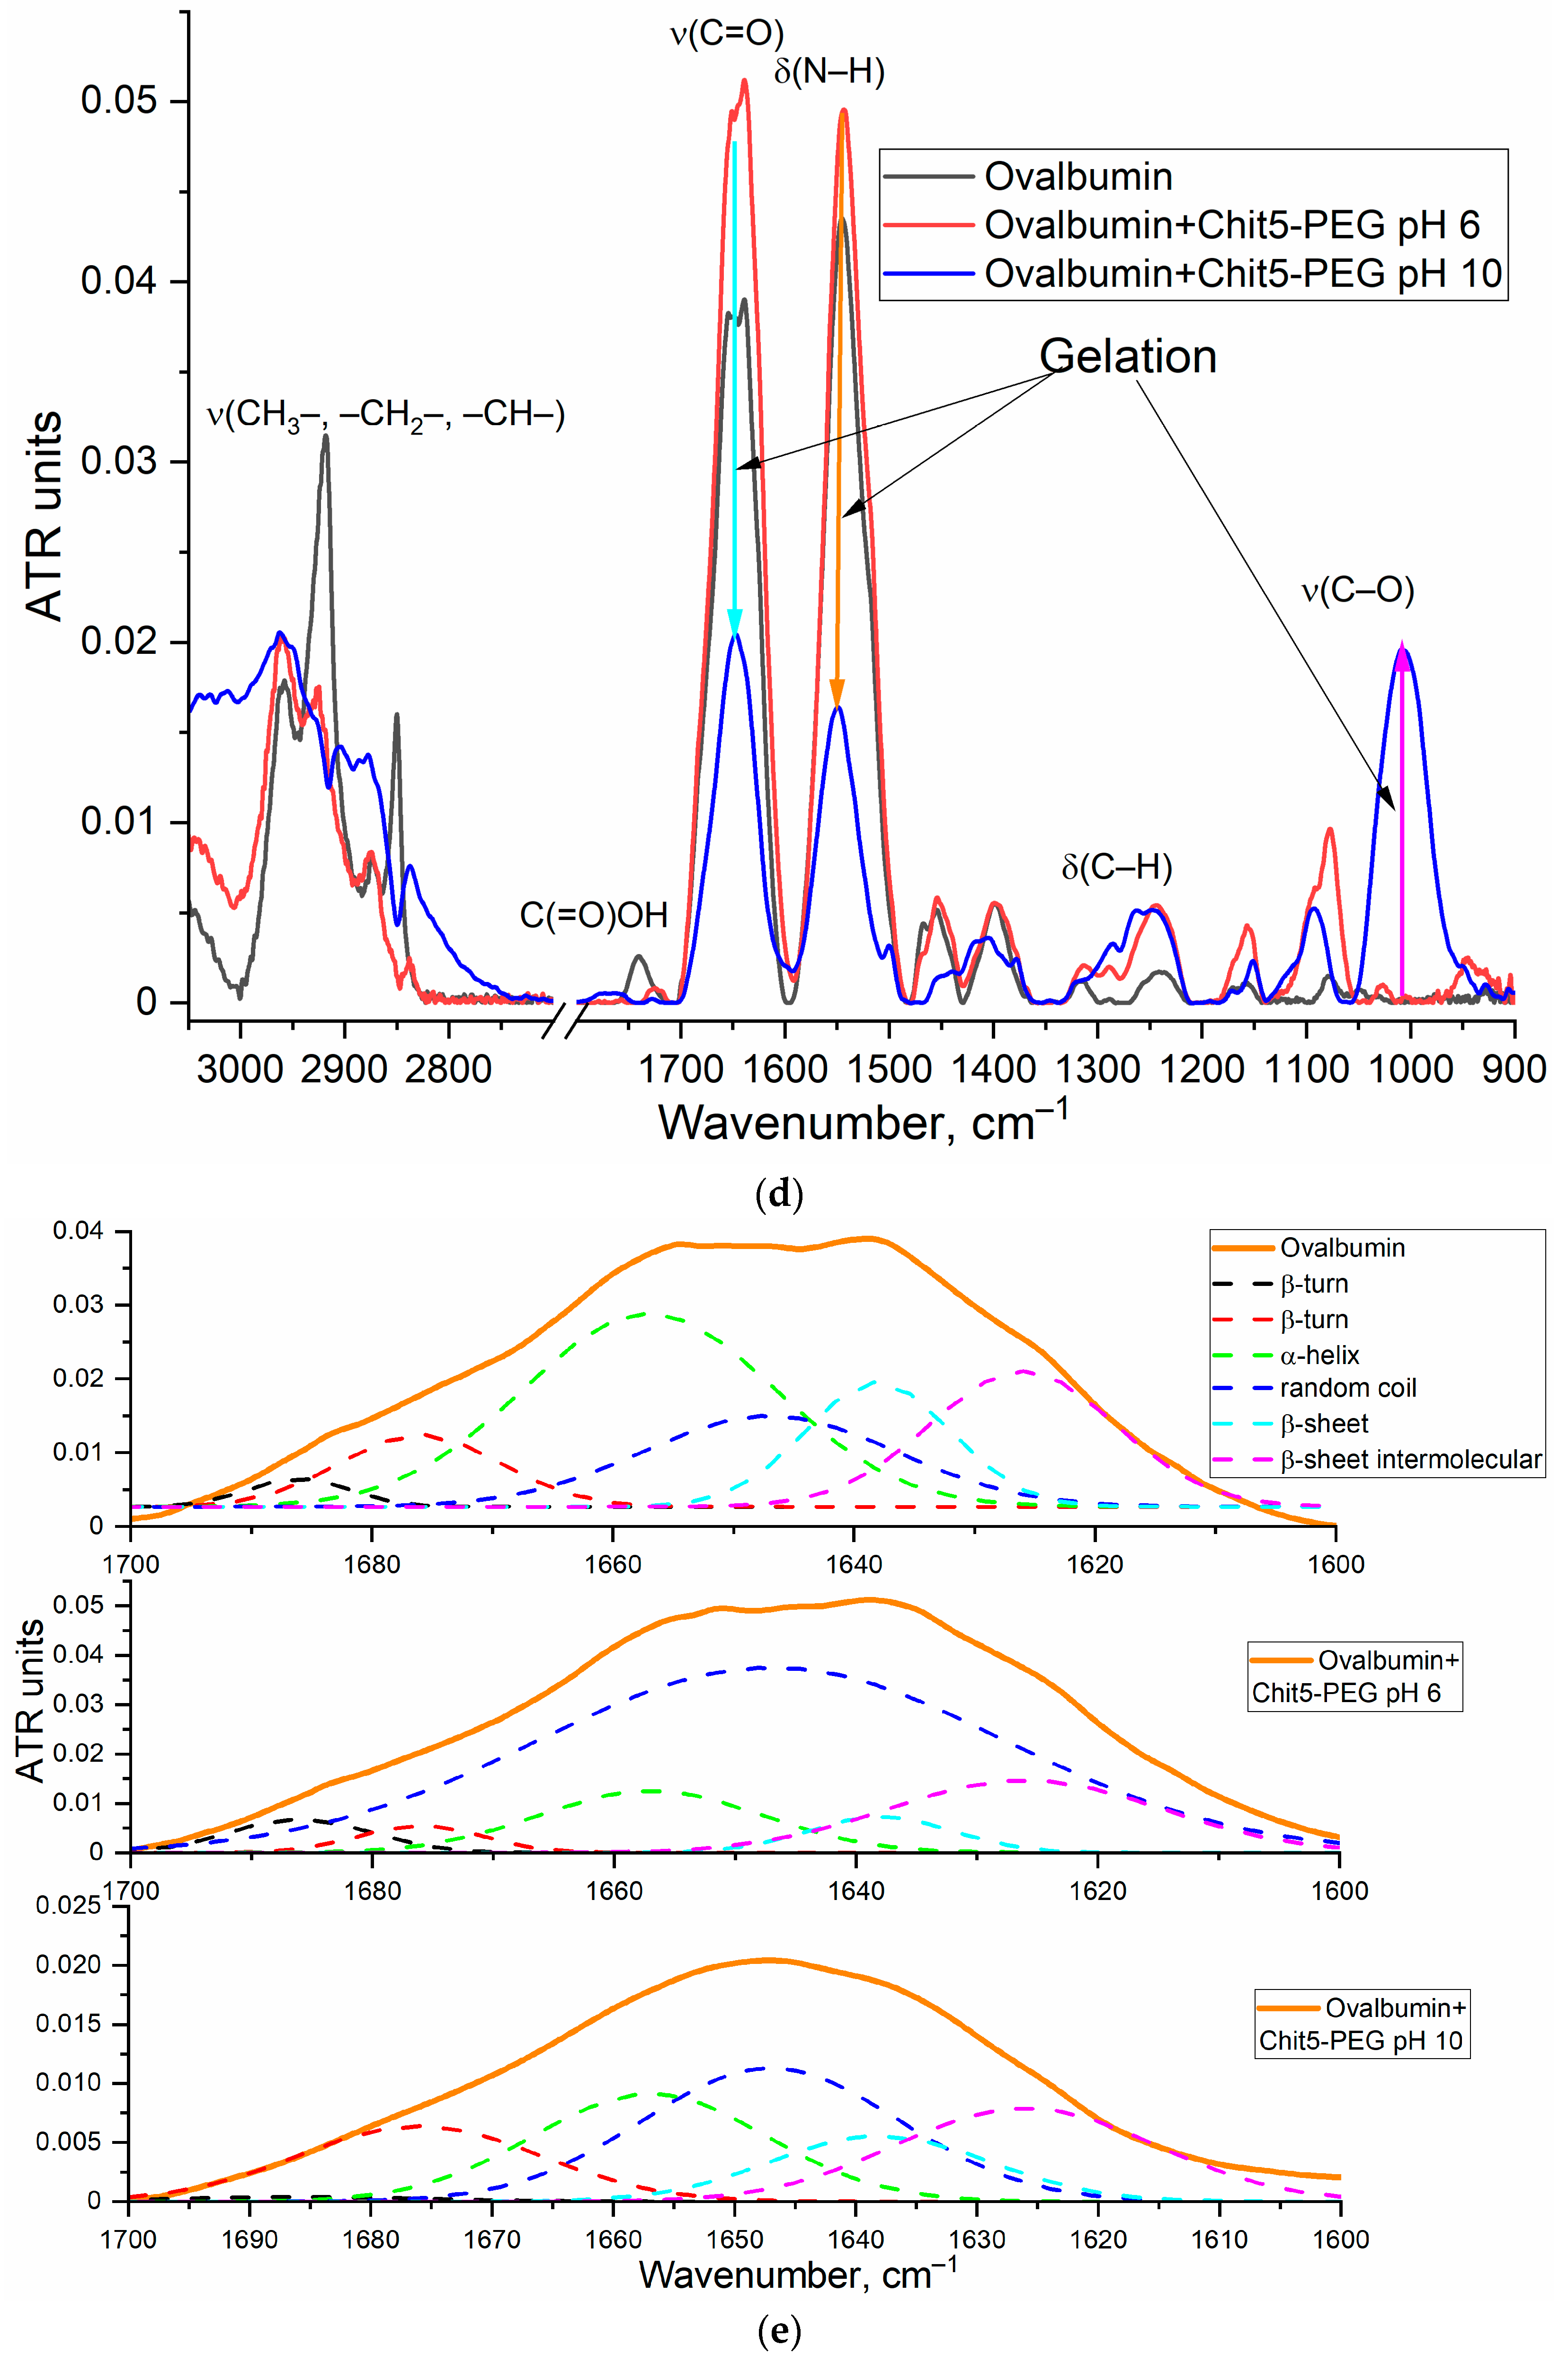
3.4.2. Ovalbumin as a Model of Large Molecule for Drug Delivery with FRET Options
Macrogels
Nanogels
4. Conclusions
Author Contributions
Funding
Data Availability Statement
Acknowledgments
Conflicts of Interest
Abbreviations
References
- Morin-Crini, N.; Lichtfouse, E.; Torri, G.; Crini, G. Applications of chitosan in food, pharmaceuticals, medicine, cosmetics, agriculture, textiles, pulp and paper, biotechnology, and environmental chemistry. Environ. Chem. Lett. 2019, 17, 1667–1692. [Google Scholar] [CrossRef] [Green Version]
- Moeini, A.; Pedram, P.; Makvandi, P.; Malinconico, M.; Gomez d’Ayala, G. Wound healing and antimicrobial effect of active secondary metabolites in chitosan-based wound dressings: A review. Carbohydr. Polym. 2020, 233, 115839. [Google Scholar] [CrossRef] [PubMed]
- Bagheri, M.; Validi, M.; Gholipour, A.; Makvandi, P.; Sharifi, E. Chitosan nanofiber biocomposites for potential wound healing applications: Antioxidant activity with synergic antibacterial effect. Bioeng. Transl. Med. 2022, 7, e10254. [Google Scholar] [CrossRef]
- Riederer, M.S.; Requist, B.D.; Payne, K.A.; Way, J.D.; Krebs, M.D. Injectable and microporous scaffold of densely-packed, growth factor-encapsulating chitosan microgels. Carbohydr. Polym. 2016, 152, 792–801. [Google Scholar] [CrossRef] [Green Version]
- Jayakumar, R.; Chennazhi, K.P.; Muzzarelli, R.A.A.; Tamura, H.; Nair, S.V.; Selvamurugan, N. Chitosan conjugated DNA nanoparticles in gene therapy. Carbohydr. Polym. 2010, 79, 1–8. [Google Scholar] [CrossRef]
- Thomas, L.V.; Vg, R.; Nair, P.D. Effect of stiffness of chitosan-hyaluronic acid dialdehyde hydrogels on the viability and growth of encapsulated chondrocytes. Int. J. Biol. Macromol. 2017, 104, 1925–1935. [Google Scholar] [CrossRef]
- Singh, P.; Medronho, B.; Alves, L.; da Silva, G.J.; Miguel, M.G.; Lindman, B. Development of carboxymethyl cellulose-chitosan hybrid micro- and macroparticles for encapsulation of probiotic bacteria. Carbohydr. Polym. 2017, 175, 87–95. [Google Scholar] [CrossRef]
- Mohamed, S.H.; Arafa, A.S.; Mady, W.H.; Fahmy, H.A.; Omer, L.M.; Morsi, R.E. Preparation and immunological evaluation of inactivated avian influenza virus vaccine encapsulated in chitosan nanoparticles. Biologicals 2018, 51, 46–53. [Google Scholar] [CrossRef]
- Divya, K.; Jisha, M.S. Chitosan nanoparticles preparation and applications. Environ. Chem. Lett. 2018, 16, 101–112. [Google Scholar] [CrossRef]
- Rahmanian-devin, P.; Rahimi, V.B.; Askari, V.R. Thermosensitive Chitosan-β-Glycerophosphate Hydrogels as Targeted Drug Delivery Systems: An Overview on Preparation and Their Applications. Adv. Pharmacol. Pharm. Sci. 2021, 2021, 6640893. [Google Scholar]
- Calvo, P.; Remuñán-López, C.; Vila-Jato, J.L.; Alonso, M.J. Novel hydrophilic chitosan-polyethylene oxide nanoparticles as protein carriers. J. Appl. Polym. Sci. 1997, 63, 125–132. [Google Scholar] [CrossRef]
- Brunel, F.; Véron, L.; David, L.; Domard, A.; Delair, T. A novel synthesis of chitosan nanoparticles in reverse emulsion. Langmuir 2008, 24, 11370–11377. [Google Scholar] [CrossRef]
- Jayakumar, R.; Prabaharan, M.; Nair, S.V.; Tamura, H. Novel chitin and chitosan nanofibers in biomedical applications. Biotechnol. Adv. 2010, 28, 142–150. [Google Scholar] [CrossRef]
- Kudryashova, E.V. Reversible self-association of ovalbumin at air-water interfaces and the consequences for the exerted surface pressure. Protein Sci. 2005, 14, 483–493. [Google Scholar] [CrossRef] [Green Version]
- Caldera, F.; Tannous, M.; Cavalli, R.; Zanetti, M.; Trotta, F. Evolution of Cyclodextrin Nanosponges. Int. J. Pharm. 2017, 531, 470–479. [Google Scholar] [CrossRef] [PubMed]
- Samal, S.K.; Dash, M.; Van Vlierberghe, S.; Kaplan, D.L.; Chiellini, E.; van Blitterswijk, C.; Moroni, L.; Dubruel, P. Cationic polymers and their therapeutic potential. Chem. Soc. Rev. 2012, 41, 7147–7194. [Google Scholar] [CrossRef] [PubMed]
- Lin, D.; Xiao, L.; Qin, W.; Loy, D.A.; Wu, Z.; Chen, H.; Zhang, Q. Preparation, characterization and antioxidant properties of curcumin encapsulated chitosan/lignosulfonate micelles. Carbohydr. Polym. 2022, 281, 119080. [Google Scholar] [CrossRef] [PubMed]
- Bratskaya, S.; Skatova, A.; Privar, Y.; Boroda, A.; Kantemirova, E.; Maiorova, M.; Pestov, A. Stimuli-responsive dual cross-linked n-carboxyethylchitosan hydrogels with tunable dissolution rate. Gels 2021, 7, 188. [Google Scholar] [CrossRef] [PubMed]
- Buranachai, T.; Praphairaksit, N.; Muangsin, N. Chitosan/polyethylene glycol beads crosslinked with tripolyphosphate and glutaraldehyde for gastrointestinal drug delivery. AAPS PharmSciTech 2010, 11, 1128–1137. [Google Scholar] [CrossRef] [Green Version]
- Muzzarelli, R.A.A. Genipin-crosslinked chitosan hydrogels as biomedical and pharmaceutical aids. Carbohydr. Polym. 2009, 77, 1–9. [Google Scholar] [CrossRef]
- Bhattarai, N.; Ramay, H.R.; Gunn, J.; Matsen, F.A.; Zhang, M. PEG-grafted chitosan as an injectable thermosensitive hydrogel for sustained protein release. J. Control. Release 2005, 103, 609–624. [Google Scholar] [CrossRef] [PubMed]
- Ravishankar, K.; Dhamodharan, R. Advances in chitosan-based hydrogels: Evolution from covalently crosslinked systems to ionotropically crosslinked superabsorbents. React. Funct. Polym. 2020, 149, 104517. [Google Scholar] [CrossRef]
- Tan, L.; Huang, R.; Li, X.; Liu, S.; Shen, Y.M.; Shao, Z. Chitosan-based core-shell nanomaterials for pH-triggered release of anticancer drug and near-infrared bioimaging. Carbohydr. Polym. 2017, 157, 325–334. [Google Scholar] [CrossRef]
- Harish, R.; Nisha, K.D.; Prabakaran, S.; Sridevi, B.; Harish, S.; Navaneethan, M.; Ponnusamy, S.; Hayakawa, Y.; Vinniee, C.; Ganesh, M.R. Cytotoxicity assessment of chitosan coated CdS nanoparticles for bio-imaging applications. Appl. Surf. Sci. 2020, 499, 143817. [Google Scholar] [CrossRef]
- Shan, C.; Yang, H.; Han, D.; Zhang, Q.; Ivaska, A.; Niu, L. Graphene/AuNPs/chitosan nanocomposites film for glucose biosensing. Biosens. Bioelectron. 2010, 25, 1070–1074. [Google Scholar] [CrossRef]
- Kyzas, G.Z.; Bikiaris, D.N.; Mitropoulos, A.C. Chitosan adsorbents for dye removal: A review. Polym. Int. 2017, 66, 1800–1811. [Google Scholar] [CrossRef]
- Kim, H.C.; Park, W.H. Fluorescent property of glycol chitosan-fluorescein isothiocyanate conjugate for bio-imaging material. Int. J. Biol. Macromol. 2019, 135, 1217–1221. [Google Scholar] [CrossRef]
- Zhao, J.; Wu, J. Preparation and Characterization of the Fluorescent Chitosan Nanoparticle Probe. Chin. J. Anal. Chem. 2006, 34, 1555–1559. [Google Scholar] [CrossRef]
- Liu, J.; Zhang, L.; Wang, C.; Xu, H.; Zhao, X. Preparation and characterization of lectin-conjugated chitosan fluorescent nanoparticles. Mol. Biosyst. 2010, 6, 954–957. [Google Scholar] [CrossRef]
- Zlotnikov, I.D.; Malashkeevich, S.M.; Belogurova, N.G.; Kudryashova, E.V. Thermoreversible Gels Based on Chitosan Copolymers as “Intelligent” Drug Delivery System with Prolonged Action for Intramuscular Injection. Pharmaceutics 2023, 15, 1478. [Google Scholar] [CrossRef]
- Bhattarai, N.; Matsen, F.A.; Zhang, M. PEG-grafted chitosan as an injectable thermoreversible hydrogel. Macromol. Biosci. 2005, 5, 107–111. [Google Scholar] [CrossRef] [PubMed]
- Catanzano, O.; Gomez d’Ayala, G.; D’Agostino, A.; Di Lorenzo, F.; Schiraldi, C.; Malinconico, M.; Lanzetta, R.; Bonina, F.; Laurienzo, P. PEG-crosslinked-chitosan hydrogel films for in situ delivery of Opuntia ficus-indica extract. Carbohydr. Polym. 2021, 264, 117987. [Google Scholar] [CrossRef]
- Corma, A.; Galletero, M.S.; García, H.; Palomares, E.; Rey, F. Pyrene covalently anchored on a large external surface area zeolite as a selective heterogeneous sensor for iodide. Chem. Commun. 2002, 10, 1100–1101. [Google Scholar] [CrossRef] [PubMed]
- Mi, F.L.; Sung, H.W.; Shyu, S.S.; Su, C.C.; Peng, C.K. Synthesis and characterization of biodegradable TPP/genipin co-crosslinked chitosan gel beads. Polymer 2003, 44, 6521–6530. [Google Scholar] [CrossRef]
- Luo, Q.; Wei, Z.; Duan, H.; Jin, L.; Kankanamage, R.N.T.; Shuster, S.; Suib, S.L.; Rusling, J.F.; He, J. Templated synthesis of crystalline mesoporous CeO2 with organosilane-containing polymers: Balancing porosity, crystallinity and catalytic activity. Mater. Futur. 2022, 1, 025302. [Google Scholar] [CrossRef]
- Zlotnikov, I.D.; Streltsov, D.A.; Belogurova, N.G.; Kudryashova, E.V. Chitosan or Cyclodextrin Grafted with Oleic Acid Self-Assemble into Stabilized Polymeric Micelles with Potential of Drug Carriers. Life 2023, 13, 446. [Google Scholar] [CrossRef]
- Sanchez-Gaytan, B.L.; Fay, F.; Hak, S.; Alaarg, A.; Fayad, Z.A.; Pérez-Medina, C.; Zhao, Y. Real-time monitoring of nanoparticle formation by FRET imaging. Angew. Chem. 2017, 129, 2969–2972. [Google Scholar] [CrossRef] [Green Version]
- Fuenzalida, J.P.; Weikert, T.; Hoffmann, S.; Vila-Sanjurjo, C.; Moerschbacher, B.M.; Goycoolea, F.M.; Kolkenbrock, S. Affinity protein-based FRET tools for cellular tracking of chitosan nanoparticles and determination of the polymer degree of acetylation. Biomacromolecules 2014, 15, 2532–2539. [Google Scholar] [CrossRef]
- Lundin, M.; Blomberg, E.; Tilton, R.D. Polymer dynamics in layer-by-layer assemblies of chitosan and heparin. Langmuir 2010, 26, 3242–3251. [Google Scholar] [CrossRef]
- Thévenin, D.; Lazarova, T. Identifying and Measuring Transmembrane Helix–Helix Interactions by FRET. In Membrane Protein Structure and Dynamics. Methods in Molecular Biology; Vaidehi, N., Klein-Seetharaman, J., Eds.; Humana Press: Totowa, NJ, USA, 2012; Volume 914. [Google Scholar] [CrossRef]
- Bastiaens, P.I.H.; Pap, E.H.W.; Borst, J.W.; van Hoek, A.; Kulinski, T.; Rigler, R.; Visser, A.J.W.G. The interaction of pyrene labeled diacylglycerol with protein kinase C in mixed micelles. Biophys. Chem. 1993, 48, 183–191. [Google Scholar] [CrossRef]
- Zlotnikov, I.D.; Streltsov, D.A.; Ezhov, A.A. Smart pH- and Temperature-Sensitive Micelles Based on Chitosan Grafted with Fatty Acids to Increase the Efficiency and Selectivity of Doxorubicin and Its Adjuvant Regarding the Tumor Cells. Pharmaceutics 2023, 15, 1135. [Google Scholar] [CrossRef]
- Zlotnikov, I.D.; Ezhov, A.A.; Vigovskiy, M.A.; Grigorieva, O.A.; Dyachkova, U.D.; Belogurova, N.G.; Kudryashova, E.V. Application Prospects of FTIR Spectroscopy and CLSM to Monitor the Drugs Interaction with Bacteria Cells Localized in Macrophages for Diagnosis and Treatment Control of Respiratory Diseases. Diagnostics 2023, 13, 698. [Google Scholar] [CrossRef] [PubMed]
- Zlotnikov, I.D.; Kudryashova, E.V. Spectroscopy Approach for Highly–Efficient Screening of Lectin–Ligand Interactions in Application for Mannose Receptor and Molecular Containers for Antibacterial Drugs. Pharmaceuticals 2022, 15, 625. [Google Scholar] [CrossRef]
- Pereira, P.; Morgado, D.; Crepet, A.; David, L.; Gama, F.M. Glycol chitosan-based nanogel as a potential targetable carrier for siRNA. Macromol. Biosci. 2013, 13, 1369–1378. [Google Scholar] [CrossRef] [PubMed] [Green Version]
- Bhat, A.R.; Wani, F.A.; Behera, K.; Khan, A.B.; Patel, R. Formulation of biocompatible microemulsions for encapsulation of anti-TB drug rifampicin: A physicochemical and spectroscopic study. Colloids Surfaces A Physicochem. Eng. Asp. 2022, 645, 128846. [Google Scholar] [CrossRef]
- Bonferoni, M.C.; Sandri, G.; Dellera, E.; Rossi, S.; Ferrari, F.; Mori, M.; Caramella, C. Ionic polymeric micelles based on chitosan and fatty acids and intended for wound healing. Comparison of linoleic and oleic acid. Eur. J. Pharm. Biopharm. 2014, 87, 101–106. [Google Scholar] [CrossRef]
- Mohr, A.; Talbiersky, P.; Korth, H.G.; Sustmann, R.; Boese, R.; Bläser, D.; Rehage, H. A new pyrene-based fluorescent probe for the determination of critical micelle concentrations. J. Phys. Chem. B 2007, 111, 12985–12992. [Google Scholar] [CrossRef]
- Ollmann, M.; Galla, H.J.; Schwarzmann, G.; Sandhoff, K. Pyrene-Labeled Gangliosides: Micelle Formation in Aqueous Solution, Lateral Diffusion, and Thermotropic Behavior in Phosphatidylcholine Bilayers. Biochemistry 1987, 26, 5943–5952. [Google Scholar] [CrossRef]
- Berghmans, M.; Govaers, S.; Berghmans, H.; De Schryver, F.C. Study of polymer gelation by fluorescence spectroscopy. Polym. Eng. Sci. 1992, 32, 1466–1470. [Google Scholar] [CrossRef]
- Fluksman, A.; Benny, O. A robust method for critical micelle concentration determination using coumarin-6 as a fluorescent probe. Anal. Methods 2019, 11, 3810–3818. [Google Scholar] [CrossRef]
- Liow, S.S.; Dou, Q.; Kai, D.; Karim, A.A.; Zhang, K.; Xu, F.; Loh, X.J. Thermogels: In Situ Gelling Biomaterial. ACS Biomater. Sci. Eng. 2016, 2, 295–316. [Google Scholar] [CrossRef] [PubMed]
- Branca, C.; Khouzami, K.; Wanderlingh, U.; D’Angelo, G. Effect of intercalated chitosan/clay nanostructures on concentrated pluronic F127 solution: A FTIR-ATR, DSC and rheological study. J. Colloid Interface Sci. 2018, 517, 221–229. [Google Scholar] [CrossRef] [PubMed]
- Zlotnikov, I.D.; Ezhov, A.A.; Ferberg, A.S.; Krylov, S.S.; Semenova, M.N.; Semenov, V.V.; Kudryashova, E.V. Polymeric Micelles Formulation of Combretastatin Derivatives with Enhanced Solubility, Cytostatic Activity and Selectivity against Cancer Cells. Pharmaceutics 2023, 15, 1613. [Google Scholar] [CrossRef] [PubMed]
- Lu, Y.J.; Lan, Y.H.; Chuang, C.C.; Lu, W.T.; Chan, L.Y.; Hsu, P.W.; Chen, J.P. Injectable thermo-sensitive chitosan hydrogel containing CPT-11-loaded EGFR-targeted graphene oxide and SLP2 shRNA for localized drug/gene delivery in glioblastoma therapy. Int. J. Mol. Sci. 2020, 21, 7111. [Google Scholar] [CrossRef]
- Wu, J.; Su, Z.; Ma, G. A thermo- and pH-sensitive hydrogel composed of quaternized chitosan/glycerophosphate. Int. J. Pharm. 2006, 315, 1–11. [Google Scholar] [CrossRef]
- Mohamed, N.A.; Abd El-Ghany, N.A. Synthesis and antimicrobial activity of some novel terephthaloyl thiourea cross-linked carboxymethyl chitosan hydrogels. Cellulose 2012, 19, 1879–1891. [Google Scholar] [CrossRef]
- Eivazzadeh-Keihan, R.; Radinekiyan, F.; Maleki, A.; Salimi Bani, M.; Hajizadeh, Z.; Asgharnasl, S. A novel biocompatible core-shell magnetic nanocomposite based on cross-linked chitosan hydrogels for in vitro hyperthermia of cancer therapy. Int. J. Biol. Macromol. 2019, 140, 407–414. [Google Scholar] [CrossRef]
- Dobryakova, N.V.; Zhdanov, D.D.; Sokolov, N.N.; Aleksandrova, S.S.; Pokrovskaya, M.V.; Kudryashova, E.V. Improvement of Biocatalytic Properties and Cytotoxic Activity of L-Asparaginase from Rhodospirillum rubrum by Conjugation with Chitosan-Based Cationic Polyelectrolytes. Pharmaceuticals 2022, 15, 406. [Google Scholar] [CrossRef]
- Gao, J.Q.; Zhao, Q.Q.; Lv, T.F.; Shuai, W.P.; Zhou, J.; Tang, G.P.; Liang, W.Q.; Tabata, Y.; Hu, Y.L. Gene-carried chitosan-linked-PEI induced high gene transfection efficiency with low toxicity and significant tumor-suppressive activity. Int. J. Pharm. 2010, 387, 286–294. [Google Scholar] [CrossRef]
- Kievit, F.M.; Veiseh, O.; Bhattarai, N.; Fang, C.; Gunn, J.W.; Lee, D.; Ellenbogen, R.G.; Olson, J.M.; Zhang, M. PEI-PEG-chitosan-copolymer-coated iron oxide nanoparticles for safe gene delivery: Synthesis, complexation, and transfection. Adv. Funct. Mater. 2009, 19, 2244–2251. [Google Scholar] [CrossRef] [Green Version]
- Jiang, H.L.; Kim, Y.K.; Arote, R.; Nah, J.W.; Cho, M.H.; Choi, Y.J.; Akaike, T.; Cho, C.S. Chitosan-graft-polyethylenimine as a gene carrier. J. Control. Release 2007, 117, 273–280. [Google Scholar] [CrossRef] [PubMed]
- Ping, Y.; Liu, C.; Zhang, Z.; Liu, K.L.; Chen, J.; Li, J. Chitosan-graft-(PEI-β-cyclodextrin) copolymers and their supramolecular PEGylation for DNA and siRNA delivery. Biomaterials 2011, 32, 8328–8341. [Google Scholar] [CrossRef] [PubMed]
- Jiang, H.L.; Kim, Y.K.; Arote, R.; Jere, D.; Quan, J.S.; Yu, J.H.; Choi, Y.J.; Nah, J.W.; Cho, M.H.; Cho, C.S. Mannosylated chitosan-graft-polyethylenimine as a gene carrier for Raw 264.7 cell targeting. Int. J. Pharm. 2009, 375, 133–139. [Google Scholar] [CrossRef]
- Vasile, C.; Pamfil, D.; Stoleru, E.; Baican, M. New developments in medical applications of hybrid hydrogels containing natural polymers. Molecules 2020, 25, 1539. [Google Scholar] [CrossRef] [Green Version]
- Zhou, X.; Su, F.; Lu, H.; Senechal-Willis, P.; Tian, Y.; Johnson, R.H.; Meldrum, D.R. An FRET-based ratiometric chemosensor for in vitro cellular fluorescence analyses of pH. Biomaterials 2012, 33, 171–180. [Google Scholar] [CrossRef] [Green Version]
- Zhong, H.; Liu, C.; Ge, W.; Sun, R.; Huang, F.; Wang, X. Self-Assembled Conjugated Polymer/Chitosan-graft-Oleic Acid Micelles for Fast Visible Detection of Aliphatic Biogenic Amines by “turn-On” FRET. ACS Appl. Mater. Interfaces 2017, 9, 22875–22884. [Google Scholar] [CrossRef]
- Dennis, A.M.; Rhee, W.J.; Sotto, D.; Dublin, S.N.; Bao, G. Quantum dot-fluorescent protein fret probes for sensing intracellular pH. ACS Nano 2012, 6, 2917–2924. [Google Scholar] [CrossRef] [PubMed] [Green Version]
- Chen, T.; He, B.; Tao, J.; He, Y.; Deng, H.; Wang, X.; Zheng, Y. Application of Förster Resonance Energy Transfer (FRET) technique to elucidate intracellular and In Vivo biofate of nanomedicines. Adv. Drug Deliv. Rev. 2019, 143, 177–205. [Google Scholar] [CrossRef]
- Huebsch, N.D.; Mooney, D.J. Fluorescent resonance energy transfer: A tool for probing molecular cell-biomaterial interactions in three dimensions. Biomaterials 2007, 28, 2424–2437. [Google Scholar] [CrossRef] [PubMed] [Green Version]
- Ghezzi, M.; Pescina, S.; Padula, C.; Santi, P.; Del Favero, E.; Cantù, L.; Nicoli, S. Polymeric micelles in drug delivery: An insight of the techniques for their characterization and assessment in biorelevant conditions. J. Control. Release 2021, 332, 312–336. [Google Scholar] [CrossRef] [PubMed]
- Hoffmann, S.; Gorzelanny, C.; Moerschbacher, B.; Goycoolea, F.M. Physicochemical characterization of FRET-labelled chitosan nanocapsules and model degradation studies. Nanomaterials 2018, 8, 846. [Google Scholar] [CrossRef] [PubMed] [Green Version]
- Zlotnikov, I.D.; Vigovskiy, M.A.; Davydova, M.P.; Danilov, M.R.; Dyachkova, U.D.; Grigorieva, O.A.; Kudryashova, E.V. Mannosylated Systems for Targeted Delivery of Antibacterial Drugs to Activated Macrophages. Int. J. Mol. Sci. 2022, 23, 16144. [Google Scholar] [CrossRef] [PubMed]
- Zlotnikov, I.D.; Ezhov, A.A.; Petrov, R.A.; Vigovskiy, M.A.; Grigorieva, O.A.; Belogurova, N.G.; Kudryashova, E.V. Mannosylated Polymeric Ligands for Targeted Delivery of Antibacterials and Their Adjuvants to Macrophages for the Enhancement of the Drug Efficiency. Pharmaceuticals 2022, 15, 1172. [Google Scholar] [CrossRef] [PubMed]
- Zlotnikov, I.D.; Kudryashova, E.V. Mannose Receptors of Alveolar Macrophages as a Target for the Addressed Delivery of Medicines to the Lungs. Russ. J. Bioorganic Chem. 2022, 48, 46–75. [Google Scholar] [CrossRef]
- Kudryashova, E.V.; Meinders, M.B.J.; Visser, A.J.W.G.; Van Hoek, A.; De Jongh, H.H.J. Structure and dynamics of egg white ovalbumin adsorbed at the air/water interface. Eur. Biophys. J. 2003, 32, 553–562. [Google Scholar] [CrossRef]
- Dong, A.; Meyer, J.D.; Brown, J.L.; Manning, M.C.; Carpenter, J.F. Comparative fourier transform infrared and circular dichroism spectroscopic analysis of α1-proteinase inhibitor and ovalbumin in aqueous solution. Arch. Biochem. Biophys. 2000, 383, 148–155. [Google Scholar] [CrossRef]


| Polymer | Sample | Hydrodynamic Diameter of Particles, nm | ζ Potential, mV |
|---|---|---|---|
| Chit5 (5 kDa, 90% degree of deacetylation) | Native | >1 μm | 0.7 ± 0.3 |
| After extrusion in pH 10 | 170 ± 40 | −1.9 ± 0.8 | |
| After extrusion in alginic acid solution | 260 ± 40 | −15 ± 2 | |
| Chit5-PEG (1/1 w/w, 10 kDa) * | Native | 450 ± 70 | 3.5 ± 0.9 |
| After extrusion in pH 10 | 400 ± 30 | −0.3 ± 0.2 | |
| After extrusion in alginic acid solution | 190 ± 10 | −5.5 ± 1.9 |
Disclaimer/Publisher’s Note: The statements, opinions and data contained in all publications are solely those of the individual author(s) and contributor(s) and not of MDPI and/or the editor(s). MDPI and/or the editor(s) disclaim responsibility for any injury to people or property resulting from any ideas, methods, instructions or products referred to in the content. |
© 2023 by the authors. Licensee MDPI, Basel, Switzerland. This article is an open access article distributed under the terms and conditions of the Creative Commons Attribution (CC BY) license (https://creativecommons.org/licenses/by/4.0/).
Share and Cite
Zlotnikov, I.D.; Savchenko, I.V.; Kudryashova, E.V. Fluorescent Probes with Förster Resonance Energy Transfer Function for Monitoring the Gelation and Formation of Nanoparticles Based on Chitosan Copolymers. J. Funct. Biomater. 2023, 14, 401. https://doi.org/10.3390/jfb14080401
Zlotnikov ID, Savchenko IV, Kudryashova EV. Fluorescent Probes with Förster Resonance Energy Transfer Function for Monitoring the Gelation and Formation of Nanoparticles Based on Chitosan Copolymers. Journal of Functional Biomaterials. 2023; 14(8):401. https://doi.org/10.3390/jfb14080401
Chicago/Turabian StyleZlotnikov, Igor D., Ivan V. Savchenko, and Elena V. Kudryashova. 2023. "Fluorescent Probes with Förster Resonance Energy Transfer Function for Monitoring the Gelation and Formation of Nanoparticles Based on Chitosan Copolymers" Journal of Functional Biomaterials 14, no. 8: 401. https://doi.org/10.3390/jfb14080401