Electrochemical Behavior of Symmetric Electrical Double-Layer Capacitors and Pseudocapacitors and Identification of Transport Anomalies in the Interconnected Ionic and Electronic Phases Using the Impedance Technique
Abstract
:1. Introduction
2. Experimental Details
2.1. Preparation of the Composite Electrodes
2.2. Structural and Surface Morphology Characterization Studies
2.3. Electrochemical Characterization Studies
3. Results and Discussion
3.1. Ex Situ Characterization Studies
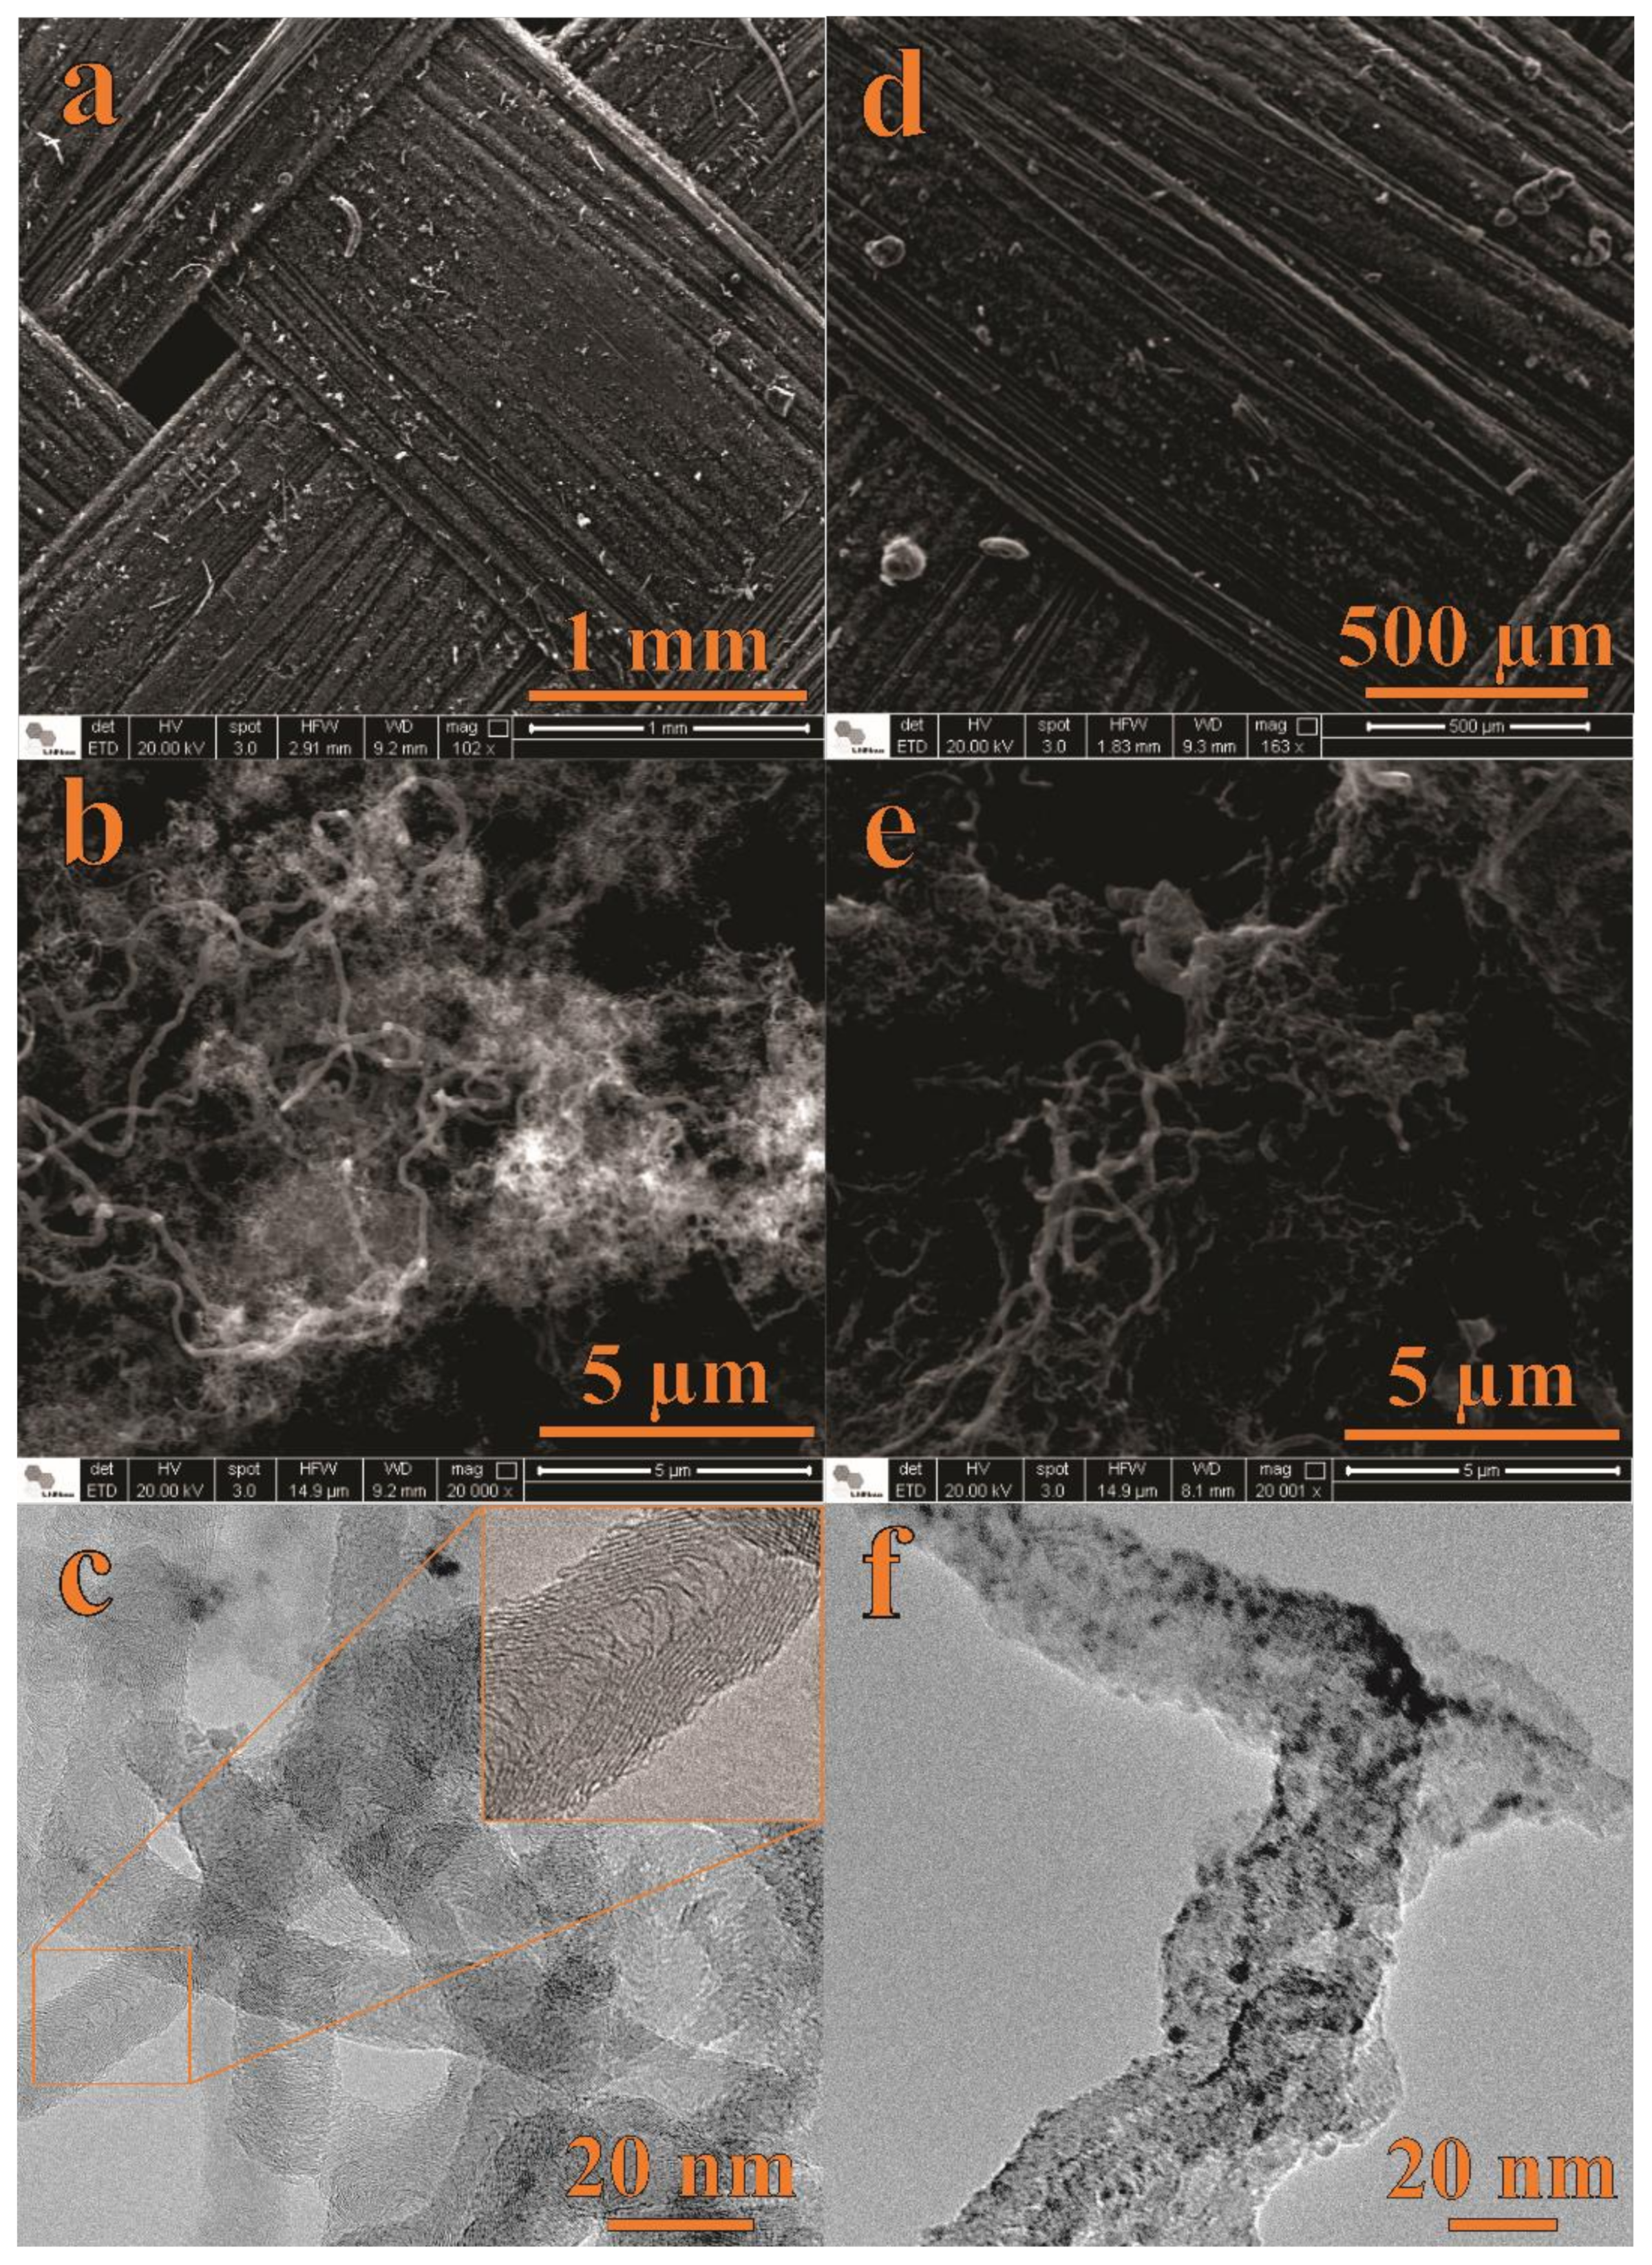
3.1.1. Surface Morphology Analysis: SEM and TEM Studies
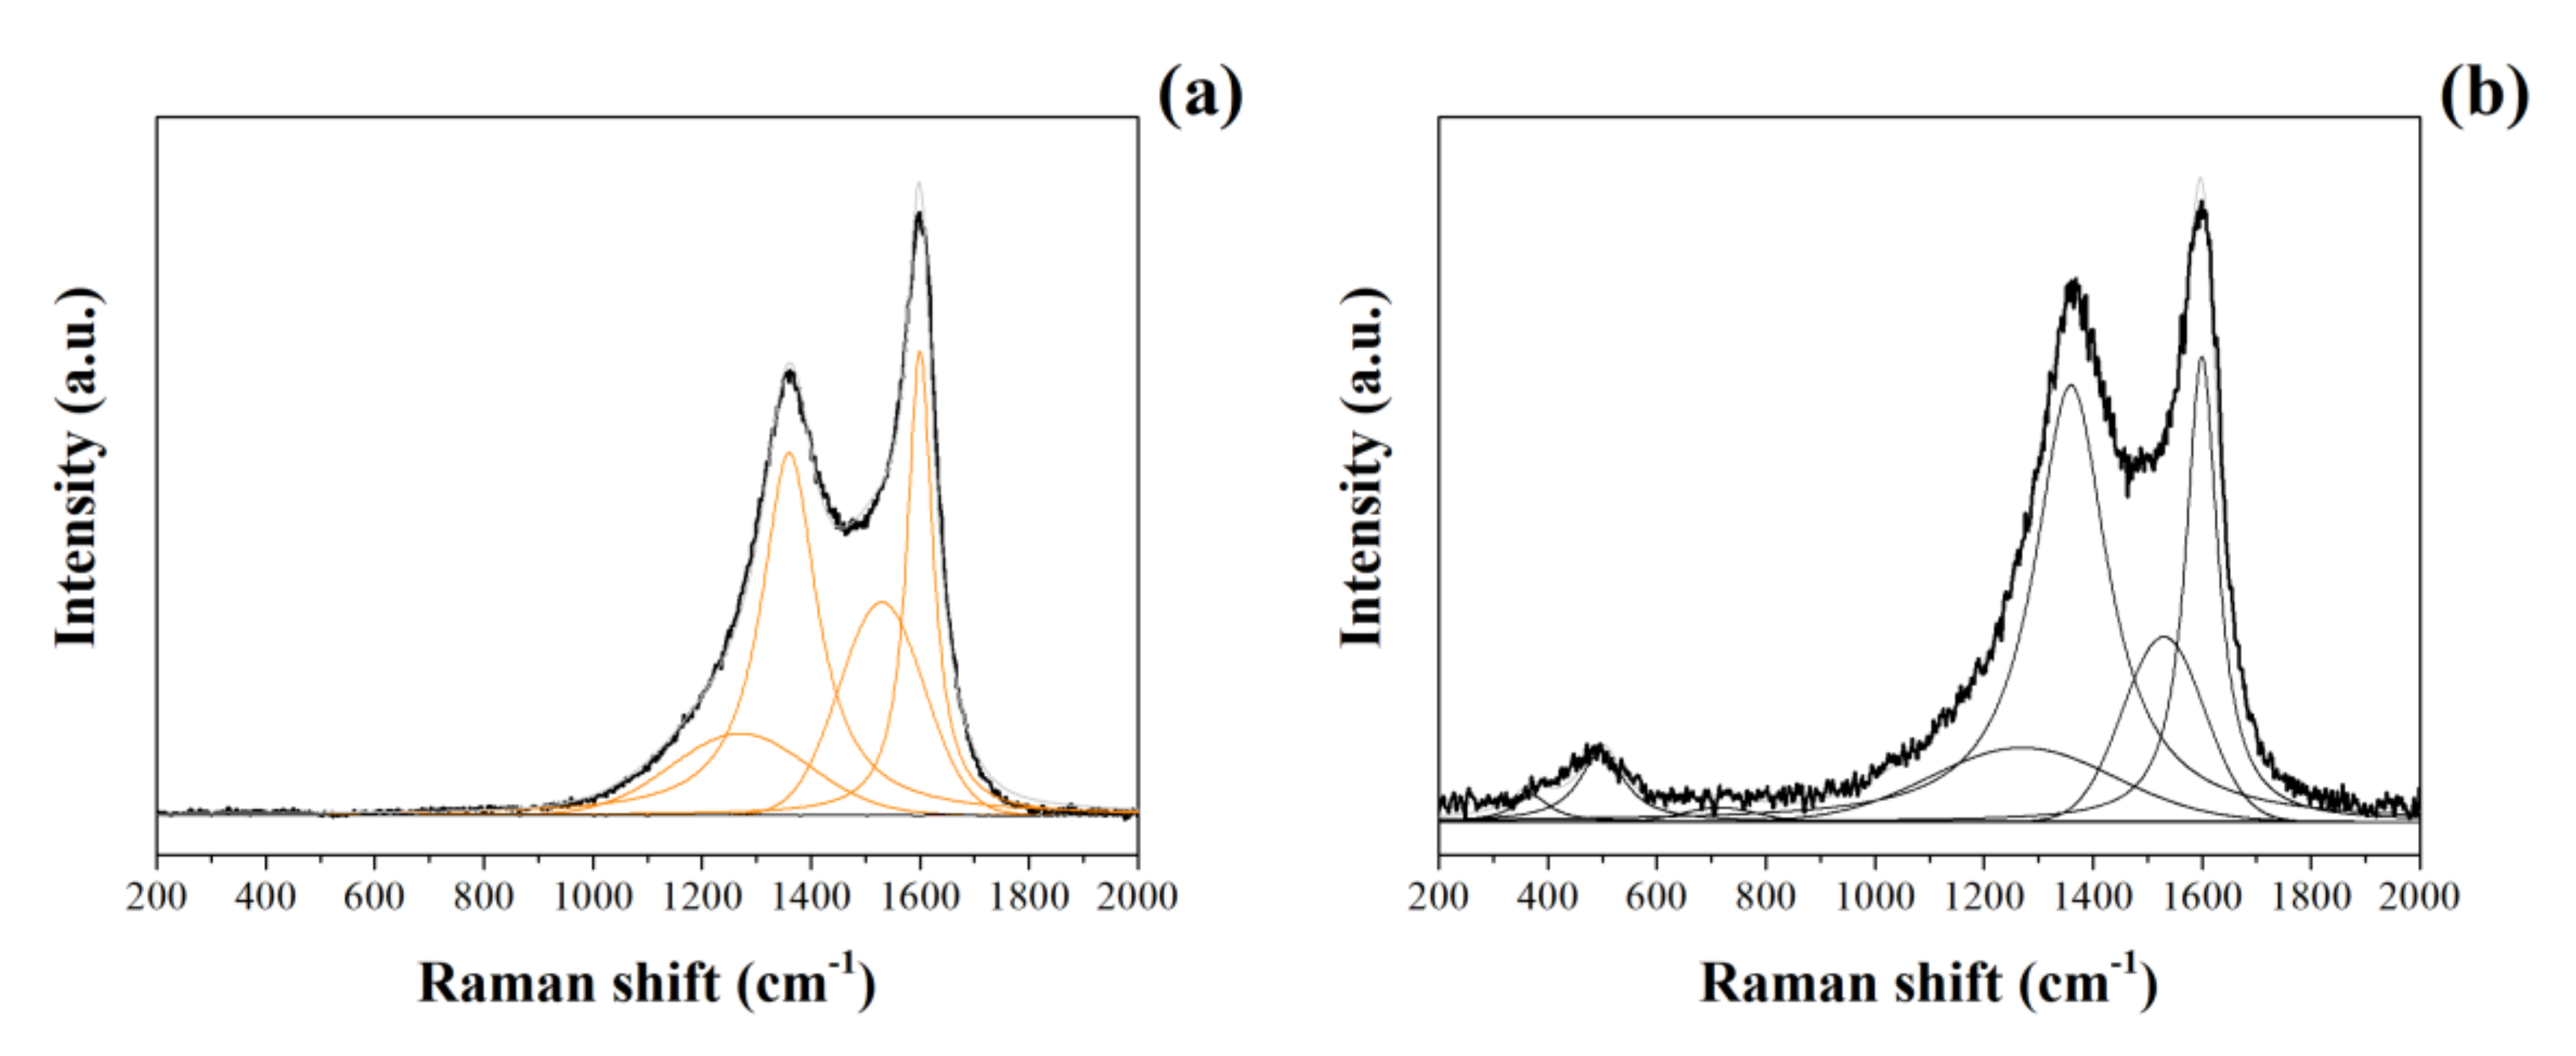
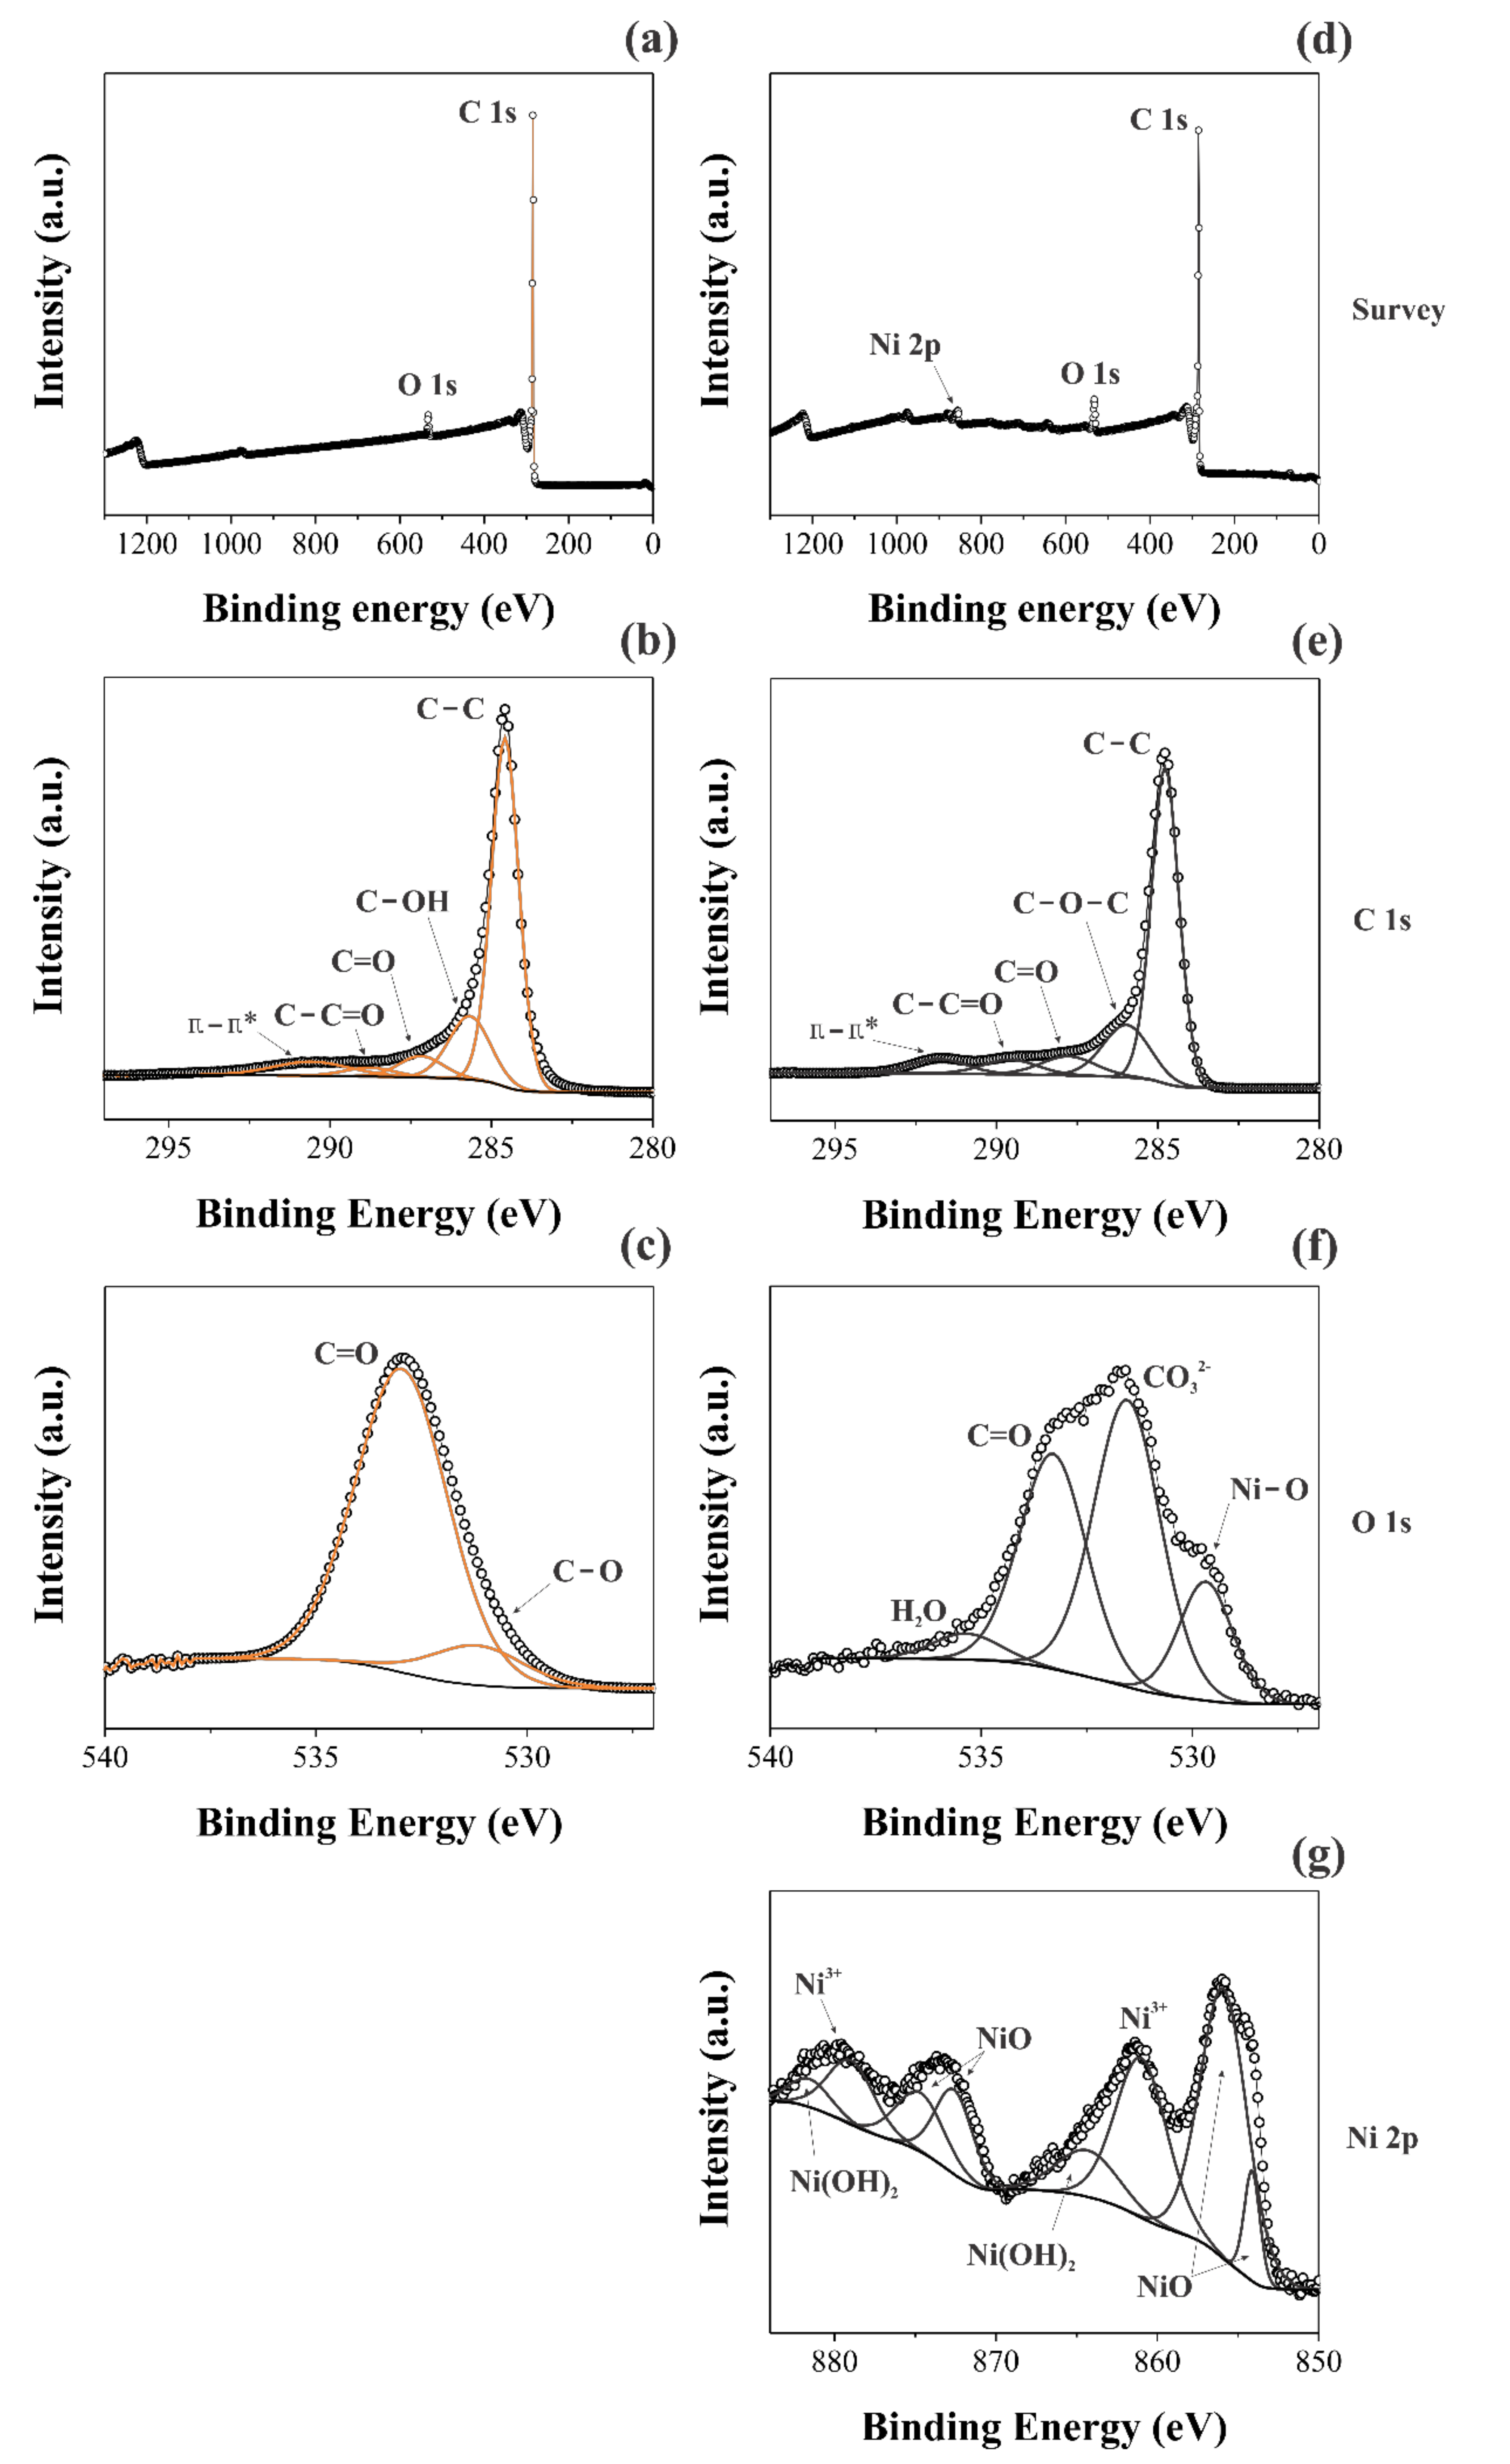
3.1.2. Raman and XPS Studies
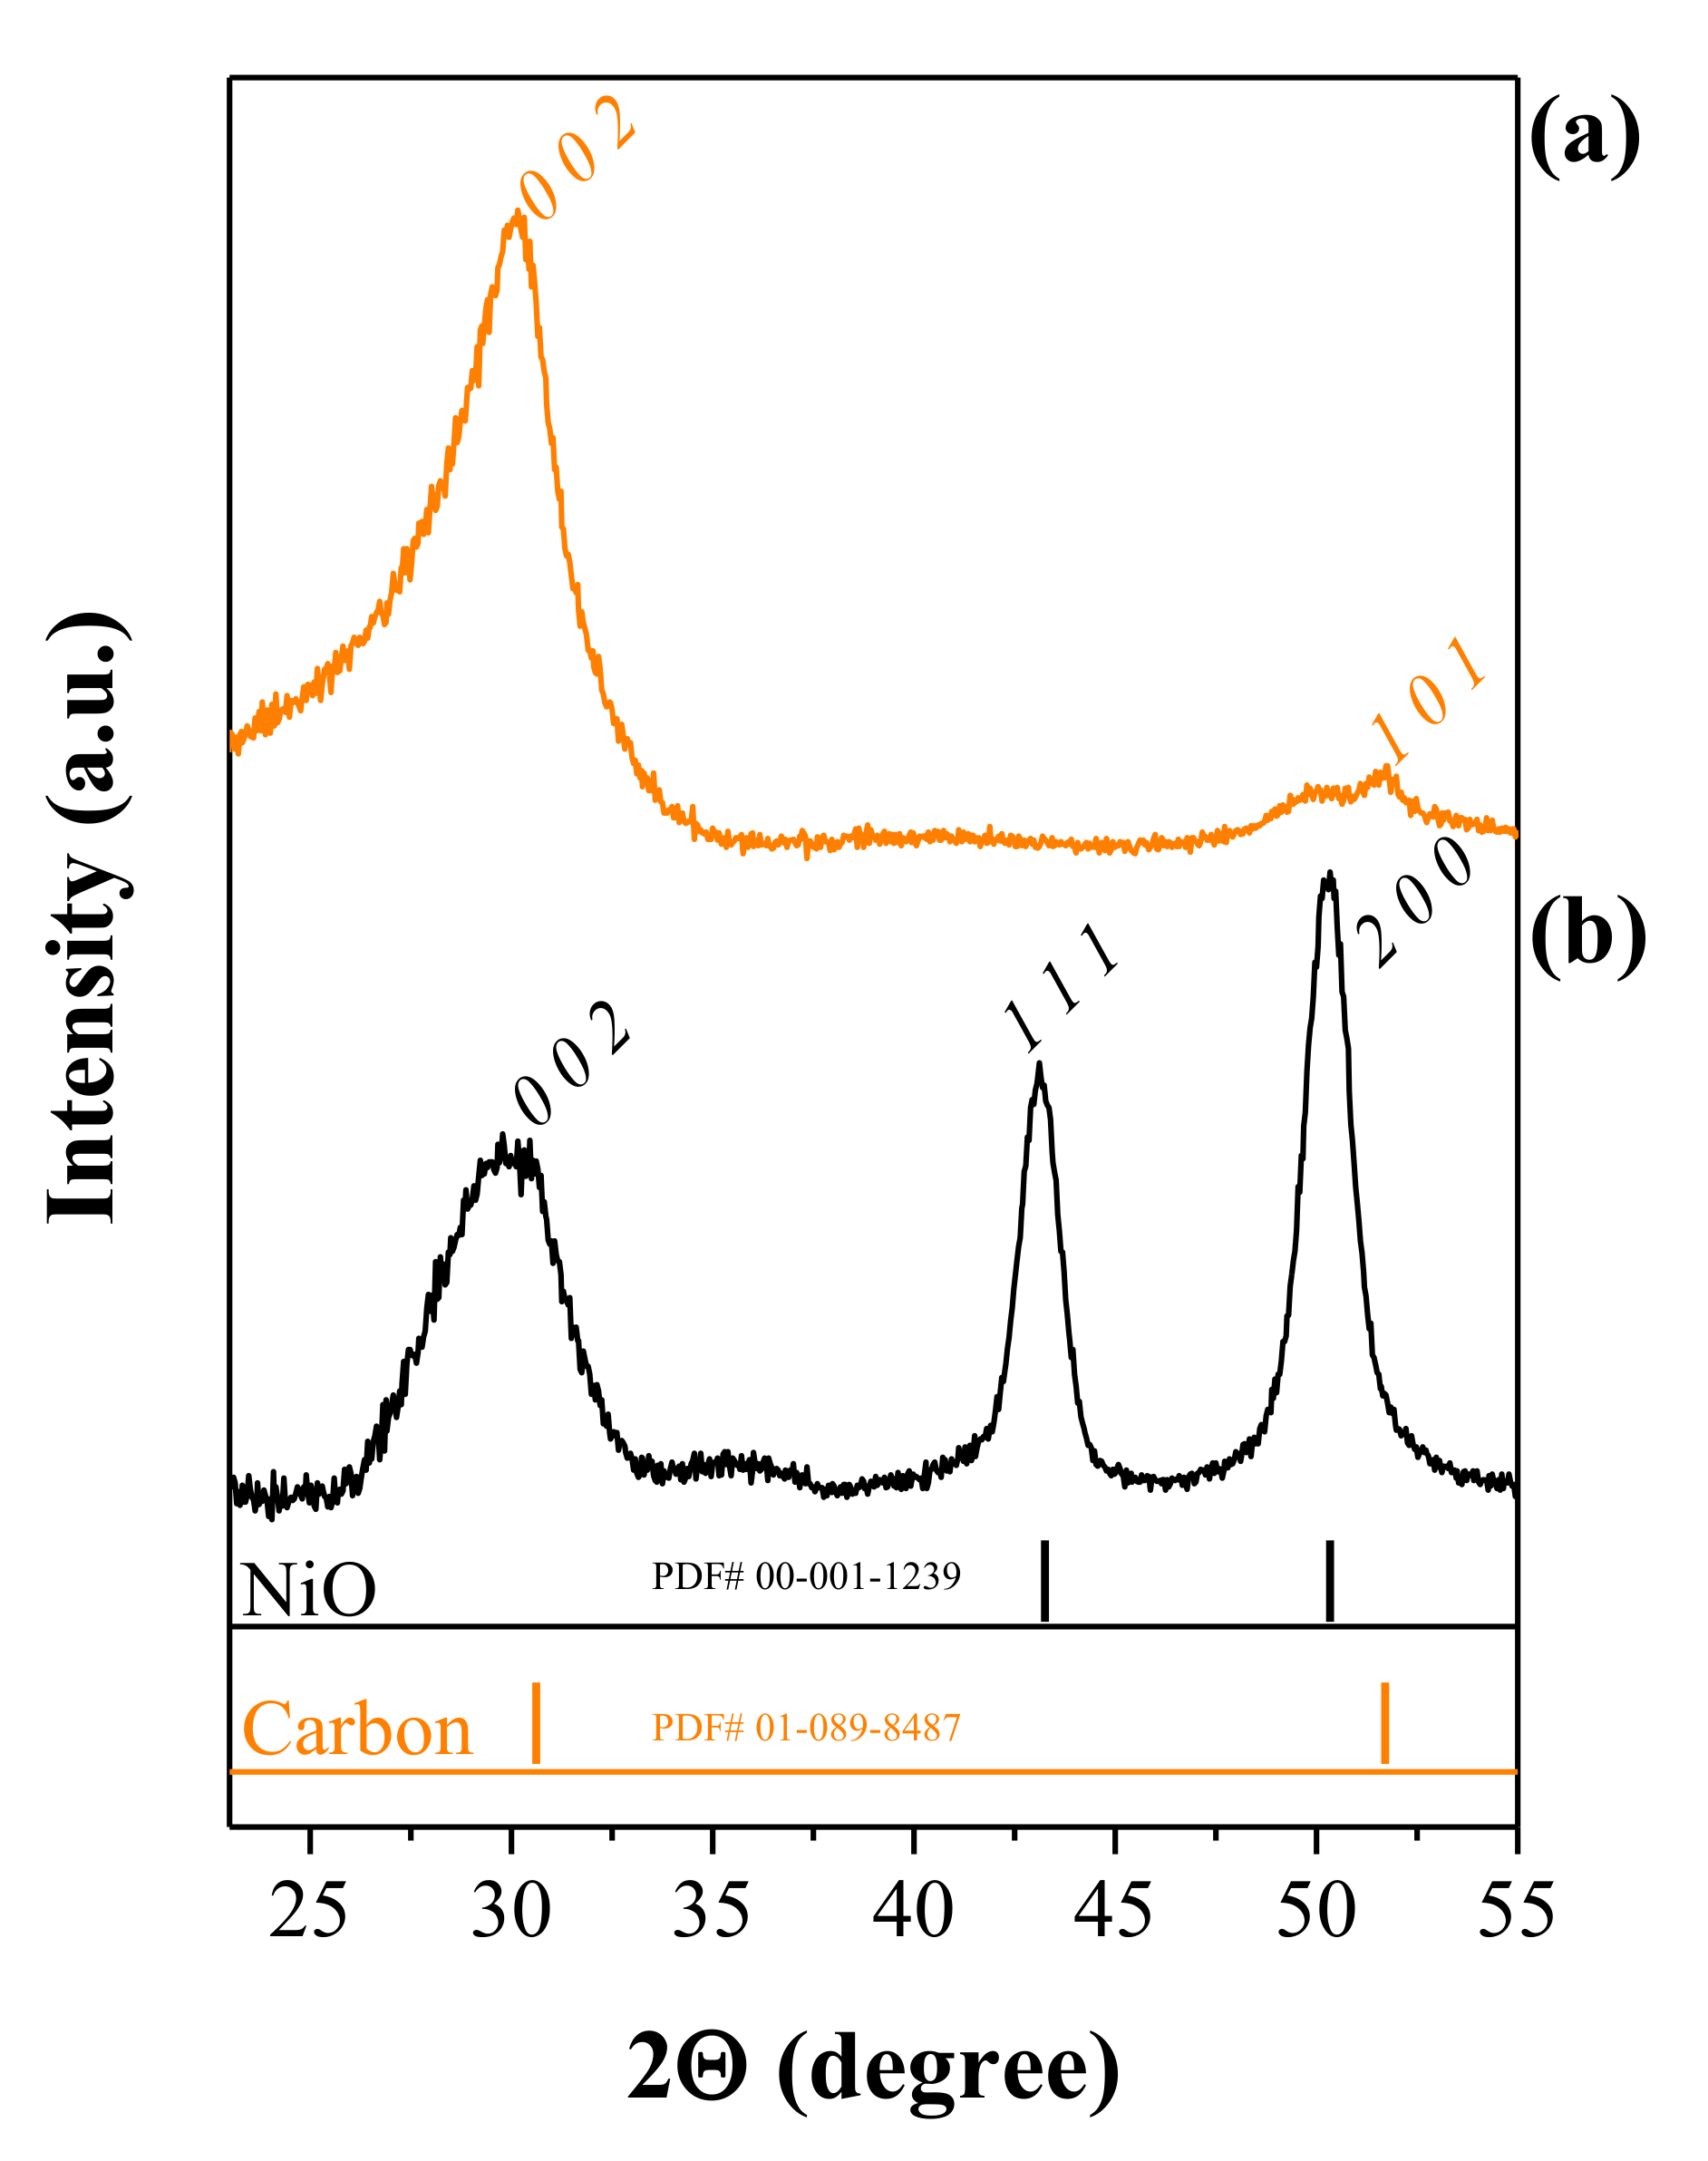
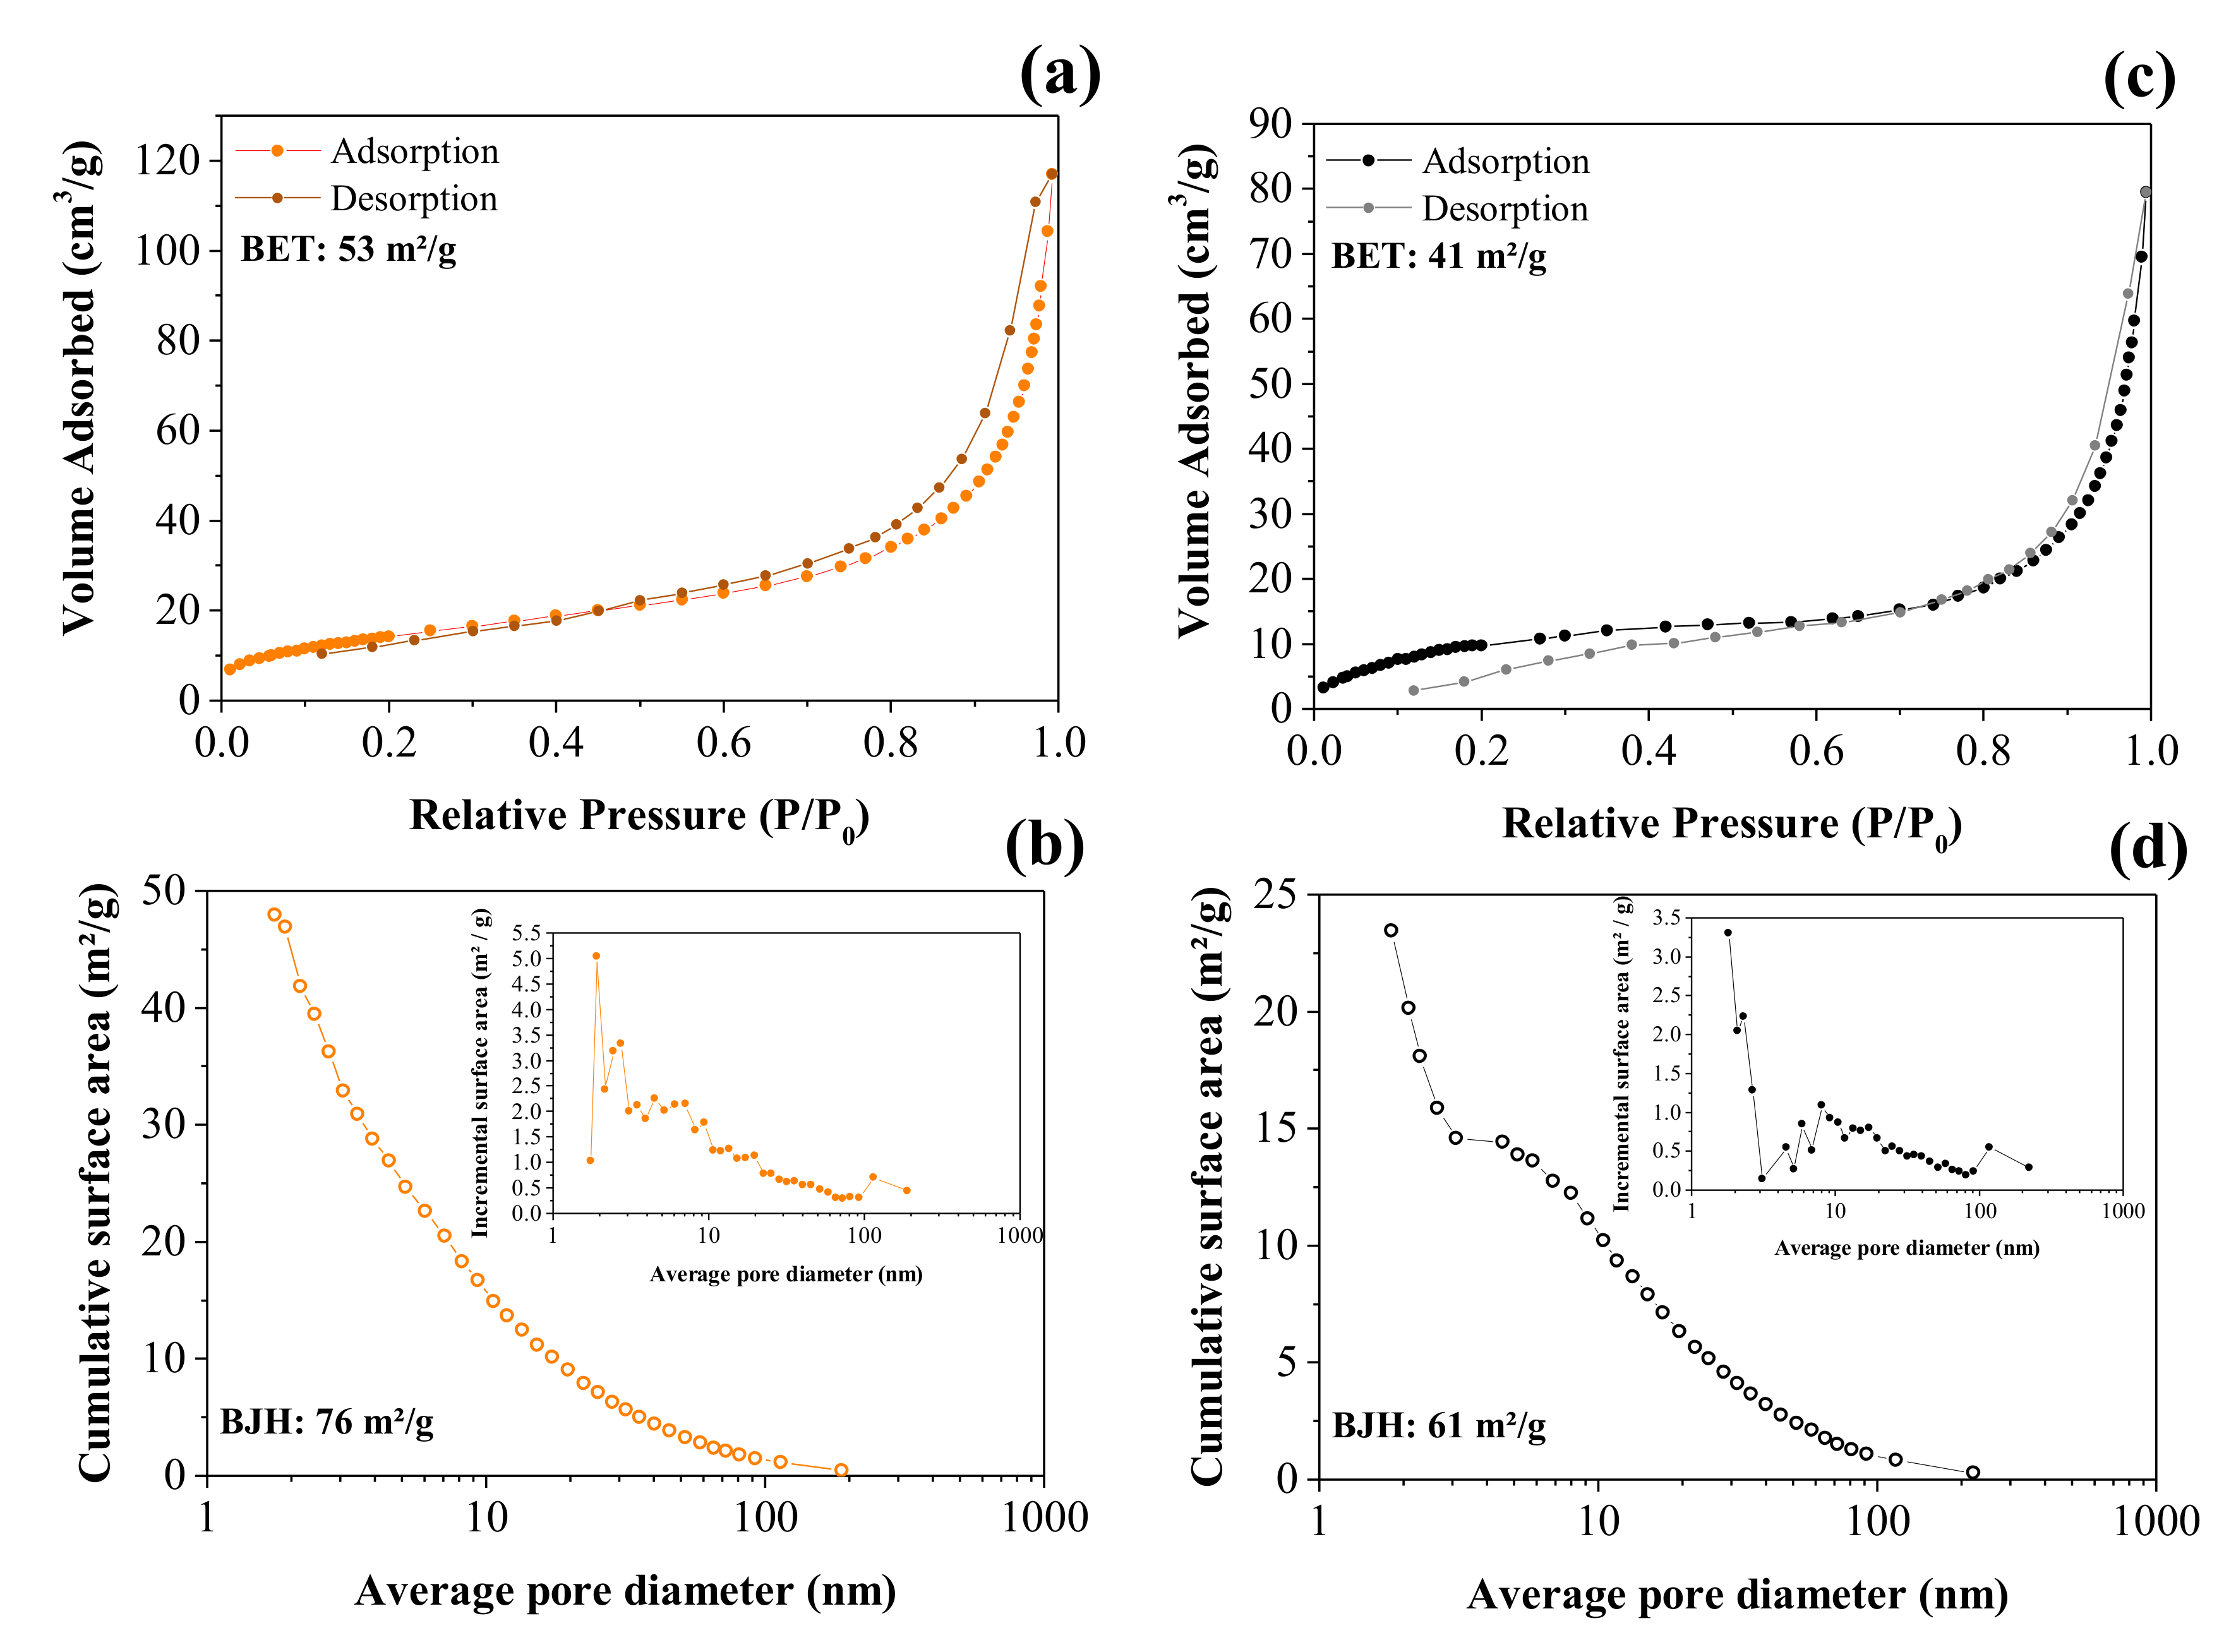
3.1.3. XRD and BET Studies
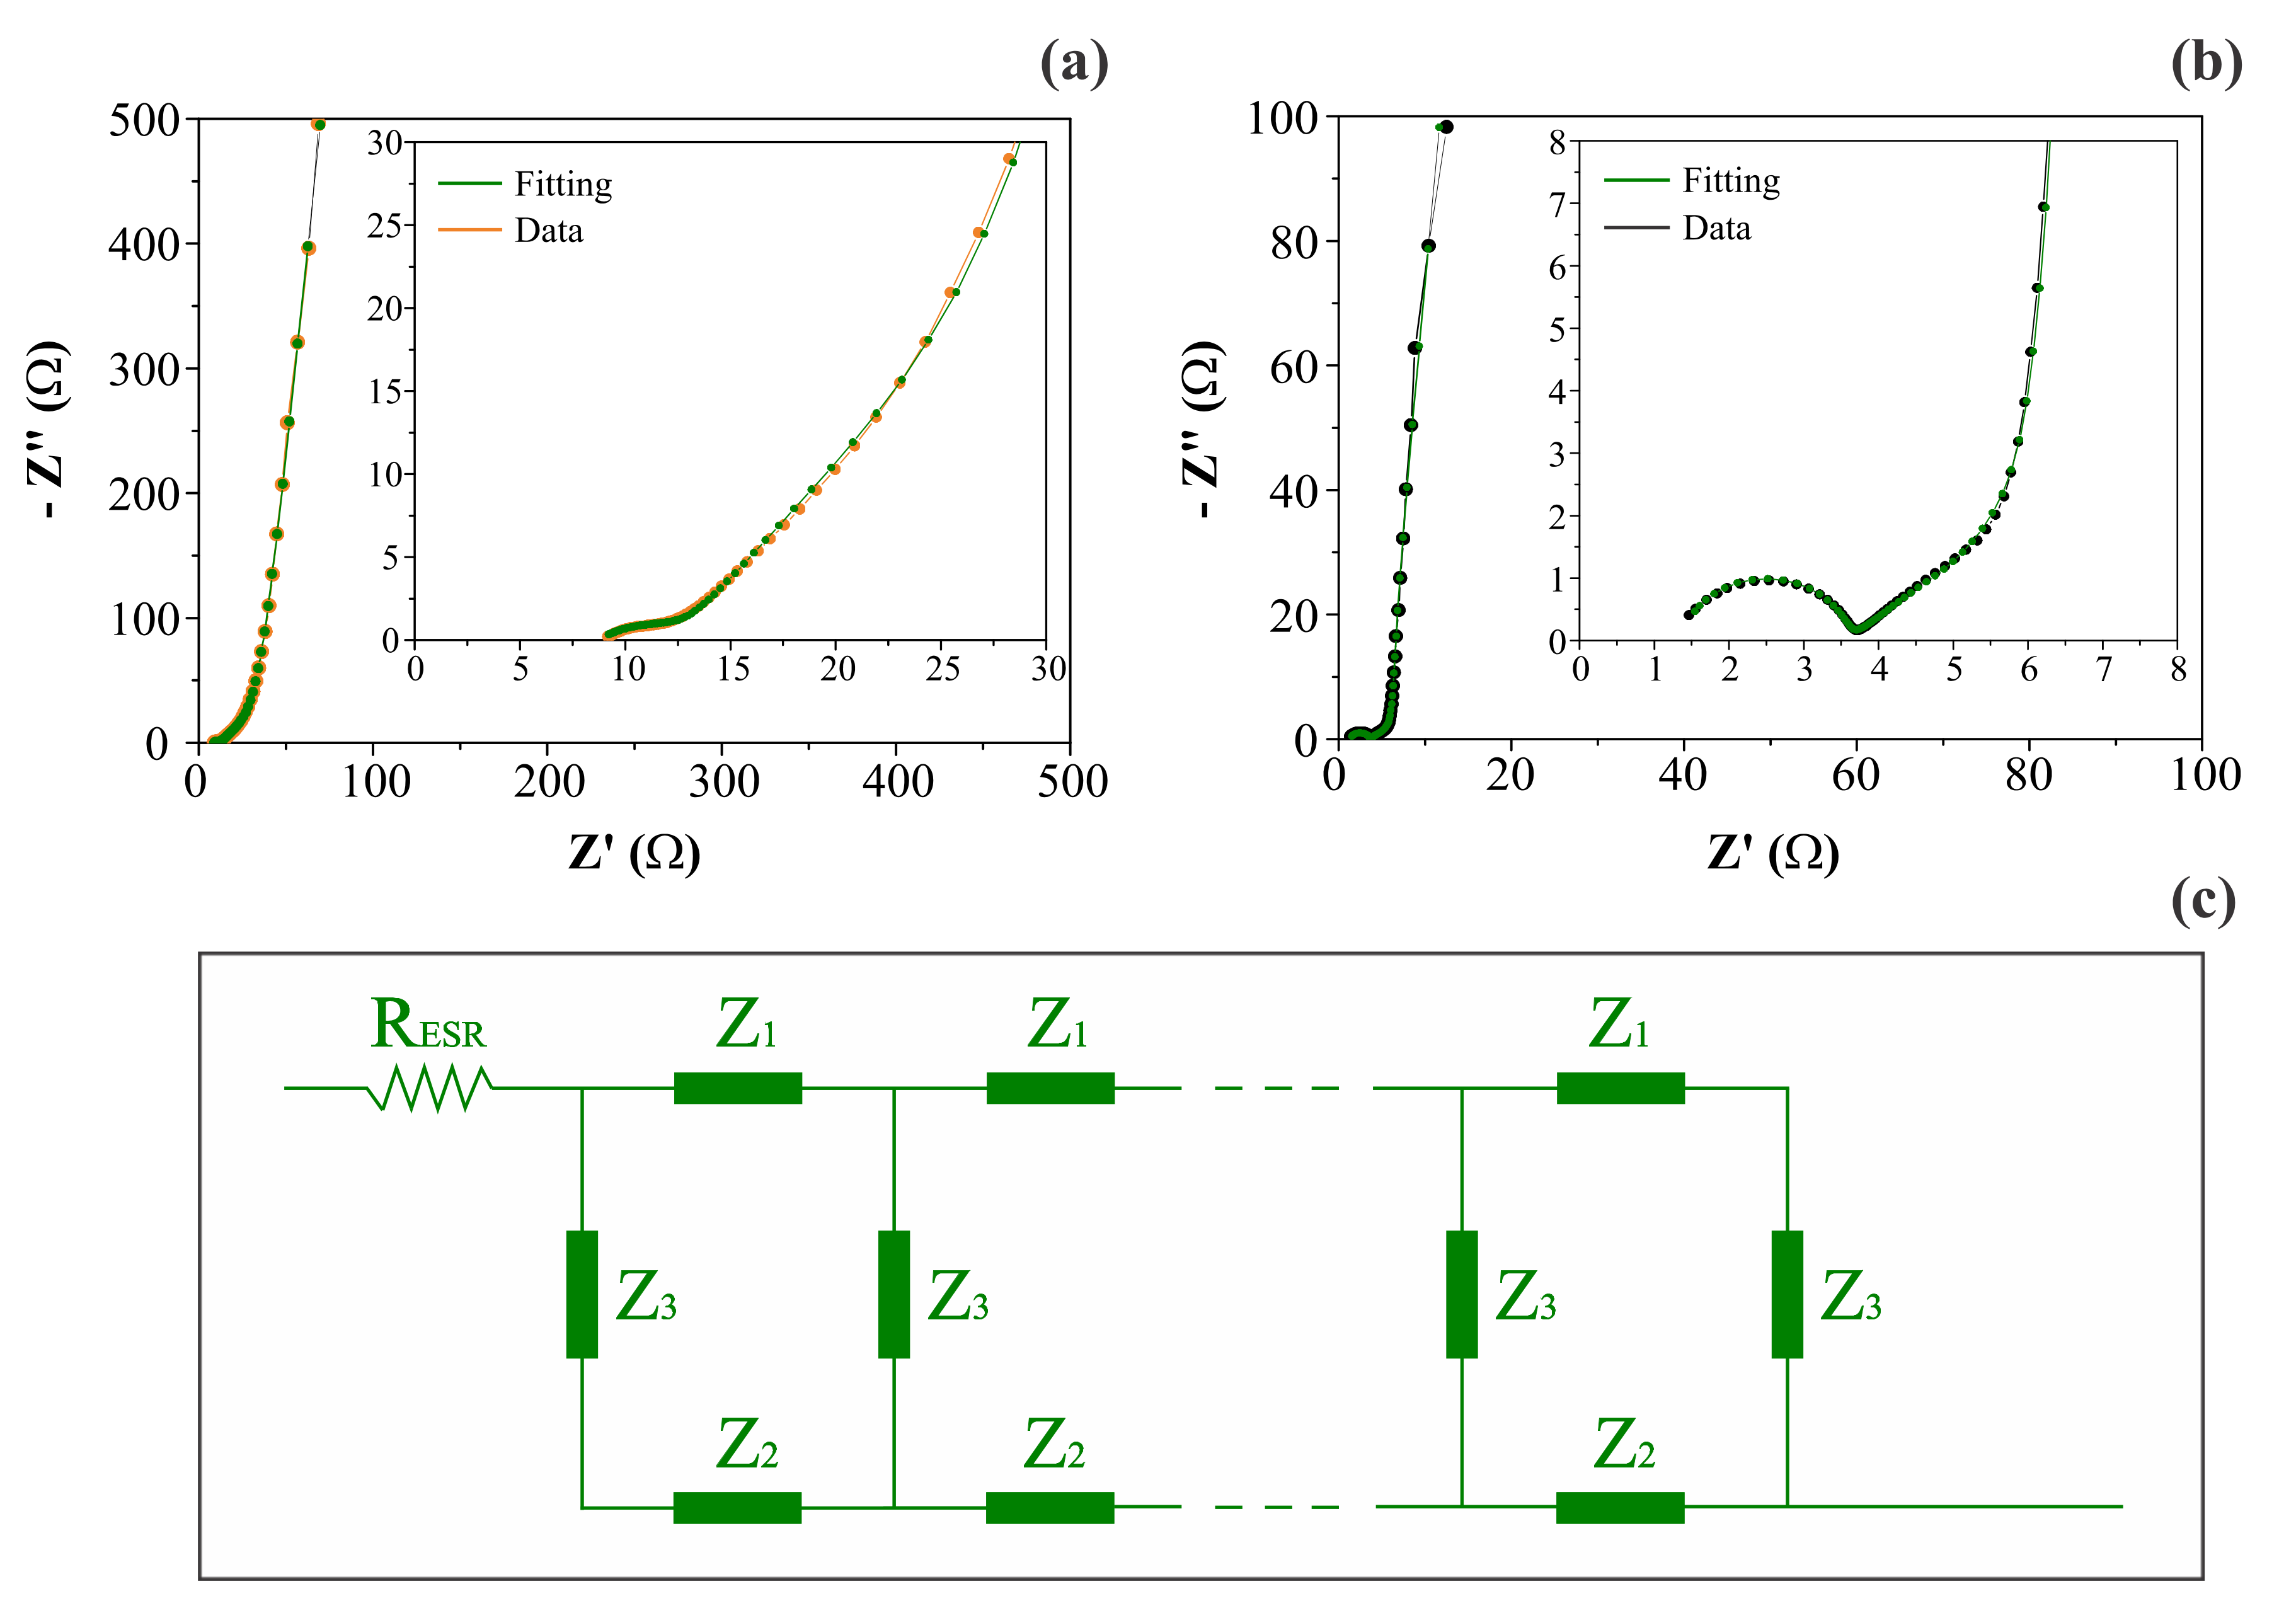
3.2. Frequency Domain Analysis Using the EIS Technique: Identification of Charge Transport Anomalies during the Charge Storage Process in EDLC and PC Devices
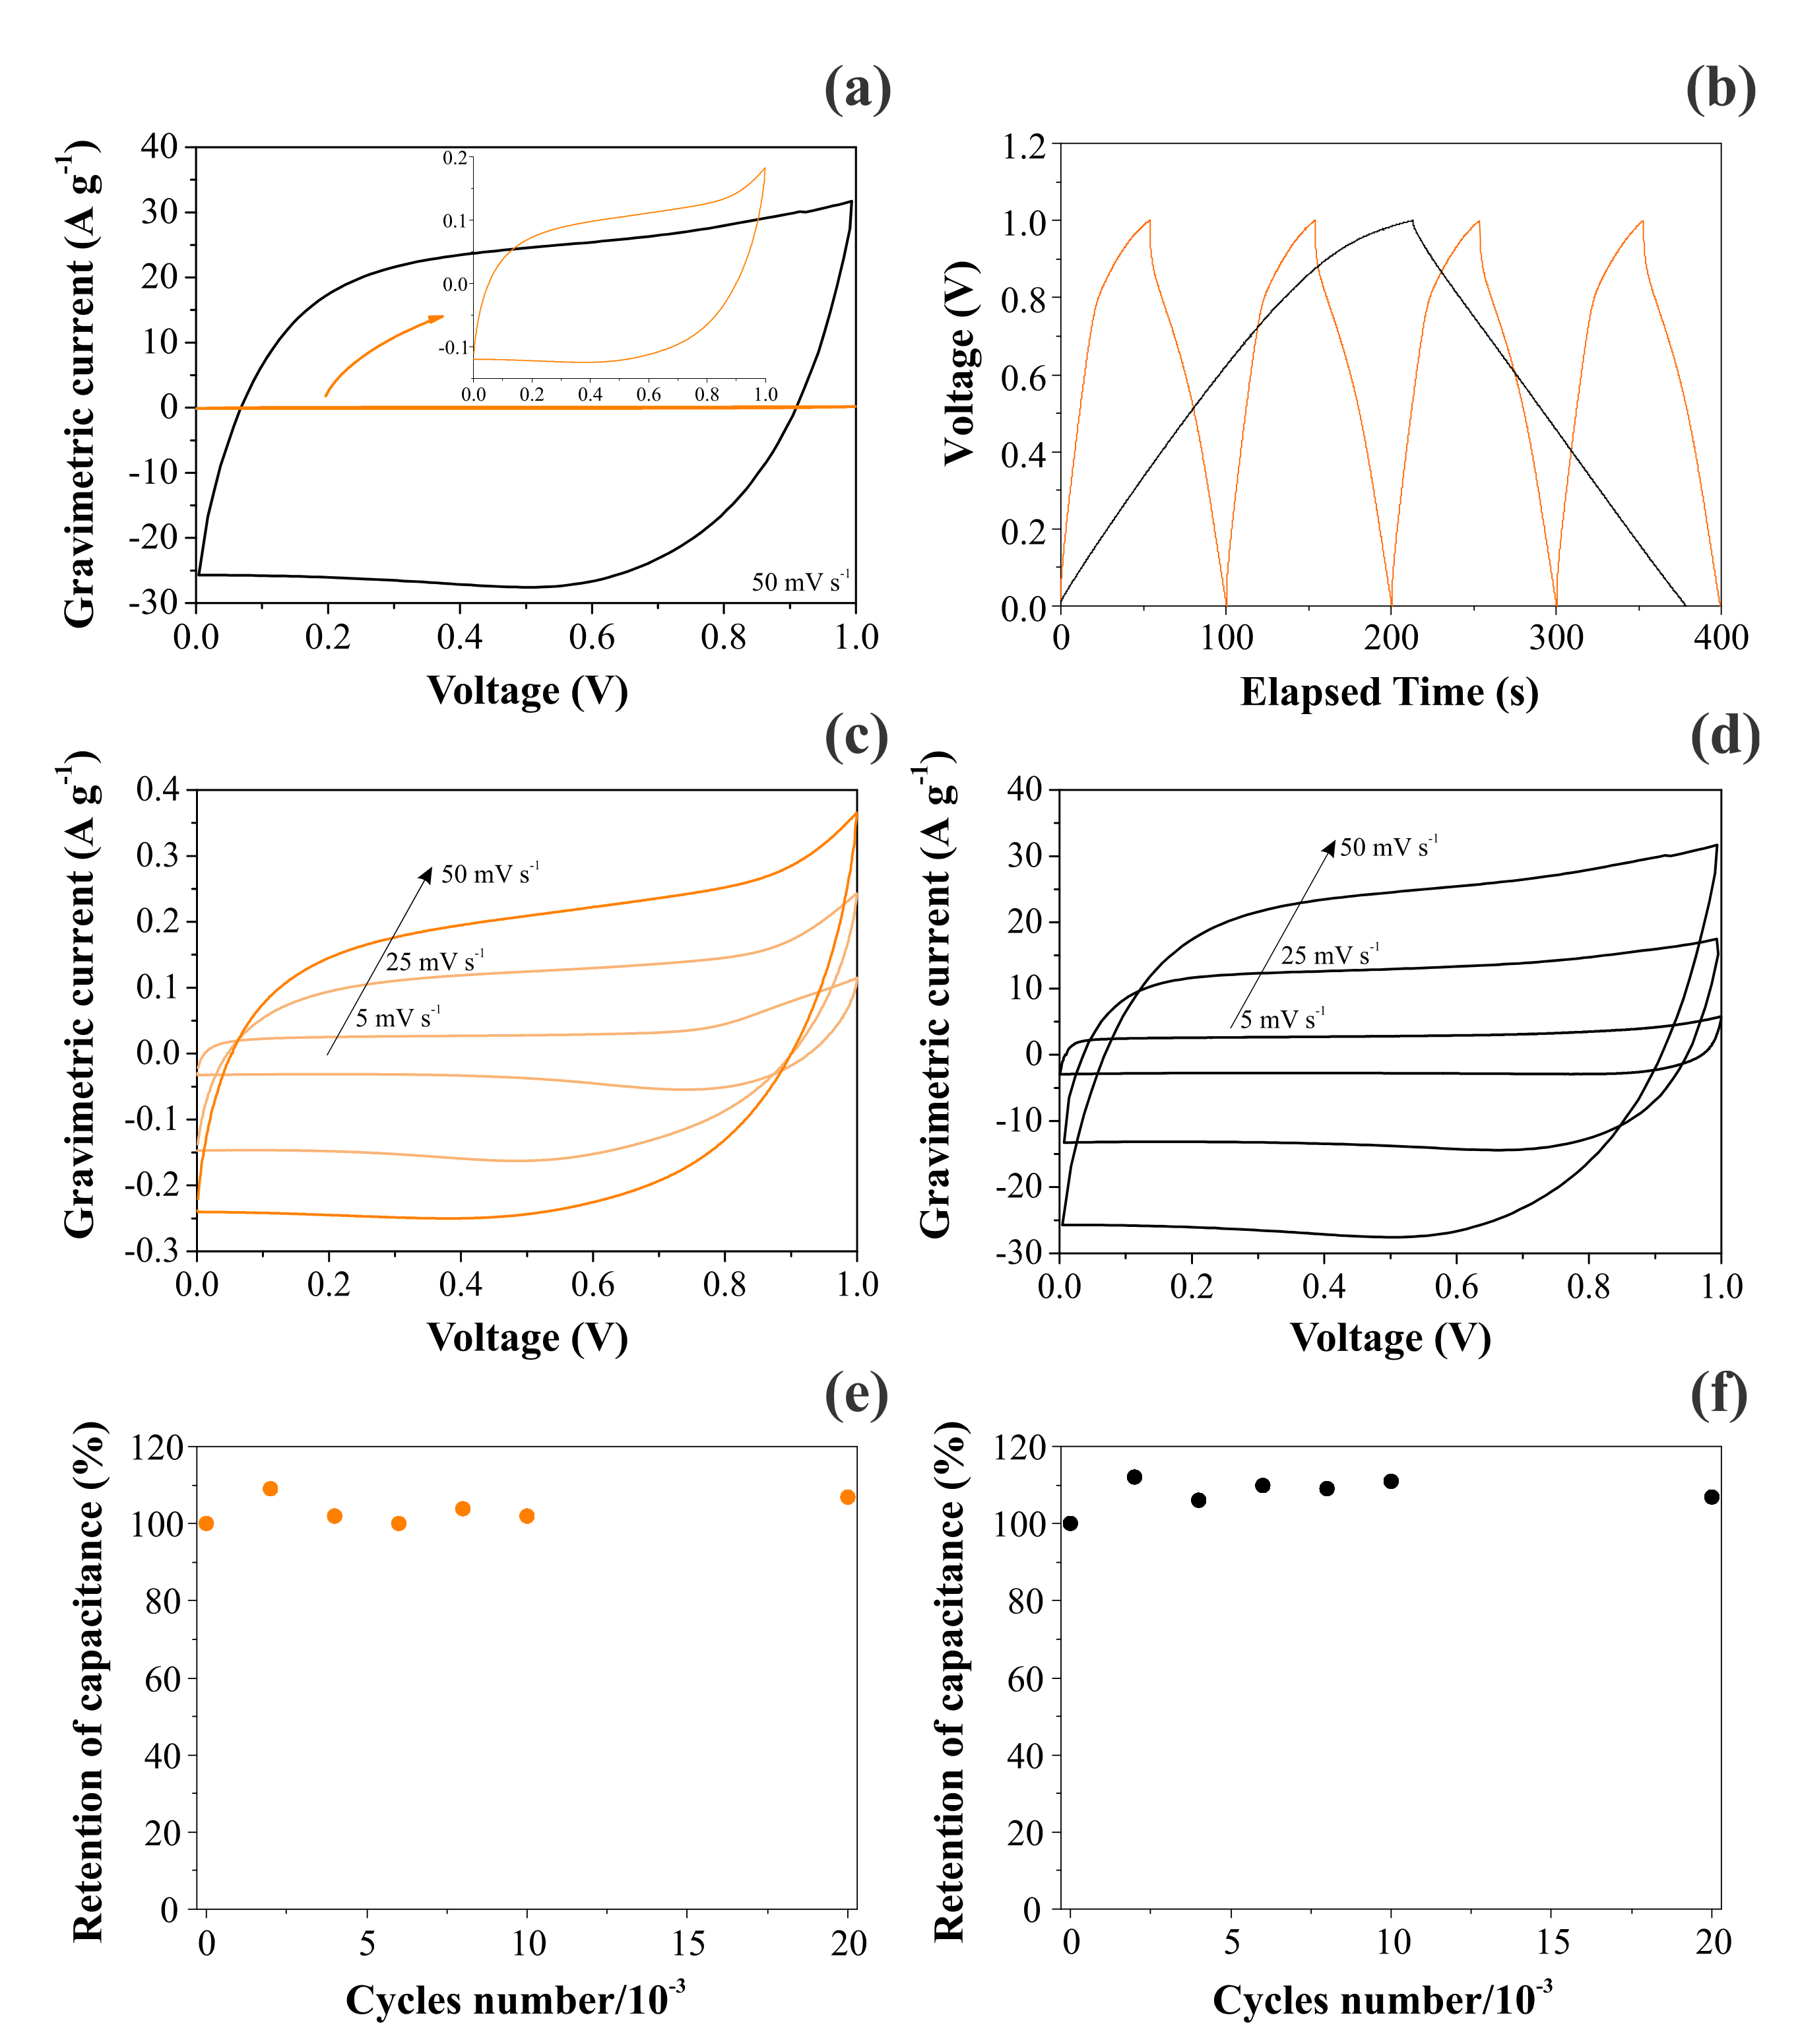
3.3. CV and GCD Analyses
4. Conclusions
Author Contributions
Funding
Institutional Review Board Statement
Informed Consent Statement
Data Availability Statement
Acknowledgments
Conflicts of Interest
References
- Da Silva, L.M.; Cesar, R.; Moreira, C.M.; Santos, J.H.; De Souza, L.G.; Pires, B.M.; Vicentini, R.; Nunes, W.; Zanin, H. Reviewing the fundamentals of supercapacitors and the difficulties involving the analysis of the electrochemical findings obtained for porous electrode materials. Energy Storage Mater. 2019, 27, 555–590. [Google Scholar] [CrossRef]
- Teles, J.J.; Faria, E.R.; Santos, J.H.; De Sousa, L.G.; Franco, D.V.; Nunes, W.G.; Zanin, H.; Da Silva, L.M. Supercapacitive properties, anomalous diffusion, and porous behavior of nanostructured mixed metal oxides containing Sn, Ru, and Ir. Electrochim. Acta 2018, 295, 302–315. [Google Scholar] [CrossRef]
- De Levie, R. Advances in Electrochemistry and Electrochemical Engineering; Interscience: New York, NY, USA, 1967. [Google Scholar]
- Randles, J.E.B. Kinetics of rapid electrode reactions. Discuss. Faraday Soc. 1947, 1, 11–19. [Google Scholar] [CrossRef]
- Grahame, D.C. Mathematical Theory of the Faradaic Admittance. J. Electrochem. Soc. 1952, 99, 370C–385C. [Google Scholar] [CrossRef]
- Sluyters, J.H.; Oomen, J.J.C. On the impedance of galvanic cells: II. Experimental verification. Recl. des Trav. Chim. des Pays-bas 1960, 79, 1101–1110. [Google Scholar] [CrossRef]
- Delahay, P. New Instrumental Methods in Electrochemistry; Interscience: New York, NY, USA, 1954. [Google Scholar]
- Nunes, W.G.; Da Silva, L.M.; Vicentini, R.; Freitas, B.G.; Costa, L.H.; Pascon, A.M.; Zanin, H. Nickel oxide nanoparticles supported onto oriented multi-walled carbon nanotube as electrodes for electrochemical capacitors. Electrochim. Acta 2018, 298, 468–483. [Google Scholar] [CrossRef]
- Nunes, W.G.; Vicentini, R.; Freitas, B.G.; Oliveira, F.E.; Marque, A.M.P.; Filho, R.M.; Doubek, G.; Da Silva, L.M.; Zanin, H. Pseudo-capacitive behavior of multi-walled carbon nanotubes decorated with nickel and manganese (hydr)oxides nanoparticles. J. Energy Storage 2020, 31, 101583. [Google Scholar] [CrossRef]
- Vicentini, R.; Nunes, W.; Freitas, B.G.; Da Silva, L.M.; Soares, D.M.; Cesar, R.; Rodella, C.B.; Zanin, H. Niobium pentoxide nanoparticles @ multi-walled carbon nanotubes and activated carbon composite material as electrodes for electrochemical capacitors. Energy Storage Mater. 2019, 22, 311–322. [Google Scholar] [CrossRef]
- Pires, B.M.; Nunes, W.G.; Freitas, B.G.; Oliveira, F.E.R.; Katic, V.; Rodella, C.; Da Silva, L.M.; Zanin, H. Characterization of porous cobalt hexacyanoferrate and activated carbon electrodes under dynamic polarization conditions in a sodium-ion pseudocapacitor. J. Energy Chem. 2020, 54, 53–62. [Google Scholar] [CrossRef]
- Nunes, W.G.; Miranda, A.N.; Freitas, B.; Vicentini, R.; Oliveira, A.C.; Doubek, G.; Freitas, R.G.; Da Silva, L.M.; Zanin, H. Charge-storage mechanism of highly defective NiO nanostructures on carbon nanofibers in electrochemical supercapacitors. Nanoscale 2021, 13, 9590–9605. [Google Scholar] [CrossRef]
- Minakshi, M.; Mitchell, D.R.G.; Munnangi, A.R.; Barlow, A.J.; Fichtner, M. New insights into the electrochemistry of magnesium molybdate hierarchical architectures for high performance sodium devices. Nanoscale 2018, 10, 13277–13288. [Google Scholar] [CrossRef] [PubMed] [Green Version]
- Huang, Q.-A.; Li, Y.; Tsay, K.-C.; Sun, C.; Yang, C.; Zhang, L.; Zhang, J. Multi-scale impedance model for supercapacitor porous electrodes: Theoretical prediction and experimental validation. J. Power Sources 2018, 400, 69–86. [Google Scholar] [CrossRef]
- Hamann, C.H.; Hamnett, A.; Vielstich, W. Electrochemistry, 2nd ed.; Wiley-VCH: Weinheim, Germany, 2007. [Google Scholar]
- Ates, M. Review study of electrochemical impedance spectroscopy and equivalent electrical circuits of conducting polymers on carbon surfaces. Prog. Org. Coatings 2011, 71, 1–10. [Google Scholar] [CrossRef]
- Mei, B.-A.; Munteshari, O.; Lau, J.; Dunn, B.; Pilon, L. Physical Interpretations of Nyquist Plots for EDLC Electrodes and Devices. J. Phys. Chem. C 2017, 122, 194–206. [Google Scholar] [CrossRef]
- Lasia, A. Electrochemical Impedance Spectroscopy and Its Applications; Springer: New York, NY, USA, 2014. [Google Scholar]
- Paasch, G.; Micka, K.; Gersdorf, P. Theory of the electrochemical impedance of macrohomogeneous porous electrodes. Electrochim. Acta 1993, 38, 2653–2662. [Google Scholar] [CrossRef]
- Srinivasan, V.; Weidner, J.W. Mathematical Modeling of Electrochemical Capacitors. J. Electrochem. Soc. 1999, 146, 1650–1658. [Google Scholar] [CrossRef]
- Bisquert, J.; Garcia-Belmonte, G.; Fabregat-Santiago, F.; Compte, A. Anomalous transport effects in the impedance of porous film electrodes. Electrochem. Commun. 1999, 1, 429–435. [Google Scholar] [CrossRef]
- De Levie, R. On porous electrodes in electrolyte solutions: I. Capacitance effects. Electrochim. Acta 1963, 8, 751–780. [Google Scholar] [CrossRef]
- Eikerling, M.; Kornyshev, A.A.; Lust, E. Optimized Structure of Nanoporous Carbon-Based Double-Layer Capacitors. J. Electrochem. Soc. 2005, 152, E24–E33. [Google Scholar] [CrossRef]
- Huang, J.; Zhang, J. Theory of Impedance Response of Porous Electrodes: Simplifications, Inhomogeneities, Non-Stationarities and Applications. J. Electrochem. Soc. 2016, 163, A1983–A2000. [Google Scholar] [CrossRef]
- Itagaki, M.; Suzuki, S.; Shitanda, I.; Watanabe, K.; Nakazawa, H. Impedance analysis on electric double layer capacitor with transmission line model. J. Power Sources 2007, 164, 415–424. [Google Scholar] [CrossRef]
- Huang, J.; Gao, Y.; Luo, J.; Wang, S.; Li, C.; Chen, S.; Zhang, J. Editors’ Choice—Review—Impedance Response of Porous Electrodes: Theoretical Framework, Physical Models and Applications. J. Electrochem. Soc. 2020, 167, 166503. [Google Scholar] [CrossRef]
- De Miranda, A.N.; Pardini, L.C.; Dos Santos, C.A.M.; Vieira, R. Evaluation of carbon fiber composites modified by in situ incorporation of carbon nanofibers. Mater. Res. 2011, 14, 560–563. [Google Scholar] [CrossRef] [Green Version]
- Malard, L.M.; Pimenta, M.A.; Dresselhaus, G.; Dresselhaus, M.S. Raman spectroscopy in graphene. Phys. Rep. 2009, 473, 51–87. [Google Scholar] [CrossRef]
- Dippel, B.; Jander, H.; Heintzenberg, J. NIR FT Raman spectroscopic study of flame soot. Phys. Chem. Chem. Phys. 1999, 1, 4707–4712. [Google Scholar] [CrossRef]
- Dietz, R.E.; Parisot, G.I.; Meixner, A.E. Infrared Absorption and Raman Scattering by Two-Magnon Processes in NiO. Phys. Rev. B 1971, 4, 2302–2310. [Google Scholar] [CrossRef]
- George, G.; Anandhan, S. Synthesis and characterisation of nickel oxide nanofibre webs with alcohol sensing characteristics. RSC Adv. 2014, 4, 62009–62020. [Google Scholar] [CrossRef]
- Mironova-Ulmane, N.; Kuzmin, A.; Steins, I.; Grabis, J.; Sildos, I.; Pärs, M. Raman scattering in nanosized nickel oxide NiO. J. Phys. Conf. Ser. 2007, 93, 012039. [Google Scholar] [CrossRef]
- Ramachandran, H.; Jahanara, M.M.; Nair, N.M.; Swaminathan, P. Metal oxide heterojunctions using a printable nickel oxide ink. RSC Adv. 2020, 10, 3951–3959. [Google Scholar] [CrossRef]
- Silva, T.A.; Zanin, H.; Saito, E.; Medeiros, R.A.; Vicentini, F.C.; Corat, E.J.; Fatibello-Filho, O. Electrochemical behaviour of vertically aligned carbon nanotubes and graphene oxide nanocomposite as electrode material. Electrochim. Acta 2014, 119, 114–119. [Google Scholar] [CrossRef]
- Upadhyay, G.; Devi, T.G. Raman spectroscopic study of polar aprotic molecule and its molecular associations with chemical and isotopic solvents: Comparative study with quantum-chemical calculations. J. Mol. Liq. 2014, 197, 263–271. [Google Scholar] [CrossRef]
- Nunes, W.G.; Pires, B.M.; Oliveira, F.; de Marque, A.M.; Cremasco, L.F.; Vicentini, R.; Doubek, G.; Da Silva, L.M.; Zanin, H. Study of the aging process of nanostructured porous carbon-based electrodes in electrochemical capacitors filled with aqueous or organic electrolytes. J. Energy Storage 2020, 28, 101249. [Google Scholar] [CrossRef]
- XPS Simplified—Nickel, Thermo Fish. Sci. (n.d.). Available online: https://xpssimplified.com/elements/nickel.php (accessed on 15 January 2021).
- Khomenko, V.; Raymundo-Piñero, E.; Frackowiak, E.; Béguin, F. High-voltage asymmetric supercapacitors operating in aqueous electrolyte. Appl. Phys. A 2005, 82, 567–573. [Google Scholar] [CrossRef]
- Dupuis, A. The catalyst in the CCVD of carbon nanotubes—A review. Prog. Mater. Sci. 2005, 50, 929–961. [Google Scholar] [CrossRef]
- Bisquert, J. Influence of the boundaries in the impedance of porous film electrodes. Phys. Chem. Chem. Phys. 2000, 2, 4185–4192. [Google Scholar] [CrossRef]
- Gharbage, B.; Mandier, F.; Lauret, H.; Roux, C.; Pagnier, T. Electrical properties of La0.5Sr0.5MnO3 thin films. Solid State Ionics 1995, 82, 85–94. [Google Scholar] [CrossRef]
- Lokhande, C.D.; Dubal, D.P.; Joo, O.-S. Metal oxide thin film based supercapacitors. Curr. Appl. Phys. 2011, 11, 255–270. [Google Scholar] [CrossRef]
- Pell, W.G.; E Conway, B. Analysis of power limitations at porous supercapacitor electrodes under cyclic voltammetry modulation and dc charge. J. Power Sources 2001, 96, 57–67. [Google Scholar] [CrossRef]
- Granqvist, C. Handbook of Inorganic Electrochromic Materials; Elsevier BV: Amsterdam, The Netherlands, 1995. [Google Scholar]
- Krishna, M.V.R.; Friesner, R.A. Quantum confinement effects in semiconductor clusters. J. Chem. Phys. 1991, 95, 8309–8322. [Google Scholar] [CrossRef]
- Wehrens-Dijksma, M.; Notten, P. Electrochemical Quartz Microbalance characterization of Ni(OH)2-based thin film electrodes. Electrochim. Acta 2006, 51, 3609–3621. [Google Scholar] [CrossRef]
- Faria, I.; Torresi, R.M.; Gorenstein, A. Electrochemical intercalation in NiOx thin films. Electrochim. Acta 1993, 38, 2765–2771. [Google Scholar] [CrossRef]
- MacArthur, D.M. The Proton Diffusion Coefficient for the Nickel Hydroxide Electrode. J. Electrochem. Soc. 1970, 117, 729–733. [Google Scholar] [CrossRef]
- Decker, F.; Passerini, S.; Pileggi, R.; Scrosati, B. The electrochromic process in non-stoichiometric nickel oxide thin film electrodes. Electrochim. Acta 1992, 37, 1033–1038. [Google Scholar] [CrossRef]
- Sharma, P.; Sundaram, M.M.; Watcharatharapong, T.; Jungthawan, S.; Ahuja, R. Tuning the Nanoparticle Interfacial Properties and Stability of the Core–Shell Structure in Zn-Doped NiMoO4@AWO4. ACS Appl. Mater. Interfaces 2021, 13, 56116–56130. [Google Scholar] [CrossRef] [PubMed]
- Mott, N.F.; Davis, E.A.; Weiser, K. Electronic Processes in Non-Crystalline Materials. Phys. Today 1972, 25, 55. [Google Scholar] [CrossRef]
- Palenskis, V. Drift Mobility, Diffusion Coefficient of Randomly Moving Charge Carriers in Metals and Other Materials with Degenerated Electron Gas. World J. Condens. Matter Phys. 2013, 03, 73–81. [Google Scholar] [CrossRef] [Green Version]
- Garcia-Belmonte, G.; Bisquert, J.; Pereira, E.C.; Fabregat-Santiago, F. Switching behaviour in lightly doped polymeric porous film electrodes. Improving distributed impedance models for mixed conduction conditions. J. Electroanal. Chem. 2001, 508, 48–58. [Google Scholar] [CrossRef]
- Barsoukov, E.; Macdonald, J.R. Impedance Spectroscopy: Theory, Experiment and Applications, 2nd ed.; Wiley-Interscience: Hoboken, New Jersey, USA, 2005. [Google Scholar]
- Orazem, M.E.; Tribollet, B. Electrochemical Impedance Spectroscopy; Wiley: Hoboken, New Jersey, USA, 2008. [Google Scholar]
- Bockris, J.O.M.; Reddy, A.K.N.; Gamboa-Aldeco, M. Modern Electrochemistry 2A: Fundamentals of Electrodics, 2nd ed.; Kluwer Academic/Plenum Publishers: New York, USA, 2000. [Google Scholar]
- Fantini, M.; Gorenstein, A. Electrochromic nickel hydroxide films on transparent/conducting substrates. Sol. Energy Mater. 1987, 16, 487–500. [Google Scholar] [CrossRef]
- Trasatti, S. Electrodes of Conductive Metallic Oxides, Parts A and B; Elsevier: Amsterdam, The Netherlands, 1980. [Google Scholar]
- Brisse, A.-L.; Stevens, P.; Toussaint, G.; Crosnier, O.; Brousse, T. Ni(OH)2 and NiO Based Composites: Battery Type Electrode Materials for Hybrid Supercapacitor Devices. Materials 2018, 11, 1178. [Google Scholar] [CrossRef] [Green Version]
- Stoller, M.D.; Ruoff, R.S. Best practice methods for determining an electrode material’s performance for ultracapacitors. Energy Environ. Sci. 2010, 3, 1294–1301. [Google Scholar] [CrossRef]
- Deng, W.; Ji, X.; Chen, Q.; Banks, C.E. Electrochemical capacitors utilising transition metal oxides: An update of recent developments. RSC Adv. 2011, 1, 1171–1178. [Google Scholar] [CrossRef]
| Sample | Element | Functional Groups | B.E./eV |
|---|---|---|---|
| CNFs | C1s | C-C | 284.6 |
| C-OH | 285.6 | ||
| C=O | 287.2 | ||
| O-C=O | 288.8 | ||
| π–π* | 290.6 | ||
| O1s | C-O | 531.3 | |
| C=O | 533.0 | ||
| NiO@CNFs | Ni2p | NiO | 854.2 |
| NiO | 856.0 | ||
| Ni3+ | 861.1 | ||
| NiO(OH)2 | 864.6 | ||
| NiO | 872.8 | ||
| NiO | 875.0 | ||
| Ni3+ | 879.2 | ||
| NiO(OH)2 | 881.8 | ||
| C1s | C-C | 284.8 | |
| C-O-C | 286.0 | ||
| C=O | 287.8 | ||
| C-C=O | 289.6 | ||
| π–π* | 291.8 | ||
| O1s | Ni-O | 529.7 | |
| CO32− | 531.6 | ||
| C=O | 533.3 | ||
| H2O | 535.4 |
| Electrodes | RESR (Ω g) | Rionic (Ω g−1) | Qionic (F sn−1 g) | Relectronic (Ω g−1) | Qelectronic (F ss−1 g) | Qedl or Qpc * (F sβ−1 g−1) |
|---|---|---|---|---|---|---|
| CNFs | 0.21 | 3.48 × 10³ | 1.45 × 10⁻⁴ (n = 0.42) | 2.16 × 10² | 4.92 × 10⁻⁴ (s = 1.00) | 2.62 (β = 0.95) |
| NiO@CNFs | 0.04 | 4.32 × 10² | 2.22 × 10⁻⁷ (n = 0.92) | 1.11 × 10² | 3.02 × 10⁻³ (s = 0.98) | 5.36 × 10² (β = 0.96) |
| Electrode | fc(Z1)/s−1 | fc(Z2)/s−1 | τc(Z1)/s | τc(Z2)/s |
|---|---|---|---|---|
| CNFs | 0.81 (n = 0.42) | 1.50 (s = 1.00) | 1.25 (n = 0.42) | 0.67 (s = 1.00) |
| NiO@CNFs | 3.71 × 10³ (n = 0.92) | 0.49 (s = 0.98) | 2.70 × 10⁻⁴ (n = 0.92) | 2.06 (s = 0.98) |
| Conditions | NiO@ CNFs | CNFs |
|---|---|---|
| Single electrode | 2548 | 16 |
| Two electrodes | 637 | 4 |
Publisher’s Note: MDPI stays neutral with regard to jurisdictional claims in published maps and institutional affiliations. |
© 2022 by the authors. Licensee MDPI, Basel, Switzerland. This article is an open access article distributed under the terms and conditions of the Creative Commons Attribution (CC BY) license (https://creativecommons.org/licenses/by/4.0/).
Share and Cite
Nunes, W.G.; Pascon, A.M.; Freitas, B.; De Sousa, L.G.; Franco, D.V.; Zanin, H.; Da Silva, L.M. Electrochemical Behavior of Symmetric Electrical Double-Layer Capacitors and Pseudocapacitors and Identification of Transport Anomalies in the Interconnected Ionic and Electronic Phases Using the Impedance Technique. Nanomaterials 2022, 12, 676. https://doi.org/10.3390/nano12040676
Nunes WG, Pascon AM, Freitas B, De Sousa LG, Franco DV, Zanin H, Da Silva LM. Electrochemical Behavior of Symmetric Electrical Double-Layer Capacitors and Pseudocapacitors and Identification of Transport Anomalies in the Interconnected Ionic and Electronic Phases Using the Impedance Technique. Nanomaterials. 2022; 12(4):676. https://doi.org/10.3390/nano12040676
Chicago/Turabian StyleNunes, Willian G., Aline M. Pascon, Bruno Freitas, Lindomar G. De Sousa, Débora V. Franco, Hudson Zanin, and Leonardo M. Da Silva. 2022. "Electrochemical Behavior of Symmetric Electrical Double-Layer Capacitors and Pseudocapacitors and Identification of Transport Anomalies in the Interconnected Ionic and Electronic Phases Using the Impedance Technique" Nanomaterials 12, no. 4: 676. https://doi.org/10.3390/nano12040676
APA StyleNunes, W. G., Pascon, A. M., Freitas, B., De Sousa, L. G., Franco, D. V., Zanin, H., & Da Silva, L. M. (2022). Electrochemical Behavior of Symmetric Electrical Double-Layer Capacitors and Pseudocapacitors and Identification of Transport Anomalies in the Interconnected Ionic and Electronic Phases Using the Impedance Technique. Nanomaterials, 12(4), 676. https://doi.org/10.3390/nano12040676


