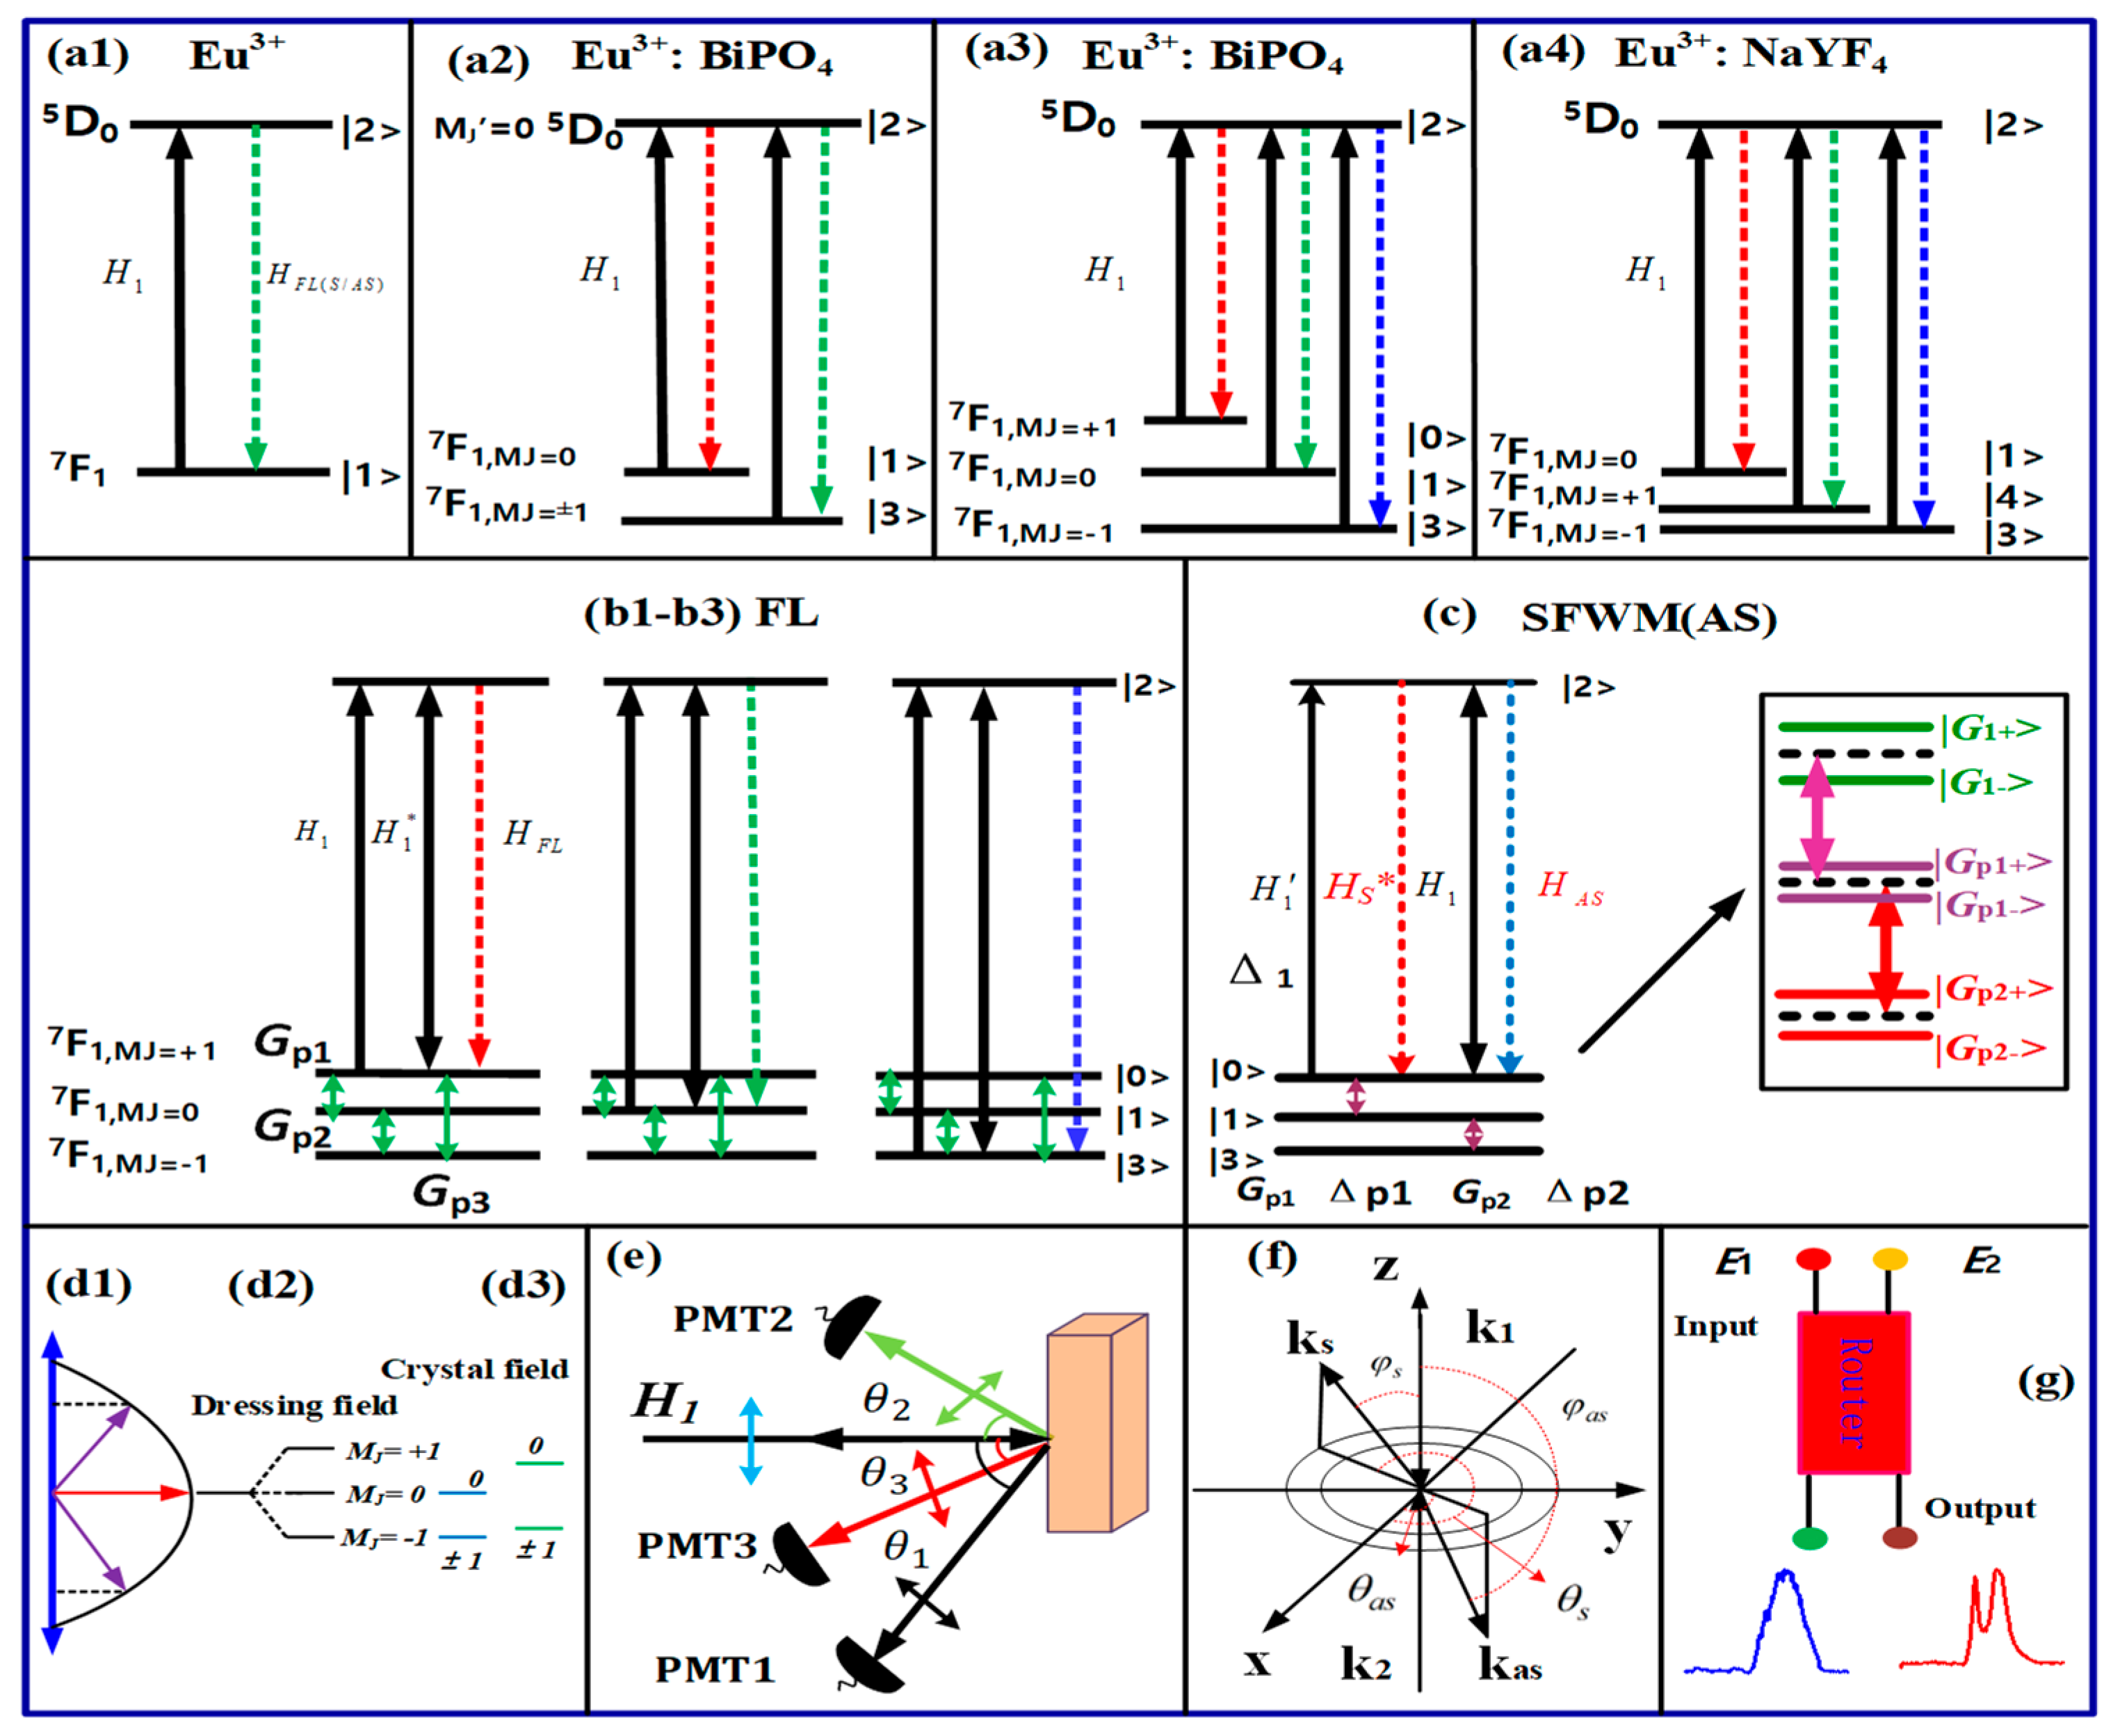
2.1. Theoretical Model
The crystal field (
E) splitting originates through a Stark field and demonstrates angular momentum precession around the
z-axis (
Figure 1(d1)). In general, angular momentum precession
causes splitting, which leads to the energy
. Here,
, and
is a z-direction projection that represents discrete energy, which causes level splitting (
mJ = ±1, 0). In
Figure 1(d3),
is a Landau factor for the crystal field, and
is the electric moment. The CF splitting angle
reflects the quantum numbers (
mJ).
Dressing field (H) splitting or static splitting without flat alignment are shown in
Figure 1(d2). Here, the intensity of the pure CF splitting level and the intensity of its dressing field CF level (
mJ = +1, 0, −1) become equal (J = 1). On the other hand, dressing field splitting produces angular precession
along the z-axis, as shown in
Figure 1(d1). This leads to energy splitting
and
, where
and
correspond to quantum numbers
,
is the electric moment and
is discrete energy, which causes the splitting of the dressing to assist CF levels in
Figure 1(d2). Moreover, the photon dressing field further produces dressings with bright- and dark-state sublevels or hyperfine levels (
Figure 1f). The internal splitting has two parts: one is the “density of state” (DOS), which is shown horizontally (
) and represents the x-direction projection, and the other one is energy or frequency (
), which is led by energy along the z-axis, as shown in
Figure 1(d1). Here, DOS is inversely proportional to the frequency splitting gap.
The transition dipole moment between
5D
0 and
7F
1 can be calculated as
, where (
= 0) indicates excited-state splitting and (
= −1, 0, +1) represents ground-state splitting. Similarly, the transition of phonons between sublevels can be calculated as
,
and
. The photon Rabi frequency
causes splitting of the magnetic dipole transition between
5D
0 and
7F
1 (
Figure 1a). Meanwhile, the phonon Rabi frequency
causes splitting among σ−,
and σ+ (
Figure 1c). The external field changes the phase of angular momentum, which produces magnetic torque
and further results in an intensity splitting (
Figure 2,
Figure 3,
Figure 4,
Figure 5 and
Figure 6).
By opening the
E1 field, the
level of the dressed second-order FL via perturbation chain
can be written as nested double dressing:
where “−” represents the
level, and 0 represents the
level. H is the laser magnetic field and
is the transverse decay rate between levels
and
. The lifetime of FL is
. The dipole moment is
for the photon, and it is
for the phonon. Here,
is a Landau factor for the dressing field,
is a constant and
i = 1, 2, 3. The |0〉 level of the dressed second-order FL via perturbation chain
can be written as nested double dressing:
By opening field
E1, the
level of the dressed third-order density matrix element for
ES (
) and
EAS (
) via perturbation chains
and
, respectively, can be written as
For the two dark states, the
level of the dressed third-order density matrix element for
ES (
) and
EAS (
) via perturbation chains is
and
, respectively, whose expressions can be written as follows:
When dressing splits the CF splitting levels into three levels (dressing energy level splitting), it is called dynamic splitting. The FL and SFWM of the form of the formula corresponding to the energy level are the same as in the static splitting, but the splitting mode is far different, which will not be described here.
By opening field
E1, the dressed second-order FL via perturbation chain
can be written as nested double dressing:
For the two dark states of the dressed third-order density matrix element for
ES (
) and
EAS (
) via perturbation chains
and
, respectively, the expression can be written as
where
represents the
level for the photon Rabi frequency and the phonon Rabi frequency, respectively. H is the laser magnetic field, and
is the transverse decay rate between levels
and
. The lifetime of FL is
. The phonon dressings
and
can be added.
2.2. Experimental Results
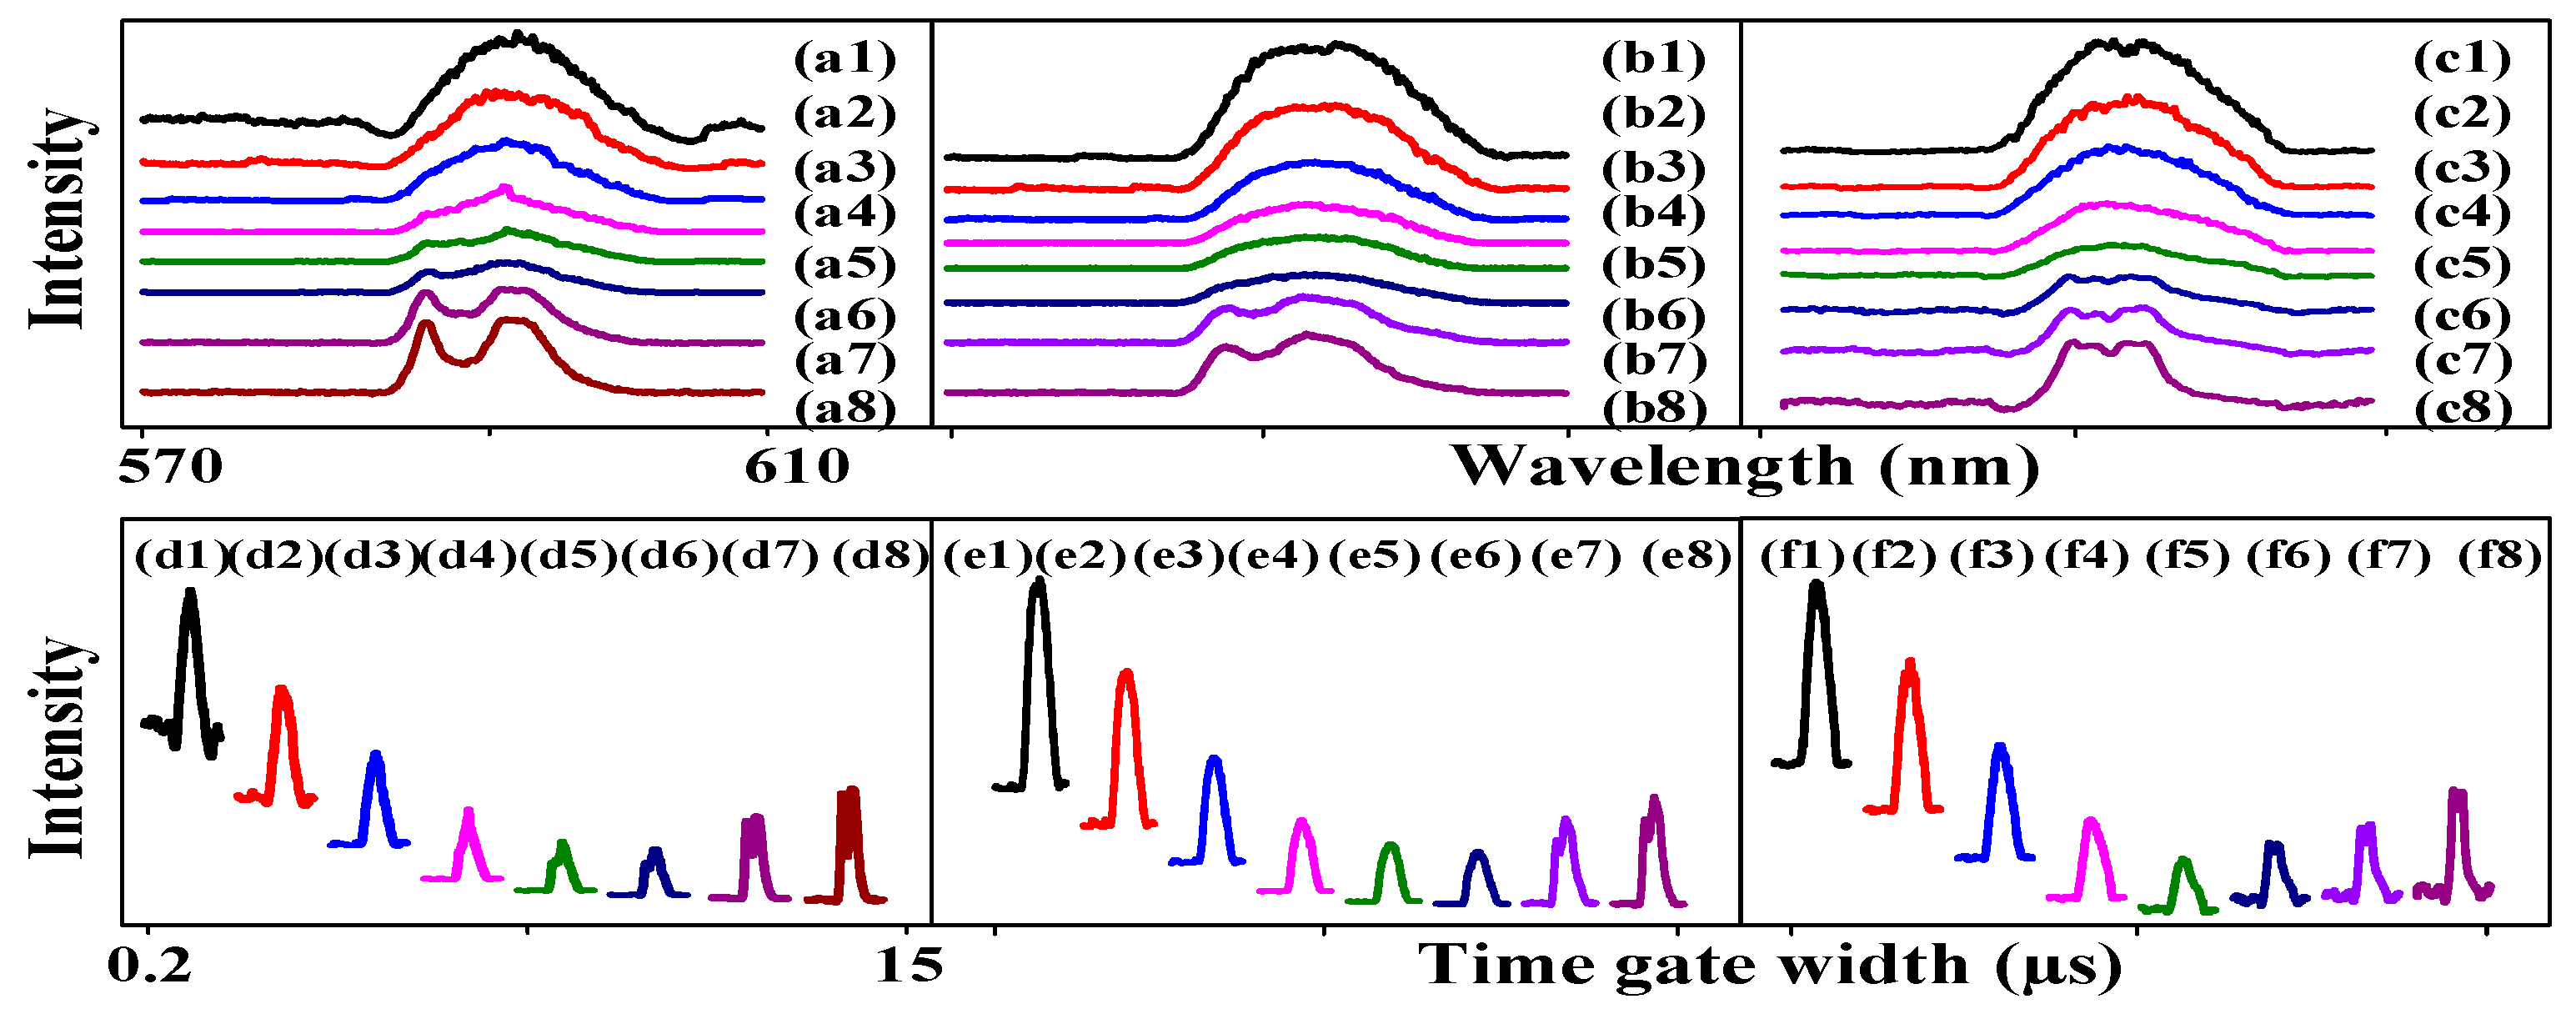
We demonstrate the FL and SFWM asymmetry splitting, respectively, realized by changing the time gate position, time gate width, PMTs angle, PMTs position and sample. Here, we performed FL to SFWM evolution following the time domain decay curve at different time gate positions and time gate widths, which determine the value of the transverse de-phase rate Γ from large to small.
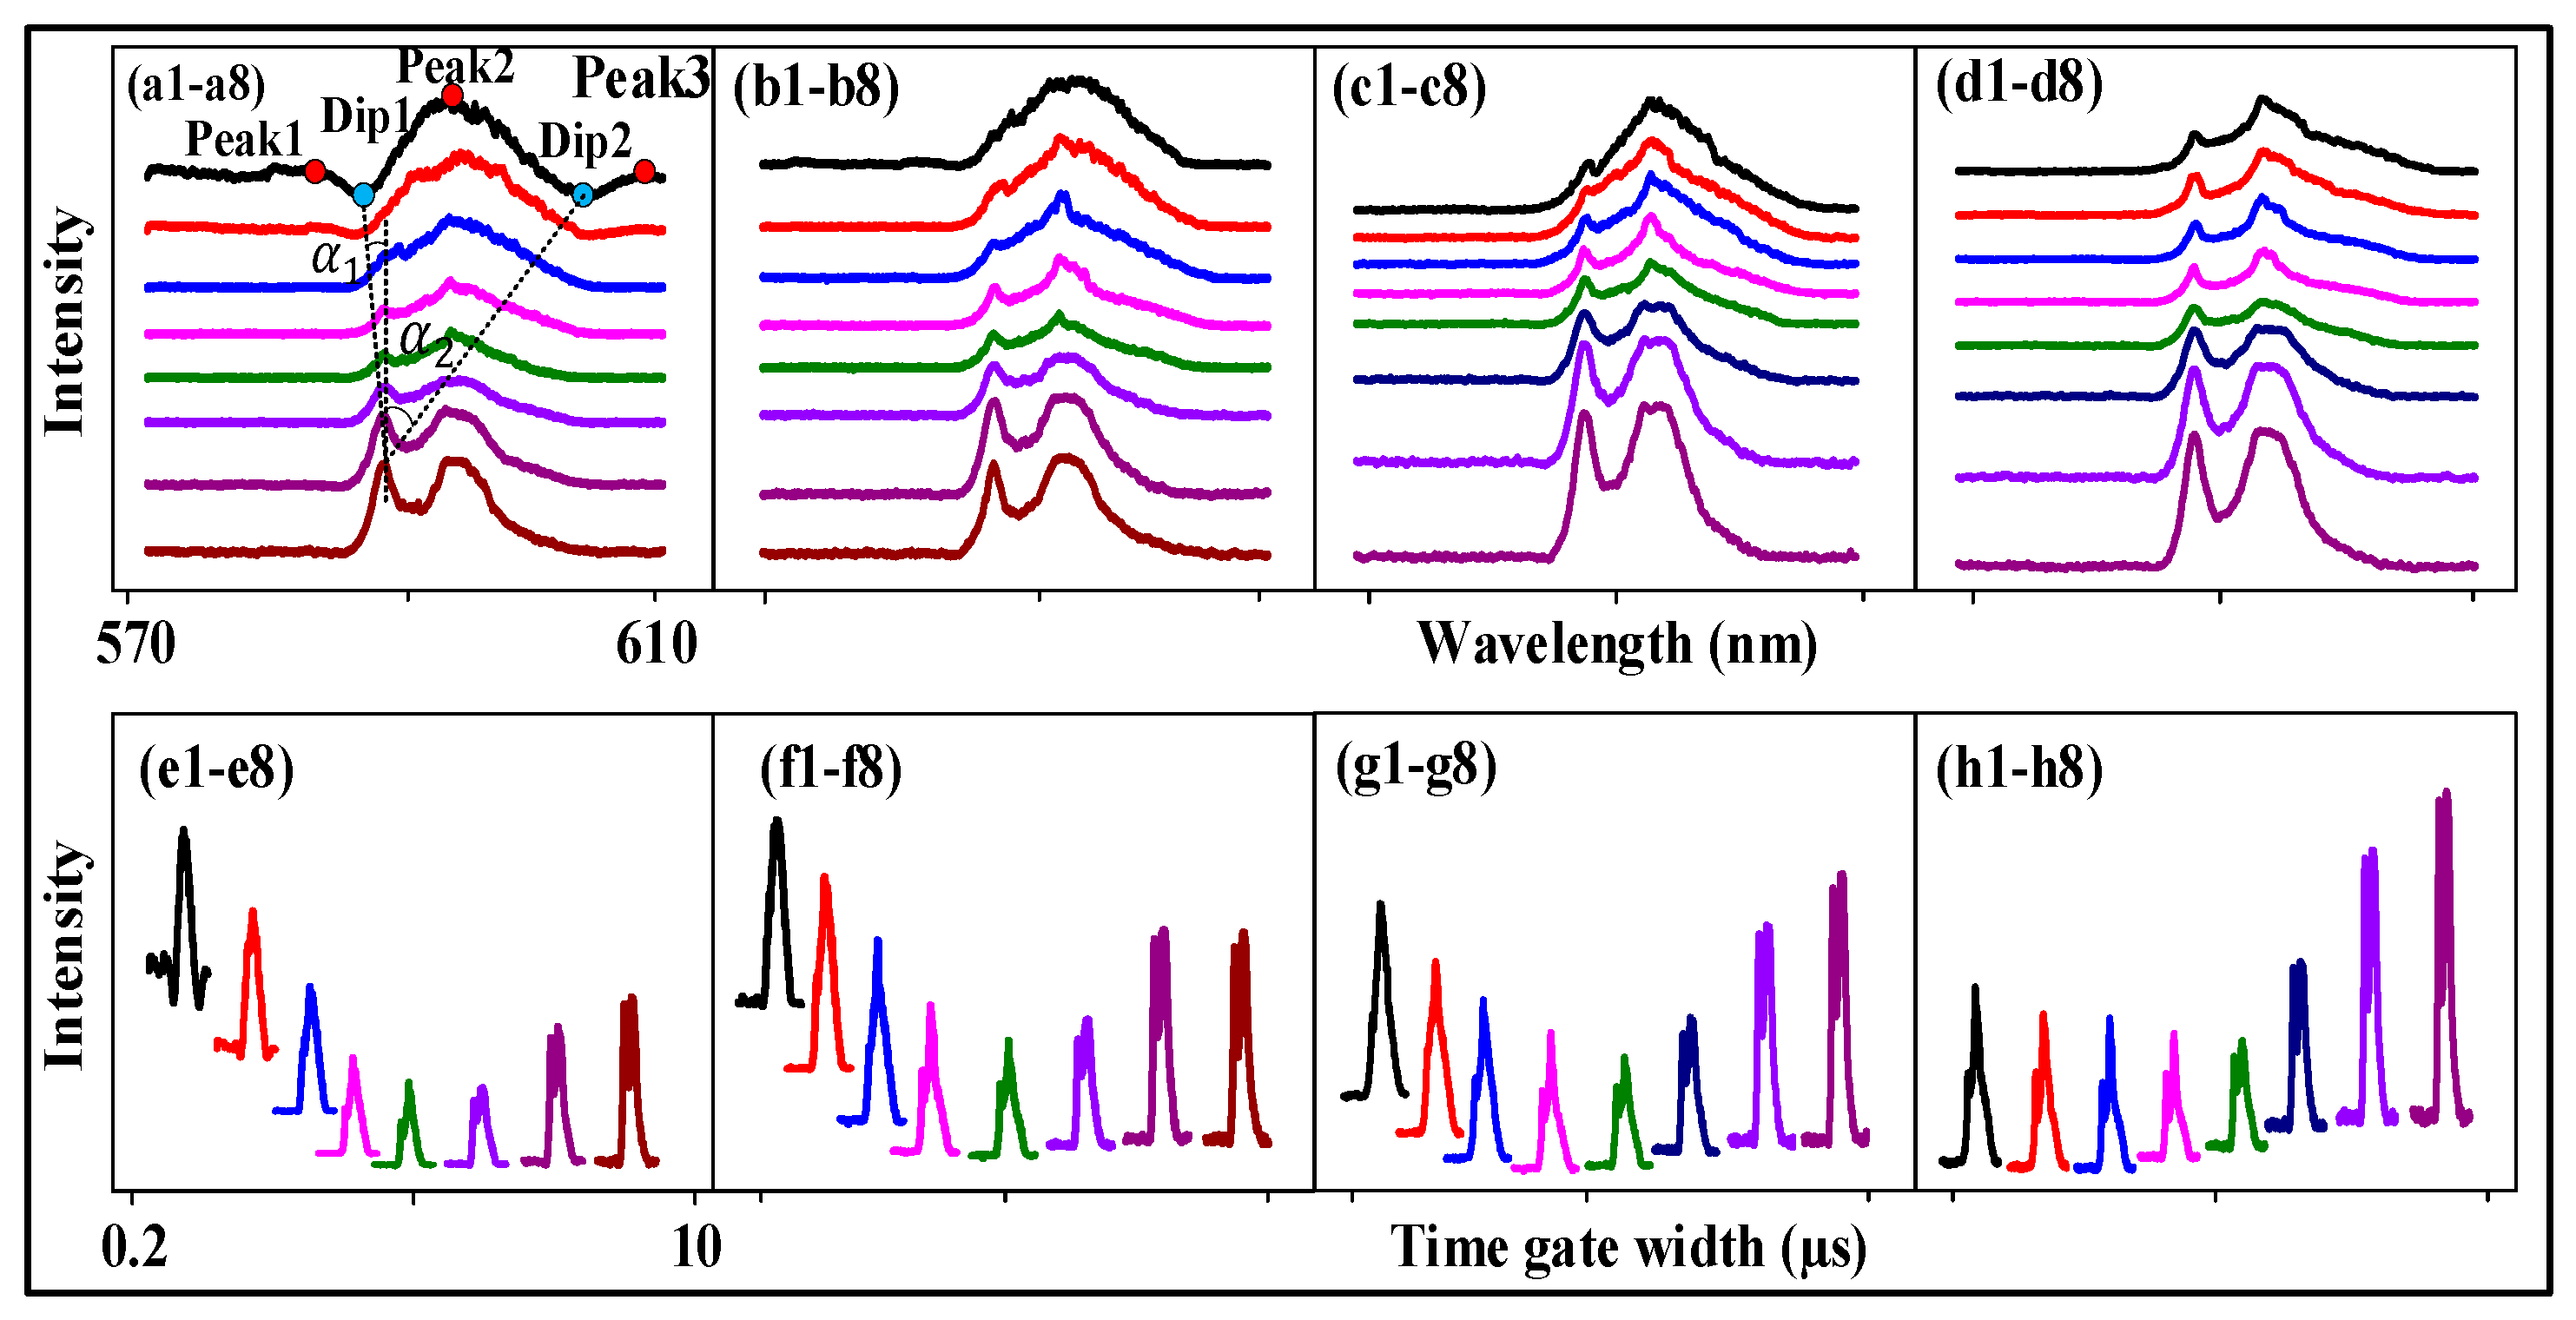
Figure 2 shows the asymmetry evolution of the spectral FL signal obtained from (12:1) of Eu
3+: BiPO
4 at PMT2 and a 300 K temperature by changing the time gate width. The two dips in the FL signal near the time gate position (700 ns) are shown in
Figure 2(a1). These can be explained using the two dressing terms
+
from Equations (1) and (2). The
7F
1 level is divided directly into m
j = −1, m
j = 0 and m
j = +1 under the CF effect of the BiPO
4 crystal and dressing (the dynamic splitting). Photon dressing leads to left dip1 (second-order splitting) in energy level
. Phonon dressing results in right dip2 (another form of splitting) in
. The left and right dips are symmetrical due to having the same dressing distribution. The intensity of dip1 and dip2 is 323 and 324, respectively. The dip intensity is basically equal due to FL asymmetry splitting. The slope of dip1 is
, where
. The slope of the
level is
in
Figure 2(a1–a8). The slope of dip2 is
, where
and
. The slope of the
level is 1.02. The distance between peak1 and peak2 is 10 nm. The distance between peak2 and peak3 is 14.5 nm.
Moreover, as the time gate width increases from
Figure 2(a1–a3), the two dips decrease. The dressing dips decrease due to the increase in
and
. When the time gate width increases from 1 µs to 10 µs nm in
Figure 2(a3–a8), respectively, the linewidth of the spectrum signal continuously decreases from 32 nm to 15 nm due to the strong CF splitting (the static splitting). Therefore, the FL asymmetry splitting can be controlled by the time gate width. Theoretically, the maximum of three emission peaks can be observed in Eu
3+: BiPO
4 due to three fine-structure energy levels. However, in our experiment, we observed only two peaks shown in
Figure 2(a6), suggesting that
7F
1,
MJ = ±1 and
7F
1,
MJ = 0 are indistinguishable and distinguishable, respectively.
Further, a broad peak is shown in
Figure 2(b1) due to the dominance of CF splitting. The two dressing dips disappeared from
Figure 2(a1–b1) due to the increase in the time gate position reducing
. The fluorescence asymmetry ratio is defined as
, where the
is the area of the peak from crystal field splitting. The
is the area of the dip/peak from the photon–phonon dressing. The FL asymmetry ratio is
from
Figure 2(b1–b8). The slope from the
level is
. The slope from the
level is
in
Figure 2(b1–b8). Therefore, the FL asymmetry splitting can be changed by changing the time gate position. The competitive relationship between photon dressing and CF splitting is shown in
Figure 2c,d. The right peak AT splitting is seen in
Figure 2(c8) due to the dominance of the CF splitting at a larger time gate width. The FL asymmetry ratio is 9.26% in
Figure 2c, and the slope of the
and
levels is
. The symmetry is shown in
Figure 2d, and thus, the slope on both sides is near infinity due to strong CF splitting.
Additionally, the connecting
Figure 2e corresponds to the overlapping
Figure 2a. When the time gate width is increased, the background signal decreases and then balances. This is because the disorder signal is dominant at a narrow time gate width (
Figure 2(e1–e5)). The frequency domain signal is averaged based on the boxcar time gate position. The more disordered the non-resonant signal, the more serious the mutual offset (out of phase), resulting in a background signal (
Figure 2(e1–e5)). The FL signal and the SFWM signal reach a state of competitive equilibrium (hybrid) in
Figure 2(e5–e8), so the background signal does not change.
Figure 2f–h shows a similar result to
Figure 2e.
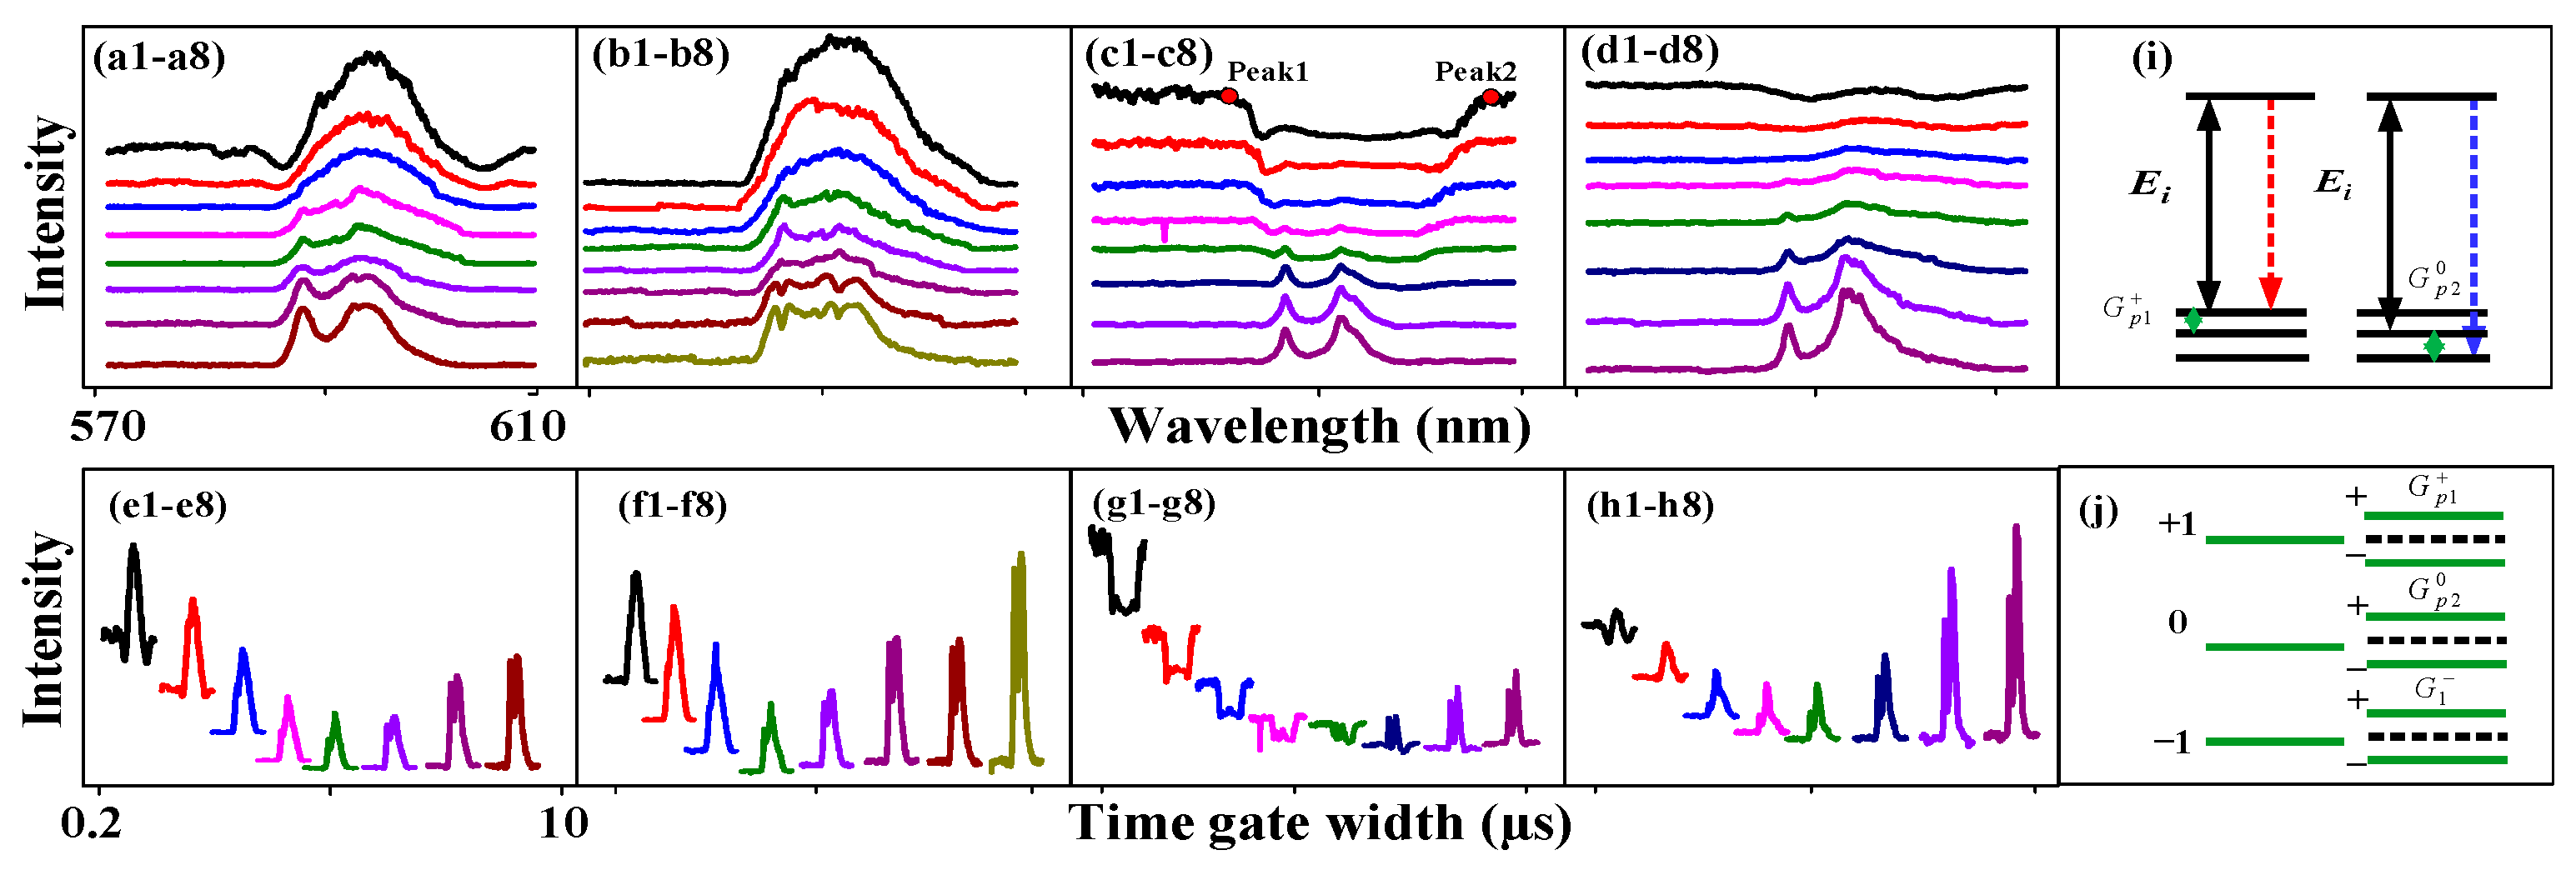
Next, we discuss FL and SFWM asymmetry splitting at the different PMT positions and angles.
Figure 3 shows the spectral signal of the FL obtained from the (12:1) sample of Eu
3+: BiPO
4, which was collected by PMT2 and PMT3 by changing the time gate width at a temperature of 300 K. We know that placing PMT1 at a small angle results in large splitting (
in
Figure 1d–f), and placing PMT2 at a large angle results in small splitting (
,
). The distance between peak1 and peak2 is 10.76 nm in
Figure 3a. The distance between peak2 and peak3 is 15.41 nm. The intensities of dip1 and dip2 are 495.75 and 496.61, respectively. The FL asymmetry ratio is 42.3%. The slopes of the
and
levels are −8.11 and 0.95, respectively. The PMT angle is reduced in
Figure 3b compared with
Figure 3a. The FL signal is not controlled by the PMT angle in
Figure 3(b1–b4). However, the more in-phase SFWM signals are collected at smaller angles. The dressing is not shown in the FL signal, while AT splitting is seen in the SFWM signal. This can be explained by nested double dressing
+
from Equations (3) and (4). In
Figure 3(b7), AT splitting is increased and decreased in the left and right peaks, respectively, when the time gate width increases. This shows that circular polarization and linear polarization have different effects on AT splitting. The FL asymmetry ratio is 28.18%. The slopes of the
and
levels are −9.248 and 0.994, respectively. These results suggest the presence of a routing phenomenon, and our proposed asymmetry spectral router model based on the dressing Rabi frequency splitting presented in
Figure 1g. The experiment setup presented in
Figure 1e is used to realize the asymmetry spectral router (
Figure 1g), where the Eu
3+: BiPO
4 crystal behaves as a router with the
E1 beam as ist input (a
in);
E2 is a control signal, and a
oft hethe outpft hethe router detected at PMTs. Here, we used the channel equalization ratio (
) to measure the de-multiplexing, where N corresponds to the number of peaks after splitting,
refers to the area of one peak after splitting, and
represents the splitting distance between the adjacent peaks, respectively. The channel equalization ratio for
Figure 3b was calculated as
P = 96.6%, which is a lot higher than the results proposed for other atomic-like media.
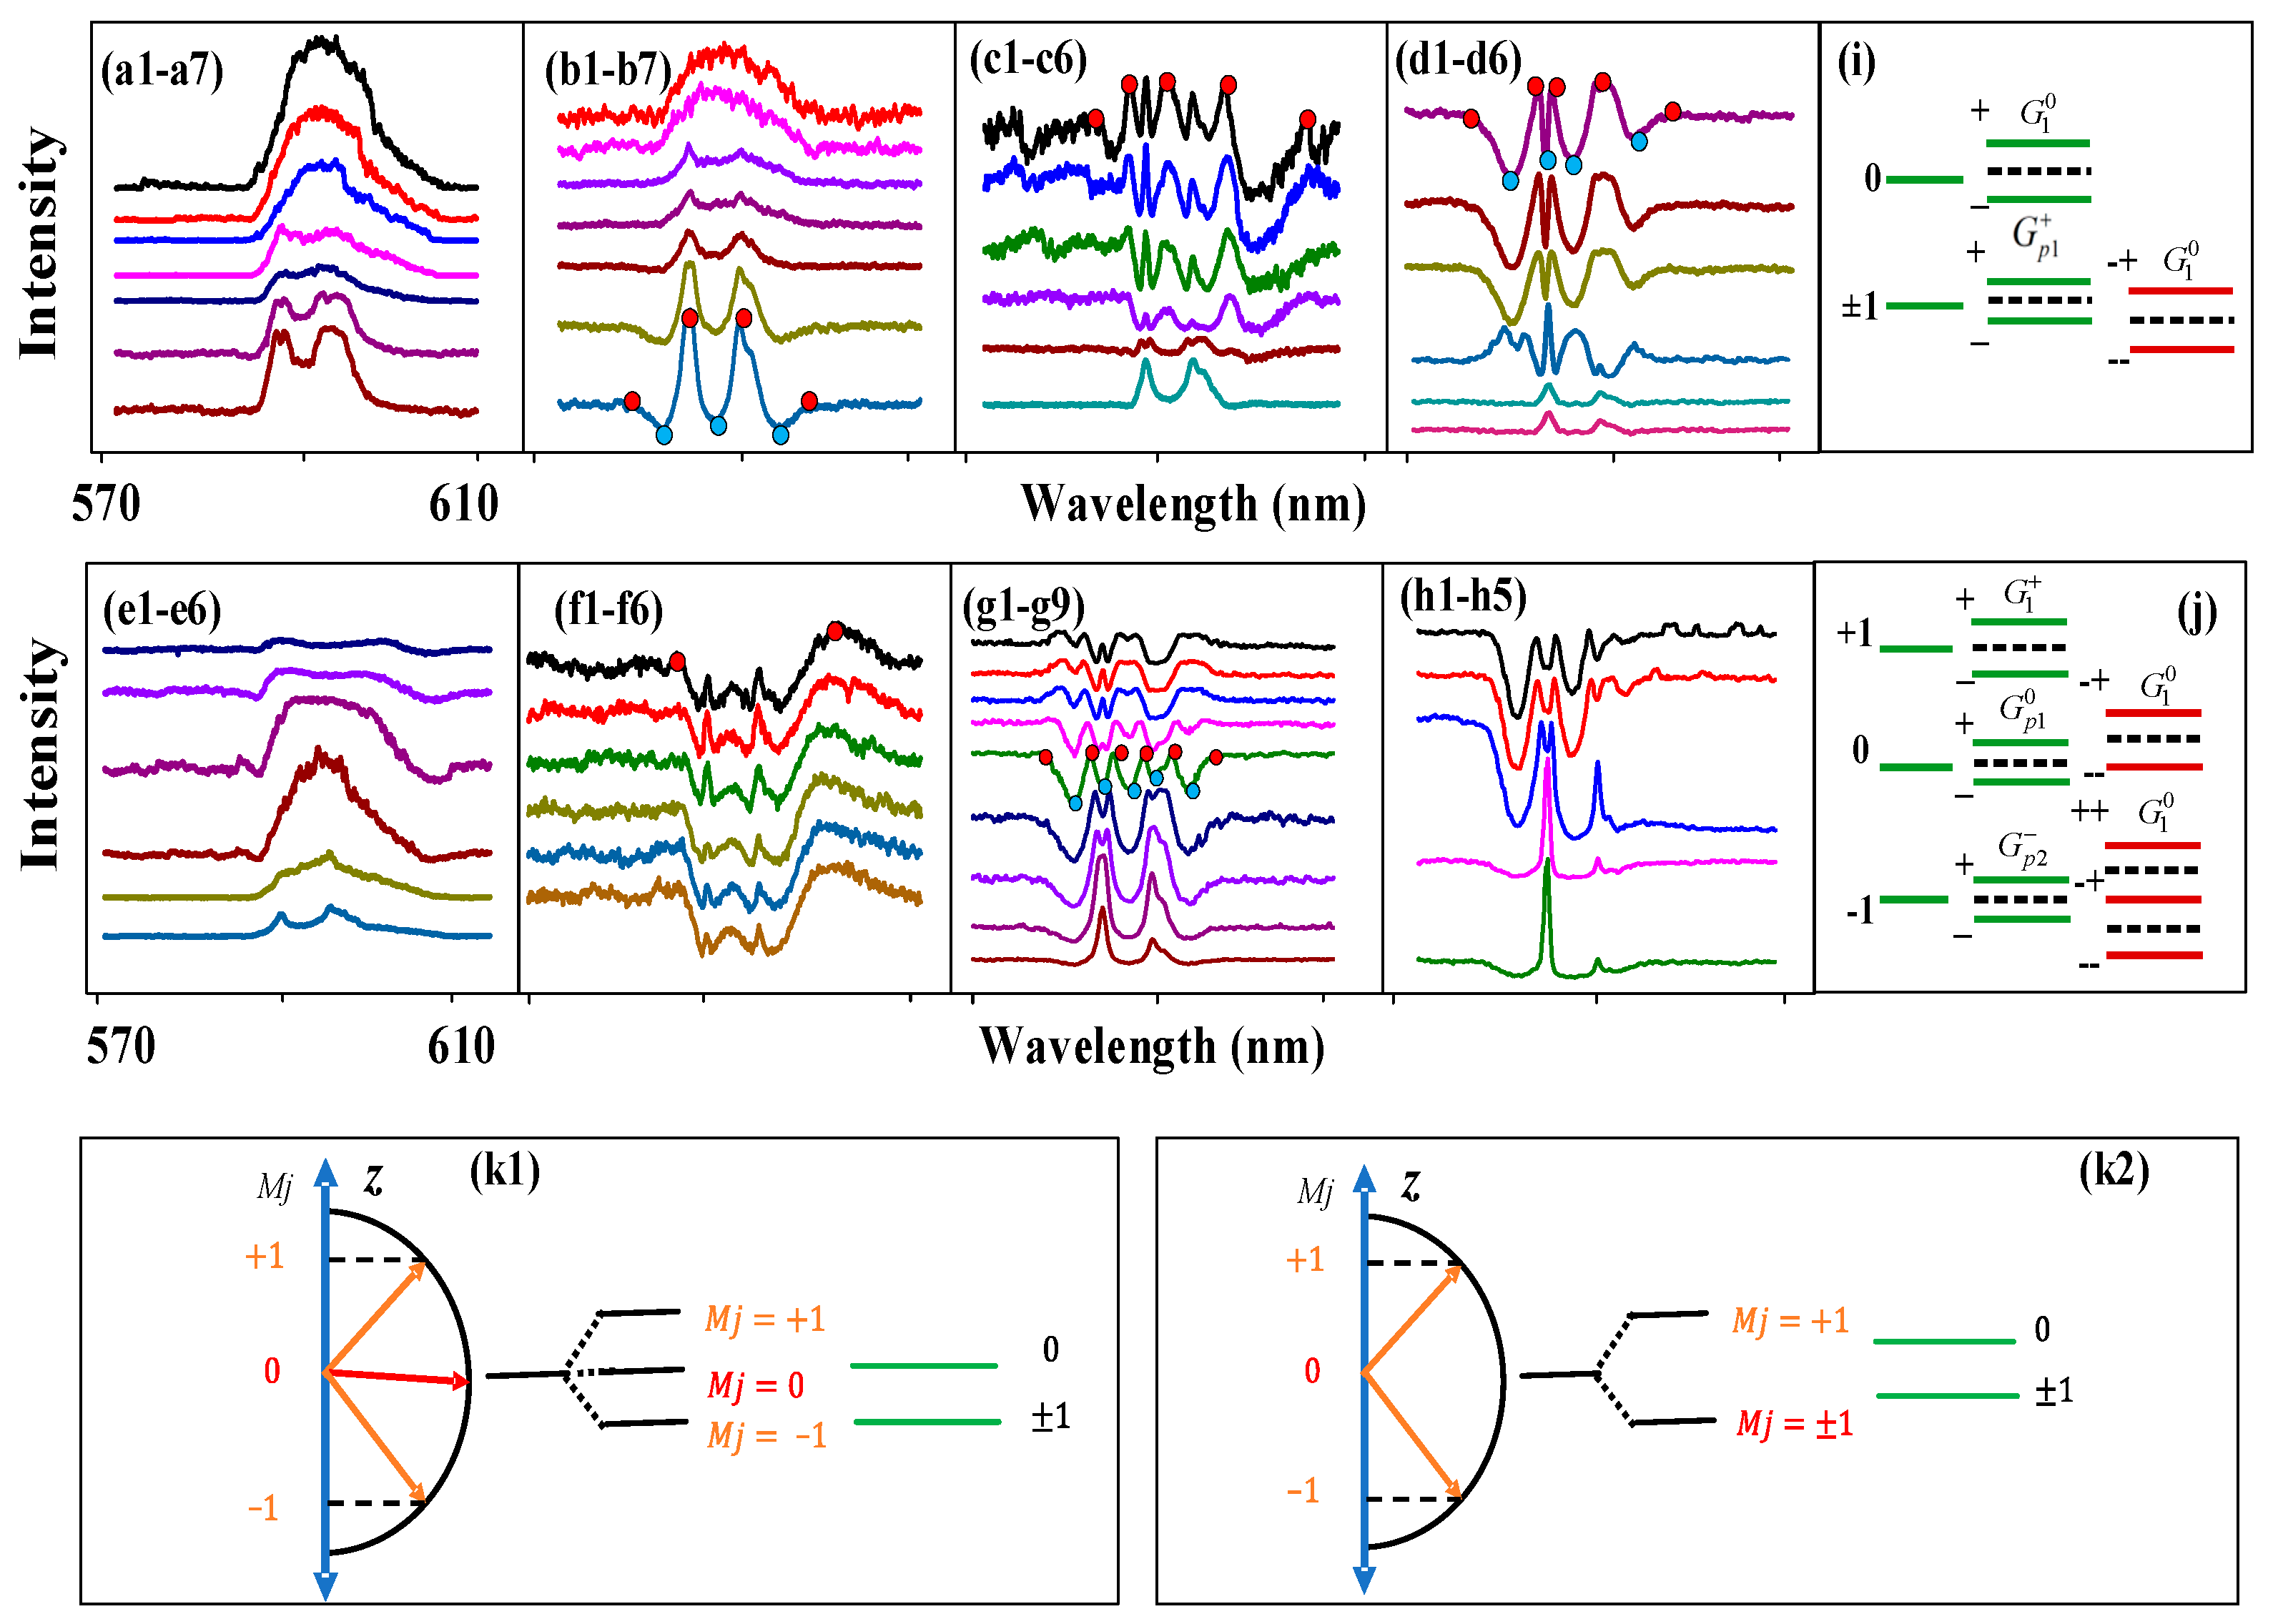
Figure 3.
The excitation spectral intensity signals obtained for the (12:1) sample of Eu3+: BiPO4 by changing the time gate widths when H1 was scanned from 570 nm to 610 nm at high power and a temperature of 300 K: (a) Changing time gate widths (200 ns, 500 ns, 1 µs, 2 µs, 3 µs, 5 µs, 8 µs, 10 µs) measured at PMT2 and time gate position = 600 ns. (b) The PMT2 angle is larger than (a). (c) The time gate widths are changed and measured at PMT3 and time gate position = 1 µs. (d) The PMT3 angle is larger than (c). The connecting (e–h) correspond to (a–d). (i) Energy level splitting induced by different phonon dressings; (j) energy level splitting representing asymmetry, induced by photon dressing, phonon1 and phonon2 dressing.
Moreover,
Figure 3c,d show a spectral signal at the 1 µs time gate position and near PMT3. We can show FL (
Figure 3(c4)) and SFWM (
Figure 3(c1)) asymmetry (same DOS) through evolution. The dressing dip is seen in
Figure 3(c1), which can be explained by the three nested dressings
+
+
in Equations (5) and (6). The coupling of the phonon1 dressing with the
level leads to the left dip in
Figure 3(c1) and the coupling of the phonon2 dressing with the
level leads to the right dip. The coupling of the photon dressing with the
level leads to the middle dip (
Figure 3i). The left and right dips are basically symmetrical, so the corresponding dressing distribution is the same. The dip depth ranged from 404 (
Figure 3(c1)) to 110 (
Figure 3(c4)); this is because
and
become small, and thus, the phonon dressing becomes small. The FL asymmetry ratio is 49.4% in
Figure 3c. The slopes of the
and
levels are −5.9 and 0.935, respectively. Similar to
Figure 3c, the FL asymmetry ratio is 11.99% in
Figure 3d due to photon–phonon dressing from Equation (7). The slopes of the
and
levels are 24.2 and 1.156, respectively. The FL asymmetry ratio in
Figure 3d is 13% due to the coupling of the one-photon dressing (
) with the
level (
Figure 3j). The slopes of
and
are −24.16 and 66.66, respectively. Therefore, the strong FL asymmetry splitting can be controlled by the small PMT angle due to the greater photon–phonon dressing. The SFWM asymmetry ratio is defined as
, where the
is the area of the peak from crystal field splitting. The
is the area of the multi-dips from the photon–phonon dressing. The
is about 32.2% from
Figure 3(c1–c8). Therefore, the SFWM is more sensitive to phonon dressing.
Further, the connecting
Figure 3e–h correspond to the overlapping
Figure 3a–d. It is also shown that the SWFM signal is dominant, and the background signal is stronger. The ratios of the maximum signal and the FL are 2515/672 (
Figure 3(e1–e5)), 2651/644 (
Figure 3(f1–f4)), 2651/103 (
Figure 3(g1–g5)) and 367/195 (
Figure 3(h1–h5)). The ratios of the maximum signal and the SWFM are 1808/672 (
Figure 3(e5–e8)), 644/460 (
Figure 3(f4–f8)), 456/103 (
Figure 3(g5–g8)) and 1813/367 (
Figure 3(h5–h8)).
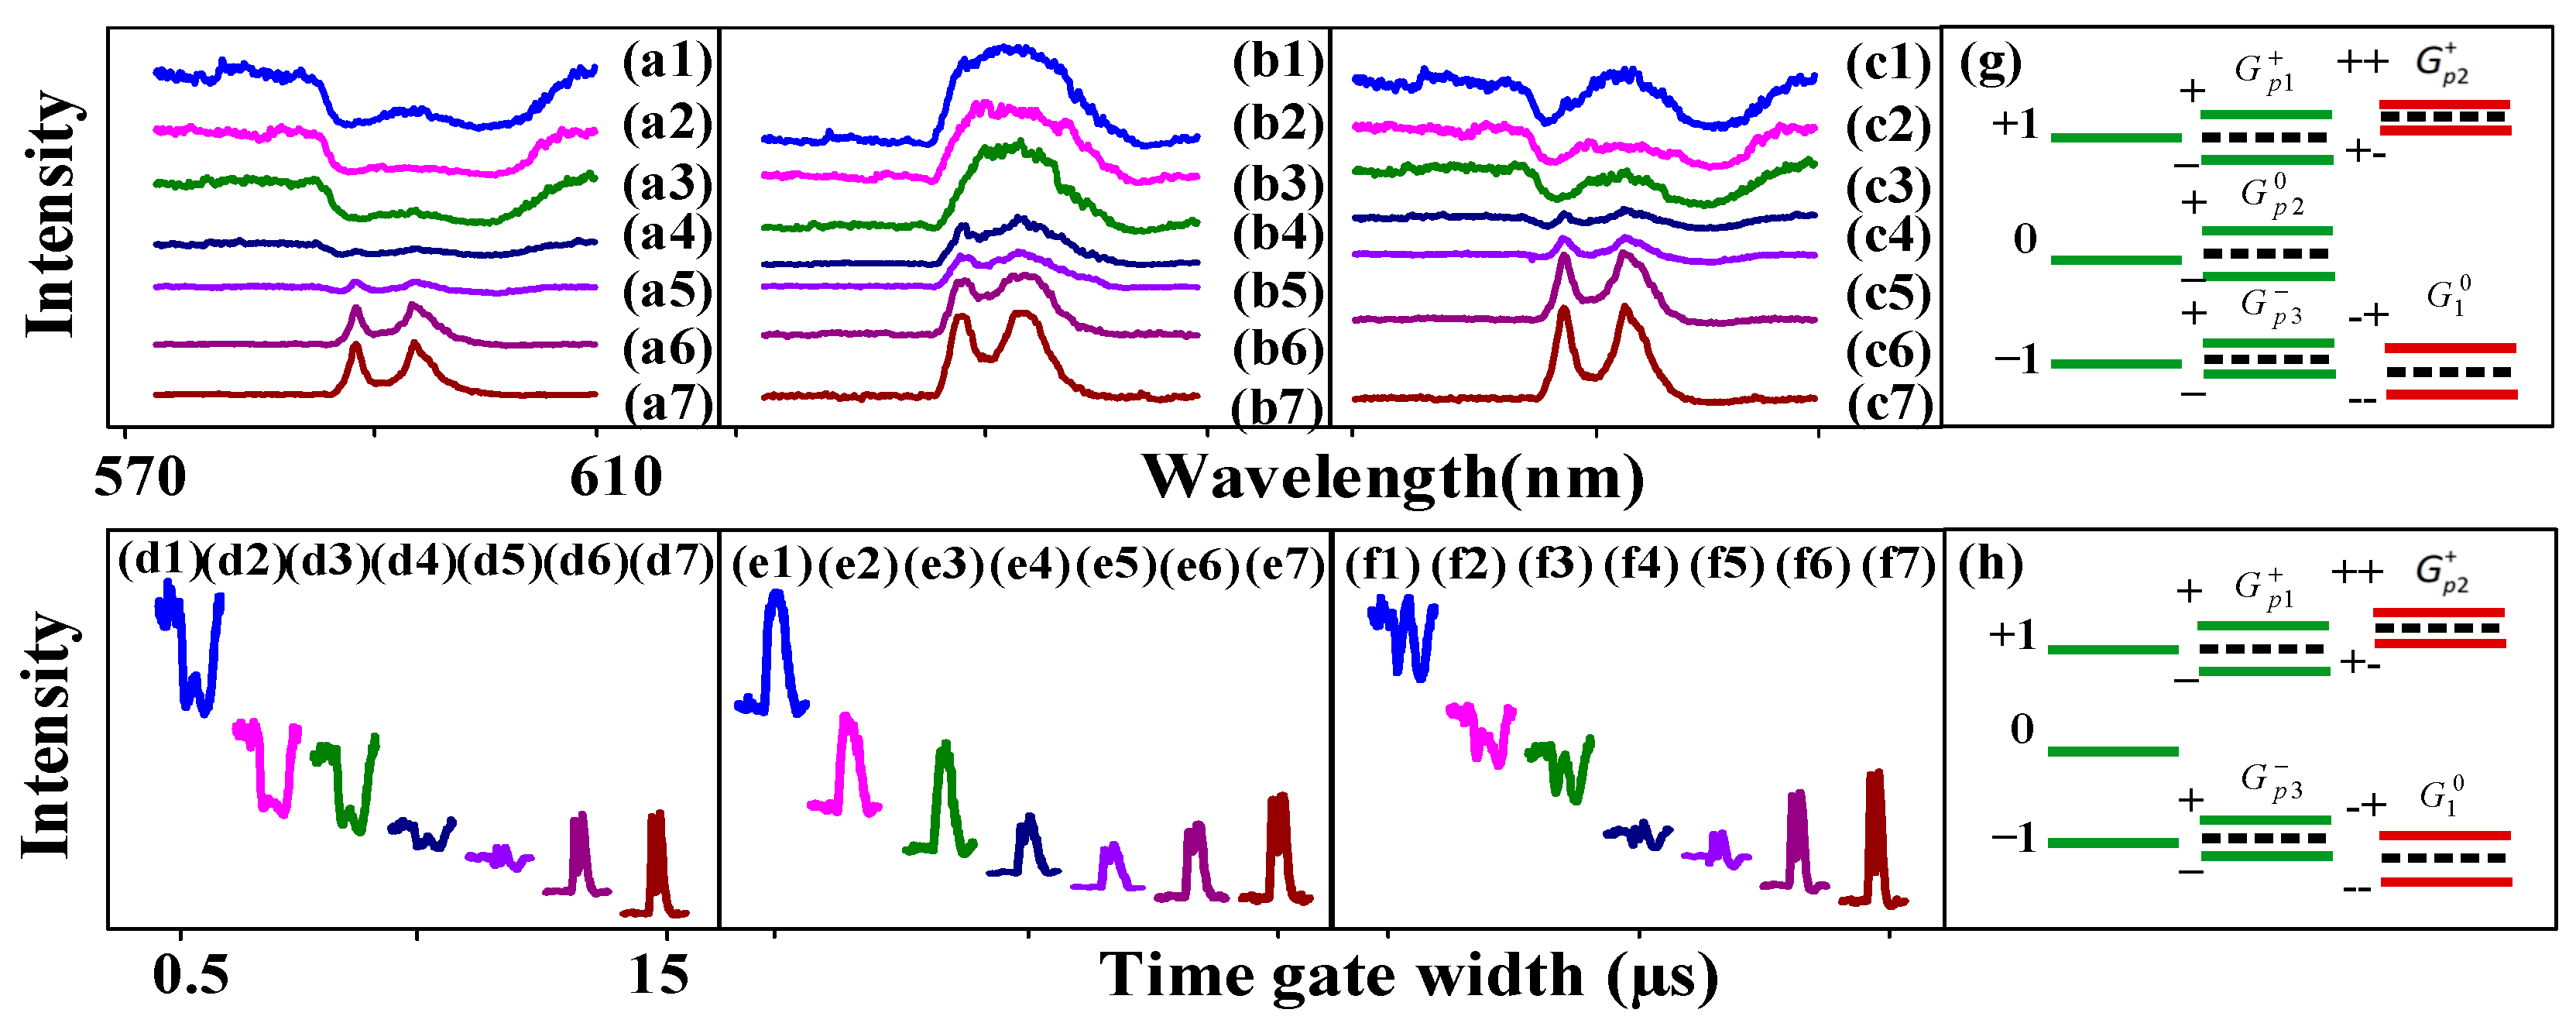
Next,
Figure 4 shows different FL/SFWM asymmetries splitting at different PMT positions. Under the same conditions, the dressing has a great impact on the FL signal (peak or dip) collected by changing the location of the PMT. The alignment of the dips in
Figure 4(a1) can be explained by the five photon–phonon1–phonon2 dressings
from Equations (3) and (4),
from Equations (5) and (6) and
from Equations (8) and (9) due to the PMT being located at a shorter distance (big
,
). When the depth of the dip is the same, if the dip linewidth is smoother, then the dressing is larger. Although the dip is flatter in
Figure 4(a1,a2), the depth of the dips decreases, so the dressing becomes weak. The distance between peak1 and peak2 is 26.3 nm. The FL asymmetry ratio is 48.86% in
Figure 4a. The slopes of the
and
levels are −17.54 and 1.11, respectively.
Figure 4.
The excitation spectral intensity signals obtained for the near (12:1) sample of Eu3+: BiPO4 by changing the time gate widths when H1 was scanned from 570 nm to 610 nm at 100 ns time gate position, high power and a temperature of 300 K: (a) Changing time gate widths (500 ns, 1 µs, 2 µs, 3 µs, 5 µs, 10 µs, 15 µs) measured at PMT1. (b) Changing time gate widths measured at PMT2. (c) Changing time gate widths measured at PMT3. The connecting (d–f) Correspond to (a–c), respectively. (g,h) Energy levels representing asymmetry induced by different dressings.
Further, a broad peak is seen in
Figure 4(b1) due to the dominance of CF splitting (small
,
). As the time gate width increases to 15 µs, the photon dressing becomes weak, and the CF splitting becomes strong. The FL asymmetry ratio is 26.38% in
Figure 4b. The slopes of the
and
levels (
Figure 4g) are −19.49 and 1.13, respectively. Similar to
Figure 3(a1), the two dips in
Figure 4(a1) are deep because there is less
. The distance between peak1 and peak2 is 9.97 nm. The distance between peak2 and peak3 is 15.77 nm. The two Fano dips resulting from the middle
(
) are shown in
Figure 4(c1). The FL asymmetry ratio is 45.82% in
Figure 4c. Therefore, the FL asymmetry splitting is strong at the near-PMT position due to the dominance of photon–phonon dressing. The slope of the
and
levels (
Figure 4h) are −10.67 and 1.185, respectively. The connecting
Figure 4d–f correspond to the overlapping
Figure 4a–c. The ratios of the maximum and minimum FL signal are 1240/202 (
Figure 4(d1–d5)), 1782/608 (
Figure 4(e1–e5)) and 994/277 (
Figure 4(f1–f5)). The ratios of the maximum and minimum SFWM signals are 1087/202 (
Figure 4(d5–d7)), 1566/608 (
Figure 4(e5–e7)) and 1683/277 (
Figure 4(f5–f7)).
Next, we discuss the different FL asymmetries splitting at different bandwidths and samples. The evolution of the FL signal obtained from different samples collected with the PMT2 and with changing time gate widths at a temperature of 300 K is shown in
Figure 5a. The time gate position is fixed at 500 ns. Similar to
Figure 2(a1), the distance between peak1 and peak2 is 10.76 nm. The distance between peak2 and peak3 is 15.41 nm. The FL asymmetry ratio is 43.98% in
Figure 5(a1) due to the presence of more phonon dressing (small
,
). The slopes of the
and
levels are −6.78 and 0.94, respectively. The FL asymmetry ratio is 31.69% in
Figure 5(b1). We obtained a stronger FL asymmetry splitting for (12:1) than for (6:1) Eu
3+: BiPO
4 due to the higher phonon frequency and stronger dressing. The slopes of the
and
levels are −7.547 and 0.96, respectively. Unlike the Eu
3+: BiPO
4 sample in
Figure 5(b1), whose energy level cannot be cleaved, the CF splitting can be cleaved for the Eu
3+: NaYF
4 sample in
Figure 5(c1). The distance between peak1 and peak2 is 10.09 nm. The distance between peak2 and peak3 is 15.28 nm. The FL asymmetry ratio is 50.2%. The slopes of the
and
levels are −2.54 and 1.23, respectively. Therefore, the FL asymmetry splitting is the strongest for Eu
3+: NaYF
4 because its dressing is the strongest.
Figure 5.
The excitation spectral intensity signals obtained for the different samples by changing the time gate widths (200 ns, 500 ns, 1 µs, 2 µs, 3 µs, 5 µs, 10 µs, 15 µs) when H1 was scanned at PMT2 from 570 nm to 610 nm at the 500 ns time gate position, high power and a 300 K temperature: (a) The broadband laser H2 is scanned (570 nm to 610 nm) for the (12:1) sample of Eu3+: BiPO4. (b) H1 is scanned (570 nm to 610 nm) for the (6:1) sample of Eu3+: BiPO4. (c) H1 is scanned (570 nm to 610 nm) for the (1:1/4) sample of Eu3+: NaYF4. (d–f) Connecting figures corresponding to (a–c), respectively.
Moreover, through a comparison of the three samples, we can see that the FL signal shows strong dressing in
Figure 5a. The CF is well split. The intensity of the phonons in the sample in
Figure 5b is greater than in
Figure 5a, but the dressing is weak due to the middle
(
). Different samples are compared under the same conditions, and it can be seen that the dressing is stronger for the 12:1 sample in
Figure 5a, and the CF splitting, the dip depth and the alignment are better. The photon dressing for the 6:1 sample is shown in
Figure 5b due to the dressing damage. The dressing dips change significantly in
Figure 5a,b due to the action of phonons. Meanwhile, the dressing becomes weak in
Figure 5c (large
,
). The energy level splitting is caused by asymmetry for the Eu
3+: NaYF
4 sample. Therefore, the change in the dressing dip is not obvious from
Figure 5a–c due to the asymmetry of the crystal. This indicates that the phonon plays a more important role than the crystal asymmetry, which is reflected in asymmetry, division, strength and back bottom. The connecting
Figure 5d–f corresponds to the overlapping
Figure 5a–c. The ratios of the maximum signal and the FL are 2783/857 (
Figure 5(d1–d6)), 3341/820 (
Figure 5(e1–e6)) and 2480/672 (
Figure 5(f1–f6)). The ratios of the maximum signal and the SWFM are 1808/857 (
Figure 5(d6–d8)), 1745/820 (
Figure 5(e6–e8)) and 1379/672 (
Figure 5(f6–f8)).
Next, we discuss the differences in SFWM asymmetry splitting under the different conditions.
Figure 6 shows the signals generated from the Eu
3+: BiPO
4 using different experimental parameters in PMT2. The broad peak in
Figure 6a is due to the narrowband excitation, leading to weak photon–phonon dressing
in Equation (7). A broad peak is still shown in
Figure 6(b1–b5) at the small time-gate width because the broadband excitation couples more high-frequency phonons. However, two dressing dips can be seen in
Figure 6(b6,b7) resulting from two dressings:
+
from Equations (3)–(6). When the dressing increases, the linewidth also increases. Because the
decreases and the CF splitting is dominant, we can see two peaks on the left and right in
Figure 6(b7). The left and right peaks are almost completely symmetrical due to the weak dressing and the strong CF splitting. The photon dressing (
and
) leads to second-order splitting at the energy levels
and
(
Figure 6i), respectively. The conditions of first-order splitting enhancement are
and
. The distance between peak1 and peak2 is 5.43 nm. The distance between peak3 and peak4 is 8.06 nm. The distance between peak2 and peak3 is 5.97 nm. The FL asymmetry ratio is 31.83% in
Figure 6a. The slopes of the
and
levels are −4.35 and 0.86, respectively. The FL asymmetry ratio is 33.22% in
Figure 6b; thus, the slopes of the two levels are near infinity.
Figure 6a corresponds to
Figure 6(k1), and
Figure 6b corresponds to
Figure 6(k2). When the
energy level is divided into
and
(
Figure 6j) through weak phonon dressing, the
becomes the center of the energy levels. As a result, a strong asymmetry peak can be seen in
Figure 6a. Therefore, the FL asymmetry splitting is strong under broadband excitation due to the presence of more phonon dressing.
Figure 6.
The excitation spectral intensity signals measured from the (12:1) sample of Eu3+: BiPO4 at PMT2: (a) The time gate widths are changed (200 ns, 500 ns, 1 µs, 2 µs, 5 µs, 10 µs, 15 µs) and H1 is scanned from 570 nm to 610 nm at the 500 ns time gate position, high power and a 300 K temperature. (b) H2 is scanned from 570 nm to 610 nm, and all other conditions are the same as in (a). (c) The time gate position is changed (500 µs, 580 µs, 640 µs, 1 ms, 3 ms, 5 ms) at the 3 µs time gate width, and all other conditions are the same as in (a). (d) The time gate positions are changed (20 µs, 50 µs, 100 µs, 500 µs, 1 ms, 5 ms) at a 200 ns time gate width, and all other conditions are the same as in (b). (e) The time gate positions are changed (50 ns, 100 ns, 200 ns, 500 ns, 1 µs, 2 µs) at the 200 ns time gate width, and all other conditions are the same as in (a). (f) The time gate width is changed (200 ns, 500 µs, 2 µs, 5 µs, 8 µs, 15 µs), and the laser is scanned from 570 nm to 610 nm at the 10 ms gate position and a 300 K temperature. (g) The power is changed from high to low, and H2 is scanned from 570 nm to 610 nm at a time gate width of 200 ns, time gate position of 500 µs and 300 K temperature. (h) The temperature is changed (280 k, 220 k, 150 k, 100 k, 77 k) and H2 is scanned from 570 nm to 610 nm at a time gate width of 200 ns, time gate position of 500 µs and high power. (i,j) Asymmetrical multi-level splitting for two dressings and three dressings, respectively. (k1,k2) Asymmetrical and symmetrical directional precession splitting.
![Nanomaterials 14 00671 g006]()
Figure 6c shows the luminescence spectra of SFWM obtained at the far time gate position. The multi-Fano dip (
Figure 6c) can be explained by the five-nested dressing
. Because the SFWM signal is sensitive to phonon dressing, the SFWM asymmetry ratio is 52.17% in
Figure 6c. Under the same conditions, three multi-dips can be seen in
Figure 6d as a result of three SFWM phonon dressings (
) when the time gate position is changed. The left and right peaks are basically symmetrical in
Figure 6(d1). The conditions of first-order splitting enhancement are
and
for the real part, and
and
for the imaginary part. The conditions of second-order splitting enhancement are
and
. The conditions of suppression are
. The conditions of dip1 are
. The conditions of dip2 are
. The distance between peak1 and peak3 is 8.53 nm. The conditions of first-order splitting enhancement are
and
at the
level. The position of the
level (dip4) satisfies the suppression conditions
. The distance between peak4 and peak5 is 5.78 nm; the distance between peak3 and peak4 is 5.44 nm. The intensity of dip1 is 2166.53 nm, and that of dip2 is 1666.1 nm. The slopes of dip1 and dip4 are −4.6 and 4.97, respectively. The SFWM asymmetry ratio is 53.21% in
Figure 6d due to strong phonon dressing resulting from broadband excitation.
The energy levels splitting are shown in
Figure 6(k1,k2), corresponding to
Figure 6c,d, respectively.
Figure 6e shows the FL signal. The FL asymmetry ratio is 10.05%. The slopes of the
and
levels are −5.77 and 1.09, respectively. Compared to
Figure 6a, asymmetry is more sensitive to the time gate position in
Figure 6e. Compared with
Figure 6c, the SFWM symmetry ratio is 0.2% in
Figure 6f. It can be seen that the SFWM asymmetry is more sensitive to the time gate position due to the phonon dressing reaching the maximum. Compared with
Figure 6c, the number of dressings is the same, but the dressing is larger (
Figure 6(k1)), resulting in the multi-Fano dips in
Figure 6f. It can be confirmed again that when the time gate position is near, the asymmetry is controlled by the time gate width. However, at a large time gate width, the asymmetry is controlled by the time gate position. The left and right dressing dips are asymmetry, which is related to the circular polarization. Similarly, the distance between peak1 and peak2 is 16.59 nm, and the asymmetry is only small, as shown in
Figure 6f.
Figure 6g shows the luminescence spectra when the power is changed from high to low. Compared to
Figure 6(g9) at low power,
Figure 6(g1) shows multi-Fano dips at high power due to strong in-phase constructive dressing in the SFWM region. The distance between peak1 and peak3 is 8.19 nm. The distance between peak4 and peak6 is 11.22 nm. The middle energy levels of |0> and |±1> come from dressing-assistance crystal splitting (
Figure 6(k2)). The distance between peak3 and peak4 is 3.28 nm. Therefore, the slopes of dip1 and dip5 are −4.44 and 4.43, respectively. The two slopes show opposite numbers.
Figure 6h shows the spectral signal resulting from the change in temperature. Compared to the low temperature (smaller
and larger
) in
Figure 6(h5), the high temperature in
Figure 6(h5) shows strong multi-Fano dips due to in-phase constructive dressing. The distance between peak1 and peak3 is 8.1 nm. The distance between peak3 and peak4 is 3.94 nm. The distance between peak4 and peak5 is 2.48 nm. Therefore, the slopes of dip1 and dip5 are −4.51 and 4.78, respectively. The two slopes show opposite numbers. By comparing
Figure 6g,h, we can conclude that, upon changing the power and temperature, the center of the signal is basically unchanged and has no asymmetry in
Figure 6h. The amplitude and Rabi frequency are controlled by the power and temperature. The detuning is controlled by changing the time gate position and time gate width. Therefore, the FL and SFWM asymmetry is not changed.


 ,
, 


