Article

Responses of Tomato Photosystem II Photochemistry to Pegylated Zinc-Doped Ferrite Nanoparticles

by
Ilektra Sperdouli
1,*,†,
Kleoniki Giannousi
2,†,
Julietta Moustaka
3,
Orestis Antonoglou
2,
Catherine Dendrinou-Samara
2 and
Michael Moustakas
3,*
1
Institute of Plant Breeding and Genetic Resources, Hellenic Agricultural Organization-Dimitra, 57001 Thessaloniki, Greece
2
Laboratory of Inorganic Chemistry, Department of Chemistry, Aristotle University of Thessaloniki, 54124 Thessaloniki, Greece
3
Department of Botany, School of Biology, Aristotle University of Thessaloniki, 54124 Thessaloniki, Greece
*
Authors to whom correspondence should be addressed.
These authors contributed equally to this work.
Nanomaterials 2025, 15(4), 288; https://doi.org/10.3390/nano15040288
Submission received: 28 December 2024 / Revised: 10 February 2025 / Accepted: 11 February 2025 / Published: 13 February 2025
(This article belongs to the Special Issue Advances in Toxicity of Nanoparticles in Organisms (2nd Edition))

Abstract

:
Various metal-based nanomaterials have been the focus of research regarding their use in controlling pests and diseases and in improving crop yield and quality. In this study, we synthesized via a solvothermal procedure pegylated zinc-doped ferrite (ZnFer) NPs and characterized their physicochemical properties by X-ray diffraction (XRD), vibrating sample magnetometry (VSM), thermogravimetric analysis (TGA), FT-IR and UV–Vis spectroscopies, as well as transmission electron microscopy (TEM). Subsequently, their impact on tomato photosynthetic efficiency was evaluated by using chlorophyll a fluorescence imaging analysis to estimate the light energy use efficiency of photosystem II (PSII), 30, 60, and 180 min after foliar spray of tomato plants with distilled water (control plants) or 15 mg L−1 and 30 mg L−1 ZnFer NPs. The PSII responses of tomato leaves to foliar spray with ZnFer NPs showed time- and dose-dependent biphasic hormetic responses, characterized by a short-time inhibitory effect by the low dose and stimulatory effect by the high dose, while at a longer exposure period, the reverse phenomenon was recorded by the low and high doses. An inhibitory effect on PSII function was observed after more than ~120 min exposure to both ZnFer NPs concentrations, implying a negative effect on PSII photochemistry. We may conclude that the synthesized ZnFer NPs, despite their ability to induce hormesis of PSII photochemistry, have a negative impact on photosynthetic function.

1. Introduction

Nanoparticles (NPs) have been shown to improve plant performance, suppress plant disease, and protect crop plants from environmental stresses [1,2]. However, some metal-based NPs have been described to decrease plant growth and performance, causing toxicity effects on crops [3]. Metal-based nanoparticles (NPs) are emerging as promising tools in sustainable agriculture and, nowadays, are being used as nanofertilizers, nanopesticides, growth stimulators, or simply as nanocarriers, since they are more effective and pose a lower risk of environmental contamination than conventional agrochemicals. Photosynthesis is strongly related to plant productivity and yield [4,5]. Despite the fact that photosynthesis is strongly related to plant productivity and yield, only a limited number of studies have focused on the use of NPs to improve photosynthetic activity [4,5].
Among the several metal-based NPs, the zinc oxide ones have been shown to have the potential to improve the photosynthetic efficacy of tomato plants, depending though on their shape; ZnO nanorods were not as effective as irregularly shaped ZnO NPs in enhancing PSII function [6,7]. Moreover, iron-based NPs are gaining increasing interest due to their redox chemistry and the specific property of zero-valent iron (Fe-0) NPs to promote stomatal opening, as observed in Arabidopsis thaliana [8]. Iron-based NPs are commonly synthesized in the form of ferrites M(FexOy), where M stands for metal [9]. Ferrites are magnetic nanomaterials, which apart from their rich physical, structural, and electrical properties, have the ability to be traced in an organism and directed externally by magnets [10]. Currently, magnetic nanoparticles are drawing attention owing to their wide-ranging applications across various fields, spanning from medicine and electronics to cosmetics and environmental remediation [11,12,13,14]. Meanwhile, based on their composition, M(FexOy) have been explored as biostimulants and photocatalysts in agricultural settings [5,11]. Specifically, zinc ferrites (ZnFe2O4) have semiconducting properties and can be considered photoreactive materials, including photocatalysis and photochemical reactions. Zinc ferrite NPs have been explored for their photocatalytic activity under UV or visible light [15,16]. In photocatalysis, those NPs can absorb light and generate electron–hole pairs that are capable of driving photochemical reactions, such as the degradation of organic pollutants or the production of hydrogen from water splitting. Meanwhile, the surface of ZnFe2O4 can be activated under light, which leads to the formation of reactive oxygen species (ROS), such as hydroxyl radicals (·OH), which can interact with organic contaminants, making them useful in environmental remediation and wastewater treatment.
The rising demands for sustainable agricultural practices to boost crop growth, enhance nutrient utilization, and increase resilience to abiotic and biotic stresses highlight nanofertilizers as valuable tools for regenerative agriculture [17]. Foliar application of nanofertilizers can not only enhance nutrient use efficiency [18] but also stimulate photosynthesis [6] and relieve the unfavorable effects of abiotic stresses [19]. Photosynthetic function is usually evaluated using the non-destructive method of chlorophyll a fluorescence [20,21,22,23,24]. The fluorescence of chlorophyll a, which can be easily evaluated, is a small fraction of one of the de-excitation pathways of absorbed light energy by light-harvesting complexes that is not used for photochemistry or dissipated through other pathways [25,26]. The absorbed light energy that is not utilized for photochemistry or dissipated as heat by a photoprotective mechanism of non-photochemical quenching (NPQ) can lead to reactive oxygen species (ROS) formation, such as superoxide anions (O2•−), hydroxyl radicals (OH), singlet oxygen (1O2), and hydrogen peroxide (H2O2) [27,28,29]. The increased ROS generation can lead to oxidative damage but they also act as signaling molecules, playing functions in plant defense and plant development [29,30,31,32,33,34,35].
Plants respond to any disturbance of their homeostasis triggered by an abiotic or biotic stress factor, displaying a compensatory response that results in a hormetic response [36,37,38,39]. Accordingly, the term hormesis refers to an “overcompensation” response when there is a disruption in homeostasis, and it has been shown to occur in a number of organisms independent of the type of stress or the metabolic process considered [17,36,37,39,40,41,42,43,44,45,46,47,48,49]. Hormesis typically follows an inverted U-shaped response curve, showing stimulation at low doses or brief exposures and inhibition at high doses or prolonged exposures [46,50,51]. Conversely, a U-shaped biphasic response curve has also been observed, where low doses or short exposures result in inhibition, while higher doses or longer exposures lead to stimulation [37,39,40,52,53]. The hormetic response of photosynthetic function has been reported to involve activation of the NPQ mechanism [37,40,53,54,55].
Zinc (Zn), an essential micronutrient for plants, is required for normal plant growth and development [56,57,58]. It is involved in retaining the membrane structure of various cell organelles [59,60,61,62,63,64] and also participates as a structural component of proteins involved in the metabolism of ROS, in the process of translation and transcription, and in photosynthesis [58,65,66]. Zinc cations and Zn complexes have antioxidant and antimicrobial activities [67]. Iron (Fe) has a fundamental role in the enzymes involved in the electron transport of the photosynthetic process [68,69].
Human Zn nutrition is based on plants and human Zn deficiency results in over 400,000 deaths yearly [66]. Agricultural practices through foliar spray to enhance Zn bioavailability in nutritive systems [70,71,72] have become gradually common in regions of arid countries [73]. Iron and Zn deficiencies, due to the nutrient-poor status of agricultural soils, persist as serious public health problems affecting more than 3 billion people worldwide [74]. Agricultural application of Zn, in the framework of hormesis, for improving crop yield and quality can be somewhat outside laboratory interests especially when applied in addition to other benefits (e.g., control of pests and diseases) [75]. Tomato, as an extensively cultivated high-value vegetable, unavoidably faces various types of pests and diseases that not only severely impact the quality of tomatoes but also significantly decrease harvests, leading to considerable commercial losses [38,76].
Herein, in an attempt to combine two bio-metals with proved crop enhancing and protecting properties, zinc ferrite nanoparticles were solvothermally prepared in the presence of polyethylene glycol 8000 (PEG 8000) and their impact on tomato photosystem II photochemistry was evaluated. Zinc ferrite has a moderate band gap, typically around 1.9–2.2 eV, which makes it responsive to both UV and visible light. This property allows it to participate in photoreactive processes, especially when used in photocatalytic systems [16]. Meanwhile, PEG can influence photochemistry through its effects as a stabilizer or structural component in various systems. It can modulate reaction rates, enhance stability, protect sensitive molecules, and alter the properties of photoreactive materials [77]. Its impact on photochemistry is highly dependent on the specific context of the system and the nature of the photochemical processes involved [78]. We applied a synthetic procedure that allowed the isolation of coated/pegylated ferrites with a different zinc doping from the typical numerical formula (ZnFe2O4) to further test the optical, photocatalytic, and magnetic properties of the nanomaterial. The physicochemical characteristics of the resulting hybrid ensembles, which are very important for their biological evaluation, were identified. Since previous studies suggested the safe use of ZnFe2O4 NPs in nano-agricultural applications [9], we evaluated the consequences of our synthesized zinc ferrite NPs on tomato photosynthetic function 30 min, 60 min, and 180 min after foliar spray. Photosynthetic function measurements were conducted with two light intensities, 300 μmol photons m−2 s−1, corresponding to the growth light intensity (GLI) of tomato plants, and 1000 μmol photons m−2 s−1, representing a high light intensity (HLI).

2. Materials and Methods

2.1. Synthesis of Zinc-Doped Ferrite Nanoparticles

First, 1.8 mmol Fe(acac)3 and 0.9 mmol Zn(acac)2 were mixed in 10 mL of PEG 8000. The solution was transferred to a Teflon-lined autoclave and the reaction was carried out under autogenous pressure at 200 °C for 24 h (heating rate 4 °C/min). Subsequently, the mixture was centrifuged at 5000 rpm for 20 min, followed by rinsing with ethyl alcohol four times to remove any untreated precursors.

2.2. Characterization of Zinc-Doped Ferrite Nanoparticles

The crystal structure of the magnetic nanoparticles (MNPs) was investigated through X-ray diffraction (XRD) performed on a Philips PW 1820 diffractometer at a scanning rate of 0.050/3 s, in the 2θ range from 20° to 70°, with Cu Kα radiation (λ = 1.5406 nm). Magnetic measurements were performed using a vibrating sample magnetometer (VSM) (P.A.R. 155). Thermogravimetric analysis (TGA) was performed using a SETA-RAM SetSys-1200 (KEP Technologies, Caluire-et-Cuire, France) and carried out in the range from room temperature to 800 °C at a heating rate of 10 °C min−1 under an N2 atmosphere. Primary particle size and morphology were determined through conventional transmission electron microscopy (TEM) images obtained with a JEOL JEM 1200–EX (JEOL Ltd., Tokyo, Japan) microscope operating at 120 kV. For the TEM observations, suspensions deposited onto carbon-coated copper grids were used.

2.3. Plant Material and Growth Conditions

In our experiments, we used 20 cm in height tomato (Solanum lycopersicum L. cv. Meteor) plants grown in a greenhouse with a 14 h photoperiod, a photosynthetic photon flux density (PPFD) of 300 ± 10 μmol photons m−2 s−1, a day/night temperature 25 ± 1/21 ± 1 °C, and a relative humidity of 55 ± 5/65 ± 5% day/night.

2.4. Plant Treatment with Zinc-Doped Ferrite Nanoparticles

Two concentrations of ZnFer NPs (15 mg L−1 and 30 mg L−1) were used for foliar application in tomato plants. Control plants were foliar sprayed with distilled water. Each tomato plant was foliar sprayed with 15 mL of distilled water or ZnFer NPs. Three plants were used in each treatment with two independent replications (n = 6).

2.5. Chlorophyll Fluorescence Measurements

To estimate PSII function in young tomato leaflets, we used the Imaging-PAM Fluorometer M-Series (Heinz Walz GmbH, Effeltrich, Germany), as previously described in detail [79]. Chlorophyll fluorescence measurements were conducted 30 min, 60 min, and 180 min after exposure to distilled water (control plants) or 15 mg L−1 and 30 mg L−1 ZnFer NPs. All leaves were dark-adapted for 20 min before measuring the minimum (Fo) and the maximum (Fm) chlorophyll a fluorescence in the dark. The maximum chlorophyll a fluorescence in the light (Fm′) was obtained with saturating pulses (SPs) every 20 s for 5 min after application of the actinic light (AL), while the minimum chlorophyll a fluorescence in the light (Fo′) was computed as follows: Fo′ = Fo/(Fv/Fm + Fo/Fm′) [80]. The actinic light (AL) for the measurements was 300 μmol photons m−2 s−1, corresponding to the growth light intensity (GLI), or 1000 μmol photons m−2 s−1, representing a high light intensity (HLI). Steady-state photosynthesis (Fs) was measured after 5 min of illumination time with the AL. The chlorophyll fluorescence parameters, described in detail in Table S1, were estimated using Imaging Win V2.41a software (Heinz Walz GmbH, Effeltrich, Germany).

2.6. Statistical Analysis

All statistical analysis was conducted in R software (version 4.3.1, R Core Team, 2023). The normality of residuals was tested using the Shapiro–Wilk test (package ‘stats’) and homogeneity of variances was checked with Levene’s test (package ‘car’). A two-way ANOVA was performed for each parameter with concentration and time as factors, followed by post hoc analysis with Tukey’s honest significant difference test. Values were considered significantly different at p < 0.05.

3. Results

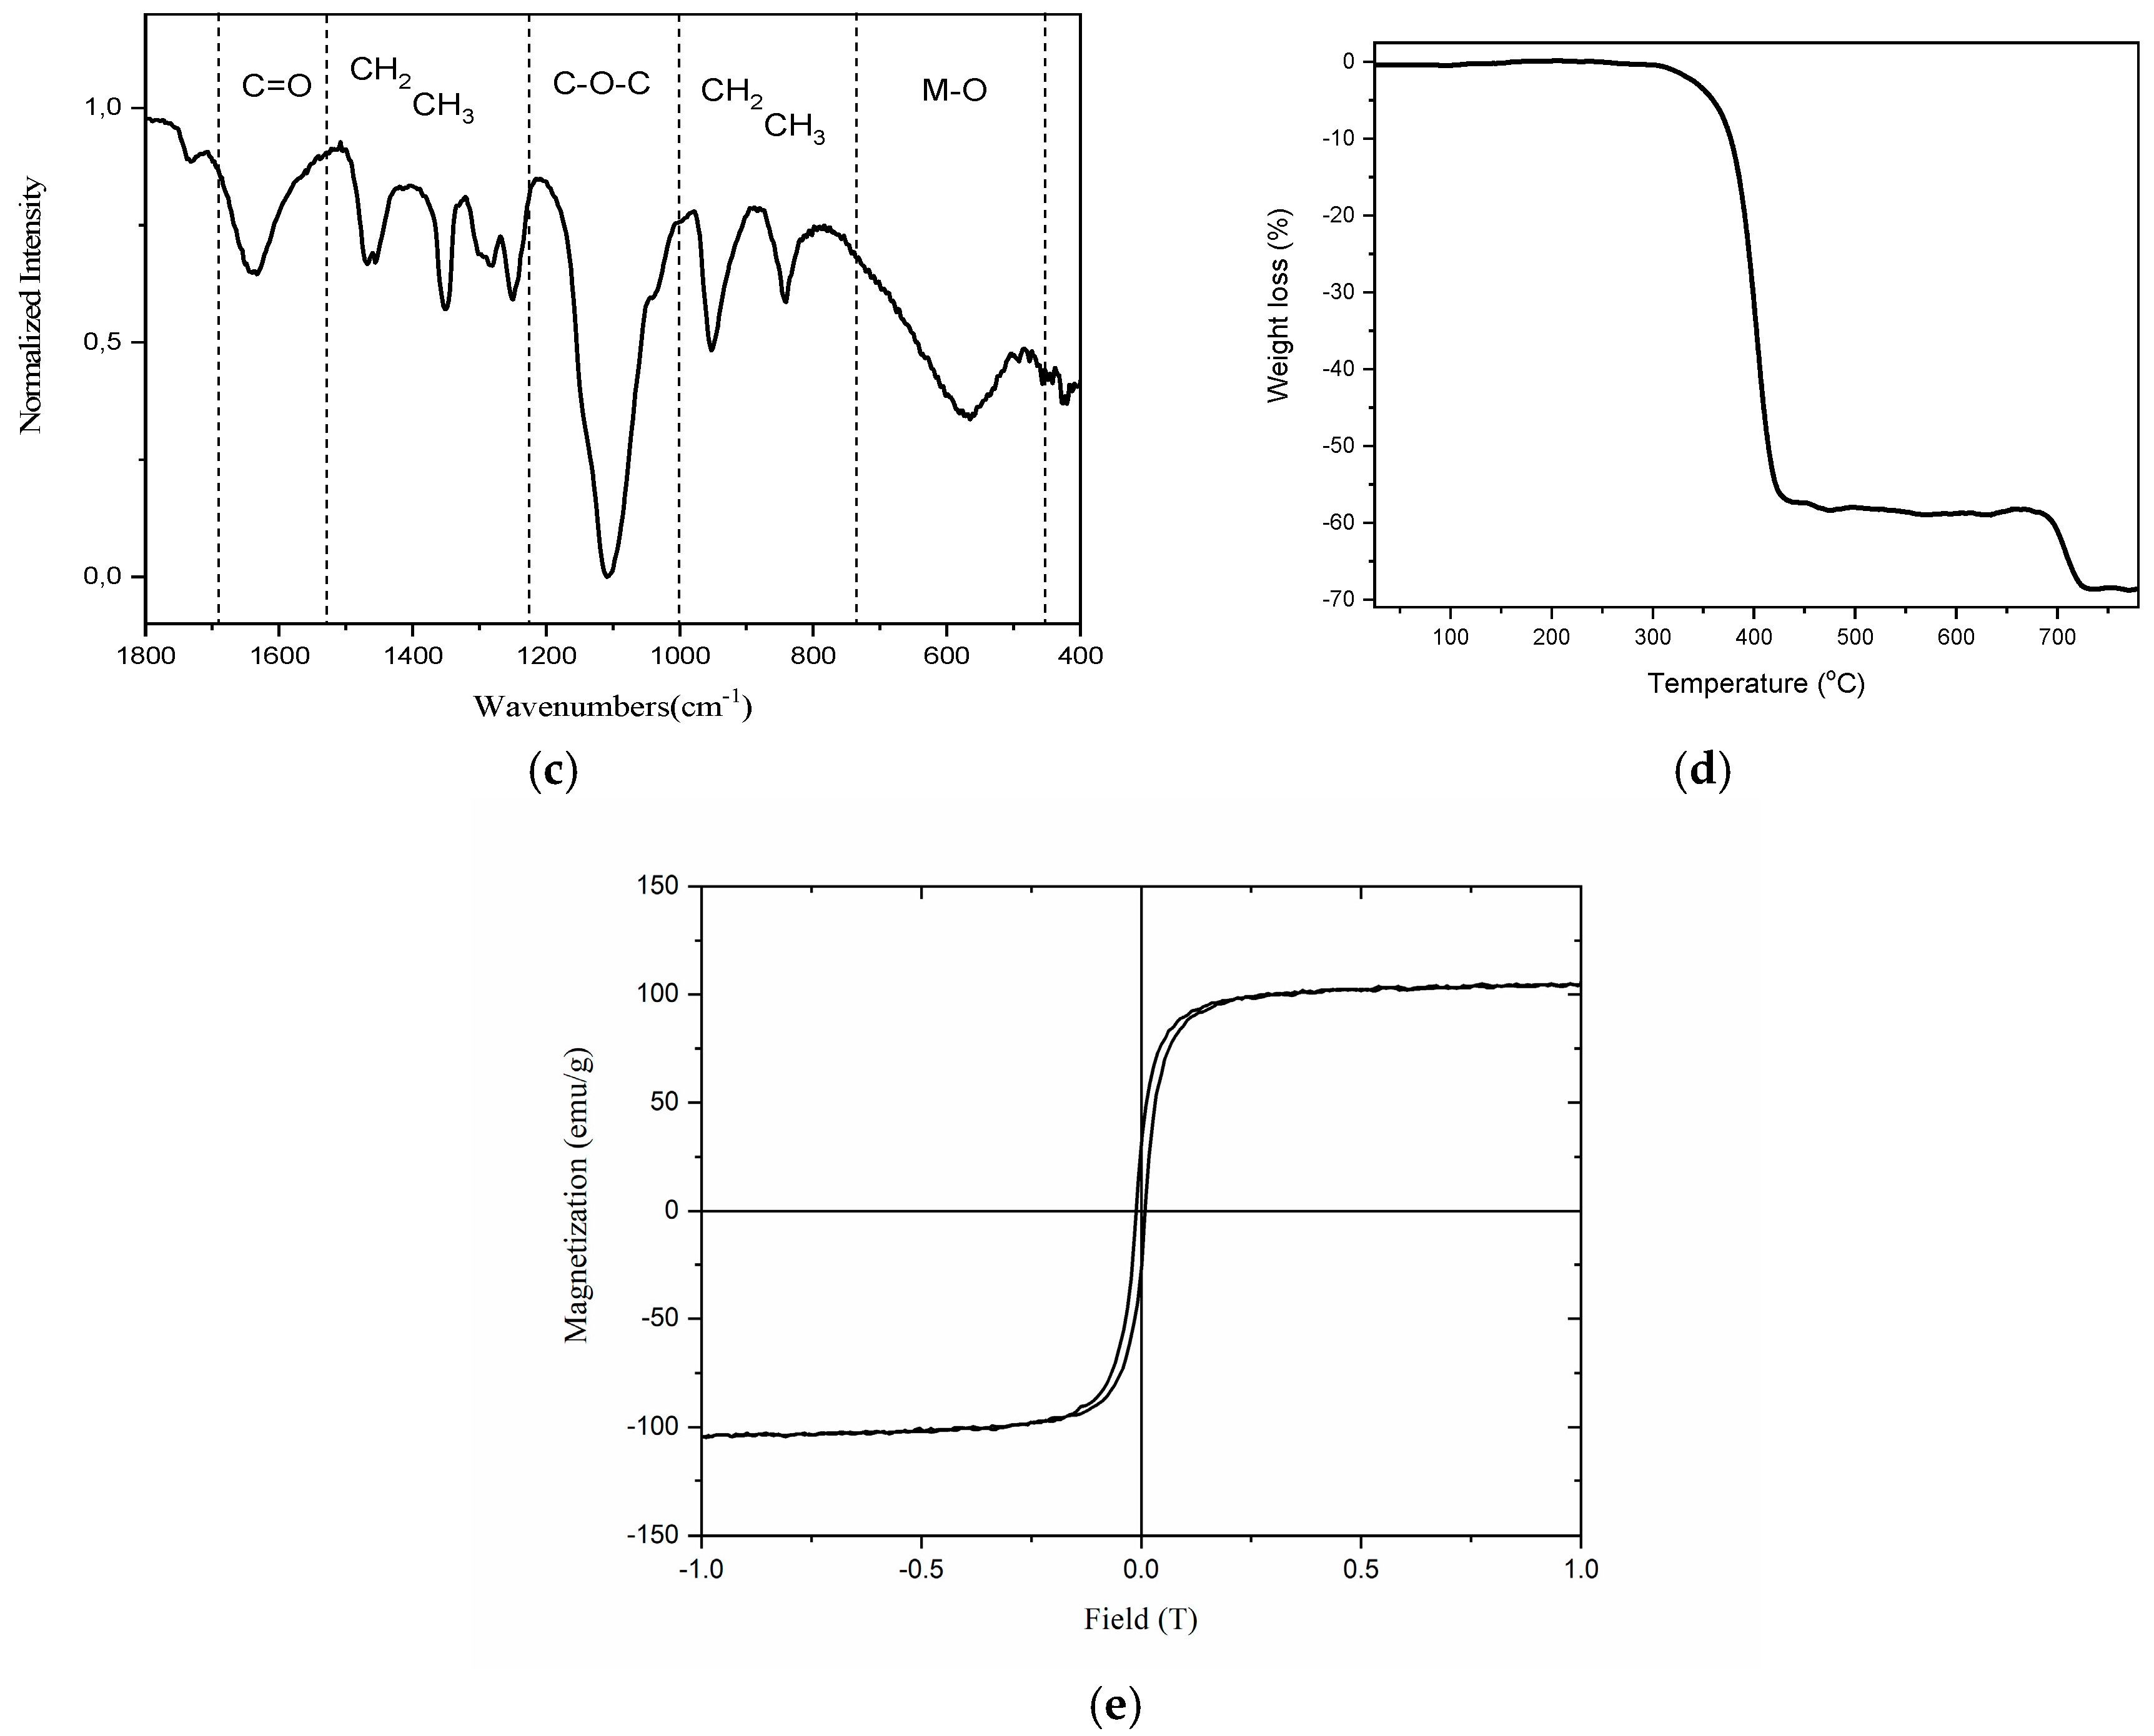
3.1. Synthesis and Characterization of Zinc-Doped Ferrite Nanoparticles

The composition, crystal structure, and crystallite size of the nanoparticles were identified via X-ray diffraction (XRD) analysis (Figure 1a). The XRD pattern verified the composition of zinc ferrite nanoparticles (#22-1012) without any impurities, while the exact stoichiometry was found to be Zn0.65Fe0.35Fe2O4 based on the Rietveld refinement analysis of the XRD pattern (Figure S1).
PEG was crystallized as indicated by the peaks presented in the diffractogram (#49-2095). The lattice parameter α was calculated to be 0.84 nm, and the crystallite size was found to be equal to 13 nm upon applying the Scherrer equation. The morphology of the sample was investigated by transmission electron microscopy (TEM) analysis (Figure 1b). PEG resulted in the formation of groups of almost spherical nanoparticles, while the Feret diameter was found to be approximately 12 nm (Figure 1b inset), close to the crystallite size. The organic coating of the ferrite was initially analyzed by FT-IR spectroscopy and the spectrum normalized in the region of 1800 to 400 cm−1 is presented in Figure 1c. The polymeric character of PEG (1150–1000 cm−1) was preserved and dominated over the oxidized forms of PEG (1700–1500 cm−1). The bands corresponding to CH2 and CH3 groups seemed to be of similar intensity, and thus it was deduced that limited fragmentation took place. The band due to metal–oxygen bonds was significantly attenuated in comparison to the bands of the organic coating, verifying that a high ratio of PEG was present in the sample. This observation was also confirmed by the thermogravimetric analysis (TGA) curve, where the total amount of PEG was found to be equal to 70% w/w (Figure 1d). The decomposition took place in two stages, indicating the presence of a double layer. The hysteresis loop, as measured by VSM and upon correction based on the percentage of surfactant, is presented in Figure 1e. The saturation magnetization (Ms) was found to be equal to 104 emu/g. The optical properties of the zinc-doped ferrite NPs were investigated via UV–Vis measurements (Figure S2a), and by employing a Tauc plot, the band gap was ascertained to be 2.35 eV (Figure S2b), which was slightly larger than that of the bulk counterpart (1.9–2.2 eV).

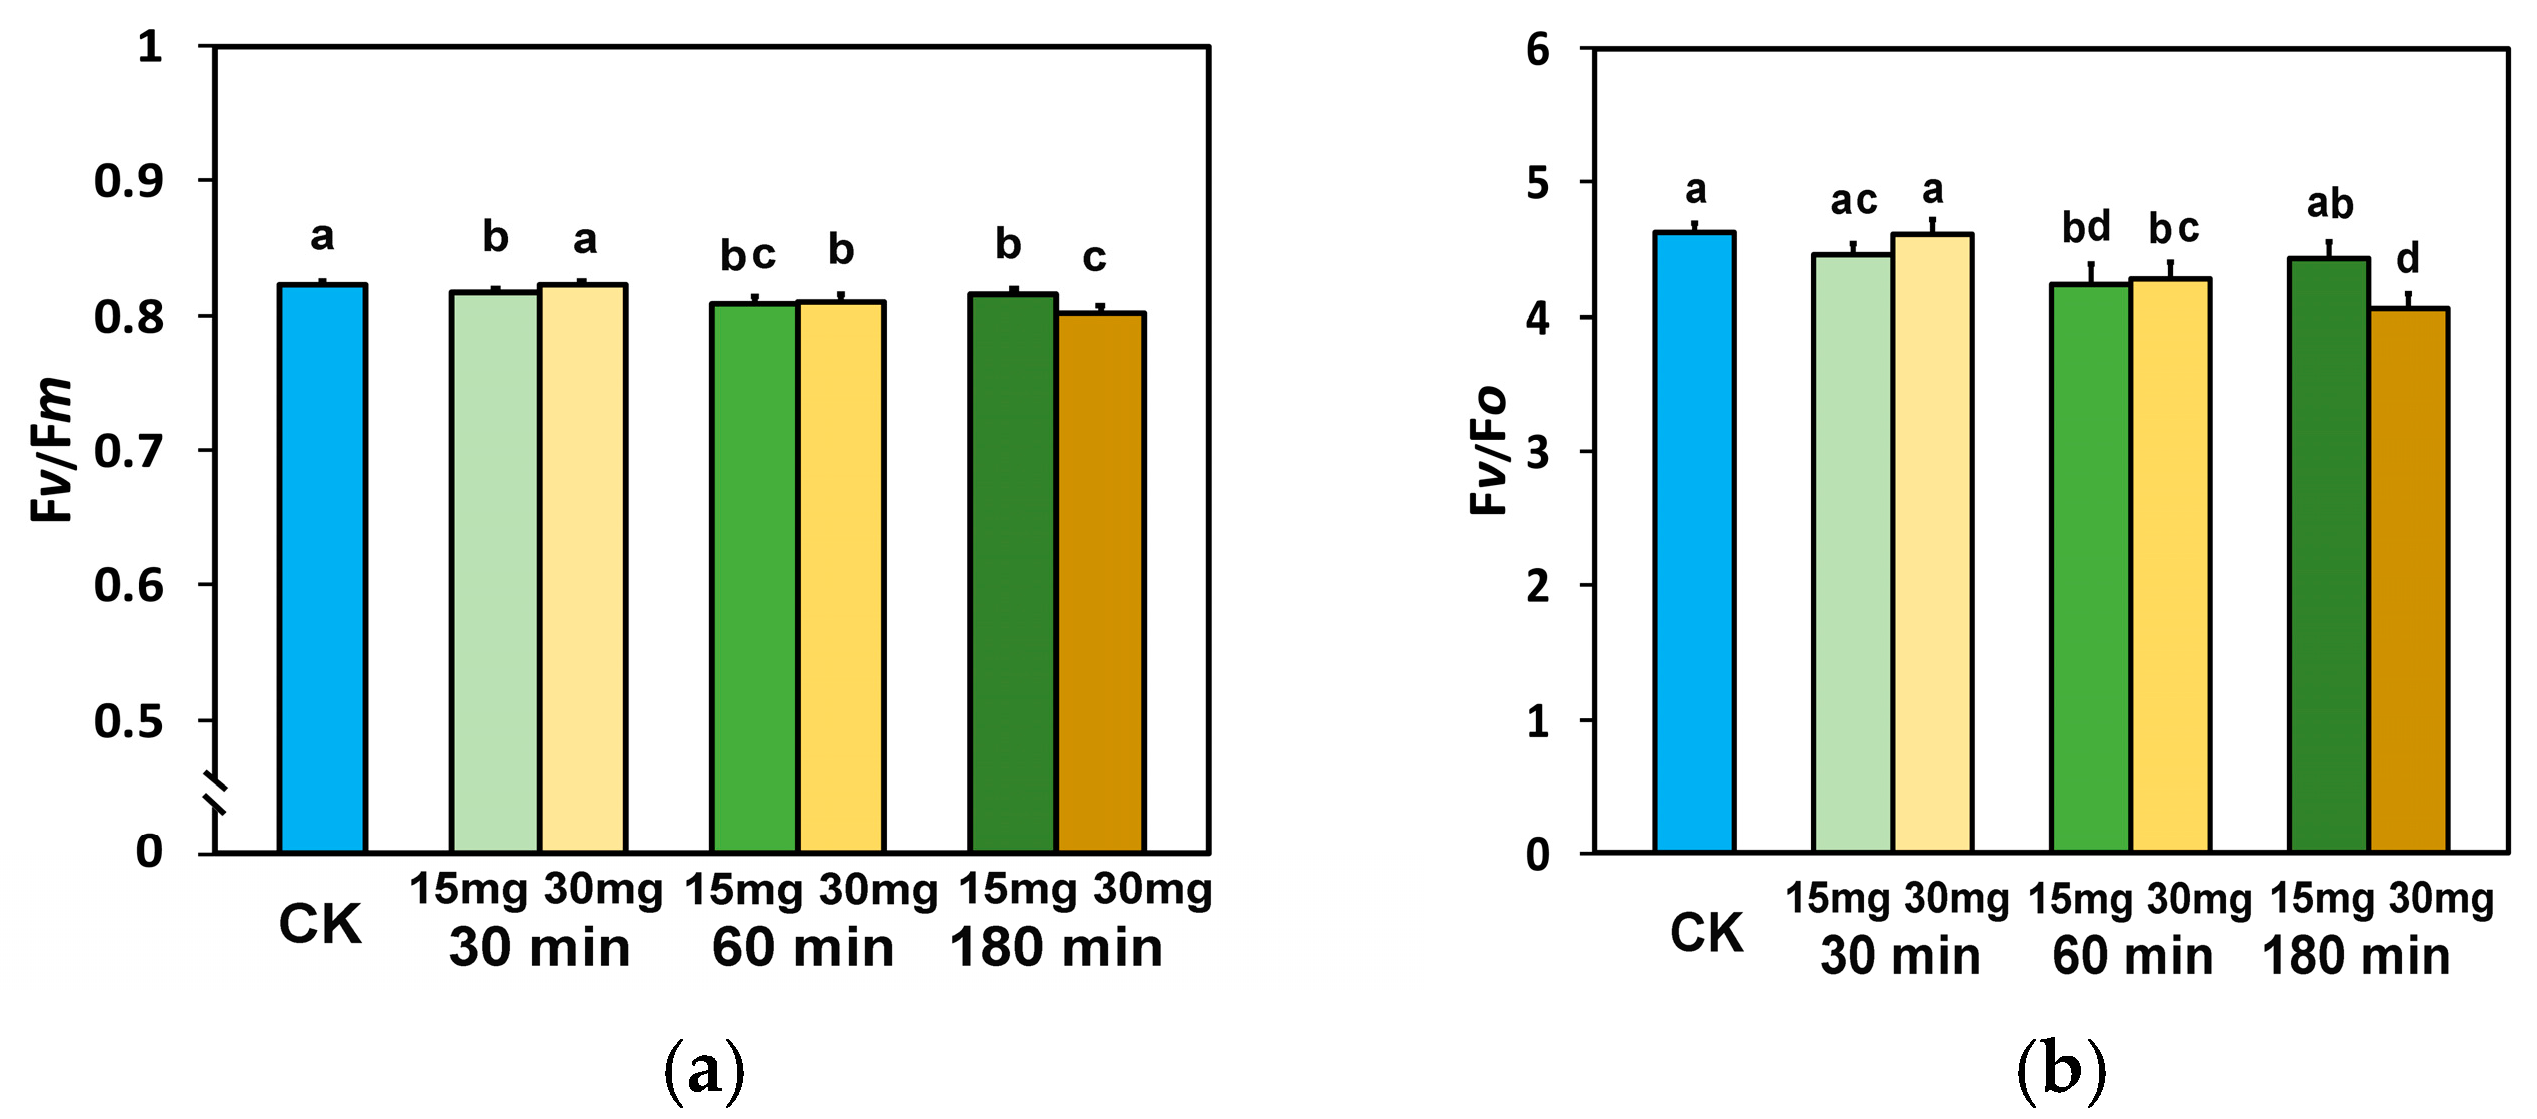
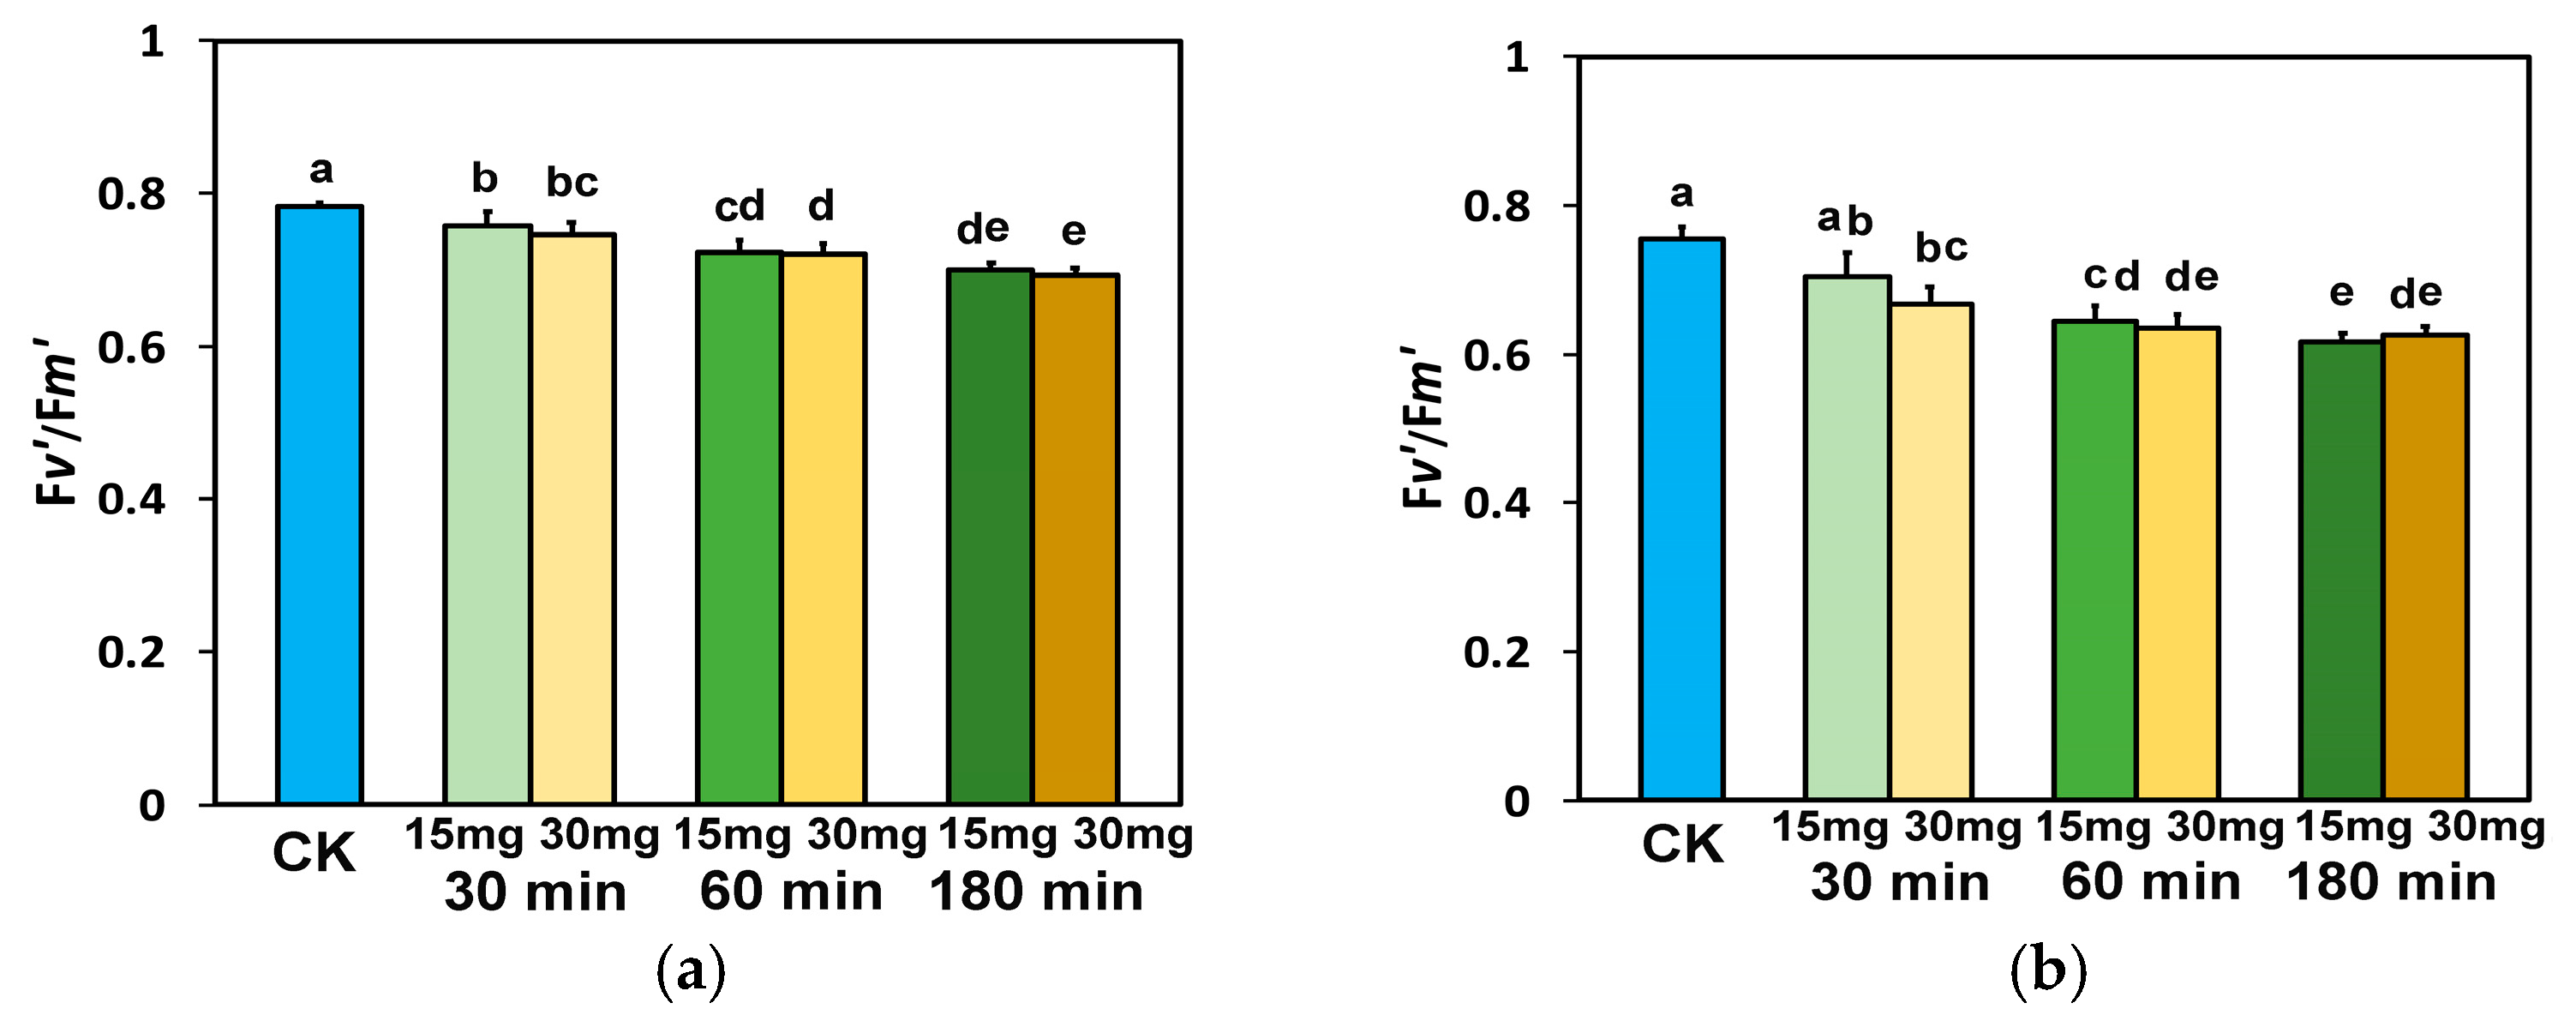
3.2. Maximum Efficiency of Photosystem II and Efficiency of the Oxygen-Evolving Complex in Tomato Leaflets Sprayed with Zinc-Doped Ferrite Nanoparticles

Since there were no statistically significant differences after 30 min, 60 min, and 180 min between any of the control chlorophyll fluorescence parameters, one control average value is presented for simplicity.
The maximum efficiency of PSII photochemistry (Fv/Fm), measured in dark-adapted tomato leaves, 30 min after exposure to 15 mg L−1 ZnFer NPs, decreased significantly compared to exposure to distilled water (control plants), while Fv/Fm after exposure to 30 mg L−1 zinc ferrite NPs was equal to the level of control plants (Figure 2a). Exposure of tomato plants for 60 and 180 min to both ZnFer NPs concentrations resulted in decreased Fv/Fm values compared to control plants (Figure 2a). Tomato plants after 180 min exposure to 15 mg L−1 ZnFer NPs retained higher Fv/Fm values compared to exposure to 30 mg L−1 ZnFer NPs (Figure 2a).
The efficiency of the oxygen-evolving complex (Fv/Fo) was affected by the ZnFer NPs similarly to Fv/Fm. However, 30 and 180 min after foliar spray with 15 mg L−1 ZnFer NPs, the Fv/Fo values were equal to those of control plants (Figure 2b). By contrast, 180 min after foliar spray with 30 mg L−1 ZnFer NPs, the Fv/Fo values decreased significantly compared to the control plant values (Figure 2b).

3.3. Distribution of the Absorbed Light Energy in Photosystem II in Tomato Leaflets Sprayed with Zinc-Doped Ferrite Nanoparticles

The partitioning of the light energy at PSII to photochemistry (ΦPSII), heat dissipation lost (ΦNPQ), or misplaced through a nonregulatory pathway (ΦNO) [81] was measured 30 min, 60 min, and 180 min after exposure to distilled water (control plants) or 15 and 30 mg L−1 ZnFer NPs. Thirty minutes after exposure to 15 mg L−1 ZnFer NPs, the effective quantum yield of PSII photochemistry (ΦPSII), at the GLI and the HLI (Figure 3a,b), decreased significantly, while with 30 mg L−1 zinc ferrite NPs, ΦPSII increased significantly, compared to control plants (Figure 3a,b). On the contrary, 60 min after exposure to 15 mg L−1 ZnFer NPs, ΦPSII increased significantly at the GLI compared to control plants and was equal to controls at the HLI, while with 30 mg L−1 ZnFer NPs, ΦPSII returned to control values at both light intensities (Figure 3a,b). Further exposure time (180 min), at both light intensities, resulted in a decreased ΦPSII with both 15 mg L−1 and 30 mg L−1 ZnFer NPs compared to control plants (Figure 3a,b). However, at both light intensities, tomato plants after 180 min exposure to 15 mg L−1 ZnFer NPs retained higher ΦPSII values compared to exposure to 30 mg L−1 ZnFer NPs, but the values were still lower than the control values (Figure 3a,b).
Τhe quantum yield of regulated non-photochemical energy loss in PSII (ΦNPQ) increased after exposure to 15 mg L−1 or 30 mg L−1 ZnFer NPs to the same level at both concentrations and at both light intensities (Figure 4a,b), as compared to control plants. At both concentrations and both light intensities, the higher increase in ΦNPQ was observed after 180 min exposure to ZnFer NPs (Figure 4a,b).
The quantum yield of non-regulated energy loss in PSII (ΦNO), after 30 min exposure to 15 mg L−1 ZnFer NPs, remained at the level of control plants at both light intensities, but with 30 mg L−1 ZnFer NPs, ΦNO decreased significantly compared to control plants (Figure 4c,d). After 60 and 180 min exposure to both ZnFer NPs concentrations, ΦNO at both light intensities decreased significantly compared to control plants (Figure 4c,d). After 180 min exposure of tomato plants to 15 mg L−1 ZnFer NPs, ΦNO at both light intensities retained lower values compared to exposure to 30 mg L−1 ZnFer NPs (Figure 4c,d).

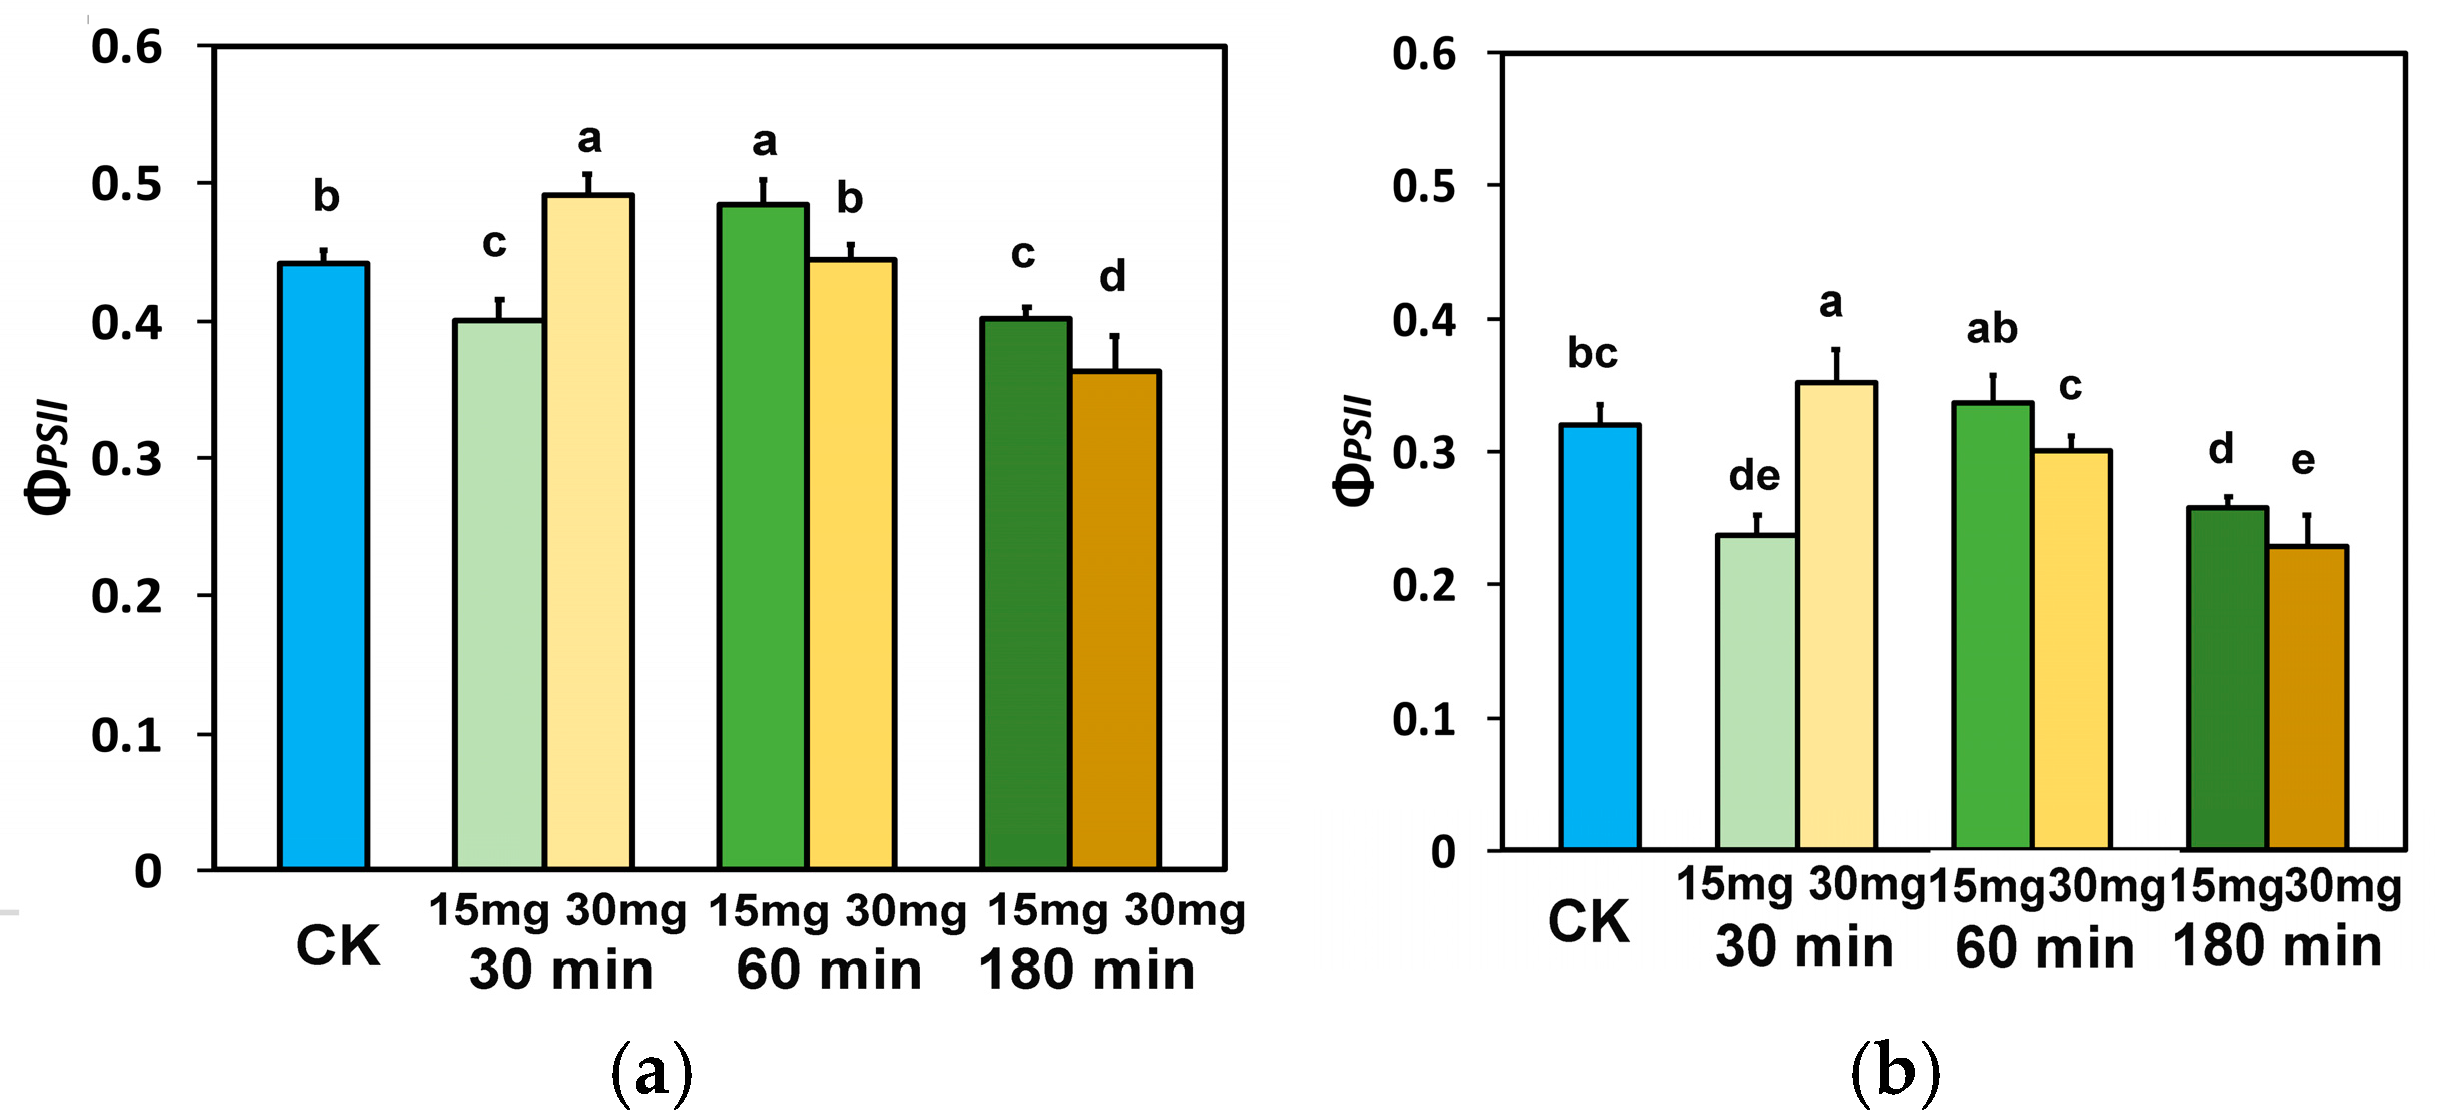
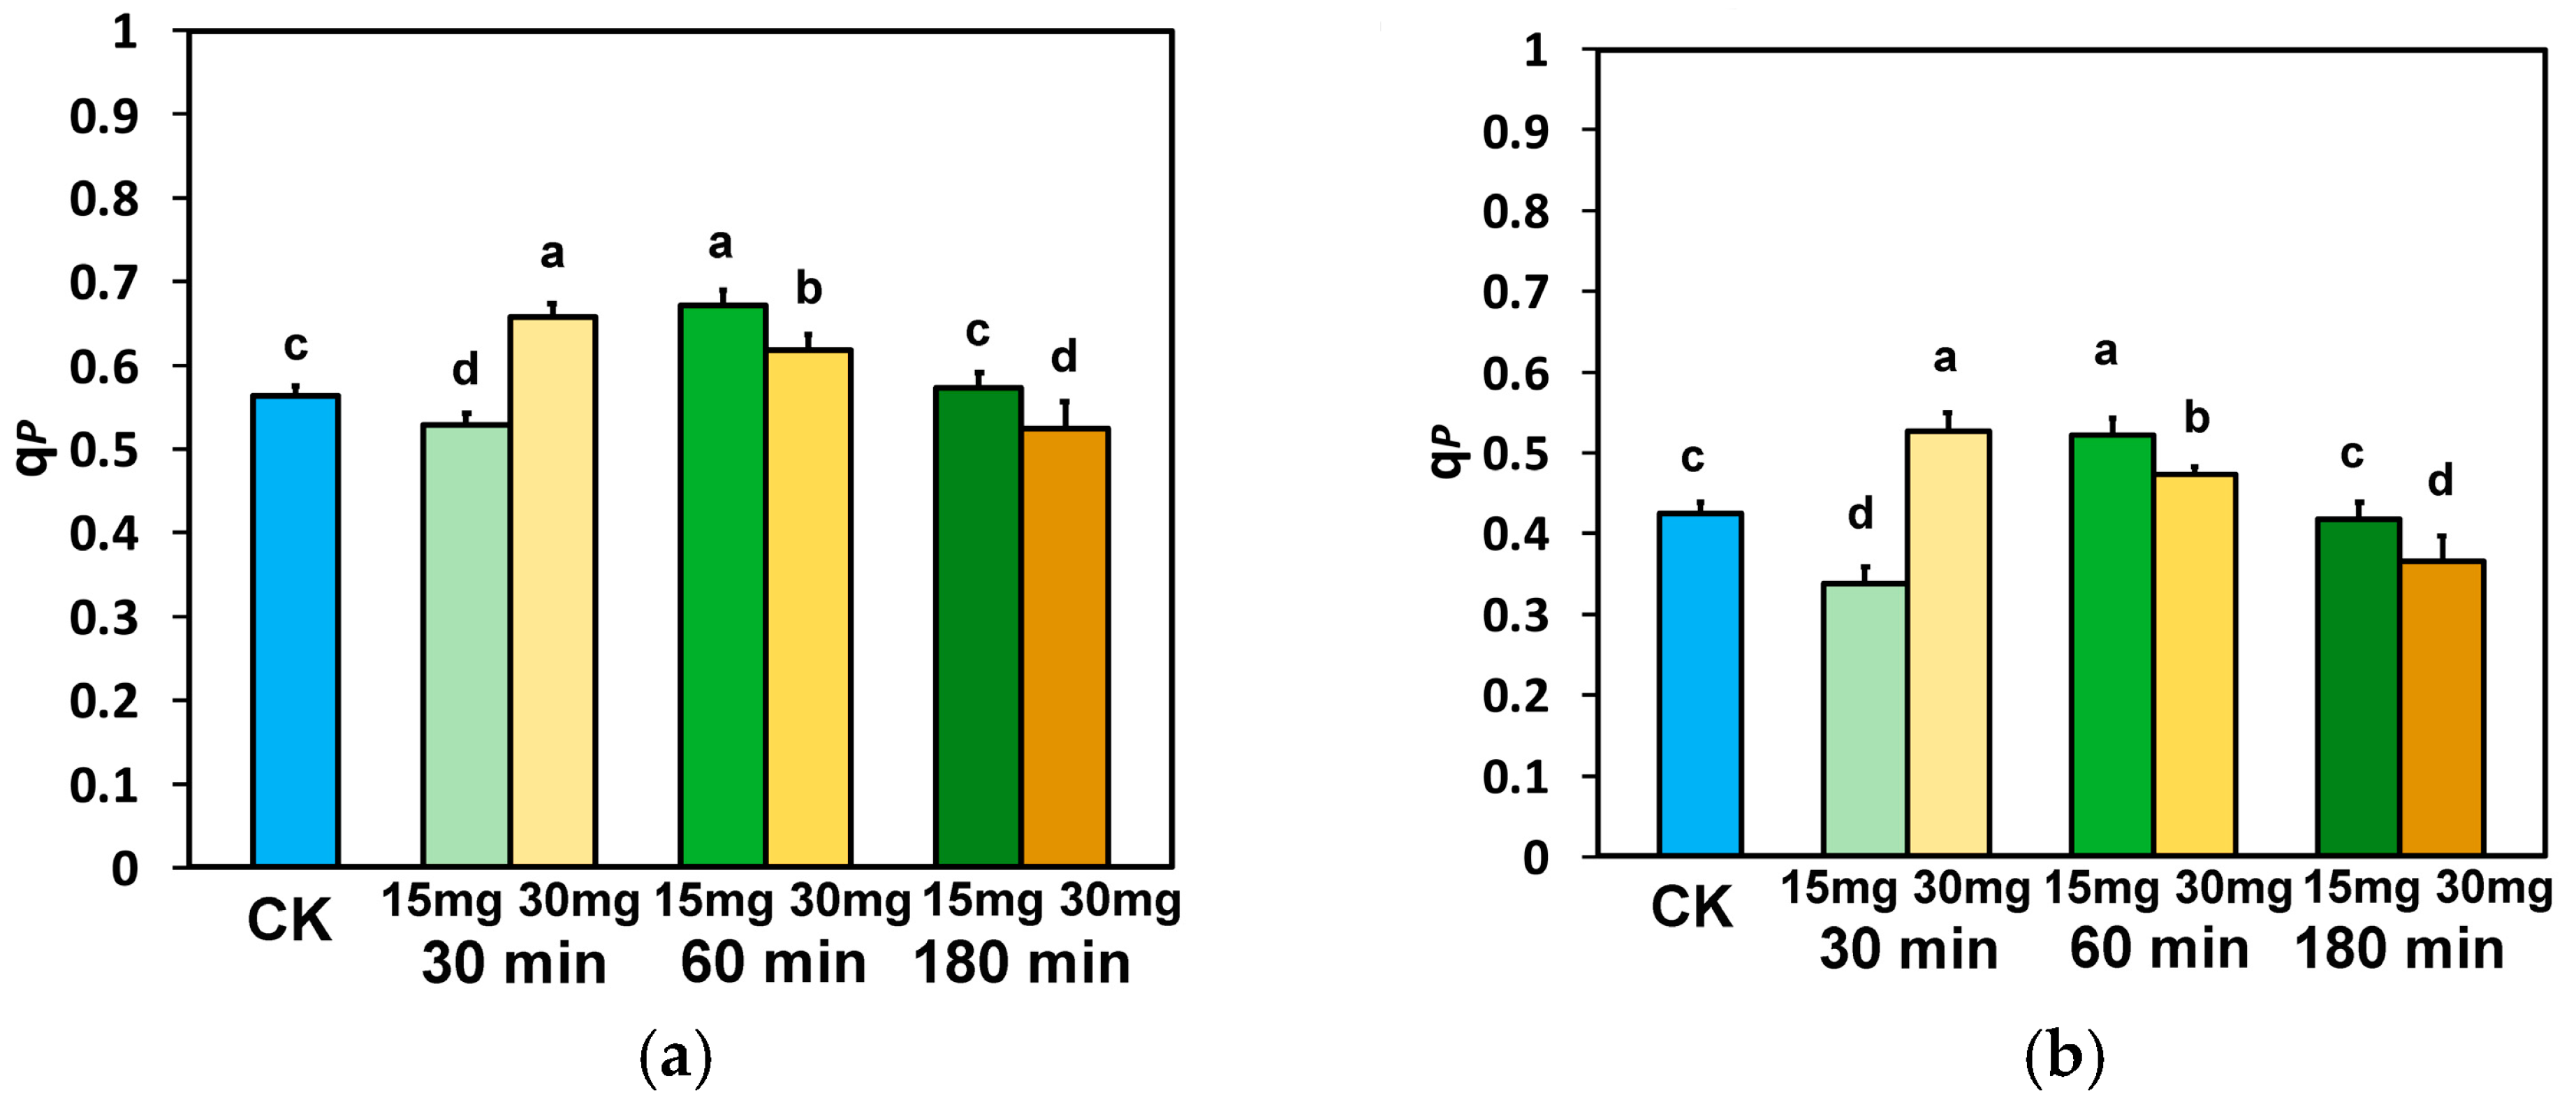
3.4. The Fraction of Open PSII Reaction Centers and the Electron Transport Efficiency in Tomato Leaflets Sprayed with Zinc-Doped Ferrite Nanoparticles

The fraction of open PSII rection centers (RCs) (qp), after 30 min exposure to 15 mg L−1 ZnFer NPs, at both light intensities, decreased significantly (Figure 5a,b), while with 30 mg L−1 zinc ferrite NPs, qp increased significantly, compared to control plants (Figure 5a,b). However, after 60 min exposure to 15 mg L−1 ZnFer NPs, qp at both light intensities was higher than exposure to 30 mg L−1 zinc ferrite NPs and in control plants (Figure 5a,b). After 180 min exposure to 15 mg L−1 ZnFer NPs, qp was higher at both light intensities compared to exposure to 30 mg L−1 zinc ferrite NPs and equal to the level of control plants (Figure 5a,b).
The electron transport rate (ETR), after 30 min exposure to 15 mg L−1 ZnFer NPs, at both light intensities, decreased significantly, while with 30 mg L−1 zinc ferrite NPs, ETR increased significantly at both light intensities, compared to control plants (Figure 6a,b).
On the contrary, 60 min after exposure to 15 mg L−1 ZnFer NPs, ETR increased significantly at the GLI compared to control plants and was equal to controls at the HLI, while with 30 mg L−1 ZnFer NPs, ΦPSII returned to control values at both light intensities (Figure 6a,b). Further exposure time (180 min), at both light intensities, resulted in a decreased ETR at both concentrations compared to control plants (Figure 6a,b). However, at both light intensities, tomato plants after 180 min exposure to 15 mg L−1 ZnFer NPs retained higher ETR values compared to exposure to 30 mg L−1 ZnFer NPs, but the values were still lower than the control values (Figure 6a,b).

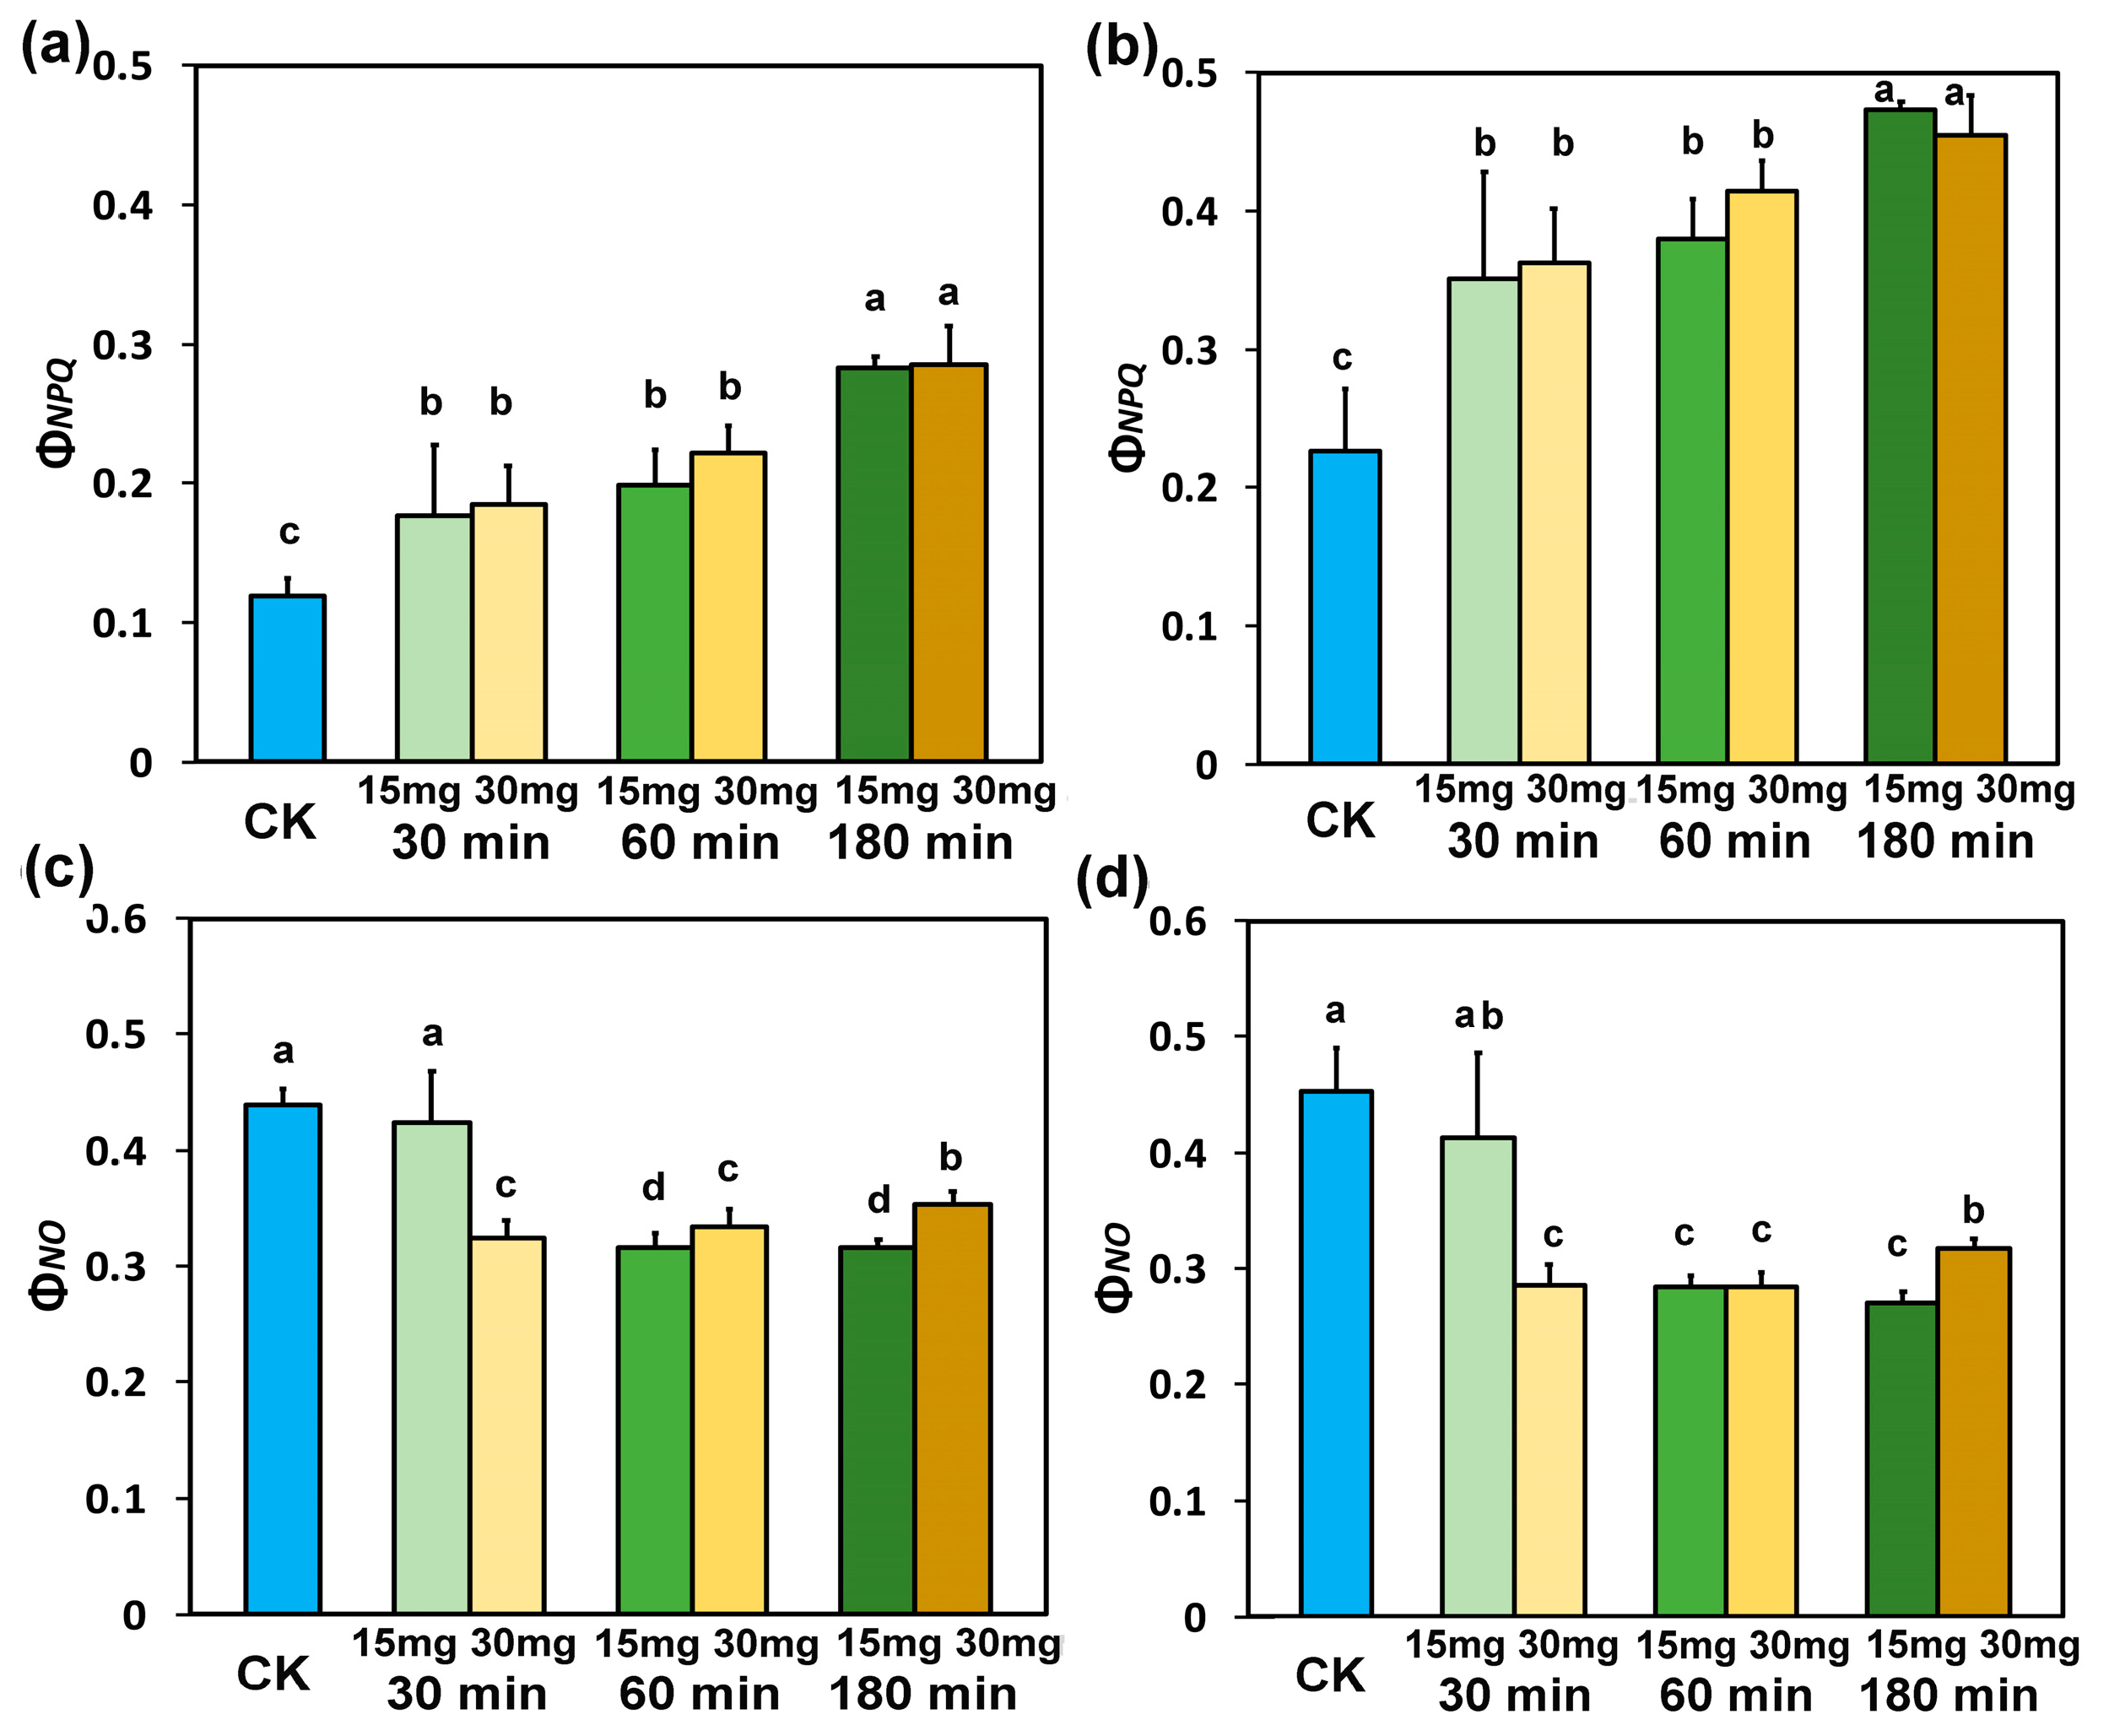
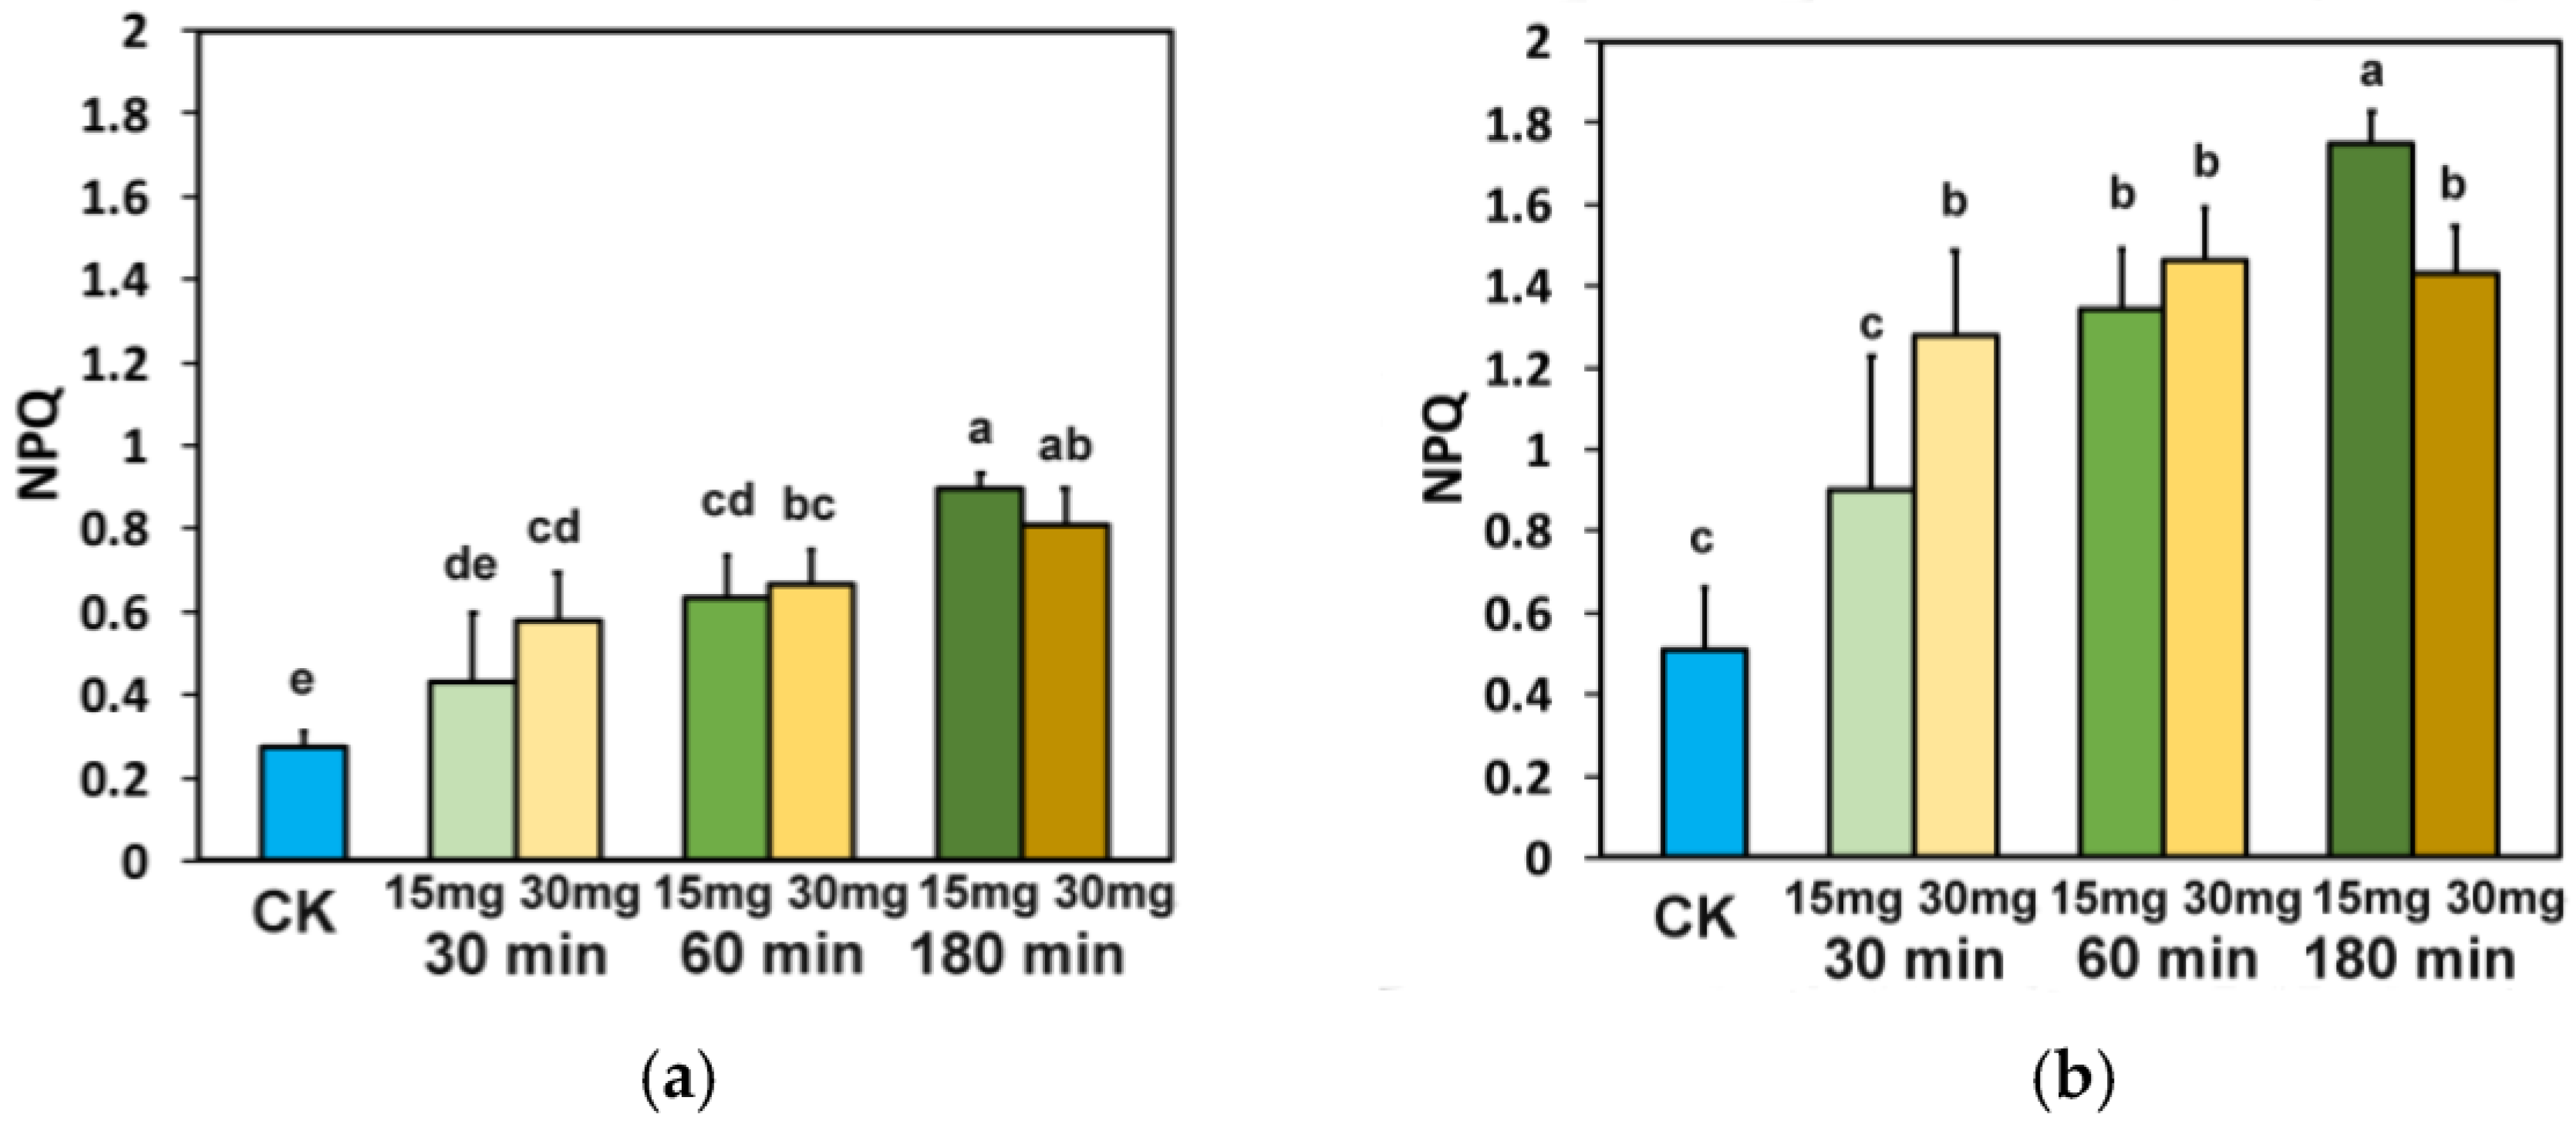
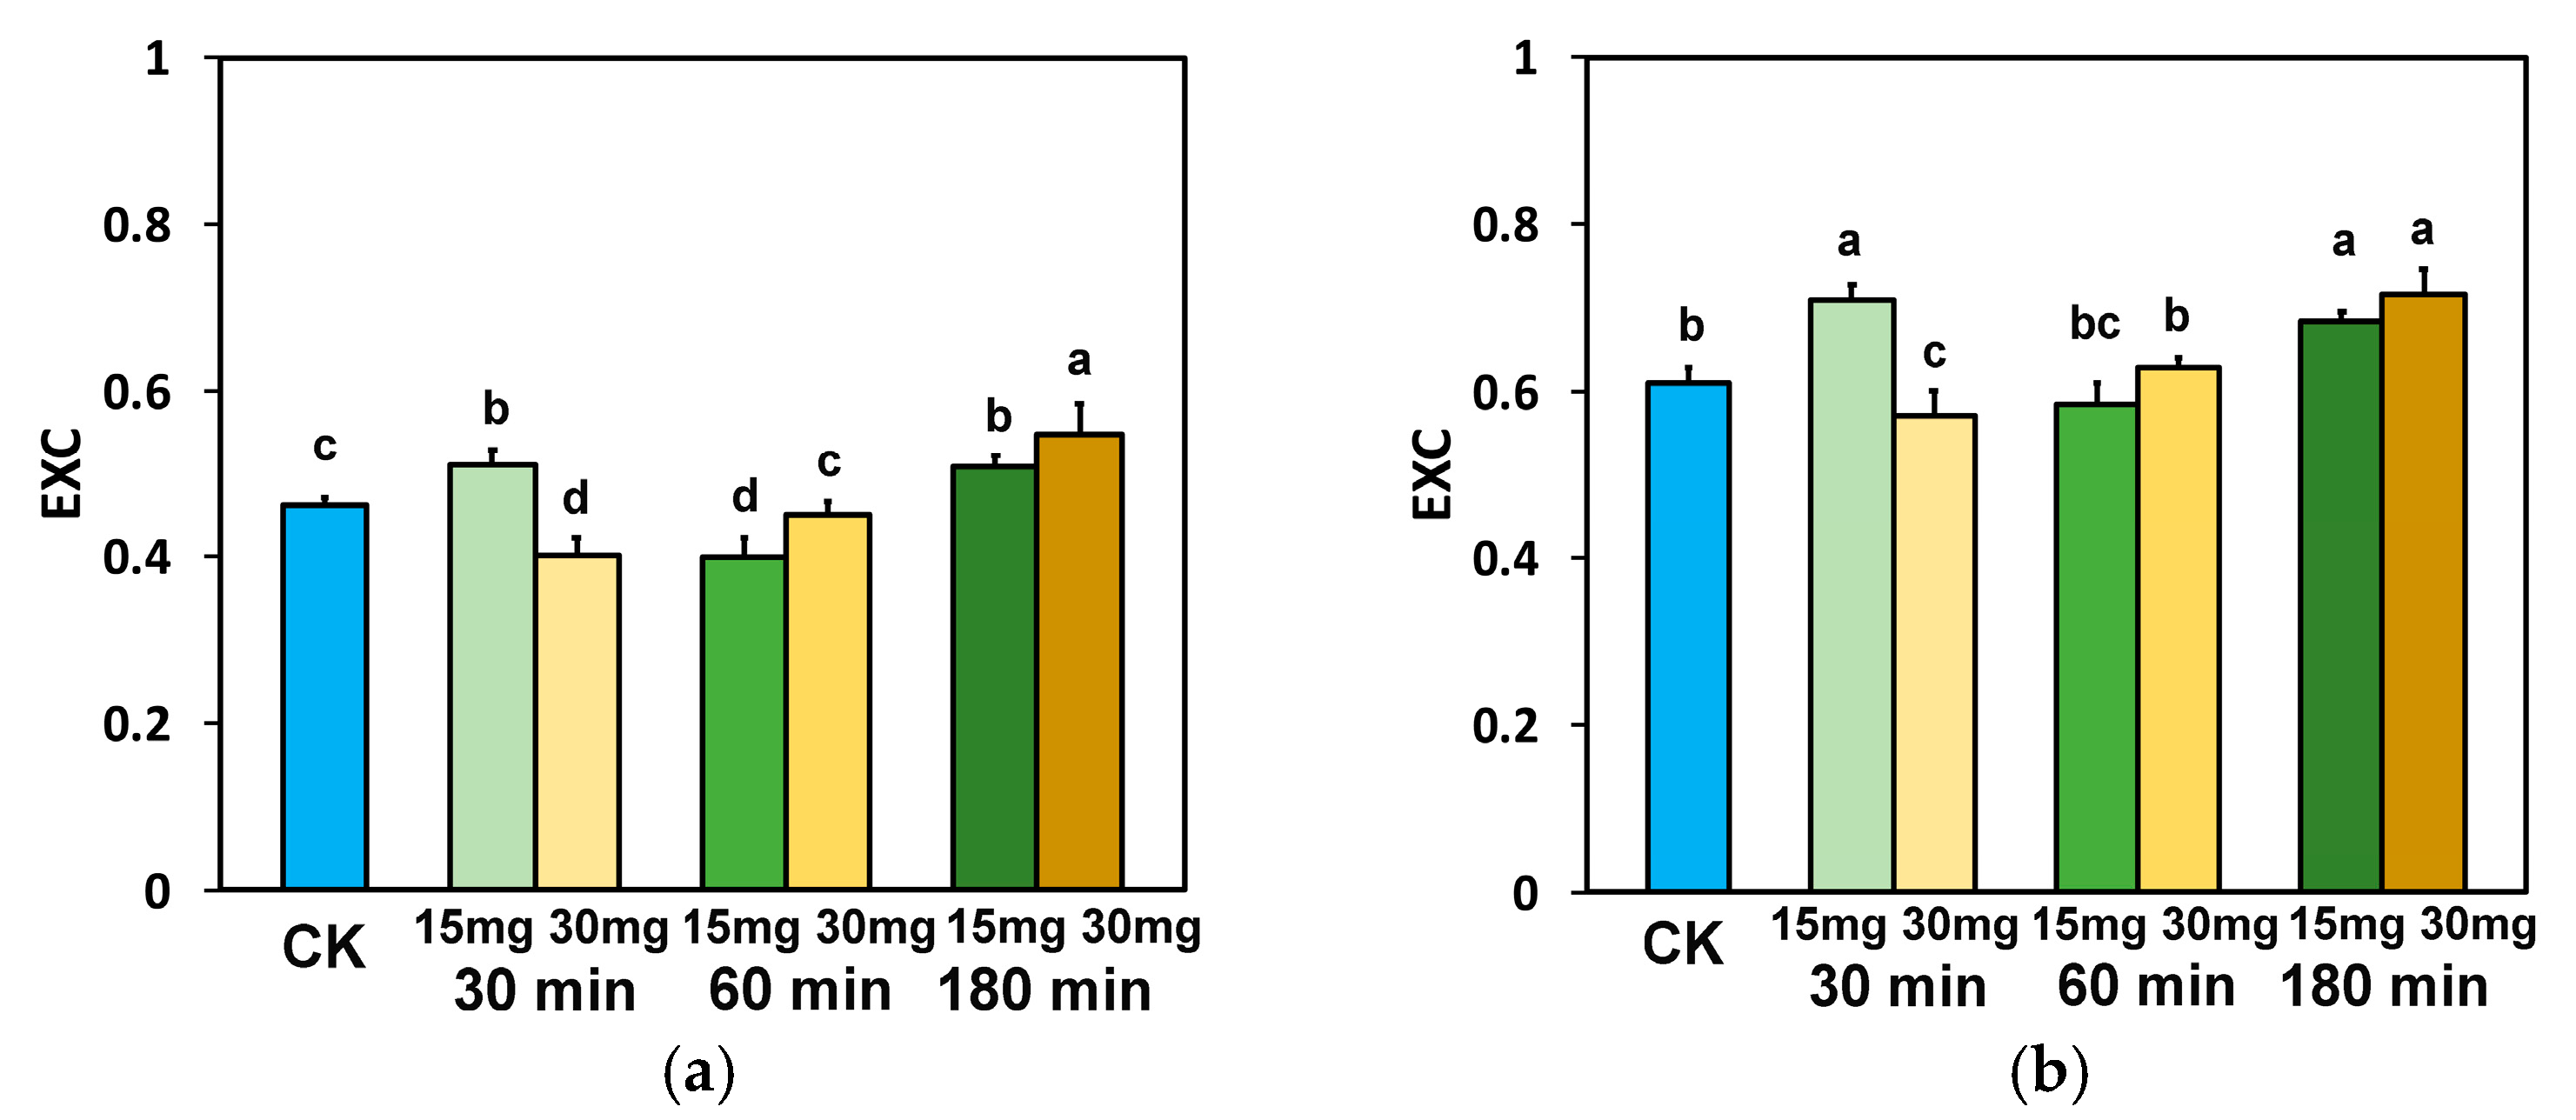
3.5. Impact of Zinc-Doped Ferrite Nanoparticles on the Efficiency of PSII Reaction Centers and the Non-Photochemical Quenching

The efficiency of the open PSII RCs (Fv′/Fm′) at the GLI, after exposure for 30 min, 60 min, and 180 min to 15 and 30 mg L−1 ZnFer NPs, decreased significantly compared to control plants (Figure 7a). The same trend for Fv′/Fm′ was observed at the HLI (Figure 7b), with the only exception being after 30 min exposure to 15 mg L−1 ZnFer NPs, in which Fv′/Fm′ did not differ significantly from control plants (Figure 7b).
The non-photochemical quenching (NPQ), at both light intensities, with both ZnFer NPs concentrations, and under all exposure treatments, increased significantly compared to control plants (Figure 8a,b), with the only exception being after 30 min exposure to 15 mg L−1 ZnFer NPs at both light intensities, in which NPQ did not differ significantly compared to control plants (Figure 8b).

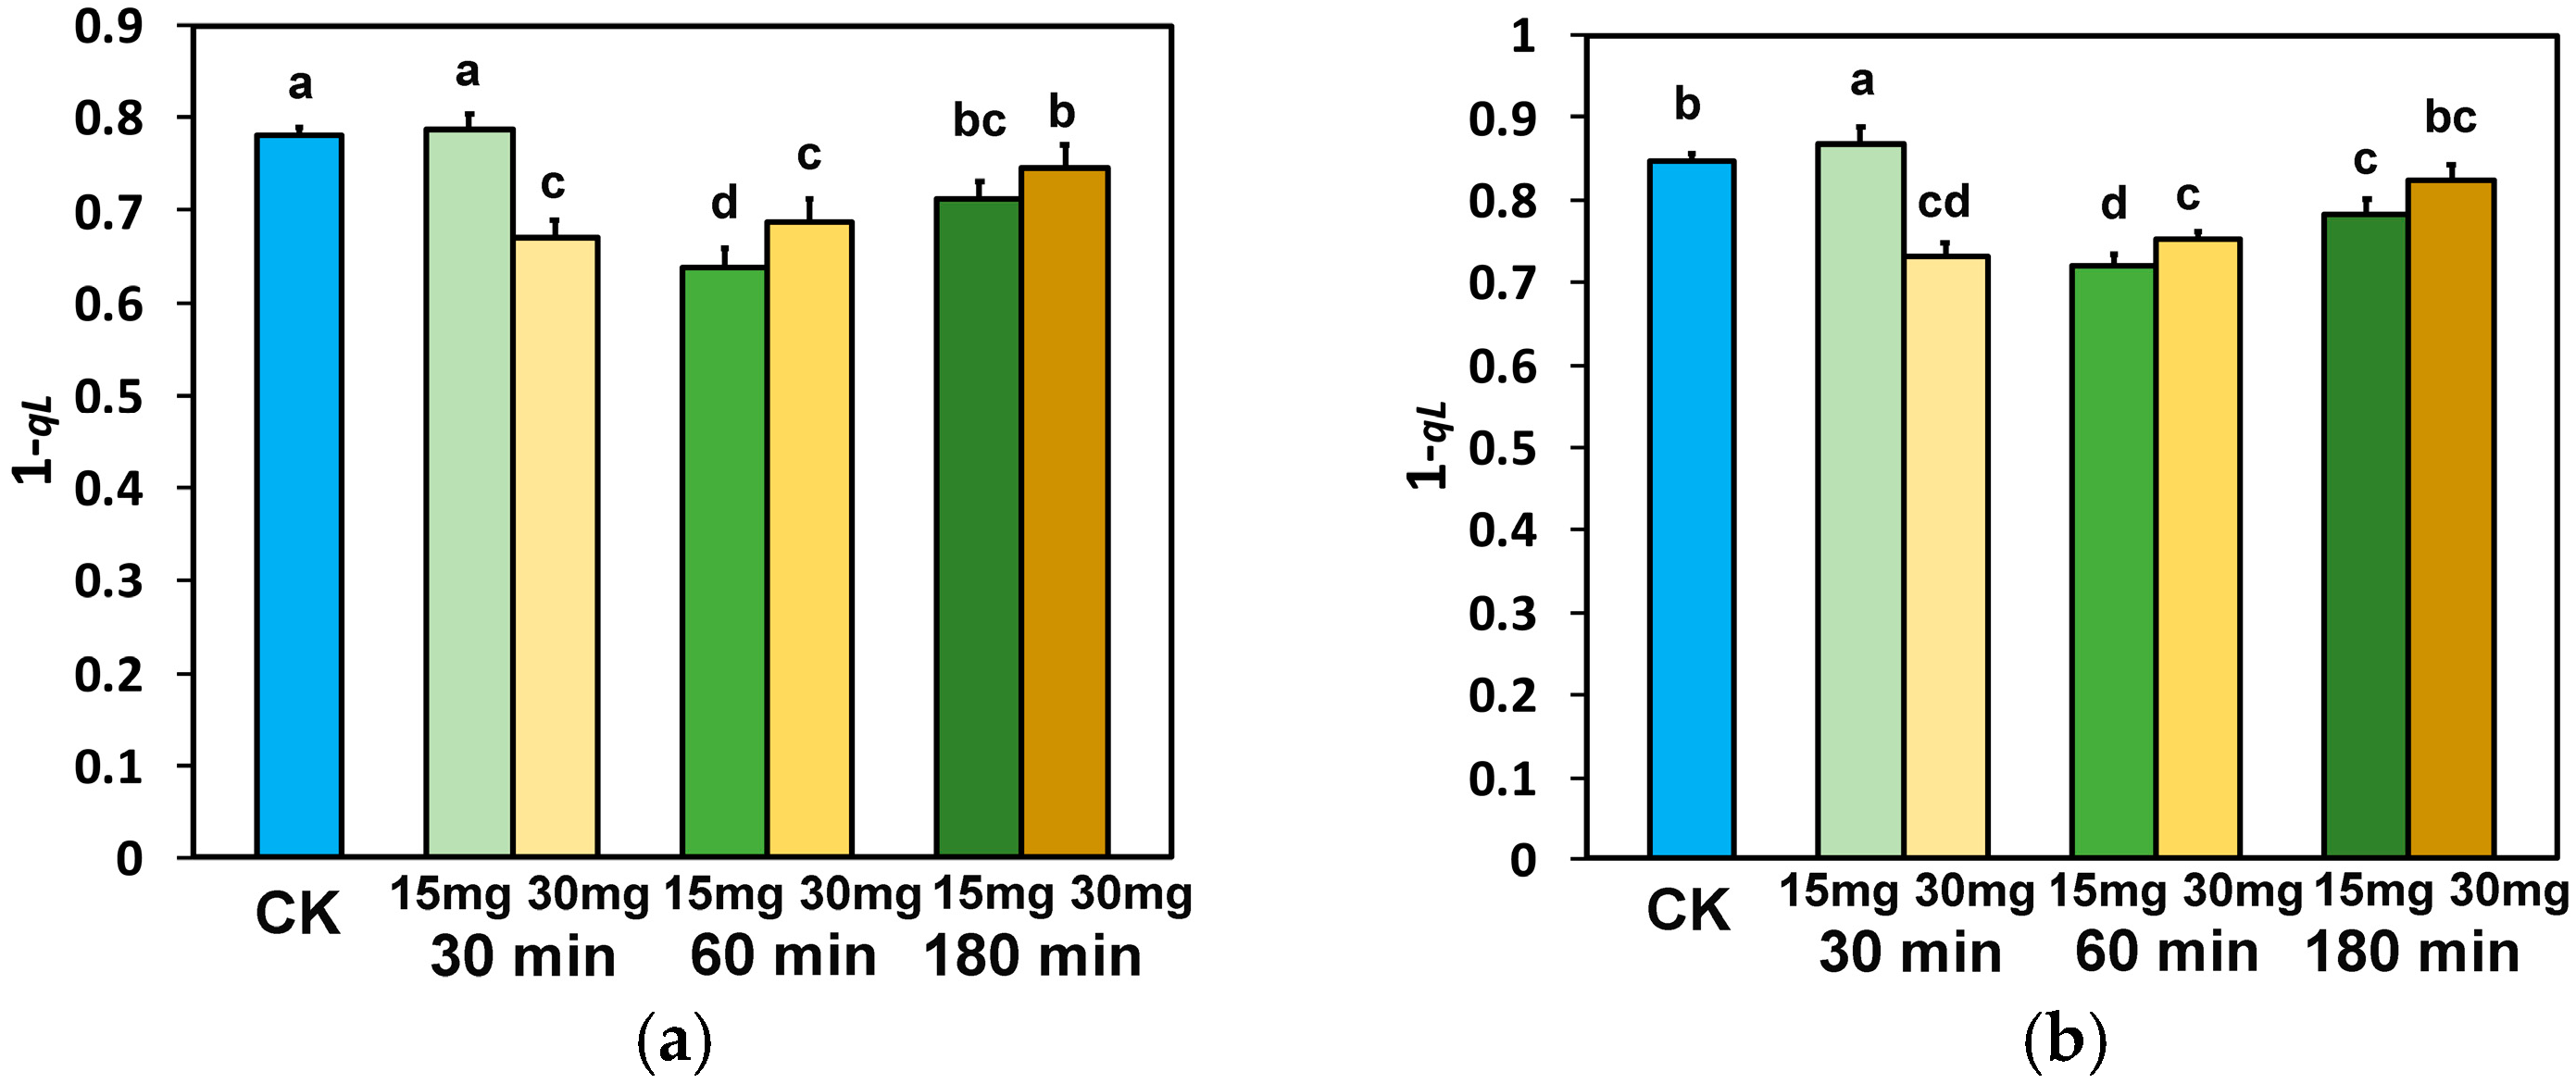
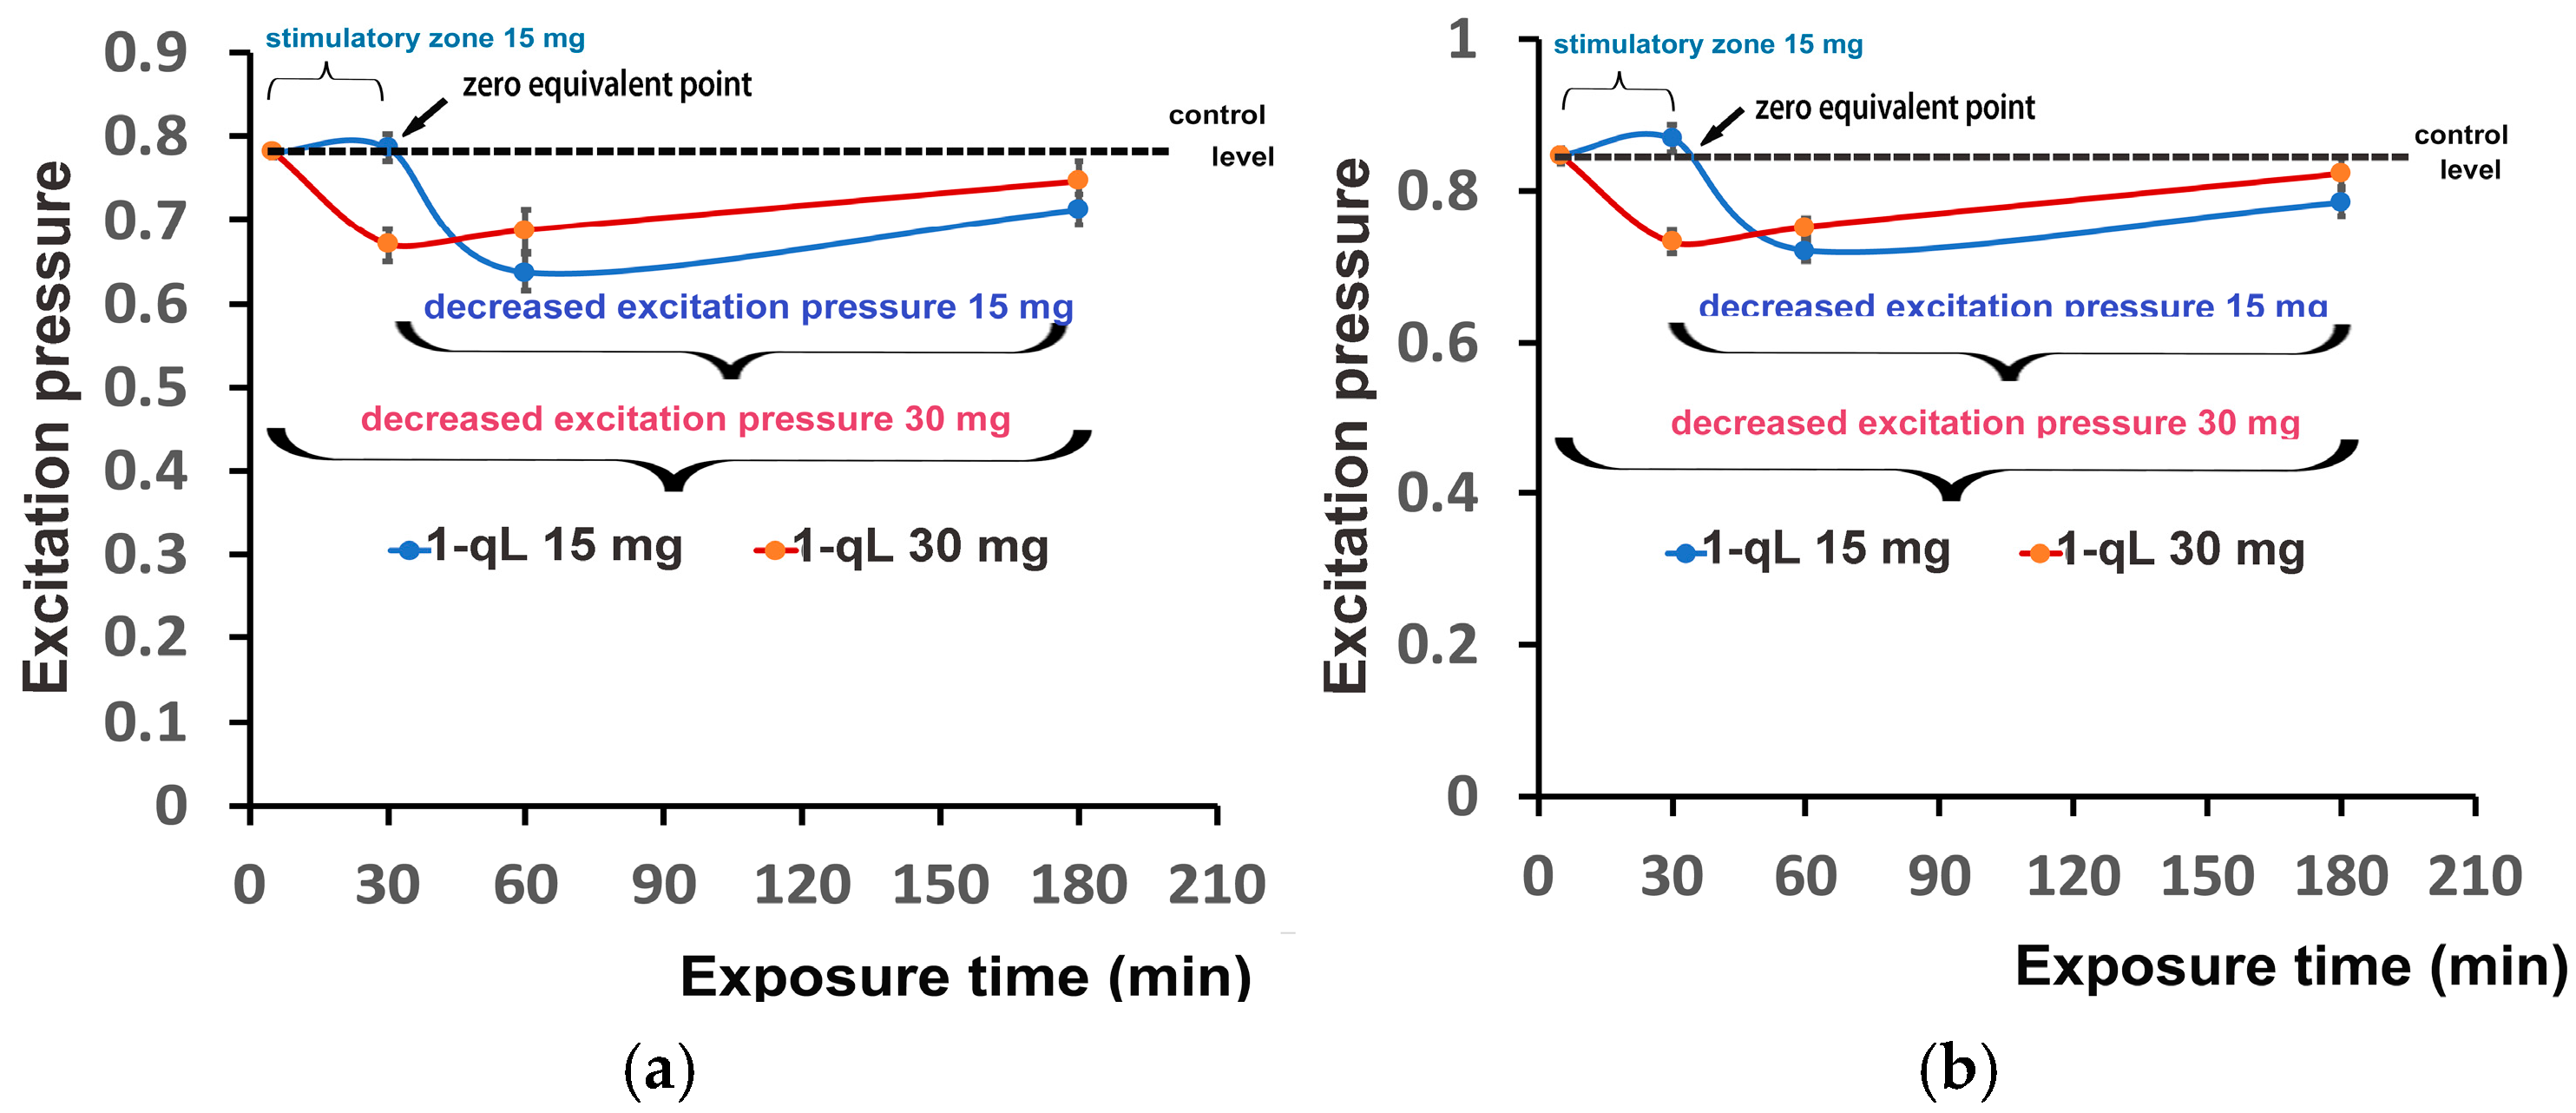
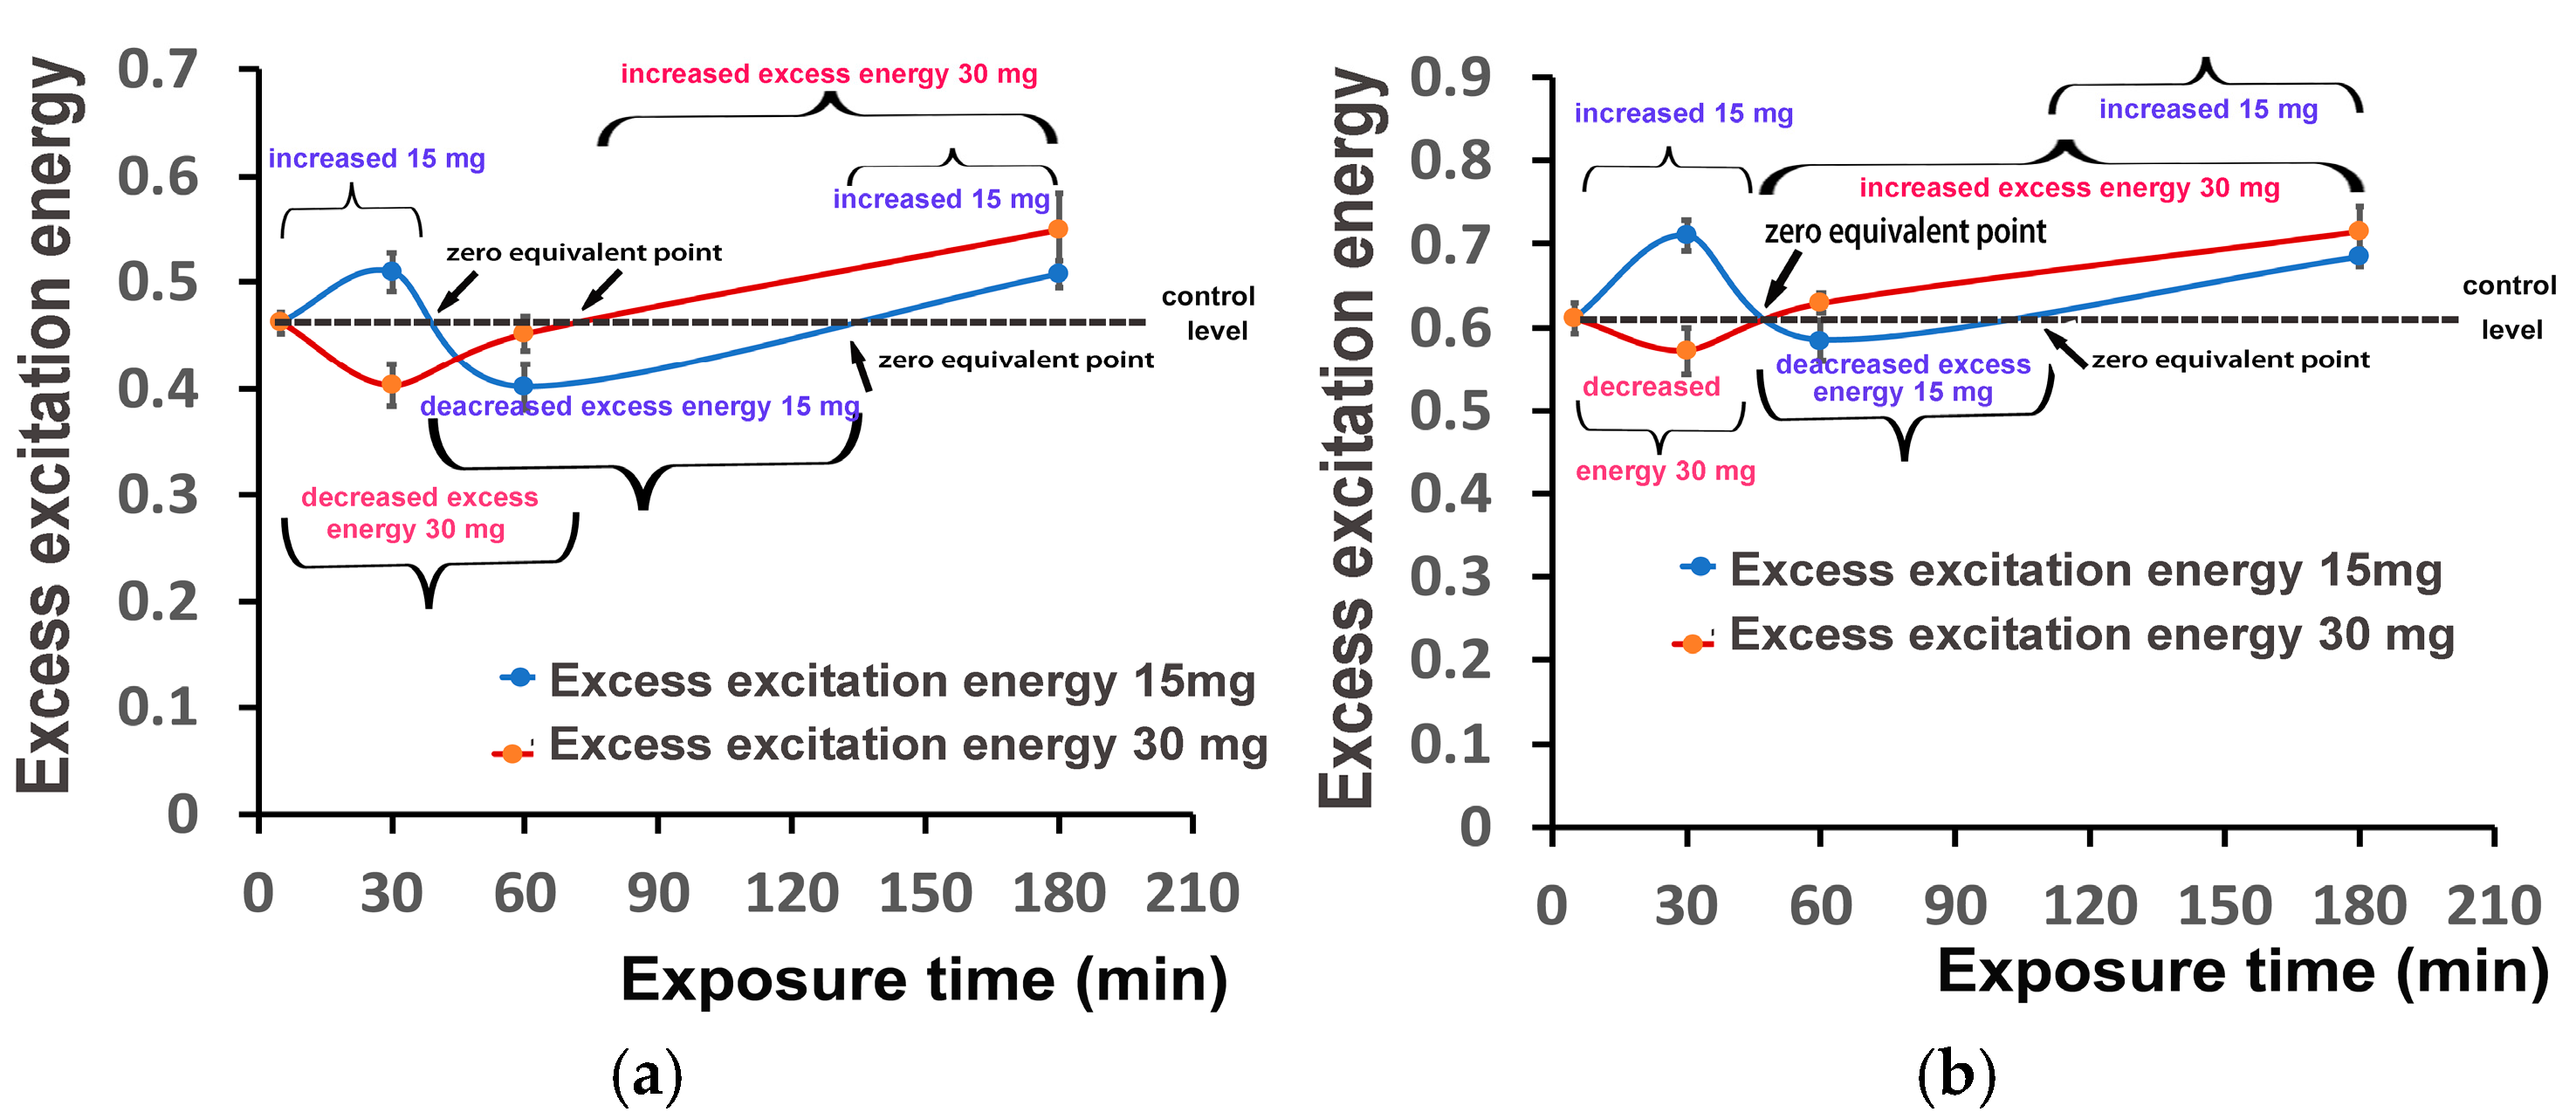
3.6. Impact of Zinc-Doped Ferrite Nanoparticles on PSII Excitation Presure and on Excess Excitation Energy at PSII

The excitation pressure at PSII (1−qL) at the GLI, after 30 min exposure to 15 mg L−1 ZnFer NPs, remained equal to control plants, while at all other treatments it was decreased compared to control plants (Figure 9a). At the HLI, after 30 min exposure to 15 mg L−1 ZnFer NPs, 1−qL increased compared to control plants (Figure 9b), but at all other treatments it was decreased compared to control plants, except it remained equal to control plants in the case of 180 min exposure to 30 mg L−1 ZnFer NPs (Figure 9b).
The excess excitation energy at PSII (EXC), at both light intensities, after 30 min exposure to 15 mg L−1 ZnFer NPs, increased compared to control plants, while with 30 mg L−1 ZnFer NPs it decreased compared to control plants (Figure 10a,b). After 60 min exposure at GLI, EXC decreased with exposure to 15 mg L−1 ZnFer NPs or remained equal to control plants with exposure to 30 mg L−1 ZnFer NPs (Figure 10a). At HLI, EXC remained equal to control plants with both ZnFer NPs treatments (Figure 10b). After 180 min exposure to both ZnFer NPs concentrations, EXC at both light intensities increased compared to control plants (Figure 10a,b).

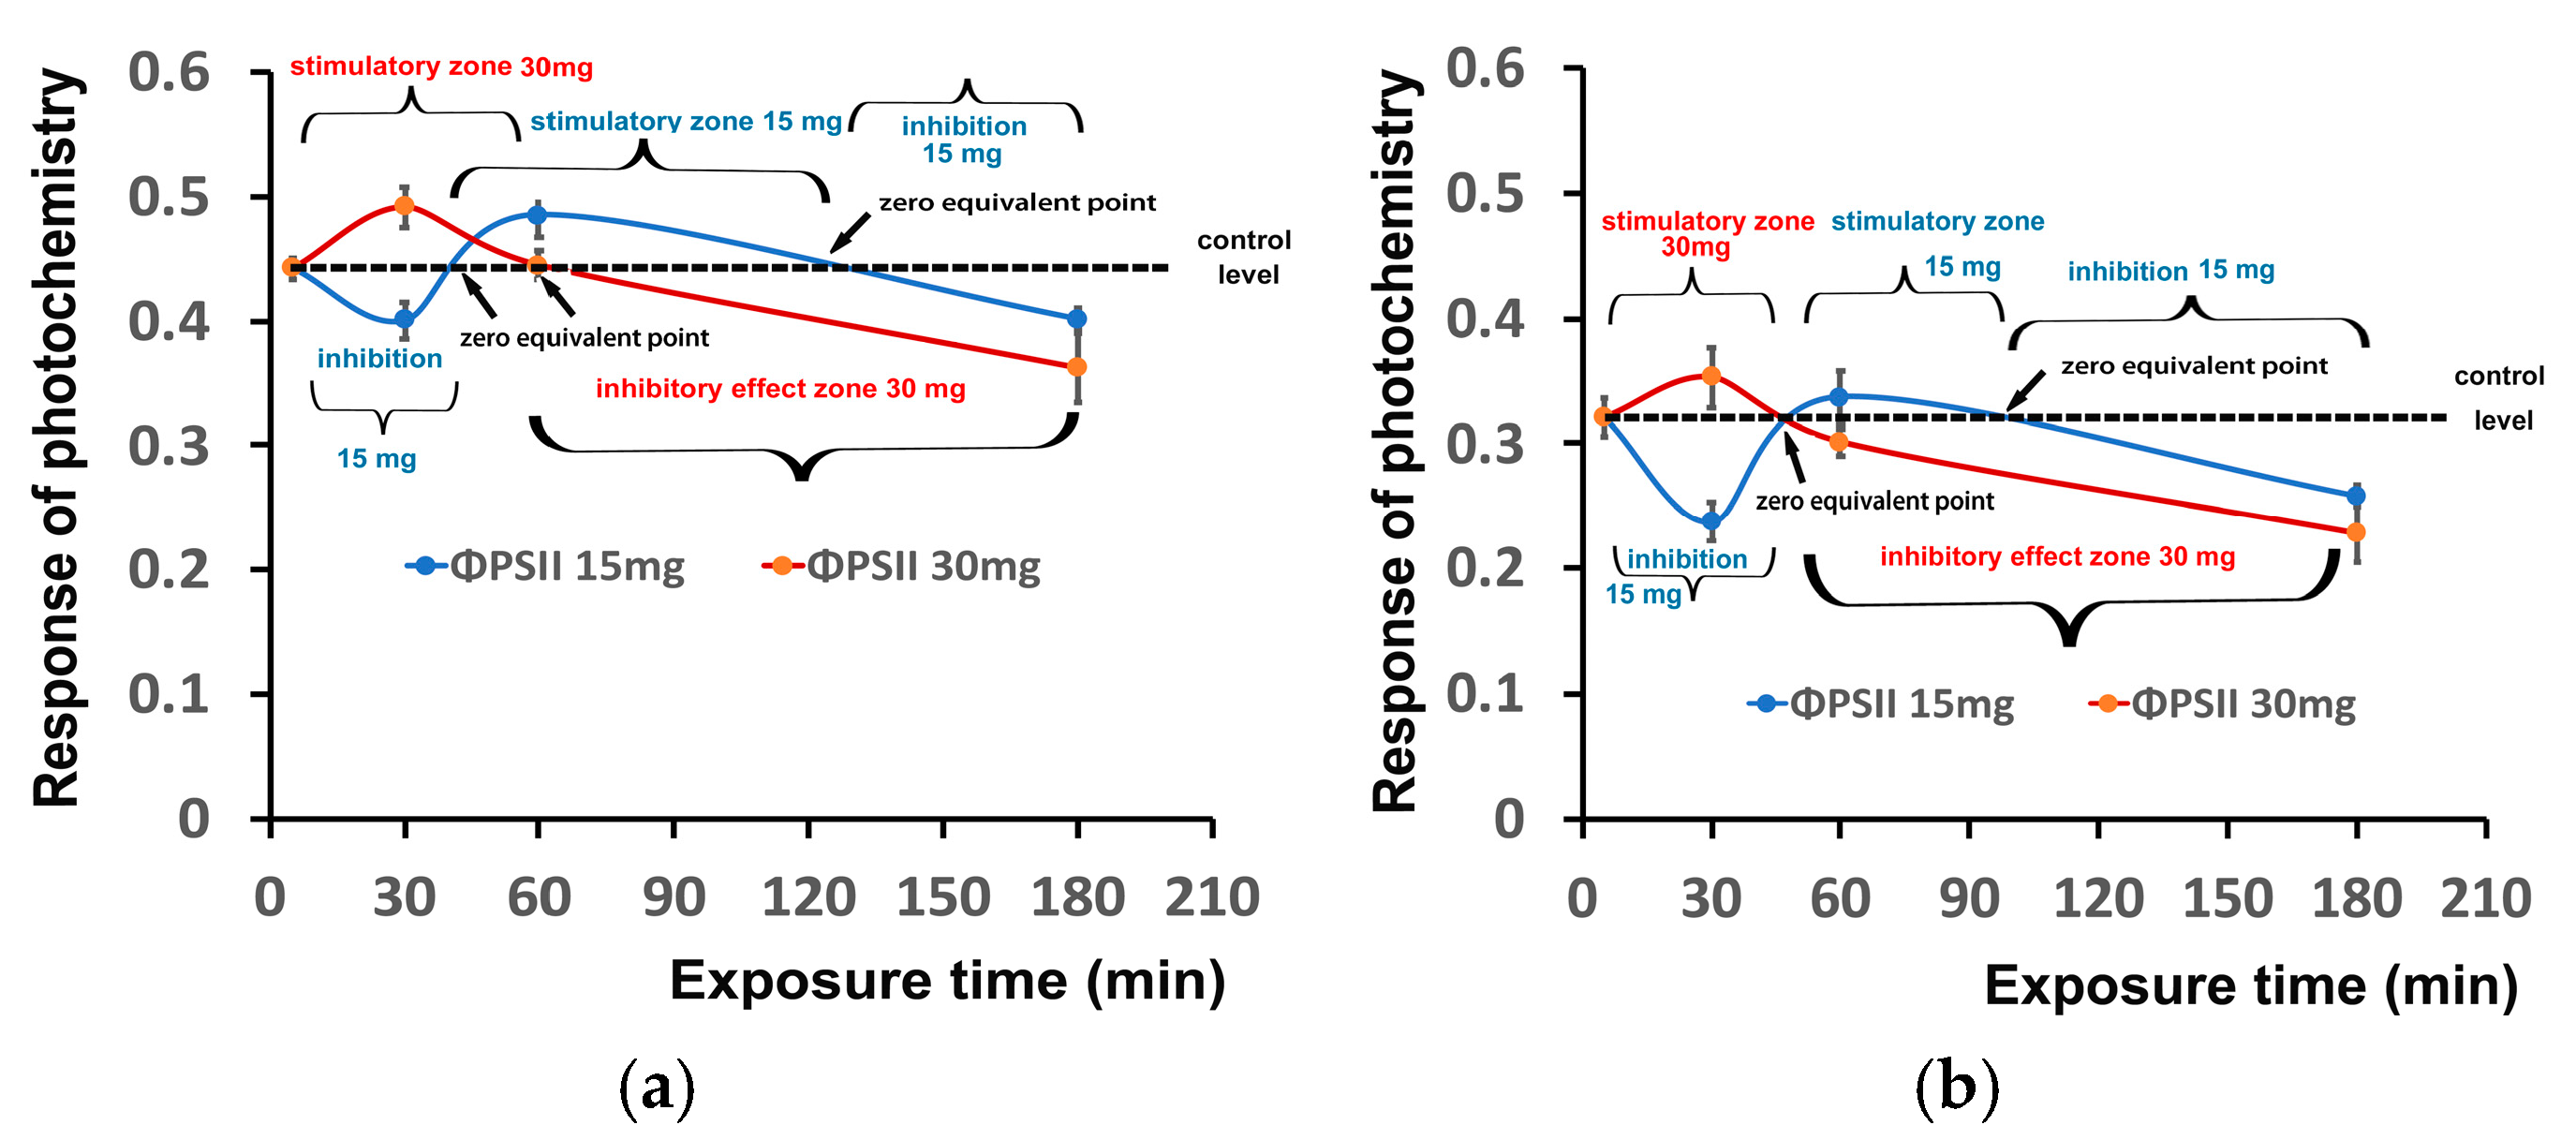
3.7. Hormetic Responses of Photosystem II in Tomato Leaflets Sprayed with Zinc-Doped Ferrite Nanoparticles

The response of PSII photochemistry in tomato leaves to foliar spray with 15 and 30 mg L−1 ZnFer NPs, evaluated by the quantum yield of PSII photochemistry (ΦPSII) at the GLI and at the HLI, showed a time-dependent biphasic hormetic response. These biphasic hormetic response curves, which were almost similar at the GLI (Figure 11a) and at the HLI (Figure 11b), were characterized by a short-time (30 min) inhibitory effect by the low dose (15 mg L−1 ZnFer NPs) and by a stimulatory effect by the high dose (30 mg L−1 ZnFer NPs). At a longer period (60 min), a stimulatory effect was observed by the low dose and an inhibitory effect was observed by the high dose. Further exposure time (180 min) resulted in an inhibitory effect of PSII function at both concentrations. The stimulatory effect by 15 mg L−1 ZnFer NPs at the HLI after 60 min exposure was to a lesser extent and a shorter time duration (Figure 11b) than the stimulatory effect observed at the GLI (Figure 11a).
The time-dependent response curves of the excitation pressure (1−qL) in tomato leaves to foliar spray with 15 and 30 mg L−1 ZnFer NPs are displayed in Figure 12a for the GLI and in Figure 12b for the HLI. The response curves, which were almost similar at the GLI (Figure 12a) and at the HLI (Figure 12b), were characterized up to 30 min exposure time by an increased excitation pressure with the low dose (15 mg L−1 ZnFer NPs) and by a reduced excitation pressure up to 180 min exposure time with the high dose (30 mg L−1 ZnFer NPs). Further exposure time (from 30 to 180 min) of tomato leaves at the low dose (15 mg L−1 ZnFer NPs) reduced the excitation pressure (Figure 12a,b).
The time-dependent biphasic response curve of the excess excitation energy at the GLI (Figure 13a) was characterized (compared to control plants) to up to ~45 min exposure time by an increased excess excitation energy with the low ZnFer NPs dose, while at longer than ~45 min exposure time, it was characterized by a decreased excess excitation energy up to ~130 min, and at longer exposure time, it was characterized by an increased excess excitation energy (Figure 13a). The response curve of the excess excitation energy to the high ZnFer NPs dose at the GLI was characterized up ~75 min exposure time by a decreased excess excitation energy, which increased at longer exposure time (Figure 13a). At the HLI, the response curve of the excess excitation energy with the low ZnFer NPs dose was characterized up ~45 min exposure time by an increased excess excitation energy that decreased later, compared to up to ~120 min exposure time for control plants, and increased thereafter (Figure 13b). The response curve of the excess excitation energy with the high ZnFer NPs dose at the HLI was characterized up ~45 min exposure time by a decreased excess excitation energy, compared to control plants, which increased thereafter (Figure 13b).

4. Discussion

Zinc doping in the ferrite system is expected to enhance the photocatalytic potential of nanoparticles primarily in terms of the absorption of UV light and less effectively concerning the utilization of visible light for photochemical or photocatalytic processes [82]. Indeed, the band gap of ZnFer NPs was found to be slightly larger than that of the bulk ZnFe2O4, attributed either to nanosize effect or to zinc deficiency. However, the ZnFer NPs studied here presented a hybrid ensemble, since PEG formed a robust shell on the surface of NPs (70% w/w). PEGylation, from the one side, allows for better transportation and absorption of the NPs through the plants’ membranes due to stealth characteristics, but from the other side, it acts as hindrance to their photocatalytic activity.
The ability of crops to maintain their photosynthetic efficiency under environmental changes or when attacked by antagonists is crucial for plants [24,38,83,84,85,86]. High photosynthetic rates in chloroplasts require efficient light energy use [87,88], and thus it is generally recognized that light energy use efficiency, which is influenced by both the leaf age and the light intensity [87], controls crop yields [17,89,90,91,92,93,94]. Increasing photosynthetic efficiency lies in optimizing the allocation of absorbed light energy [95] and remains an important challenge for plant scientists, principally identified by the global rising need for nutrition [96,97,98].
The absorbed light energy that is driven to photochemistry, also identified as the effective quantum yield of PSII photochemistry (ΦPSII), was enhanced after 30 min exposure to 30 mg L−1 ZnFer NPs, compared to controls (Figure 3a,b). This was due to the increased fraction of open PSII reaction centers (RCs) (Figure 5a,b). However, at the same exposure period, ΦPSII decreased with exposure to 15 mg L−1 ZnFer NPs (Figure 3a,b) due to a reduced fraction of open PSII RCs (Figure 5a,b). The decline in ΦPSII can be ascribed (i) to a lower fraction of open PSII RCs (qp) or (ii) to a reduced efficiency of the RCs (Fv′/Fm′) [99]. After 60 min exposure, the reverse phenomenon occurred, with increased ΦPSII with exposure to 15 mg L−1 ZnFer NPs (Figure 3a,b) due to an increased fraction of open PSII RCs (Figure 5a,b), which was equal to control plants and ΦPSII with exposure to 30 mg L−1 ZnFer NPs, despite the increased fraction, compared to controls, of open PSII RCs (Figure 5a,b), but having a reduced efficiency of open PSII RCs (Fv′/Fm′) (Figure 7a,b). The decreased ΦPSII after 180 min exposure to both concentrations at both light intensities (Figure 3a,b) was overcompensated by the increased non-photochemical energy loss in PSII (ΦNPQ) (Figure 4a,b) and, as a result, the non-regulated energy loss in PSII (ΦNO) decreased with both concentrations and at both light intensities compared to controls (Figure 4c,d). The non-regulated energy loss in PSII (ΦNO) represents the creation of singlet oxygen (1O2) via the triplet state of chlorophyll (3chl*) [100,101,102,103].
The photoprotective mechanism of non-photochemical quenching (NPQ), by dissipating the excess light energy as heat, prevents ROS formation [25,79,104,105,106,107,108,109,110,111,112,113,114]. The increased NPQ after 180 min exposure period to both ZnFer NPs concentrations, at both light intensities (Figure 8a,b), decreased the 1O2 generation (Figure 4c,d), and the higher increase in NPQ with exposure to 15 mg L−1 ZnFer NPs, compared to 30 mg L−1 ZnFer NPs (Figure 8a,b), induced a higher decrease in 1O2 generation (Figure 4c,d). NPQ can be considered to be sufficient if it can keep the fraction of open PSII RCs (qp) to the same level as under control conditions, under any disruption of plant homeostasis [115,116]. In accordance with this, the higher increase in NPQ with exposure to 15 mg L−1 ZnFer NPs, compared to 30 mg L−1 ZnFer NPs, after 180 min exposure time (Figure 8a,b) seemed to be adequate to keep the same portion of open PSII RCs (qp) as in controls and resulted in a higher decrease in 1O2 generation (Figure 4c,d). Thus, the increased NPQ altered ROS homeostasis through decreased 1O2 formation. Nanoparticles can contribute positively to cellular functions and signaling by generating low levels of ROS [117]. ROS produced during the light reactions of photosynthesis play essential roles as regulatory molecules in signaling processes, activating the plant’s protective defense response to environmental stressors as a result of environmental changes and contributing to restoring the “oxidation–reduction” balance [34,118,119,120,121,122,123,124]. Oxidative damage under biotic or abiotic stress can be avoided by joined prevention mechanisms and ROS detoxification [125,126,127,128].
Despite an inhibitory effect on PSII function after 180 min exposure period to both ZnFer NPs concentrations (Figure 3a,b), the excitation pressure at PSII (1−qL) was reduced (Figure 9a,b) due to the decreased generation of singlet oxygen (1O2) (Figure 4c,d) triggered by NPQ. Thus, foliar spray with ZnFer NPs caused an enhancement in NPQ, compared to control plants, which resulted in reducing the excitation pressure at PSII (1−qL) (Figure 9a,b).
Photosynthetic water oxidation is carried out in the OEC, which is located on the electron donor side of PSII, and consists of the so-called Mn4CaO5 cluster [129,130,131]. The electrons and protons produced by water oxidation are used to transform the light energy to ATP and NADPH for the synthesis of organic biomolecules needed by organisms [131,132]. The decreased efficiency of PSII photochemistry (Fv/Fm) 180 min after exposure to 30 mg L−1 ZnFer NPs, (Figure 2a) was related to the decreased efficiency of the OEC (Figure 2b), as judged from the ratio Fv/Fo [87,133,134,135,136,137,138,139,140]. A decreased efficiency of the OEC results in a decline in the Fv/Fm ratio [54,141,142], which represents the degree of plant photoinhibition [143]. Photoinhibition occurs when the light energy captured by light-harvesting complexes is in excess of what can be consumed by photochemistry, or dissipated safely by NPQ, or when the primary cause is the excitation of Mn in the OEC by photons [144,145,146,147,148,149,150]. Photoinhibition has been linked to a malfunction of the OEC [151,152,153,154]. If the OEC does not properly reduce the primary electron acceptor, then it can cause damaging oxidations at PSII [154,155,156,157].
The response of PSII photochemistry of tomato leaves to foliar spray with 15 and 30 mg L−1 ZnFer NPs, evaluated by the quantum yield of PSII photochemistry (ΦPSII) at the GLI (Figure 11a) and at the HLI (Figure 11b), showed a time-dependent biphasic hormetic response. This biphasic hormetic response curve was characterized by a short-time (30 min) inhibitory effect by a low dose (15 mg L−1 ZnFer NPs) and by a stimulatory effect by a high dose (30 mg L−1 ZnFer NPs). At longer period (60 min), a stimulatory effect was observed by the low dose and an inhibitory effect was observed by the high dose. Further exposure time resulted in an inhibitory effect of PSII function at both concentrations. Additionally, ZnFer nanoparticles showed an enhanced magnetization value of 104 emu/g compared to PEGylated zinc ferrite nanoparticles (Ms = 50 emu/g) reported in another study for MRI applications [158]. Their strong magnetic properties may influence the generation of ROS, which can either act as signaling molecules or cause oxidative stress. Excess ROS can damage PSII by oxidizing proteins and pigments involved in light harvesting, leading to photoinhibition [35]. The hormesis response of photosynthetic function has been reported to be triggered by the NPQ mechanism [37,42,45,79]. Hormesis appears to depend on the type of nanomaterial, with the same concentration inducing different responses with different nanomaterials [159].
The decreased ΦPSII 180 min after foliar spray of tomato plants with ZnFer NPs (Figure 3a,b) resulted in a decreased ETR (Figure 6a,b), causing an increased excess excitation energy (EXC) (Figure 10a,b). Factors restricting ETR in plants result in the accumulation of excess excitation energy (EXC) at PSII [160,161,162].

5. Conclusions

The response of PSII photochemistry of tomato leaves to ZnFer NPs foliar spray showed a time-dependent biphasic hormetic response, characterized by a short-time inhibitory effect by the low dose and stimulatory effect by the high dose, while at a longer exposure period, a stimulatory effect was observed by the low dose and an inhibitory effect was observed by the high dose. An inhibitory effect on PSII function was observed after more than ~120 min exposure period to both ZnFer NPs concentrations. We may conclude that the synthesized ZnFer NPs, despite their ability to induce hormesis of PSII photochemistry, cannot be used as photosynthetic biostimulants. These findings align with previous results that showed both beneficial and detrimental effects of various metal oxide NPs (including zinc ferrites) on tomato fruit quality and suggested the need for caution in their applications in crops [4]. However, the results contribute valuable insights into understanding the biphasic response and the time-dependent thresholds at which NPs transition from being stimulatory to inhibitory, providing critical knowledge for future research on nanomaterials with improved functionality and reduced adverse effects.

Supplementary Materials

The following supporting information can be downloaded at: https://www.mdpi.com/article/10.3390/nano15040288/s1, Figure S1: Rietveld refinement analysis of the XRD pattern of ZnFer NPs; Figure S2: UV–Vis spectrum and Tauc plot diagram of ZnFer NPs; Table S1: Definitions of the chlorophyll fluorescence parameters.

Author Contributions

Conceptualization, C.D.-S. and M.M.; methodology, K.G., I.S., J.M., O.A., C.D.-S. and M.M.; software, K.G., I.S., J.M. and O.A.; validation, C.D.-S. and M.M.; formal analysis, K.G., I.S., J.M. and O.A.; resources, C.D.-S. and M.M.; data curation, K.G., I.S., J.M., O.A., C.D.-S. and M.M.; writing—original draft preparation, K.G., I.S., J.M., C.D.-S. and M.M.; writing—review and editing, K.G., I.S., J.M., O.A., C.D.-S. and M.M.; supervision, C.D.-S. and M.M.; project administration, C.D.-S. and M.M. All authors have read and agreed to the published version of the manuscript.

Funding

This research project was implemented in the framework of H.F.R.I call “Basic research Financing (Horizontal support of all Sciences)” under the National Recovery and Resilience Plan “Greece 2.0” funded by the European Union—NextGenerationEU (H.F.R.I. Project Number: 15453).

Data Availability Statement

All data supporting the findings of this study are available within the paper and within its Supplementary Data published online.

Conflicts of Interest

The authors declare no conflicts of interest. The funders had no role in the design of the study; in the collection, analyses, or interpretation of data; in the writing of the manuscript; or in the decision to publish the results.

References

  1. Singh, A.; Tiwari, S.; Pandey, J.; Lata, C.; Singh, I.K. Role of nanoparticles in crop improvement and abiotic stress management. J. Biotechnol. 2021, 337, 57–70. [Google Scholar] [CrossRef] [PubMed]
  2. Silva, S.; Dias, M.C.; Pinto, D.C.G.A.; Silva, A.M.S. Metabolomics as a tool to understand nano-plant interactions: The case study of metal-based nanoparticles. Plants 2023, 12, 491. [Google Scholar] [CrossRef] [PubMed]
  3. Silva, S.; Ferreira de Oliveira, J.M.P.; Dias, M.C.; Silva, A.M.S.; Santos, C. Antioxidant mechanisms to counteract TiO2-nanoparticles toxicity in wheat leaves and roots are organ dependent. J. Hazard. Mater. 2019, 380, 120889. [Google Scholar] [CrossRef] [PubMed]
  4. Cantu, J.M.; Ye, Y.; Hernandez-Viezcas, J.A.; Zuverza-Mena, N.; White, J.C.; Gardea-Torresdey, J.L. Tomato fruit nutritional quality is altered by the foliar application of various metal oxide nanomaterials. Nanomaterials 2022, 12, 2349. [Google Scholar] [CrossRef] [PubMed]
  5. Tombuloglu, G.; Tombuloglu, H.; Slimani, Y.; Almessiere, M.A.; Baykal, A.; Bostancioglu, S.M.; Kirat, G.; Ercan, I. Effects of foliar iron oxide nanoparticles (Fe3O4) application on photosynthetic parameters, distribution of mineral elements, magnetic behaviour, and photosynthetic genes in tomato (Solanum lycopersicum var. cerasiforme) plants. Plant Physiol. Biochem. 2024, 210, 108616. [Google Scholar] [CrossRef]
  6. Tryfon, P.; Sperdouli, I.; Adamakis, I.-D.S.; Mourdikoudis, S.; Moustakas, M.; Dendrinou-Samara, C. Impact of coated zinc oxide nanoparticles on photosystem II of tomato plants. Materials 2023, 16, 5846. [Google Scholar] [CrossRef]
  7. Tryfon, P.; Sperdouli, I.; Adamakis, I.-D.S.; Mourdikoudis, S.; Dendrinou-Samara, C.; Moustakas, M. Modification of tomato photosystem II photochemistry with engineered zinc oxide nanorods. Plants 2023, 12, 3502. [Google Scholar] [CrossRef] [PubMed]
  8. Kim, J.-H.; Oh, Y.; Yoon, H.; Hwang, I.; Chang, Y.-S. Iron nanoparticle-induced activation of plasma membrane H+-ATPase promotes stomatal opening in Arabidopsis thaliana. Environ. Sci. Technol. 2015, 49, 1113–1119. [Google Scholar] [CrossRef]
  9. Abdelhameed, R.E.; Abu-Elsaad, N.I.; Abdel Latef, A.A.H.; Metwally, R.A. Tracking of zinc ferrite nanoparticle effects on pea (Pisum sativum L.) plant growth, pigments, mineral content and arbuscular mycorrhizal colonization. Plants 2021, 10, 583. [Google Scholar] [CrossRef] [PubMed]
  10. Nisticò, R.; Cesano, F.; Garello, F. Magnetic materials and systems: Domain structure visualization and other characterizationtechniques for the application in the materials science and biomedicine. Inorganics 2020, 8, 6. [Google Scholar] [CrossRef]
  11. Mohammed, L.; Gomaa, H.G.; Ragab, D.; Zhu, J. Magnetic nanoparticles for environmental and biomedical applications: A review. Particuology 2017, 30, 1–14. [Google Scholar] [CrossRef]
  12. Di, S.; Ning, T.; Yu, J.; Chen, P.; Yu, H.; Wang, J.; Yang, H.; Zhu, S. Recent advances and applications of magnetic nanomaterials in environmental sample analysis. Trends Anal. Chem. 2020, 126, 115864. [Google Scholar] [CrossRef]
  13. Targuma, S.; Njobeh, P.B.; Ndungu, P.G. Current applications of magnetic nanomaterials for extraction of mycotoxins, pesticides, and pharmaceuticals in food commodities. Molecules 2021, 26, 4284. [Google Scholar] [CrossRef]
  14. Nowak-Jary, J.; Płóciennik, A.; Machnicka, B. Functionalized magnetic Fe3O4 nanoparticles for targeted methotrexate delivery in ovarian cancer therapy. Int. J. Mol. Sci. 2024, 25, 9098. [Google Scholar] [CrossRef]
  15. Kumari, H.; Sonia; Suman; Ranga, R.; Chahal, S.; Devi, S.; Sharma, S.; Kumar, S.; Kumar, P.; Kumar, S.; et al. A review on photocatalysis used for wastewater treatment: Dye degradation. Water Air Soil Pollut. 2023, 234, 349. [Google Scholar] [CrossRef]
  16. Nguyen, T.B.; Doong, R. Fabrication of highly visible-light-responsive ZnFe2O4/TiO2 heterostructures for the enhanced photocatalytic degradation of organic dyes. RSC Adv. 2016, 6, 103428–103437. [Google Scholar] [CrossRef]
  17. Tryfon, P.; Sperdouli, I.; Moustaka, J.; Adamakis, I.-D.S.; Giannousi, K.; Dendrinou-Samara, C.; Moustakas, M. Hormetic response of photosystem II function induced by nontoxic calcium hydroxide nanoparticles. Int. J. Mol. Sci. 2024, 25, 8350. [Google Scholar] [CrossRef]
  18. Guo, H.; White, J.C.; Wang, Z.; Xing, B. Nano-enabled fertilizers to control the release and use efficiency of nutrients. Curr. Opin. Environ. Sci. Health 2018, 6, 77–83. [Google Scholar] [CrossRef]
  19. El-Saadony, M.T.; ALmoshadak, A.S.; Shafi, M.E.; Albaqami, N.M.; Saad, A.M.; El-Tahan, A.M.; Desoky, E.M.; Elnahal, A.S.M.; Almakas, A.; Abd El-Mageed, T.A.; et al. Vital roles of sustainable nano-fertilizers in improving plant quality and quantity-an updated review. Saudi J. Biol. Sci. 2021, 28, 7349–7359. [Google Scholar] [CrossRef] [PubMed]
  20. Murchie, E.H.; Lawson, T. Chlorophyll fluorescence analysis: A guide to good practice and understanding some new applications. J. Exp. Bot. 2013, 64, 3983–3998. [Google Scholar] [CrossRef] [PubMed]
  21. Guidi, L.; Calatayud, A. Non-invasive tools to estimate stress-induced changes in photosynthetic performance in plants inhabiting Mediterranean areas. Environ. Exp. Bot. 2014, 103, 42–52. [Google Scholar] [CrossRef]
  22. Oláh, V.; Hepp, A.; Irfan, M.; Mészáros, I. Chlorophyll fluorescence imaging-based duckweed phenotyping to assess acute phytotoxic effects. Plants 2021, 10, 2763. [Google Scholar] [CrossRef] [PubMed]
  23. Arief, M.A.A.; Kim, H.; Kurniawan, H.; Nugroho, A.P.; Kim, T.; Cho, B.-K. Chlorophyll fluorescence imaging for early detection of drought and heat stress in strawberry plants. Plants 2023, 12, 1387. [Google Scholar] [CrossRef]
  24. Moustaka, J.; Moustakas, M. Early-stage detection of biotic and abiotic stress on plants by chlorophyll fluorescence imaging analysis. Biosensors 2023, 13, 796. [Google Scholar] [CrossRef]
  25. Niyogi, K.K. Safety valves for photosynthesis. Curr. Opin. Plant Biol. 2000, 3, 455–460. [Google Scholar] [CrossRef] [PubMed]
  26. Niyogi, K.K.; Wolosiuk, R.A.; Malkin, R. Photosynthesis. In Biochemistry & Molecular Biology of Plants, 2nd ed.; Buchanan, B.B., Gruissem, W., Jones, R.L., Eds.; John Wiley & Sons, Ltd.: Hoboken, NJ, USA, 2015; pp. 508–566. [Google Scholar]
  27. Apel, K.; Hirt, H. Reactive oxygen species: Metabolism, oxidative stress, and signal transduction. Annu. Rev. Plant Biol. 2004, 55, 373–399. [Google Scholar] [CrossRef] [PubMed]
  28. Gill, S.S.; Tuteja, N. Reactive oxygen species and antioxidant machinery in abiotic stress tolerance in crop plants. Plant Physiol. Biochem. 2010, 48, 909–930. [Google Scholar] [CrossRef]
  29. Moustakas, M. Plant photochemistry, reactive oxygen species, and photoprotection. Photochem 2022, 2, 5–8. [Google Scholar] [CrossRef]
  30. Wrzaczek, M.; Brosché, M.; Kangasjärvi, J. ROS signaling loops-production, perception, regulation. Curr. Opin. Plant Biol. 2013, 16, 575–582. [Google Scholar] [CrossRef]
  31. Kärkönen, A.; Kuchitsu, K. Reactive oxygen species in cell wall metabolism and development in plants. Phytochemistry 2015, 112, 22–32. [Google Scholar] [CrossRef]
  32. Kurusu, T.; Kuchitsu, K.; Tada, Y. Plant signaling networks involving Ca2+ and Rboh/Nox-mediated ROS production under salinity stress. Front. Plant Sci. 2015, 6, 427. [Google Scholar] [CrossRef] [PubMed]
  33. Choudhury, F.K.; Rivero, R.M.; Blumwald, E.; Mittler, R. Reactive oxygen species, abiotic stress and stress combination. Plant J. 2017, 90, 856–867. [Google Scholar] [CrossRef]
  34. Mittler, R. ROS are good. Trends Plant Sci. 2017, 22, 11–19. [Google Scholar] [CrossRef] [PubMed]
  35. Kogoshi, M.; Nishio, D.; Kitahata, N.; Ohwada, H.; Kuchitsu, K.; Mizuno, H.; Kurusu, T. Novel in silico screening system for plant defense activators using deep learning-based prediction of reactive oxygen species accumulation. Plant Methods 2023, 19, 142. [Google Scholar] [CrossRef]
  36. Calabrese, E.J. Evidence that hormesis represents an “overcompensation” response to a disruption in homeostasis. Ecotoxicol. Environ. Saf. 1999, 42, 135–137. [Google Scholar] [CrossRef]
  37. Moustakas, M.; Moustaka, J.; Sperdouli, I. Hormesis in photosystem II: A mechanistic approach. Curr. Opin. Toxicol. 2022, 29, 57–64. [Google Scholar] [CrossRef]
  38. Moustaka, J.; Meyling, N.V.; Hauser, T.P. Root-associated entomopathogenic fungi modulate their host plant’s photosystem II photochemistry and response to herbivorous insects. Molecules 2022, 27, 207. [Google Scholar] [CrossRef]
  39. Sperdouli, I.; Ouzounidou, G.; Moustakas, M. Hormesis responses of photosystem II in Arabidopsis thaliana under water deficit stress. Int. J. Mol. Sci. 2023, 24, 9573. [Google Scholar] [CrossRef] [PubMed]
  40. Agathokleous, E.; Kitao, M.; Harayama, H. On the non-monotonic, hormetic photoprotective response of plants to stress. Dose Response 2019, 17, 1559325819838420. [Google Scholar] [CrossRef]
  41. Agathokleous, E.; Calabrese, E.J. Hormesis: The dose response for the 21st Century: The future has arrived. Toxicology 2019, 425, 152249. [Google Scholar] [CrossRef] [PubMed]
  42. Agathokleous, E.; Kitao, M.; Calabrese, E.J. Hormesis: Highly generalizable and beyond laboratory. Trends Plant Sci. 2020, 25, 1076–1086. [Google Scholar] [CrossRef] [PubMed]
  43. Agathokleous, E.; Feng, Z.; Peñuelas, J. Chlorophyll hormesis: Are chlorophylls major components of stress biology in higher plants? Sci. Total Environ. 2020, 726, 138637. [Google Scholar] [CrossRef]
  44. Małkowski, E.; Sitko, K.; Szopiński, M.; Gieroń, Ż.; Pogrzeba, M.; Kalaji, H.M.; Zieleźnik-Rusinowska, P. Hormesis in plants: The role of oxidative stress, auxins and photosynthesis in corn treated with Cd or Pb. Int. J. Mol. Sci. 2020, 21, 2099. [Google Scholar] [CrossRef]
  45. Agathokleous, E. The rise and fall of photosynthesis: Hormetic dose response in plants. J. For. Res. 2021, 32, 889–898. [Google Scholar] [CrossRef]
  46. Calabrese, E.J.; Agathokleous, E. Accumulator plants and hormesis. Environ. Pollut. 2021, 274, 116526. [Google Scholar] [CrossRef] [PubMed]
  47. Jalal, A.; de Oliveira Junior, J.C.; Ribeiro, J.S.; Fernandes, G.C.; Mariano, G.G.; Trindade, V.D.R.; Reis, A.R. Hormesis in plants: Physiological and biochemical responses. Ecotoxicol. Environ. Saf. 2021, 207, 111225. [Google Scholar] [CrossRef]
  48. Wei, C.; Jiao, Q.; Agathokleous, E.; Liu, H.; Li, G.; Zhang, J.; Fahad, S.; Jiang, Y. Hormetic effects of zinc on growth and antioxidant defense system of wheat plants. Sci. Total Environ. 2022, 807, 150992. [Google Scholar] [CrossRef]
  49. Agathokleous, E.; Sonne, C.; Benelli, G.; Calabrese, E.J.; Guedes, R.N.C. Low-dose chemical stimulation and pest resistance threaten global crop production. Sci. Total Environ. 2023, 878, 162989. [Google Scholar] [CrossRef]
  50. Calabrese, E.J.; Baldwin, L.A. Hormesis: The dose-response revolution. Annu. Rev. Pharmacol. Toxicol. 2003, 43, 175–197. [Google Scholar] [CrossRef]
  51. Adamakis, I.-D.S.; Sperdouli, I.; Hanć, A.; Dobrikova, A.; Apostolova, E.; Moustakas, M. Rapid hormetic responses of photosystem II photochemistry of clary sage to cadmium exposure. Int. J. Mol. Sci. 2021, 22, 41. [Google Scholar] [CrossRef]
  52. Bayçu, G.; Moustaka, J.; Gevrek-Kürüm, N.; Moustakas, M. Chlorophyll fluorescence imaging analysis for elucidating the mechanism of photosystem II acclimation to cadmium exposure in the hyperaccumulating plant Noccaea caerulescens. Materials 2018, 11, 2580. [Google Scholar] [CrossRef] [PubMed]
  53. Moustakas, M.; Dobrikova, A.; Sperdouli, I.; Hanć, A.; Adamakis, I.S.; Moustaka, J.; Apostolova, E. A hormetic spatiotemporal photosystem II response mechanism of salvia to excess zinc exposure. Int. J. Mol. Sci. 2022, 23, 11232. [Google Scholar] [CrossRef]
  54. Moustakas, M.; Sperdouli, I.; Adamakis, I.-D.S.; Şaş, B.; İşgören, S.; Moustaka, J.; Morales, F. Mechanistic approach on melatonin-induced hormesis of photosystem II function in the medicinal plant Mentha spicata. Plants 2023, 12, 4025. [Google Scholar] [CrossRef] [PubMed]
  55. Stamelou, M.-L.; Sperdouli, I.; Pyrri, I.; Adamakis, I.-D.S.; Moustakas, M. Hormetic responses of photosystem II in tomato to Botrytis cinerea. Plants 2021, 10, 521. [Google Scholar] [CrossRef]
  56. Marschner, H. Mineral Nutrition of Higher Plants, 2nd ed.; Academic Press: London, UK, 1995. [Google Scholar]
  57. Cheah, B.H.; Chen, Y.L.; Lo, J.C.; Tang, I.C.; Yeh, K.C.; Lin, Y.F. Divalent nutrient cations: Friend and foe during zinc stress in rice. Plant Cell Environ. 2021, 44, 3358–3375. [Google Scholar] [CrossRef]
  58. Sperdouli, I.; Adamakis, I.D.S.; Dobrikova, A.; Apostolova, E.; Hanć, A.; Moustakas, M. Excess zinc supply reduces cadmium uptake and mitigates cadmium toxicity effects on chloroplast structure, oxidative stress, and photosystem II photochemical efficiency in Salvia sclarea plants. Toxics 2022, 10, 36. [Google Scholar] [CrossRef]
  59. Doncheva, S.; Stoyanova, Z.; Velikova, V. The influence of succinate on zinc toxicity of pea plant. J. Plant Nutr. 2001, 24, 789–804. [Google Scholar] [CrossRef]
  60. Andresen, E.; Peiter, E.; Küpper, H. Trace metal metabolism in plants. J. Exp. Bot. 2018, 69, 909–954. [Google Scholar] [CrossRef]
  61. Balafrej, H.; Bogusz, D.; Triqui, Z.-E.A.; Guedira, A.; Bendaou, N.; Smouni, A.; Fahr, M. Zinc hyperaccumulation in plants: A review. Plants 2020, 9, 562. [Google Scholar] [CrossRef] [PubMed]
  62. Dobrikova, A.; Apostolova, E.; Hanć, A.; Yotsova, E.; Borisova, P.; Sperdouli, I.; Adamakis, I.D.S.; Moustakas, M. Tolerance mechanisms of the aromatic and medicinal plant Salvia sclarea L. to excess zinc. Plants 2021, 10, 194. [Google Scholar] [CrossRef]
  63. Tsonev, T.; Lidon, F.J.C. Zinc in plants—An overview. Emir. J. Food Agric. 2012, 24, 322–333. [Google Scholar]
  64. Caldelas, C.; Weiss, D.J. Zinc homeostasis and isotopic fractionation in plants: A review. Plant Soil 2017, 411, 17–46. [Google Scholar] [CrossRef]
  65. Jan, A.U.; Hadi, F.; Ditta, A.; Suleman, M.; Ullah, M. Zinc-induced anti-oxidative defense and osmotic adjustments to enhance drought stress tolerance in sunflower (Helianthus annuus L.). Environ. Exp. Bot. 2022, 193, 104682. [Google Scholar] [CrossRef]
  66. Stanton, C.; Sanders, D.; Krämer, U.; Podar, D. Zinc in plants: Integrating homeostasis and biofortification. Mol. Plant 2022, 15, 65–85. [Google Scholar] [CrossRef] [PubMed]
  67. Moustakas, M. The role of metal ions in biology, biochemistry and medicine. Materials 2021, 14, 549. [Google Scholar] [CrossRef]
  68. Bloom, A.J.; Smith, S. Mineral nutrition. In Plant Physiology and Development; Taiz, L., Zeiger, E., Møller, I.M., Murphy, A., Eds.; Sinauer Associates, Inc.: Sunderland, MA, USA, 2015; pp. 119–142. [Google Scholar]
  69. Bezerra-Neto, E.; Coelho, J.B.M.; Jarma-Orozco, A.; Rodríguez-Páez, L.A.; Pompelli, M.F. Modulation of photosynthesis under salinity and the role of mineral nutrients in Jatropha curcas L. J. Agron. Crop Sci. 2022, 208, 314–334. [Google Scholar] [CrossRef]
  70. Cakmak, I.; Kutman, U.B. Agronomic biofortification of cereals with zinc: A review. Eur. J. Soil Sci. 2018, 69, 172–180. [Google Scholar] [CrossRef]
  71. Wang, Y.; Meng, Y.; Ma, Y.; Liu, L.; Wu, D.; Shu, X.; Pan, L.; Lai, Q. Combination of high Zn density and low phytic acid for improving Zn bioavailability in rice (Oryza sativa L.) grain. Rice 2021, 14, 23. [Google Scholar] [CrossRef] [PubMed]
  72. Yu, B.G.; Liu, Y.M.; Chen, X.X.; Cao, W.Q.; Ding, T.B.; Zou, C.Q. Foliar zinc application to wheat may lessen the zinc deficiency burden in rural Quzhou, China. Front. Nutr. 2021, 8, 697817. [Google Scholar] [CrossRef]
  73. Cakmak, I.; Pfeiffer, W.H.; McClafferty, B. Biofortification of durum wheat with zinc and iron. Cereal Chem. 2010, 87, 10–20. [Google Scholar] [CrossRef]
  74. Huertas, R.; Karpinska, B.; Ngala, S.; Mkandawire, B.; Malingá, J.; Wajenkeche, E.; Kimani, P.M.; Boesch, C.; Stewart, D.; Hancock, R.D.; et al. Biofortification of common bean (Phaseolus vulgaris L.) with iron and zinc: Achievements and challenges. Food Energy Secur. 2023, 12, e406. [Google Scholar] [CrossRef] [PubMed]
  75. Agathokleous, E.; Calabrese, E.J. Hormesis can enhance agricultural sustainability in a changing world. Glob. Food Secur. 2019, 20, 150–155. [Google Scholar] [CrossRef]
  76. Wang, K.; Miao, Y.; Wang, X.; Li, Y.; Li, F.; Song, H. Research on the construction of a knowledge graph for tomato leaf pests and diseases based on the named entity recognition model. Front. Plant Sci. 2024, 15, 1482275. [Google Scholar] [CrossRef]
  77. Bora, U.; Kumar, K.D.; Kumar, S.; Sharma, P.; Nahar, P. Photochemical activation of polyethylene glycol and its application in PEGylation of protein. Process Biochem. 2011, 46, 1380–1383. [Google Scholar] [CrossRef]
  78. Sheikhi, S.; Aliannezhadi, M.; Tehrani, F.S. The effect of PEGylation on optical and structural properties of ZnO nanostructures for photocatalyst and photodynamic applications. Mater. Today Commun. 2023, 34, 105103. [Google Scholar] [CrossRef]
  79. Moustaka, J.; Meyling, N.V.; Hauser, T.P. Induction of a compensatory photosynthetic response mechanism in tomato leaves upon short time feeding by the chewing insect Spodoptera exigua. Insects 2021, 12, 562. [Google Scholar] [CrossRef] [PubMed]
  80. Oxborough, K.; Baker, N.R. Resolving chlorophyll a fluorescence images of photosynthetic efficiency into photochemical and non-photochemical components—Calculation of qP and Fv′/Fm′ without measuring Fo′. Photosynth. Res. 1997, 54, 135–142. [Google Scholar] [CrossRef]
  81. Kramer, D.M.; Johnson, G.; Kiirats, O.; Edwards, G.E. New fluorescence parameters for the determination of QA redox state and excitation energy fluxes. Photosynth. Res. 2004, 79, 209–218. [Google Scholar] [CrossRef] [PubMed]
  82. Salman, M.; Khan, M.; Saleem, S.; Ali, S.; Hussain, F.; Muhammad, R.; Khesro, A.; Abdullah; Ling, Y. Non-stoichiometric zinc ferrite nanostructures: Dielectric, magnetic, optical and photoelectrochemical properties. Mater. Today Commun. 2021, 28, 102662. [Google Scholar]
  83. Zhang, X.; Fu, J.; Hiromasa, Y.; Pan, H.; Bai, G. Differentially expressed proteins associated with Fusarium head blight resistance in wheat. PLoS ONE 2013, 8, e82079. [Google Scholar] [CrossRef]
  84. Huot, B.; Yao, J.; Montgomery, B.L.; He, S.Y. Growth–defense tradeoffs in plants: A balancing act to optimize fitness. Mol. Plant 2014, 7, 1267–1287. [Google Scholar] [CrossRef] [PubMed]
  85. Sperdouli, I.; Mellidou, I.; Moustakas, M. Harnessing chlorophyll fluorescence for phenotyping analysis of wild and cultivated tomato for high photochemical efficiency under water deficit for climate change resilience. Climate 2021, 9, 154. [Google Scholar] [CrossRef]
  86. Moustakas, M.; Sperdouli, I.; Moustaka, J. Early drought stress warning in plants: Color pictures of photosystem II photochemistry. Climate 2022, 10, 179. [Google Scholar] [CrossRef]
  87. Moustaka, J.; Sperdouli, I.; Moustakas, M. Light energy use efficiency in photosystem II of tomato is related to leaf age and light intensity. Crops 2024, 4, 623–635. [Google Scholar] [CrossRef]
  88. Retta, M.A.; Van Doorselaer, L.; Driever, S.M.; Yin, X.; de Ruijter, N.C.A.; Verboven, P.; Nicolaï, B.M.; Struik, P.C. High photosynthesis rates in Brassiceae species are mediated by leaf anatomy enabling high biochemical capacity, rapid CO2 diffusion and efficient light use. New Phytol. 2024, 244, 1824–1836. [Google Scholar] [CrossRef] [PubMed]
  89. Zhu, X.; Long, S.P.; Ort, D.R. Improving photosynthetic efficiency for greater yield. Annu. Rev. Plant Biol. 2010, 61, 235–261. [Google Scholar] [CrossRef] [PubMed]
  90. Kromdijk, J.; Long, S.P. One crop breeding cycle from starvation? How engineering crop photosynthesis for rising CO2 and temperature could be one important route to alleviation. Proc. R. Soc. B. 2016, 283, 20152578. [Google Scholar] [CrossRef]
  91. Wu, A.; Hammer, G.L.; Doherty, A.; von Caemmerer, S.; Farquhar, G.D. Quantifying impacts of enhancing photosynthesis on crop yield. Nat. Plants 2019, 5, 380–388. [Google Scholar] [CrossRef] [PubMed]
  92. Burgess, A.J.; Masclaux-Daubresse, C.; Strittmatter, G.; Weber, A.P.M.; Taylor, S.H.; Harbinson, J.; Yin, X.; Long, S.; Paul, M.J.; Westhoff, P.; et al. Improving crop yield potential: Underlying biological processes and future prospects. Food Energy Secur. 2023, 12, e435. [Google Scholar] [CrossRef]
  93. Garcia, A.; Gaju, O.; Bowerman, A.F.; Buck, S.A.; Evans, J.R.; Furbank, R.T.; Gilliham, M.; Millar, A.H.; Pogson, B.J.; Reynolds, M.P.; et al. Enhancing crop yields through improvements in the efficiency of photosynthesis and respiration. New Phytol. 2023, 237, 60–77. [Google Scholar] [CrossRef]
  94. Croce, R.; Carmo-Silva, E.; Cho, Y.B.; Ermakova, M.; Harbinson, J.; Lawson, T.; McCormick, A.J.; Niyogi, K.K.; Ort, D.R.; Patel-Tupper, D.; et al. Perspectives on improving photosynthesis to increase crop yield. Plant Cell 2024, 36, 3944–3973. [Google Scholar] [CrossRef] [PubMed]
  95. Yin, X.; Struik, P.C. Constraints to the potential efficiency of converting solar radiation into phytoenergy in annual crops: From leaf biochemistry to canopy physiology and crop ecology. J. Exp. Bot. 2015, 66, 6535–6549. [Google Scholar] [CrossRef]
  96. Long, S.P.; Ainsworth, E.A.; Leakey, A.D.B.; Nosberger, J.; Ort, D.R. Food for thought: Lower-than-expected crop yield stimulation with rising CO2 concentrations. Science 2006, 312, 1918–1921. [Google Scholar] [CrossRef] [PubMed]
  97. Ort, D.R.; Merchant, S.S.; Alric, J.; Barkan, A.; Blankenship, R.E.; Bock, R.; Croce, R.; Hanson, M.R.; Hibberd, J.M.; Long, S.P.; et al. Redesigning photosynthesis to sustainably meet global food and bioenergy demand. Proc. Natl. Acad. Sci. USA 2015, 112, 8529–8536. [Google Scholar] [CrossRef] [PubMed]
  98. Paul, M.J. Improving photosynthetic metabolism for crop yields: What is going to work? Front. Plant Sci. 2021, 12, 743862. [Google Scholar] [CrossRef] [PubMed]
  99. Genty, B.; Briantais, J.M.; Baker, N.R. The relationship between the quantum yield of photosynthetic electron transport and quenching of chlorophyll fluorescence. Biochim. Biophys. Acta 1989, 990, 87–92. [Google Scholar] [CrossRef]
  100. Krieger-Liszkay, A. Singlet oxygen production in photosynthesis. J. Exp. Bot. 2005, 56, 337–346. [Google Scholar] [CrossRef]
  101. Klughammer, C.; Schreiber, U. Complementary PSII quantum yields calculated from simple fluorescence parameters measured by PAM fluorometry and the Saturation Pulse method. PAM Appl. Notes 2008, 1, 27–35. [Google Scholar]
  102. Kasajima, I.; Takahara, K.; Kawai-Yamada, M.; Uchimiya, H. Estimation of the relative sizes of rate constants for chlorophyll de-excitation processes through comparison of inverse fluorescence intensities. Plant Cell Physiol. 2009, 50, 1600–1616. [Google Scholar] [CrossRef] [PubMed]
  103. Gawroński, P.; Witoń, D.; Vashutina, K.; Bederska, M.; Betliński, B.; Rusaczonek, A.; Karpiński, S. Mitogen-activated protein kinase 4 is a salicylic acid-independent regulator of growth but not of photosynthesis in Arabidopsis. Mol. Plant 2014, 7, 1151–1166. [Google Scholar] [CrossRef] [PubMed]
  104. Demmig-Adams, B.; Adams III, W.W.; Baker, D.H.; Logan, B.A.; Bowling, D.R.; Verhoeven, A.S. Using chlorophyll fluorescence to assess the fraction of absorbed light allocation to thermal dissipation of excess excitation. Physiol. Plant. 1996, 98, 253–264. [Google Scholar] [CrossRef]
  105. Asada, K. The water-water cycle in chloroplasts: Scavenging of active oxygens and dissipation of excess photons. Annu. Rev. Plant Physiol. Plant Mol. Biol. 1999, 50, 601–639. [Google Scholar] [CrossRef]
  106. Mittler, R. Oxidative stress, antioxidants and stress tolerance. Trends Plant Sci. 2002, 7, 405–410. [Google Scholar] [CrossRef] [PubMed]
  107. De Bianchi, S.; Betterle, N.; Kouril, R.; Cazzaniga, S.; Boekema, E.; Bassi, R.; Dall’Osto, L. Arabidopsis mutants deleted in the light-harvesting protein Lhcb4 have a disrupted photosystem II macrostructure and are defective in photoprotection. Plant Cell 2011, 23, 2659–2679. [Google Scholar] [CrossRef]
  108. Ruban, A.V. Quantifying the efficiency of photoprotection. Philos. Trans. R. Soc. B 2017, 372, 20160393. [Google Scholar] [CrossRef] [PubMed]
  109. Ruban, A.V. Light harvesting control in plants. FEBS Lett. 2018, 592, 3030–3039. [Google Scholar] [CrossRef] [PubMed]
  110. Hasanuzzaman, M.; Bhuyan, M.H.M.; Zulfiqar, F.; Raza, A.; Mohsin, S.M.; Mahmud, J.A.; Fujita, M.; Fotopoulos, V. Reactive oxygen species and antioxidant defense in plants under abiotic stress: Revisiting the crucial role of a universal defense regulator. Antioxidants 2020, 9, 681. [Google Scholar] [CrossRef]
  111. Moustakas, M.; Panteris, E.; Moustaka, J.; Aydın, T.; Bayçu, G.; Sperdouli, I. Modulation of photosystem ΙΙ function in celery via foliar-applied salicylic acid during gradual water deficit stress. Int. J. Mol. Sci. 2024, 25, 6721. [Google Scholar] [CrossRef]
  112. Sachdev, S.; Ansari, S.A.; Ansari, M.I.; Fujita, M.; Hasanuzzaman, M. Abiotic stress and reactive oxygen species: Generation, signaling, and defense mechanisms. Antioxidants 2021, 10, 277. [Google Scholar] [CrossRef] [PubMed]
  113. Sperdouli, I.; Andreadis, S.; Moustaka, J.; Panteris, E.; Tsaballa, A.; Moustakas, M. Changes in light energy utilization in photosystem II and reactive oxygen species generation in potato leaves by the pinworm Tuta absoluta. Molecules 2021, 26, 2984. [Google Scholar] [CrossRef] [PubMed]
  114. Sperdouli, I.; Moustaka, J.; Ouzounidou, G.; Moustakas, M. Leaf age-dependent photosystem II photochemistry and oxidative stress responses to drought stress in Arabidopsis thaliana are modulated by flavonoid accumulation. Molecules 2021, 26, 4157. [Google Scholar] [CrossRef]
  115. Lambrev, P.H.; Miloslavina, Y.; Jahns, P.; Holzwarth, A.R. On the relationship between non-photochemical quenching and photoprotection of photosystem II. Biochim. Biophys. Acta 2012, 1817, 760–769. [Google Scholar] [CrossRef] [PubMed]
  116. Moustakas, M.; Hanć, A.; Dobrikova, A.; Sperdouli, I.; Adamakis, I.D.S.; Apostolova, E. Spatial heterogeneity of cadmium effects on Salvia sclarea leaves revealed by chlorophyll fluorescence imaging analysis and laser ablation inductively coupled plasma mass spectrometry. Materials 2019, 12, 2953. [Google Scholar] [CrossRef]
  117. Fallah, S.; Yusefi-Tanhaa, E.; Peralta-Videa, J.R. Interaction of nanoparticles and reactive oxygen species and their impact on macromolecules and plant production. Plant Nano Biol. 2024, 10, 100105. [Google Scholar] [CrossRef]
  118. Asada, K. Production and scavenging of reactive oxygen species in chloroplasts and their functions. Plant Physiol. 2006, 141, 391–396. [Google Scholar] [CrossRef] [PubMed]
  119. Mittler, R.; Vanderauwera, S.; Suzuki, N.; Miller, G.; Tognetti, V.B.; Vandepoele, K.; Gollery, M.; Shulaev, V.; Van Breusegem, F. ROS signaling: The new wave? Trends Plant Sci. 2011, 16, 300–309. [Google Scholar] [CrossRef]
  120. Foyer, C.H.; Noctor, G. Redox signaling in plants. Antioxid. Redox Signal. 2013, 18, 2087–2090. [Google Scholar] [CrossRef] [PubMed]
  121. Zandalinas, S.I.; Mittler, R. ROS-induced ROS release in plant andanimal cells. Free Radic. Biol. Med. 2018, 22, 21–27. [Google Scholar] [CrossRef] [PubMed]
  122. Janků, M.; Luhová, L.; Petřivalský, M. On the origin and fate of reactive oxygen species in plant cell compartments. Antioxidants 2019, 8, 105. [Google Scholar] [CrossRef]
  123. Hasanuzzaman, M.; Bhuyan, M.H.M.; Parvin, K.; Bhuiyan, T.F.; Anee, T.I.; Nahar, K.; Hossen, M.; Zulfiqar, F.; Alam, M.; Fujita, M. Regulation of ROS metabolism in plants under environmental stress: A review of recent experimental evidence. Int. J. Mol. Sci. 2020, 21, 8695. [Google Scholar] [CrossRef] [PubMed]
  124. Fedoreyeva, L.I. ROS as signaling molecules to initiate the process of plant acclimatization to abiotic stress. Int. J. Mol. Sci. 2024, 25, 11820. [Google Scholar] [CrossRef] [PubMed]
  125. Mittler, R.; Vanderauwera, S.; Gollery, M.; van Breusegem, F. Reactive oxygen gene network of plants. Trends Plant Sci. 2004, 9, 490–498. [Google Scholar] [CrossRef] [PubMed]
  126. Moustaka, J.; Tanou, G.; Adamakis, I.D.; Eleftheriou, E.P.; Moustakas, M. Leaf age-dependent photoprotective and antioxidative response mechanisms to paraquat-induced oxidative stress in Arabidopsis thaliana. Int. J. Mol. Sci. 2015, 16, 13989–14006. [Google Scholar] [CrossRef] [PubMed]
  127. Foyer, C.H.; Ruban, A.V.; Noctor, G. Viewing oxidative stress through the lens of oxidative signalling rather than damage. Biochem. J. 2017, 474, 877–883. [Google Scholar] [CrossRef] [PubMed]
  128. Foyer, C.H. Reactive oxygen species, oxidative signaling and the regulation of photosynthesis. Environ. Exp. Bot. 2018, 154, 134–142. [Google Scholar] [CrossRef]
  129. Vinyard, D.J.; Ananyev, G.M.; Dismukes, G.C. Photosystem II: The reaction center of oxygenic photosynthesis. Annu. Rev. Biochem. 2013, 82, 577–606. [Google Scholar] [CrossRef] [PubMed]
  130. Najafpour, M.M.; Ghobadi, M.Z.; Haghighi, B.; Eaton-Rye, J.J.; Tomo, T.; Shen, J.R.; Allakhverdiev, S.I. Nano-sized manganese-calcium cluster in photosystem II. Biochemistry 2014, 79, 324–336. [Google Scholar] [CrossRef] [PubMed]
  131. Watanabe, S.; Noguchi, T. Intermediate formation via proton release during the photoassembly of the water-oxidizing Mn4CaO5 cluster in photosystem II. J. Phys. Chem. B 2024, 128, 8145–8161. [Google Scholar] [CrossRef] [PubMed]
  132. Yano, J.; Yachandra, V. Mn4Ca cluster in photosynthesis: Where and how water is oxidized to dioxygen. Chem. Rev. 2014, 114, 4175–4205. [Google Scholar] [CrossRef]
  133. Govindachary, S.; Bukhov, N.G.; Joly, D.; Carpentier, R. Photosystem II inhibition by moderate light under low temperature in intact leaves of chilling-sensitive and -tolerant plants. Physiol. Plant. 2004, 121, 322–333. [Google Scholar] [CrossRef] [PubMed]
  134. Pellegrini, E.; Carucci, M.G.; Campanella, A.; Lorenzini, G.; Nali, C. Ozone stress in Melissa officinalis plants assessed by photosynthetic function. Environ. Exp. Bot. 2011, 73, 94–101. [Google Scholar] [CrossRef]
  135. Siddiqui, H.; Ahmed, K.B.M.; Hayat, S. Comparative effect of 28-homobrassinolide and 24-epibrassinolide on the performance of different components influencing the photosynthetic machinery in Brassica juncea L. Plant Physiol. Biochem. 2018, 129, 198–212. [Google Scholar] [CrossRef] [PubMed]
  136. Mosadegh, H.; Trivellini, A.; Lucchesini, M.; Ferrante, A.; Maggini, R.; Vernieri, P.; Mensuali Sodi, A. UV-B physiological changes under conditions of distress and eustress in sweet basil. Plants 2019, 8, 396. [Google Scholar] [CrossRef] [PubMed]
  137. Singh, H.; Kumar, D.; Soni, V. Performance of chlorophyll a fluorescence parameters in Lemna minor under heavy metal stress induced by various concentration of copper. Sci. Rep. 2022, 12, 10620. [Google Scholar] [CrossRef] [PubMed]
  138. Gohari, G.; Farhadi, H.; Panahirad, S.; Zareei, E.; Labib, P.; Jafari, H.; Mahdavinia, G.; Hassanpouraghdam, M.B.; Ioannou, A.; Kulak, M.; et al. Mitigation of salinity impact in spearmint plants through the application of engineered chitosan-melatonin nanoparticles. Int. J. Biol. Macromol. 2023, 224, 893–907. [Google Scholar] [CrossRef] [PubMed]
  139. Kalisz, A.; Kornaś, A.; Skoczowski, A.; Oliwa, J.; Jurkow, R.; Gil, J.; Sękara, A.; Sałata, A.; Caruso, G. Leaf chlorophyll fluorescence and reflectance of oakleaf lettuce exposed to metal and metal(oid) oxide nanoparticles. BMC Plant Biol. 2023, 23, 329. [Google Scholar] [CrossRef] [PubMed]
  140. Zia, A.; Farrag, E.S.; Mahmoud, S.Y. Dieback of royal poinciana (Delonix regia) trees induced by Alternaria tenuissima and its impact on photochemical efficiency of photosystem II. Physiol. Mol. Plant Pathol. 2024, 133, 102357. [Google Scholar] [CrossRef]
  141. Tóth, S.Z.; Nagy, V.; Puthur, J.T.; Kovács, L.; Garab, G. The physiological role of ascorbate as photosystem II electron donor: Protection against photoinactivation in heat-stressed leaves. Plant Physiol. 2011, 156, 382–392. [Google Scholar] [CrossRef]
  142. Széles, E.; Kuntam, S.; Vidal-Meireles, A.; Nagy, V.; Nagy, K.; Ábrahám, Á.; Kovács, L.; Tóth, S.Z. Single-cell microfluidics in combination with chlorophyll a fluorescence measurements to assess the lifetime of the Chlamydomonas PSBO protein. Photosynthetica 2023, 61, 417–424. [Google Scholar] [CrossRef]
  143. Gao, S.; Han, H.; Feng, H.L.; Zhao, S.J.; Meng, Q.W. Overexpression and suppression of violaxanthin de-epoxidase affects the sensitivity of photosystem II photoinhibition to high light and chilling stress in transgenic tobacco. J. Integr. Plant Biol. 2010, 52, 332–339. [Google Scholar] [CrossRef] [PubMed]
  144. Kato, M.C.; Hikosaka, K.; Hirotsu, N.; Makino, A.; Hirose, T. The excess light energy that is neither utilized in photosynthesis nor dissipated by photoprotective mechanisms determines the rate of photoinactivation in photosystem II. Plant Cell Physiol. 2003, 44, 318–325. [Google Scholar] [CrossRef] [PubMed]
  145. Hakala, M.; Tuominen, I.; Keränen, M.; Tyystjärvi, T.; Tyystjärvi, E. Evidence for the role of the oxygen-evolving manganese complex in photoinhibition of Photosystem II. Biochim. Biophys. Acta 2005, 1706, 68–80. [Google Scholar] [CrossRef]
  146. Ohnishi, N.; Allakhverdiev, S.I.; Takahashi, S.; Higashi, S.; Watanabe, M.; Nishiyama, Y.; Murata, N. Two-step mechanism of photodamage to photosystem II: Step 1 occurs at the oxygen-evolving complex and step 2 occurs at the photochemical reaction center. Biochemistry 2005, 44, 8494–8499. [Google Scholar] [CrossRef] [PubMed]
  147. Tyystjärvi, E. Photoinhibition of Photosystem II and photodamage of the oxygen evolving manganese cluster. Coord. Chem. Rev. 2008, 252, 361–376. [Google Scholar] [CrossRef]
  148. Oguchi, R.; Terashima, I.; Chow, W.S. The involvement of dual mechanisms of photoinactivation of photosystem II in Capsicum annuum L. plants. Plant Cell Physiol. 2009, 50, 1815–1825. [Google Scholar] [CrossRef]
  149. Campbell, D.A.; Tyystjärvi, E. Parameterization of photosystem II photoinactivation and repair. Biochim. Biophys. Acta (BBA)-Bioenerg. 2012, 1817, 258–265. [Google Scholar] [CrossRef] [PubMed]
  150. Zavafer, A.; Koinuma, W.; Chow, W.S.; Cheah, M.H.; Mino, H. Mechanism of photodamage of the oxygen evolving Mn cluster of photosystem II by excessive light energy. Sci. Rep. 2017, 7, 7604. [Google Scholar] [CrossRef] [PubMed]
  151. Callahan, F.E.; Becker, D.W.; Cheniae, G.M. Studies on the photo-inactivation of the water-oxidizing enzyme. II. Characterization of weak light photoinhibition of PSII and its light-induced recovery. Plant Physiol. 1986, 82, 261–269. [Google Scholar] [CrossRef]
  152. Chen, G.X.; Kazimir, J.; Cheniae, G.M. Photoinhibition of hydroxylamine-extracted photosystem II membranes: Studies of the mechanism. Biochemistry 1992, 31, 11072–11083. [Google Scholar] [CrossRef]
  153. Anderson, J.M.; Park, Y.I.; Chow, W.S. Unifying model for the photoinactivation of photosystem II in vivo: A hypothesis. Photosynth. Res. 1998, 56, 1–13. [Google Scholar] [CrossRef]
  154. Sarvikas, P.; Hakala, M.; Pätsikkä, E.; Tyystjärvi, T.; Tyystjärvi, E. Action spectrum of photoinhibition in leaves of wild type and npq1-2 and npq4-1 mutants of Arabidopsis thaliana. Plant Cell Physiol. 2006, 47, 391–400. [Google Scholar] [CrossRef] [PubMed]
  155. Pospíšil, P. Molecular mechanisms of production and scavenging of reactive oxygen species by photosystem II. Biochim. Biophys. Acta (BBA)-Bioenerg. 2012, 1817, 218–231. [Google Scholar] [CrossRef]
  156. Telfer, A. Singlet oxygen production by PSII under light stress: Mechanism, detection and the protective role of beta-carotene. Plant Cell Physiol. 2014, 55, 1216–1223. [Google Scholar] [CrossRef]
  157. Derks, A.; Schaven, K.; Bruce, D. Diverse mechanisms for photoprotection in photosynthesis. Dynamic regulation of photosystem II excitation in response to rapid environmental change. Biochim. Biophys. Acta 2015, 1847, 468–485. [Google Scholar] [CrossRef] [PubMed]
  158. Dabagh, S.; Haris, S.A.; Ertas, Y.N. Engineered Polyethylene Glycol-Coated Zinc Ferrite Nanoparticles as a Novel Magnetic Resonance Imaging Contrast Agent. ACS Biomater. Sci. Eng. 2023, 9, 4138–4148. [Google Scholar]
  159. Agathokleous, E.; Feng, Z.; Iavicoli, I.; Calabrese, E.J. The two faces of nanomaterials: A quantification of hormesis in algae and plants. Environ. Int. 2019, 131, 105044. [Google Scholar] [CrossRef] [PubMed]
  160. Li, J.; Yang, P.; Gan, Y.; Yu, J.; Xie, J. Brassinosteroid alleviates chilling-induced oxidative stress in pepper by enhancing antioxidation systems and maintenance of photosystem II. Acta Physiol. Plant. 2015, 37, 222. [Google Scholar] [CrossRef]
  161. Zhang, J.F.; Li, J.; Xie, J.M.; Yu, J.H.; Dawuda, M.M.; Lyv, J.; Tang, Z.Q.; Zhang, J.; Zhang, X.D.; Tang, C.N. Changes in photosynthesis and carotenoid composition of pepper (Capsicum annuum L.) in response to low-light stress and low temperature combined with low-light stress. Photosynthetica 2020, 58, 125–136. [Google Scholar] [CrossRef]
  162. Zhang, J.; Tang, C.; Xie, J.; Li, J.; Zhang, X.; Wang, C. Exogenous strigolactones alleviate low-temperature stress in peppers seedlings by reducing the degree of photoinhibition. BMC Plant Biol. 2024, 24, 907. [Google Scholar] [CrossRef] [PubMed]
Figure 1. X-ray diffraction (XRD) pattern (a), TEM image with inset of a size distribution histogram and Gaussian fitting curve (b), FT-IR spectrum (c), thermogravimetric analysis (TGA) curve (d), and hysteresis loop by vibrating sample measurement (VSM) (e) of ZnFer NPs.
Nanomaterials 15 00288 g001aNanomaterials 15 00288 g001b
Figure 2. The maximum efficiency of PSII photochemistry (Fv/Fm) (a) and the efficiency of the oxygen-evolving complex (Fv/Fo) (b) in dark-adapted tomato leaves 30 min, 60 min, and 180 min after exposure to 15 mg L−1 and 30 mg L−1 ZnFer NPs, compared to control plants (CK). Bars represent standard deviations (SD). Different lower-case letters denote significant differences at p < 0.05 (n = 6).
Nanomaterials 15 00288 g002
Figure 3. Light energy distribution at PSII. The effective quantum yield of PSII photochemistry (ΦPSII) measured at the growth light intensity (GLI) (a) and the effective quantum yield of PSII photochemistry (ΦPSII) measured at the high light intensity (HLI) (b) in tomato leaves, 30 min, 60 min, and 180 min after exposure to 15 mg L−1 and 30 mg L−1 ZnFer NPs, compared to control plants (CK). Bars represent standard deviations (SD). Different lower-case letters denote significant differences at p < 0.05 (n = 6).
Nanomaterials 15 00288 g003
Figure 4. Light energy distribution at PSII. The quantum yield of regulated non-photochemical energy loss in PSII (ΦNPQ) measured at the GLI (a), the quantum yield of regulated non-photochemical energy loss in PSII (ΦNPQ) measured at the HLI (b), the quantum yield of non-regulated energy loss in PSII (ΦNO) measured at the GLI (c), and the quantum yield of non-regulated energy loss in PSII (ΦNO) measured at the HLI (d) in tomato leaves 30 min, 60 min, and 180 min after exposure to 15 mg L−1 and 30 mg L−1 ZnFer NPs, compared to control plants (CK). Bars represent standard deviations (SD). Different lower-case letters denote significant differences at p < 0.05 (n = 6).
Nanomaterials 15 00288 g004
Figure 5. The fraction of open PSII rection centers (RCs) (qp) measured at the GLI (a) and at the HLI (b) in tomato leaves 30 min, 60 min, and 180 min after exposure to 15 mg L−1 and 30 mg L−1 ZnFer NPs, compared to control plants (CK). Bars represent standard deviations (SD). Different lower-case letters denote significant differences at p < 0.05 (n = 6).
Nanomaterials 15 00288 g005
Figure 6. The electron transport rate (ETR) measured at the GLI (a) and at the HLI (b) in tomato leaves 30 min, 60 min, and 180 min after exposure to 15 mg L−1 and 30 mg L−1 ZnFer NPs, compared to control plants (CK). Bars represent standard deviations (SD). Different lower-case letters denote significant differences at p < 0.05 (n = 6).
Nanomaterials 15 00288 g006
Figure 7. The efficiency of the open PSII RCs (Fv′/Fm′) measured at the GLI (a) and at the HLI (b) in tomato leaves 30 min, 60 min, and 180 min after exposure to 15 mg L−1 and 30 mg L−1 ZnFer NPs, compared to control plants (CK). Bars represent standard deviations (SD). Different lower-case letters denote significant differences at p < 0.05 (n = 6).
Nanomaterials 15 00288 g007
Figure 8. The non-photochemical quenching (NPQ) measured at the GLI (a) and at the HLI (b) in tomato leaves 30 min, 60 min, and 180 min after exposure to 15 mg L−1 and 30 mg L−1 ZnFer NPs, compared to control plants (CK). Bars represent standard deviations (SD). Different lower-case letters denote significant differences at p < 0.05 (n = 6).
Nanomaterials 15 00288 g008
Figure 9. The excitation pressure at PSII (1−qL) measured at the GLI (a) and at the HLI (b) in tomato leaves 30 min, 60 min, and 180 min after exposure to 15 mg L−1 and 30 mg L−1 ZnFer NPs, compared to control plants (CK). Bars represent standard deviations (SD). Different lower-case letters denote significant differences at p < 0.05 (n = 6).
Nanomaterials 15 00288 g009
Figure 10. The excess excitation energy at PSII (EXC) measured at the GLI (a) and at the HLI (b) in tomato leaves 30 min, 60 min, and 180 min after exposure to 15 mg L−1 and 30 mg L−1 ZnFer NPs, compared to control plants (CK). Bars represent standard deviations (SD). Different lower-case letters denote significant differences at p < 0.05 (n = 6).
Nanomaterials 15 00288 g010
Figure 11. The time-dependent biphasic response curves of the quantum yield of PSII photochemistry (ΦPSII) measured at the GLI (a) and at the HLI (b), in tomato leaves 30 min, 60 min, and 180 min after exposure to 15 mg L−1 (blue line) and 30 mg L−1 (red line) ZnFer NPs, compared to the control level. Bars represent standard deviations (n = 6).
Nanomaterials 15 00288 g011
Figure 12. The time-dependent response curves of the excitation pressure at PSII (1−qL) measured at the GLI (a) and at the HLI (b) in tomato leaves 30 min, 60 min, and 180 min after exposure to 15 mg L−1 (blue line) and 30 mg L−1 (red line) ZnFer NPs, compared to the control level. Bars represent standard deviations (n = 6).
Nanomaterials 15 00288 g012
Figure 13. The time-dependent biphasic response curve of the excess excitation energy at PSII (EXC) measured at the GLI (a) and at the HLI (b) in tomato leaves 30 min, 60 min, and 180 min after exposure to 15 mg L−1 (blue line) and 30 mg L−1 (red line) ZnFer NPs, compared to the control level. Bars represent standard deviations (n = 6).
Nanomaterials 15 00288 g013
Disclaimer/Publisher’s Note: The statements, opinions and data contained in all publications are solely those of the individual author(s) and contributor(s) and not of MDPI and/or the editor(s). MDPI and/or the editor(s) disclaim responsibility for any injury to people or property resulting from any ideas, methods, instructions or products referred to in the content.

