Abstract
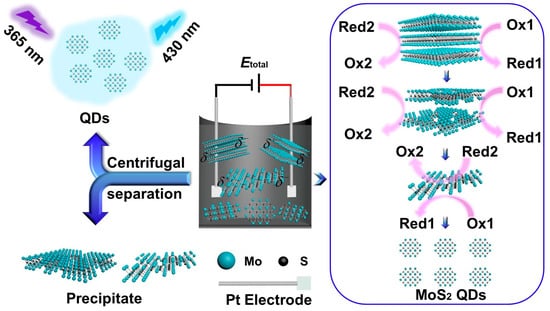
A convenient bipolar-electrode (BPE) electrochemical method was engineered to produce molybdenum disulfide (MoS2) quantum dots (QDs) using pure phosphate buffer (PBS) as the electrolyte and the MoS2 powder as the precursor. Meanwhile, the corresponding by-product precipitate was studied, in which MoS2 nanosheets were observed. The BPE design would not be restricted by the shape and size of the MoS2 precursor. It could lead to the defect generation and 2H → 1T phase variation of the MoS2, resulting in the formation of nanosheets and finally the QDs. The as-prepared MoS2 QDs exhibited high photoluminescence (PL) quantum yield of 13.9% and average lateral size of 4.4 ± 0.2 nm, respectively. Their excellent PL property, low cytotoxicity, and good aqueous dispersion offer promising applicability in PL staining and cell imaging. Meanwhile, the as-obtained byproduct containing the nanosheets could be used as an effective electromagnetic wave (EMW) absorber. The minimum reflection loss (RL) value was −54.13 dB at the thickness of 3.3 mm. The corresponding bandwidth with efficient attenuation (<−10 dB) was up to 7.04 GHz (8.8–15.84 GHz). The as-obtained EMW performance was far superior over most previously reported MoS2-based nanomaterials.
1. Introduction
MoS2 belongs to one two-dimensional (2D) group-VIB transition metal dichalcogenides (TMDs), which has gained significant attention due to their large surface area (SSA), distinct electrical properties and tunable bandgaps [1]. The MoS2 nanomaterials have shown great application potentials in catalysis [2,3,4], electromagnetic wave (EMW) adsorption [5,6], biomedical applications [6], etc. For example, MoS2 nanosheets were confirmed to be a promising EMW absorber not only because of their high SSA, but also due to the defect dipole polarization resulting from Mo and S vacancies as well as the phase transition between the trigonal prismatic (2H) semiconducting phase to octahedral (1T) metallic one [7,8,9,10]. It has an indirect band gap of 1.2 eV in its bulk form, while becomes 1.9 eV when thinned to the monolayer nanosheets, indicating the formation of a direct band-gap semiconductor [2,11,12]. Furthermore, PL could emerge when the thickness of MoS2 crystals became smaller [12]. Besides the layer number, the nanoscale size of the MoS2 would also contribute to the PL emission due to the edge effects and quantum confinement [2]. As a result, PL MoS2 quantum dots (QDs) could be obtained. Many approaches have been proposed to synthesize the MoS2 QDs including the electro-Fenton processing [8], Li-intercalation [13,14], ultrasonication [15,16], hydrothermal/solvothermal treatment, and CVD approaches [17]. Despite the achievements, they are still restricted by the time consumption, or poor environmental tolerance, or expensive instrument or hazardous organic solvents [8]. Therefore, there is a great need to discover a simple, efficient, non-toxic, and cost-effective method for preparing MoS2 nanomaterials.
The electrochemical method has been widely used in exfoliating the 2D materials due to its superiorities including simple operation, low consumption, good reproducibility [8], etc. Applications of the traditional electrochemical methods in preparing MoS2 QDs have also been explored [17,18]. Therein, precursor in bulky form have to be applied as the working electrodes (or anodes). However, the MoS2 precursor popularly exists in the form of powder, which greatly limits its wide application in the preparation of MoS2 QDs.
Bipolar-electrode (BPE) method is a special type of electrochemical method that has attracted much attention recently. Its device is mainly connected to a driving power source (such as the Pt electrode, Au electrode, etc.) and a conductor immersed in the electrolyte (i.e., bipolar electrode, BPE) composition. A BPE can act as an anode and a cathode at the same time, on which the oxidation and reduction reactions occur at the respective end. This method has the advantages of simplicity, easy operation, and especially not limited by the shape of the precursor conductor [18]. Accordingly, large-size conductive 2D materials such as black phosphorus [19] and WS2 [20] can be electrolyzed into nano-sized particles, despite the precursor is in bulky form or powder. However, as far as we know, there is no report about the preparation of the QDs derived from the 2D materials via the BPE methods, not to mention the MoS2 QDs. In addition, upon the BPE treatment for the 2D materials, only the nano-sized particles were paid close attention, while the by-product precipitate has been neglected, which might provide useful information for elucidating the BPE process and hold great application potential.
In this study, the BPE electrochemical strategy was applied for preparing MoS2 QDs using the MoS2 powder and PBS as the precursor and electrolyte, respectively. Meanwhile, the corresponding by-product precipitate was also studied, in which the MoS2 nanosheets were obtained. The electrochemical process was not restricted with the shape of the MoS2 precursor. It showed the advantages of simplicity and environmental friendliness. The as-prepared MoS2 QDs exhibit good PL, high crystallinity, good dispersion, and narrow particle size distribution. Their advantages offer promising applicability in PL staining and cell imaging. The as-obtained precipitate containing the nanosheets was also tested for the EMW absorption. Through the various characterizations, we proposed the generation mechanism of the MoS2 QDs and nanosheets via the BPE electrochemical strategy.
2. Materials and Methods
Reagents: Bulk MoS2 powder (mol wt 160.07, purity 98.0%), sodium dihydrogen phosphate dehydrate (mol wt 156.01, purity 99.0%), disodium hydrogen phosphate dodecahydrate (mol wt 358.14, purity 99.0%), sodium hydroxide (granular, mol wt 40, purity 96.0%), ethanol (mol wt 46.07, purity 99.7%), and potassium bromide (mol wt 119, purity 99.0%) was supplied by Sinopharm Chemical Reagent Co., Ltd., Shanghai, China. Ammonium fluoride (NH4F, mol wt 37.04, purity ≥ 96%), concentrated sulfuric acid (H2SO4, mol wt 98.04, density 1.84 g cm−3). 3-(4,5-dimethyl-2-thiazolyl)-2,5-diphenyltetrazolium bromide (MTT, mol wt 414.32, purity 98%), lysogeny broth (LB) medium, Dulbecco’s modified Eagle medium (DMEM). All other reagents were of analytical grade and applied as received. Deionized distilled water was applied in the experiment.
Apparatus: The RXN-305D DC power supply was obtained from Shenzhen Zhaoxin Yuan Electronics Co., Ltd. (Shenzhen, China). The LCD numerical controlled heating type magnetic stirrer, model MS-H-Pro+, is provided by Dragon Laboratory Limited (Beijing, China). The high-speed table centrifuge model of TGL-15B was provided by Shanghai anting scientific instrument factory. The morphology of MoS2 QDs was observed on a JEOL Ltd. JEM-2010 transmission electron microscope (JEOL Ltd., Beijing, China) and atomic force microscopy using a SPI3800N microscope operating in the tapping mode (Seiko Instruments Inc., Shenzhen, China). The XRD was carried out on a Rigaku D-MAX 2500/PC with the Cu K α radiation (λ = 1.54056 Å) (Tokyo, Japan). FTIR was carried out on a Nicolet 5700 FTIR spectrometer (Thermo Electron Scientific Instruments Corp., Shanghai, China). The Raman spectra were performed using a DXR2 micro Raman imaging spectrometer (Thermo Fisher, Waltham, MA, U.S). XPS data were collected on an ESCALab220i-XL electron spectrometer (VG Scientific, West Sussex, U.K.) using 300 W Al Kα radiation. The FL spectra were performed on an Edinburgh instruments spectrofluorometer FS5 (Edinburgh, U.K.) with the excitation/emission slits of 5.0 × 5.0 nm. The ultraviolet–visible (UV–vis) absorbance was gained from a Mapada UV-6300 double beam spectrophotometer (Shanghai, China). The electromagnetic parameters were evaluated by an Agilent AV3618 vector network analyzer.
Preparation of MoS2 QDs and precipitate containing the nanosheets: The MoS2 QDs and precipitate containing the nanosheets were synthesized by a low cytotoxicity, simple, and nondestructive BPE electrochemical system. Typically, PBS (0.2 M, pH = 7.4) was used as the electrolyte solution, and MoS2 powder (0.173 g) was placed in a beaker (50 mL). Two platinum (Pt) sheets (area > 1.0 cm2) were used as the anode and the cathode, respectively. Different electrolyte compositions all at 0.2 M (PBS, NH4F, and H2SO4), applied voltages (3 V, 5 V, and 7 V) and reaction times (0–30 h) were optimized for the preparation. The electrochemical exfoliation was conducted accompanying with stirring at 500 rpm for the whole experiment. The above-mentioned reaction solution was under centrifugation at 12,000 rpm for 15 min to reach a colorless dispersion containing MoS2 QDs and grey-black precipitation, respectively. The colorless dispersion was dialyzed in a 1000 Da dialysis bag against deionized water for 12 h to remove phosphate and obtain purified MoS2 QDs. The grey-black precipitates are dried by freeze-drying to for further characterization and applications.
3. Results and Discussion
3.1. Preparation and Characterization of the MoS2 QDs and Precipitate Containing the Nanosheets
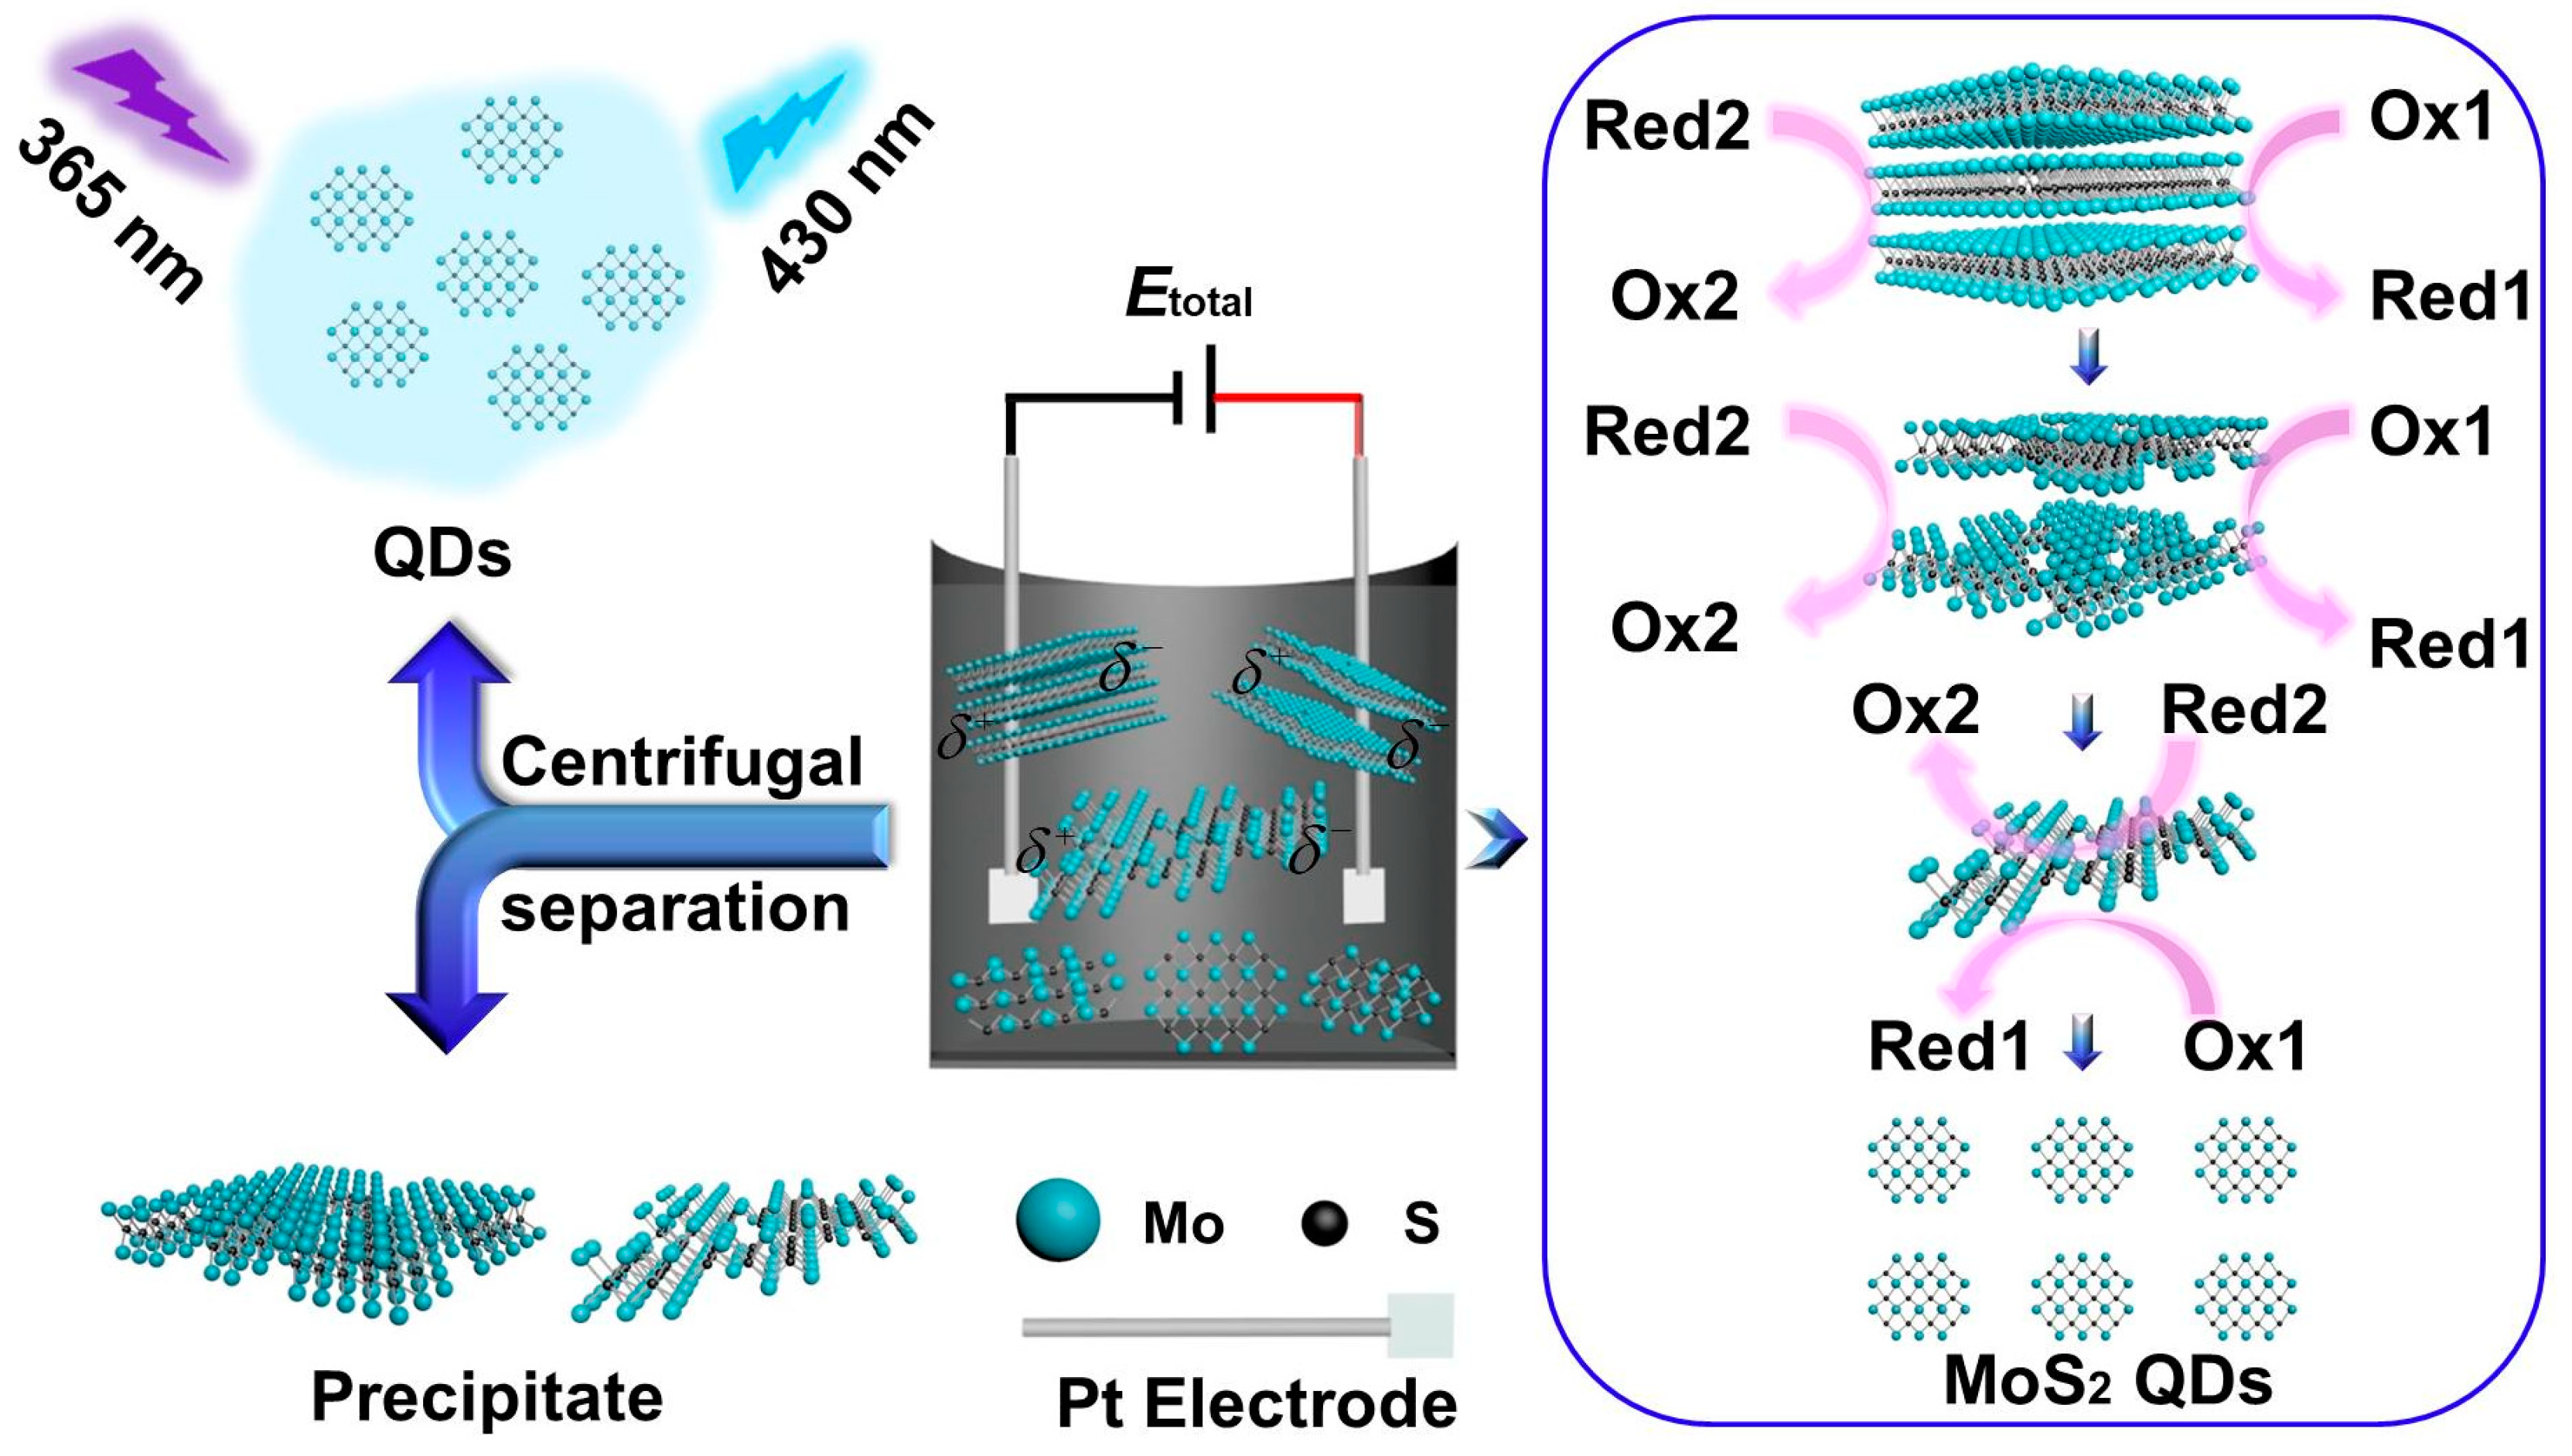
As shown in Scheme 1, MoS2 QDs and nanosheets were prepared through a simple BPE electrochemical system using MoS2 powder as the precursor. The products were finally centrifuged to collect the supernatant and precipitate, respectively. Different applied voltages and reaction times electrolyte compositions were tested for the preparation. Bubbles were observed on the platinum electrodes during electrolysis, indicating the possible evolution of oxygen and hydrogen due to the electrolysis of water. As shown in Figure S1, the MoS2 QDs can be obtained at different experimental conditions, indicating the universality of the BPE synthesis strategy. Furthermore, the PL quantum yield of the as-prepared MoS2 QDs was evaluated based on the method indicated in the Supporting Information [21,22,23,24,25,26]. However, too low applied voltage (e.g., 3 V) would result in too low of an exfoliation efficiency, thus resulting in too long of a process. While too high voltage (e.g., 7 V) would lead to high current in the BPE system. In addition, bubbles generation on the platinum electrodes would be accelerated at higher applied voltage. Both the higher current and more generated bubbles would cause faster loss of the water, leading to unstable composition of the reaction system. Accordingly, 5 V was chosen as the optimized applied voltage. Meanwhile, it was found that the PL quantum yield of the MoS2 QDs increased with the increasing electrolysis time from 0 to 20 h, while longer time than 20 h would not only offer little positive effect on the quantum yield but also lead to great loss of the water. Thus, 20 h was selected as the optimum reaction time. Meanwhile, the PBS (pH = 7.4) showed the highest PL quantum yield among the tested electrolytes under the same applied voltage and reaction time. As a result, the optimum conditions were set as follows: applied voltage: 5 V, reaction time: 20 h and electrolyte: 0.2 M PBS (pH 7.4), which was used for the further experiments. The highest PL quantum yield of the as-prepared MoS2 QDs was calculated to be 13.9%.
Scheme 1.
Scheme of the preparation of MoS2 QDs and MoS2 precipitate by a BPE electrochemical method in the PBS.
The optical features of the as-prepared MoS2 QDs (0.2 M PBS, 5 V, 20 h) were studied by the UV–vis absorption and the PL spectroscopy accordingly. As shown, distinct absorption peaks at 221 nm was observed in the UV–vis absorption (Figure 1A), which should be ascribed to the excitonic characteristics of the MoS2 QDs [21,22,23]. Meanwhile, the 1931 CIE chromaticity diagram of the MoS2 QDs (Figure 1B) shows that the PL was in the blue emission region (0.14, 0.05) upon the excitation wavelength at 310 nm, which well matched with the UV–vis adsorption result. The PL of MoS2 QDs was collected upon different excitation wavelengths between 300 and 370 nm (Figure 1C). The emission spectra changed from 420 to 466 nm (2.66–2.95 eV) accordingly. As illustrated in Figure 1A, the maximum emission was obtained at 420 nm (2.95 eV) under the excitation wavelength at 310 nm (4 eV). The excitation-dependent PL emission is consistent with previous reports of the MoS2 QDs [8,24,25]. The PL decay curve of MoS2 QDs is shown in Figure 1D. The curve was fitted with a biexponential function, showing two dominant excitonic processes with nanosecond luminescence lifetime. Two excitonic lifetime of 1.25 ns (ca. 30.81%) and 5.57 ns (ca. 69.19%) can be obtained, respectively. In addition, the average PL lifetime of the as-prepared MoS2 QDs was estimated to be 4.24 ns.
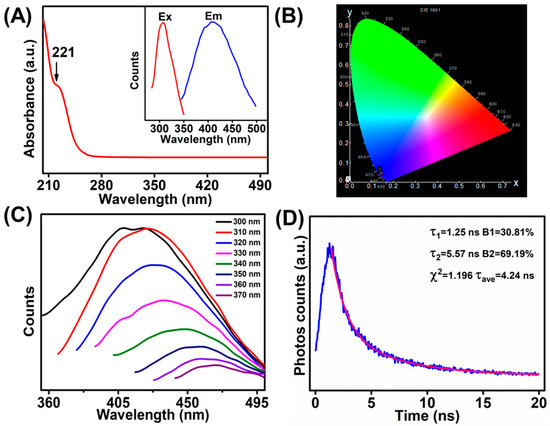
Figure 1.
(A) UV–vis absorption spectrum of MoS2 QDs (inset: PL excitation spectrum and PL emission spectrum). (B) The CIE 1931 chromaticity chart of the MoS2 QDs at excitation of the 310 nm. (C) PL emission spectra of MoS2 QDs with various excitation wavelengths. (D) PL decay curve of MoS2 QDs.
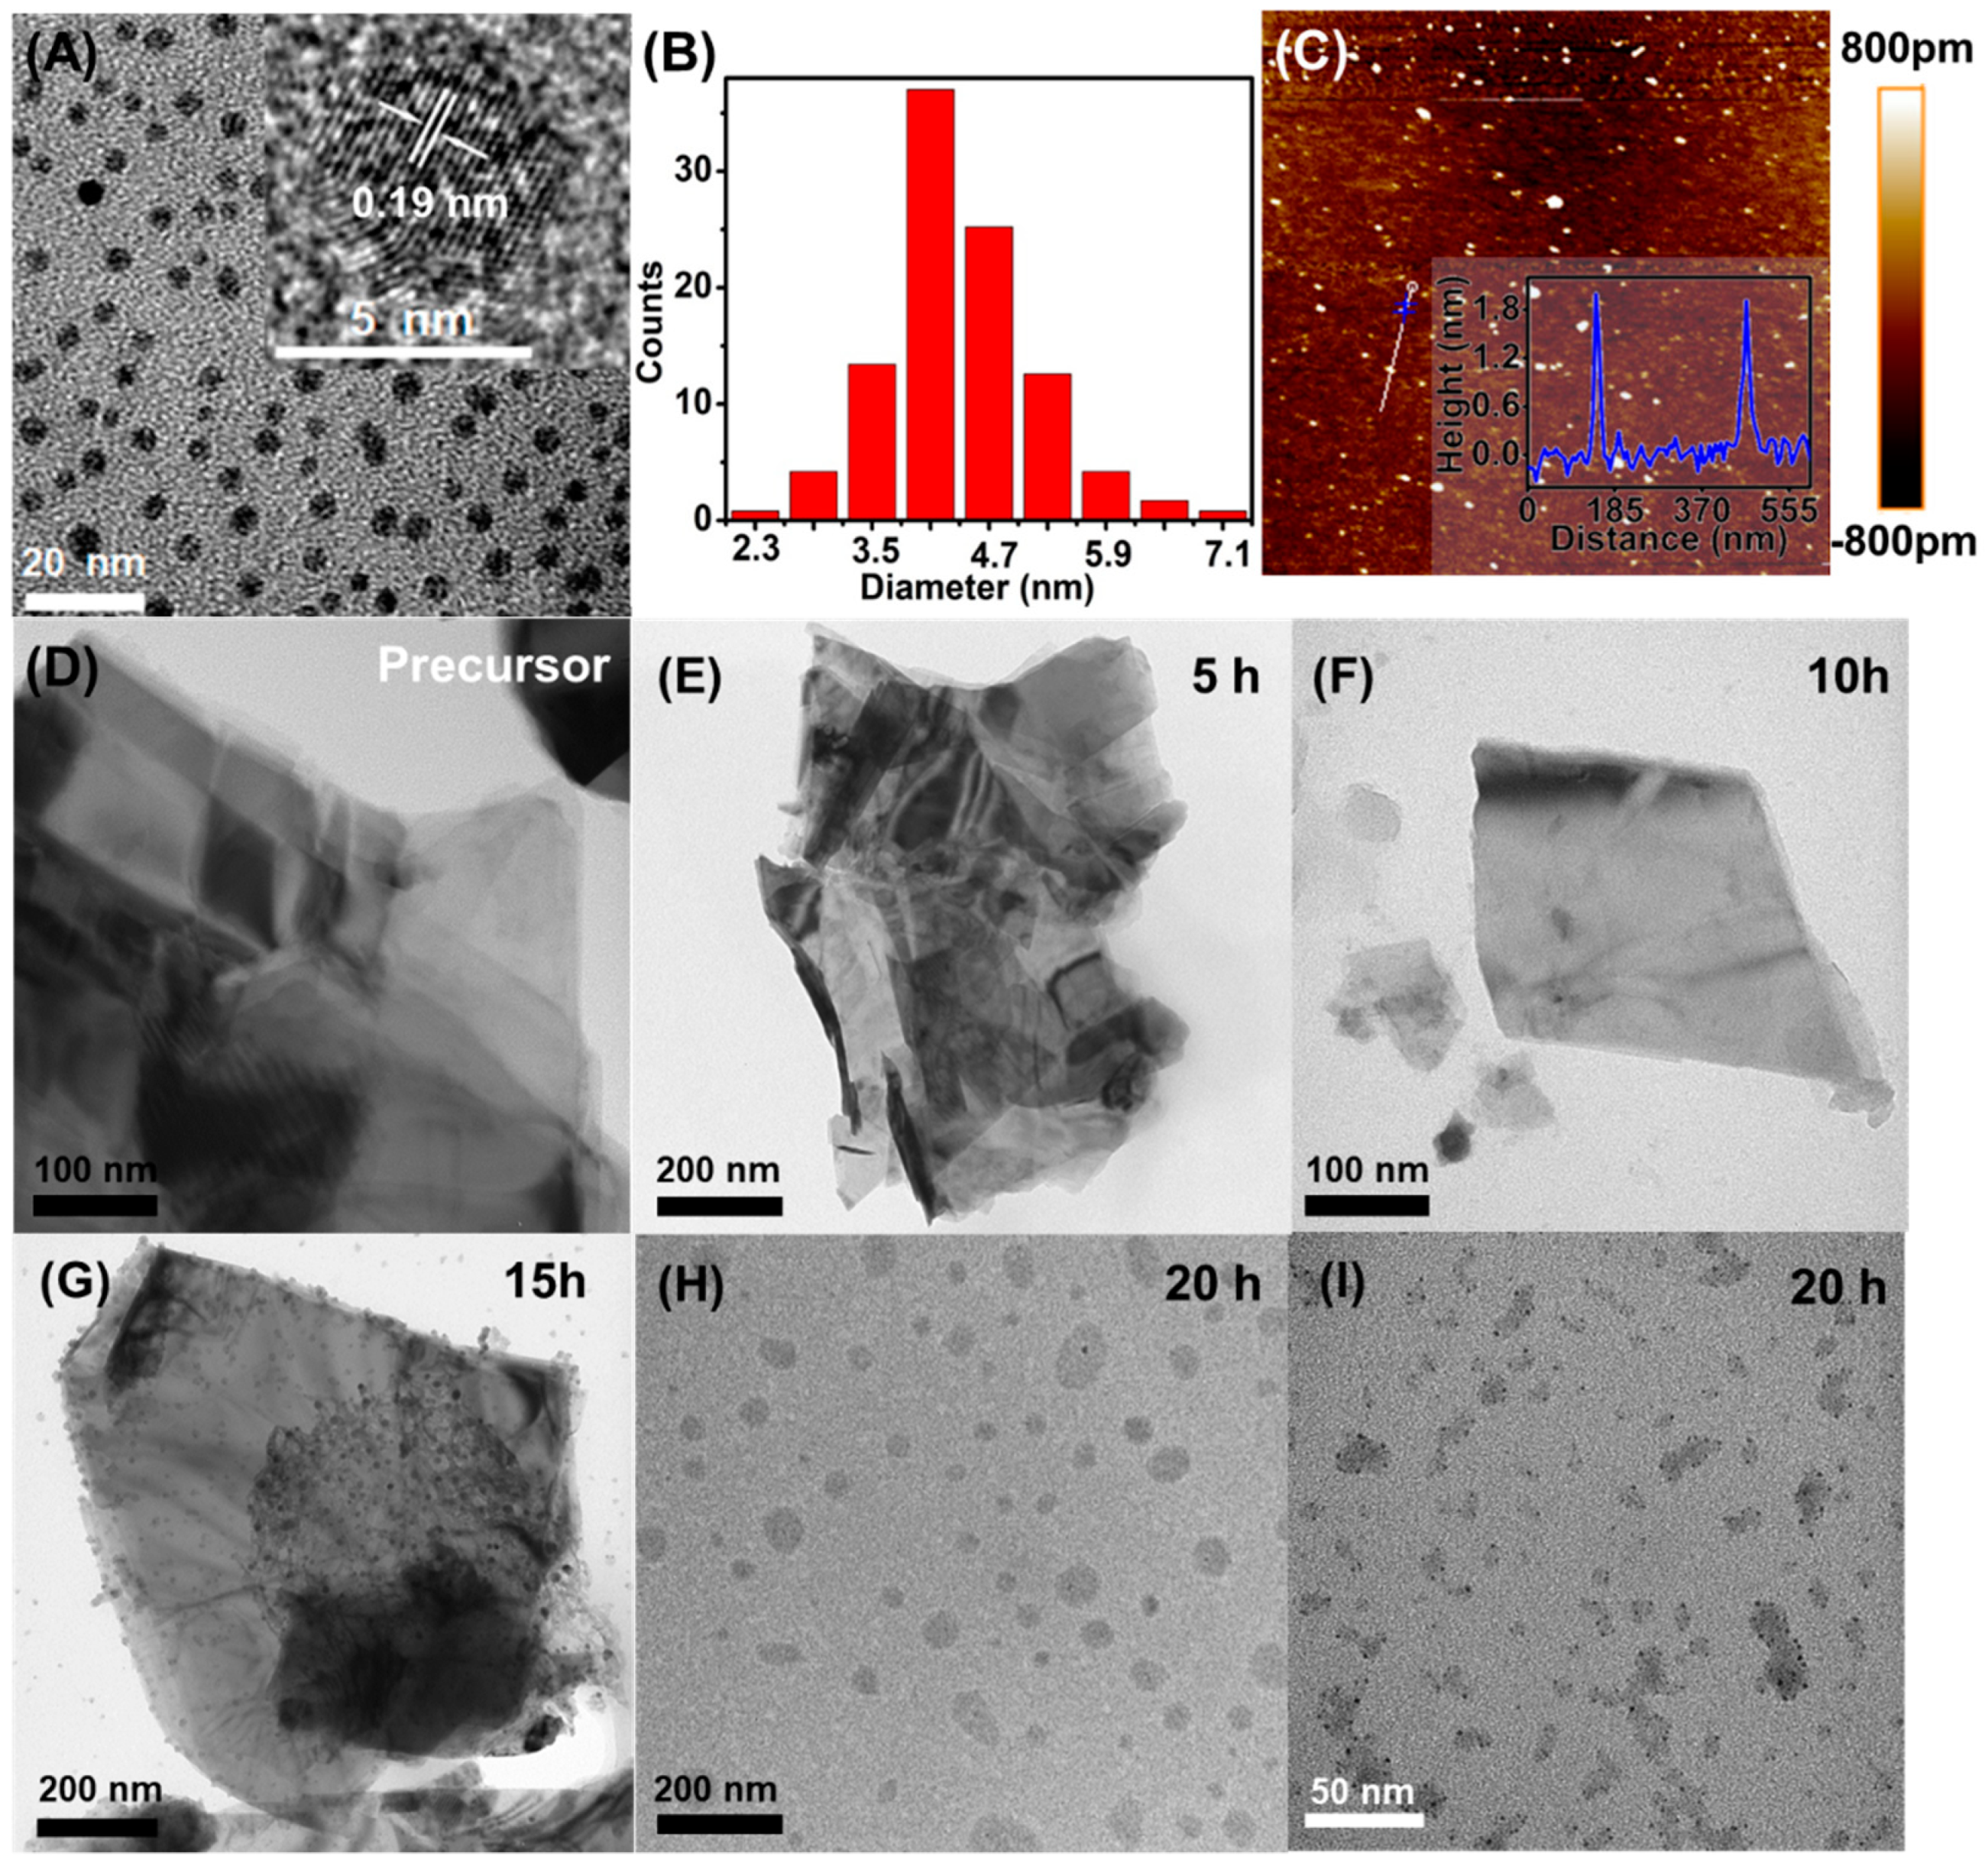
In Figure 2A, the typical TEM image of the supernatant showed mono-dispersed nanodots, showing the possible formation of the MoS2 QDs with good dispersion in the aqueous medium. The nanodots were highly uniform with the average dimension of 4.4 ± 0.3 nm (Figure 2B). The illustration in Figure 2A is a high-resolution TEM (HRTEM) image of MoS2 QDs. The corresponding lattice spacing at 0.19 nm corresponds to the (100) plane, which was consistent with the reported values (JCPDS: 37-1492). The atomic force microscopy (AFM) image was also collected for the MoS2 QDs (Figure 2C). Besides the further confirmation of the good-dispersibility, the corresponding height analysis indicated that the thickness of the MoS2 QDs was between 1.95 and 2.0 nm and 1.98 ± 0.02 nm in average (the inset of Figure 2C), suggesting that the MoS2 QDs were highly exfoliated and in few layer [27,28,29].

Figure 2.
(A) TEM images (inset: HRTEM image), (B) particle size distribution, and (C) AFM image (inset: height profile) of the MoS2 QDs. TEM images of the MoS2 (D) precursor and (E–I) electrolysis precipitate upon different electrolysis time at 5, 10, 15, 20 h, respectively.
To study the generation process of the MoS2 QDs, the TEM characterization were also carried out for the precipitate generated at electrolysis times of 5, 10, 15, and 20 h, respectively. As shown, compared with the MoS2 precursor form (Figure 2D), electrolysis time of 5 h (Figure 2E) does not affect the morphology of MoS2 sheets. With the reaction time extended to 10 h, MoS2 sheets with smaller thickness and smaller lateral dimension (95.8–231.6 nm) can be observed (Figure 2F). With the ongoing reaction to 15 h, much smaller nanosheets ranging from 11.2 nm to 61.4 nm appeared on the surface of the MoS2 sheets (Figure 2G). Subsequently, the nanosheets could be completely separated from the MoS2 sheets (Figure 2H) accompanying with the formation of nanodots on the independent nanosheets (Figure 2I) at 20 h. Meanwhile, independent nanodots—i.e., MoS2 QDs—could be reached since they were well dispersed in the aqueous supernatant (Figure 2A) [30].
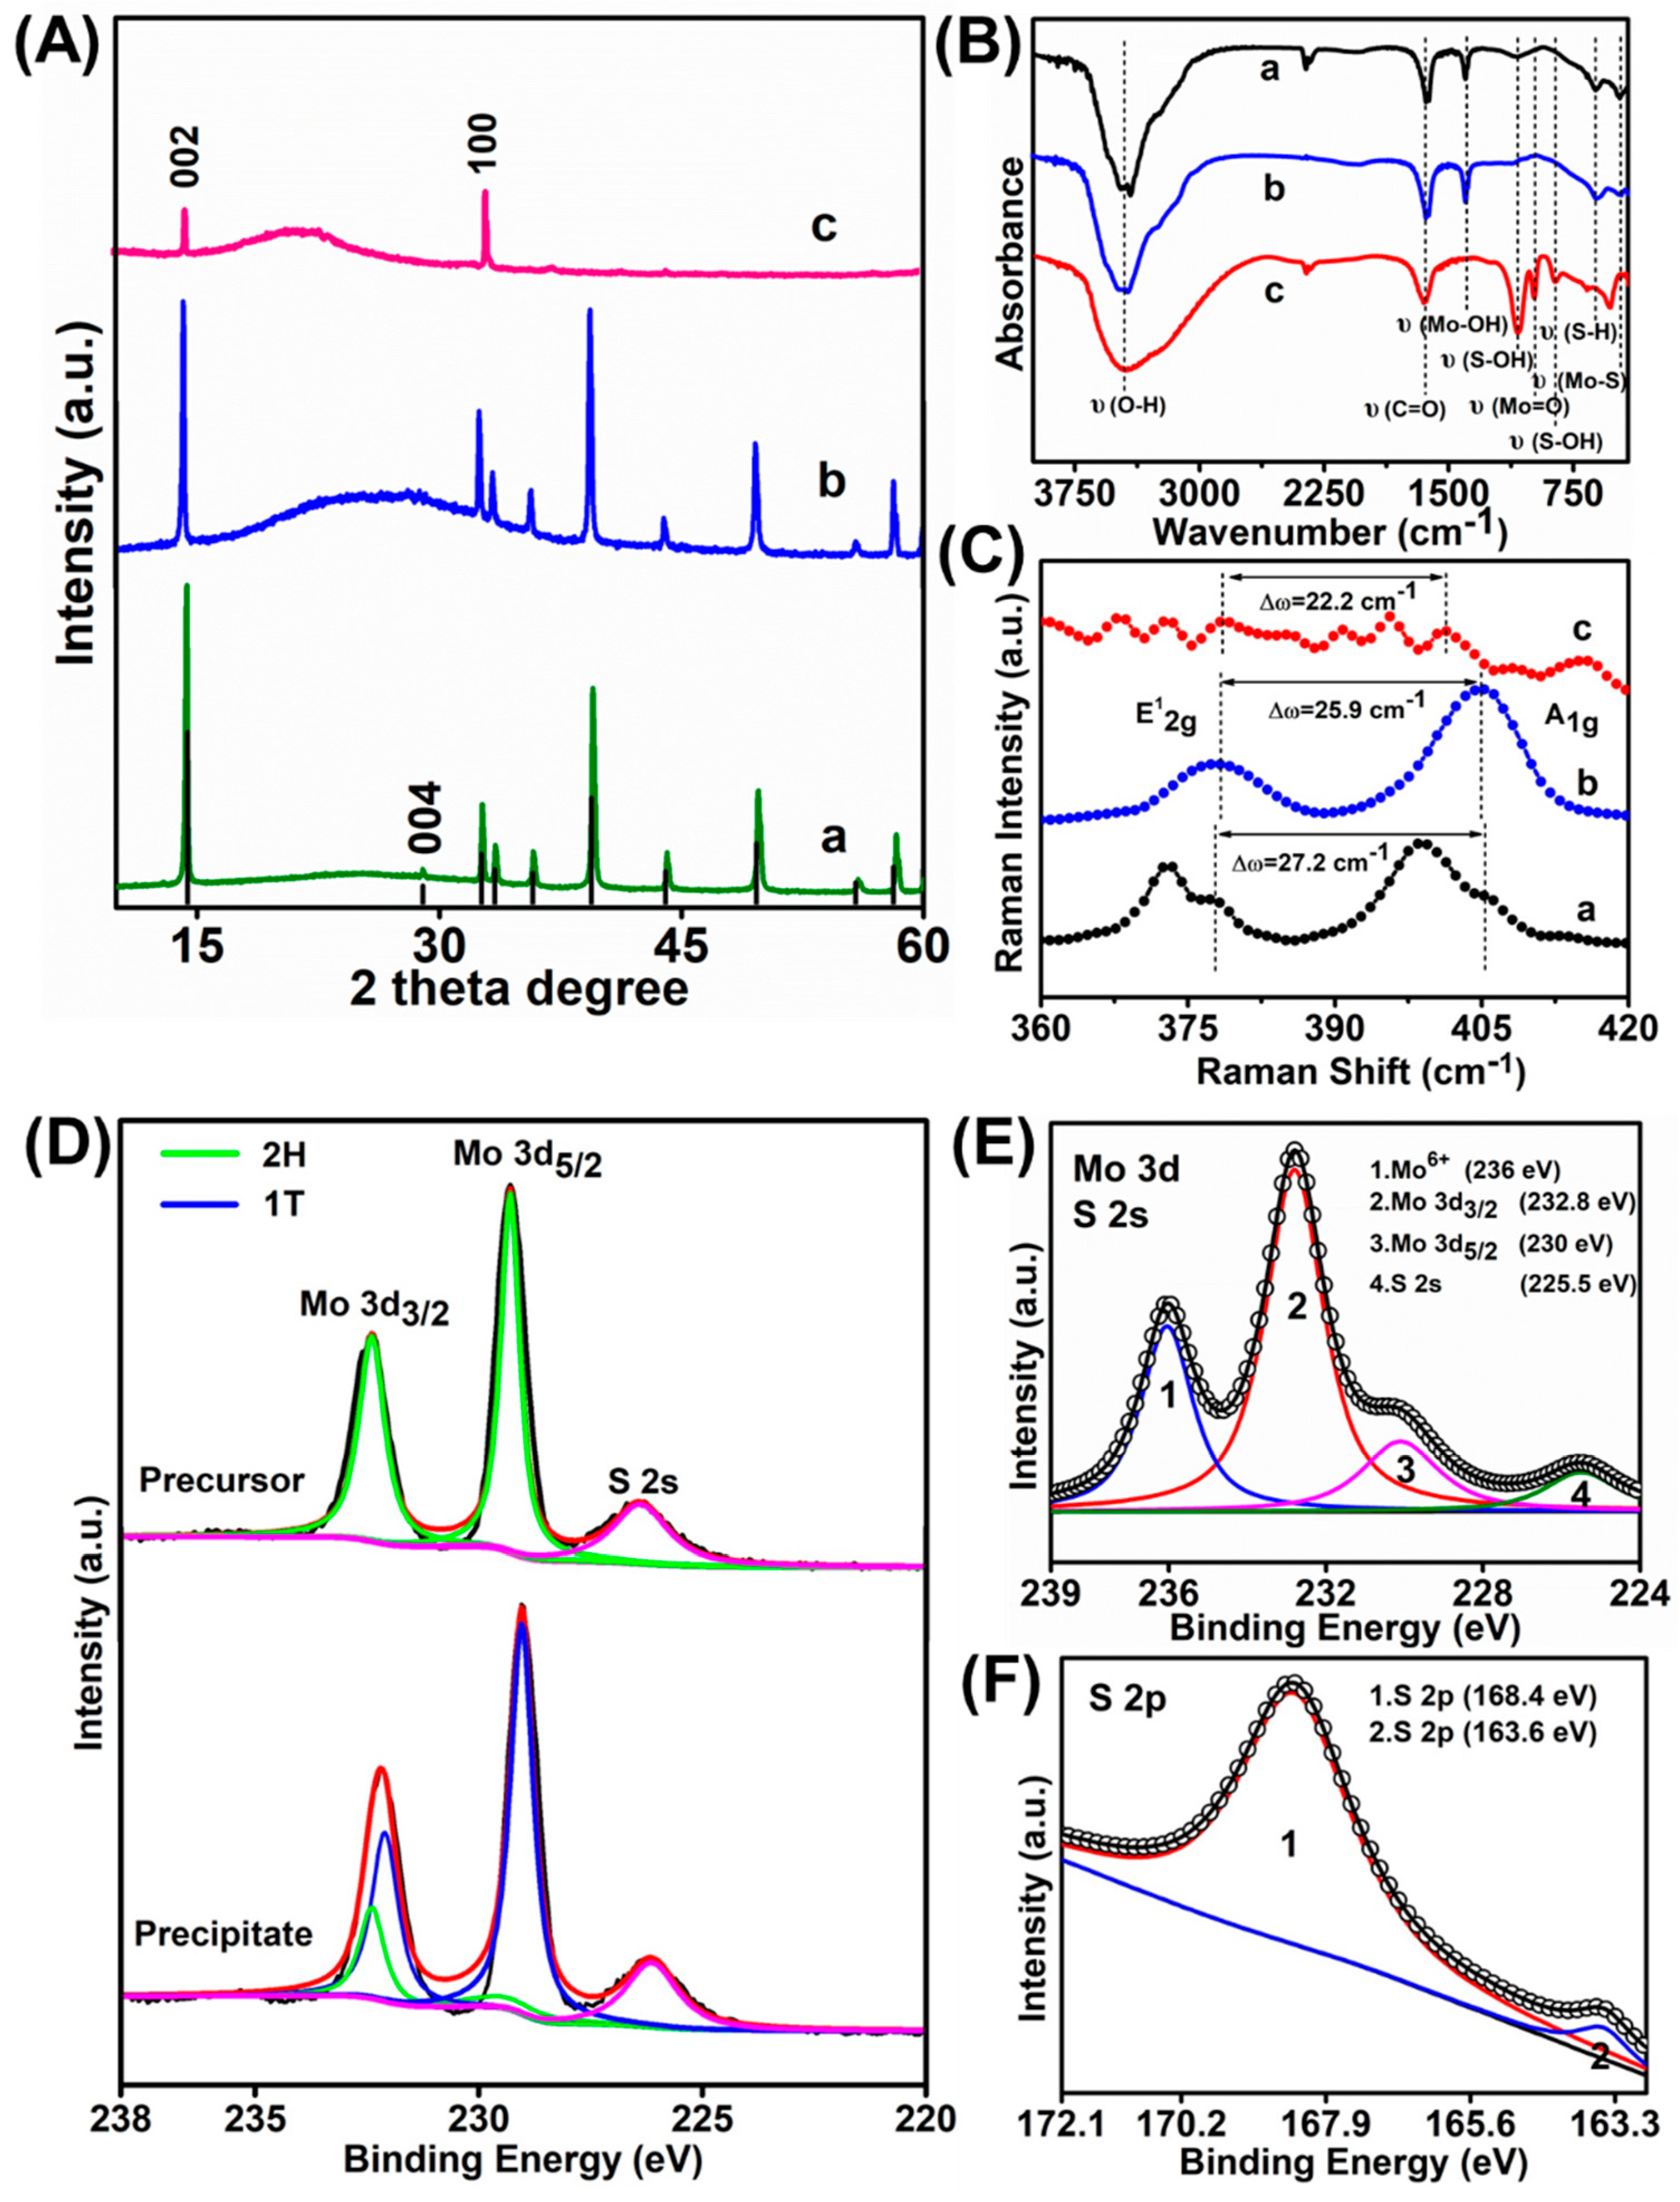
XRD patterns of the MoS2 QDs and the precipitate generated at 20 h were then investigated while using that of the MoS2 precursor for comparison. The precursor shows an intensive diffraction peak at 2θ = 14.4° and four weaker peaks at 2θ = 29.026°, 32.68°, 39.54°, and 49.79°, respectively (curve a in Figure 3A). These signals were ascribed to the (002), (004), (100), (103), and (105) lattice planes of MoS2, respectively. Other weaker peaks are also characteristic peaks of MoS2 precursor. While for the precipitate (curve b in Figure 3A), all the other characteristic peaks of MoS2 were maintained except for the 29.026° (004) peaks. The disappearance of pristine (004) planes suggested the possible variation of MoS2 from 2H to metallic 1T phase [31]. The formation of a bulge between 16.09° to 31.5° should be due to the deterioration of the crystallization of the MoS2 precipitate [32]. While for the MoS2 QDs (curve c in Figure 3A), most of the other peaks were disappeared due to their highly exfoliated structure. Only two peaks could be observed at 2θ = 14.4° (002) and 32.68° (100), respectively. Furthermore, the obvious signal decrease of the (002) indicates the formation of MoS2 QDs in a few layers. The surface functional groups on MoS2 QDs and precipitate were studied through the Fourier transform infrared (FTIR) (Figure 3B). As shown, the MoS2 precursor and precipitate have similar absorption peaks, indicating their similar surface chemistry. While for MoS2 QDs, the peaks at 3449, 952, 898, and 465 cm−1 should be attributed to the stretching vibration of C–OH, Mo=O, S–OH, and Mo–S, respectively [22,24,33]. Also, the vibrational absorption of C=O at 1600 cm−1 could be observed [22]. However, the Mo–OH bending vibration at 1384 cm−1 and S–H at 619 cm−1 disappeared compared with the MoS2 precursor and the precipitate form [33]. It can obtain that the S–OH and Mo=O functional groups were generated on the MoS2 QDs surface, suggesting that the MoS2 QDs are slightly oxidized. Raman spectroscopy was further applied to understand the chemical bonding of the products. Generally, these peak position shifts in Raman spectroscopy can be used to recognize the layer thicknesses of the 2D layer material [34]. The Raman spectra of MoS2 precursor showed two distinct characteristic peaks being ascribed to the high energy in-plane vibration A1g at 405.2 cm−1 and the lower energy out-of-plane vibration E12g at 378 cm−1 (curve a in Figure 3C) [35,36]. The position of the E12g and A1g peak in the MoS2 precipitate (curve b in Figure 3C) shows that the intrinsic hexagonal lattices in MoS2 were still maintained. While the E12g and A1g modes in the precipitates showed red and blue shifts, respectively, compared with those of MoS2 precursor. Accordingly, the position difference value between the two modes changed from 27.2 cm−1 to 25.9 cm−1. Accordingly, it is speculated that the MoS2 layered structure was destroyed during the electrolysis process, resulting in the reduced MoS2 layers, smaller sizes, and more defects, which were consistent with previously reported results [37,38]. Meanwhile, blue shifts of A1g mode (curve c in Figure 3C), reduced frequency difference between E12g and A1g modes (22.2 cm−1) and more abundant Raman peaks were observed for the MoS2 QDs than those for both the precursor and precipitate [37,38]. Therein, the abundant peaks should be attributed to the defects generated at the surfaces and edges of the MoS2 QDs, which are significant factor for the corresponding FL emission [37,39].
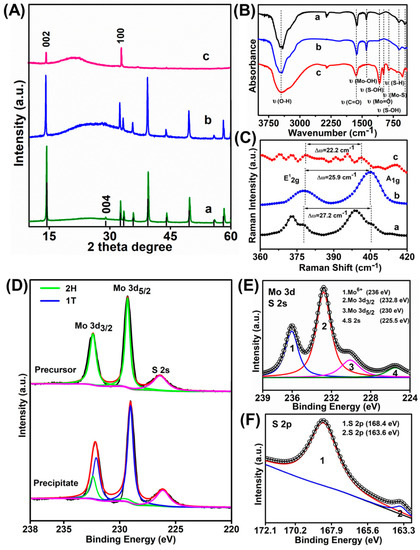
Figure 3.
(A) XRD patterns, (B) FTIR spectra, and (C) Raman spectra of a) MoS2 precursor, b) MoS2 precipitate, c) MoS2 QDs, respectively. XPS spectra of the MoS2 samples: (D) narrow scan spectra of Mo 3d of the MoS2 precursor (above) and the precipitate (below), respectively. (E) Mo 3d and (F) S 2p peak of the MoS2 QDs.
X-ray photoelectron spectroscopy (XPS) was further measured to study the elemental composition and surface state of the as-obtained MoS2 samples. As observed, the MoS2 precursor (above curve in Figure 3D) showed its 2H-phase based on the Mo 3d5/2 and Mo 3d3/2 orbitals at 229.3 eV and 232.4 eV, as well as the S 2p3/2 at 161.4 eV and the S 2p1/2 orbital at 162.5 eV (Figure S2), respectively. Compared with the precursor, an obvious red shift of Mo 3d5/2 and Mo 3d3/2 orbitals was obtained for the MoS2 precipitate (below curve in Figure 3D) and the newly appearing peaks at 229 eV (blue line of Mo 3d5/2) and 231.1 eV (blue curve of Mo 3d3/2) are resulted from the 1T phase of MoS2 [5b]. Similarly, the newly emerging peaks at 161.8 eV (blue line of S 2p3/2) and 163.1 eV (blue curve of S 2p1/2) were observed in the S 2p spectra, which again indicated the presence of 1T phase in the MoS2 precipitate (Figure S2) [2,40]. The results of the phase transformation in the as-obtained precipitates through the XPS analysis were consistent with the XRD results. Accordingly, it is concluded that the alteration of MoS2 from 2H to 1T phase indeed occurred during the electrolysis process. In addition, the precipitates were mixed with MoS2 in both two phases. The XPS spectra of the MoS2 QDs in the Mo 3d region which could be divided into four peaks (Figure 3E). Therein, the two intense peaks at 232.8 and 230.0 eV being ascribed to Mo 3d3/2 and Mo 3d5/2, respectively, should be due to the Mo4+ in the MoS2 QDs [8,11,41]. The one at 225.5 eV corresponds to the S 2s of MoS2 QDs [8,42]. The minor peak locating at 236.0 eV should be due to the Mo6+, which corresponds to the slight oxidation of Mo edges of the MoS2 upon the exfoliation process [13]. The formation of Mo=O bonds was consistent with the FTIR spectrum (Figure 3B). Meanwhile, the high-resolution S 2p peaks at 168.4 and 163.6 eV represent were ascribed to the sulfide (Figure 3F) [43].
On the basis of the above-mentioned characterizations, the formation mechanism of the MoS2 QDs and nanosheets based on the BPE strategy can be proposed as follows: two platinum sheets act as the driving electrode in the BPE system, and the MoS2 powder was used as the conductors. When the drive voltage (Etotal) of the 5 V was applied on the Pt electrodes, the electrochemical reaction can occur in the solution near both ends of MoS2, although there is no direct contact between the Pt electrode and the MoS2. The voltage provided by a DC power supply forms an electric field between the cathode and the anode, and the conductor in the electric field (i.e., MoS2) produces a polarization potential (δ) due to the existence of the electric field. The terminal of the conductor near the driving anode (i.e., the part opposite the anode of the DC power supply in the schematic diagram) is negatively charged and become the cathode of BPE. The conductor near the driving cathode (i.e., the opposite to the cathode of the DC power supply in the schematic diagram) is positively charged and becomes the anode of the BPE. The anodic polarization potential δ+ and the cathodic one δ− of the BPE drive the occurrence of electrochemical reactions on the BPE to produce electric current. The total current flowing through the BPE system is divided into two parts: one part flows into the electrolyte solution and one part flows through the suspension of MoS2 precursor, which supplied as countless conductors in the BPE systems. It is due to the current flowing through the so-called conductors to cause the electrochemical exfoliation of bulk MoS2 to firstly sheets in fewer layers and smaller sizes as well as more defects and phase variation, and then to nanosheets, and finally to the nanodots. Bubbles were observed on the platinum electrodes during electrolysis, indicating the possible evolution of oxygen and hydrogen, which should be favorable for the scissoring of the bulk MoS2 to smaller nanosheets and QDs [20]. The as-obtained nanodots could further enhance the formation of the defects and phase transformation of the MoS2 and so forth, the longer the electrochemical stripping time of QDs and nanosheets, the higher the yield.
To further elucidate the novelty of this work, comparison of the previous works with the present one has been added in Table S1 in the Supporting Information [8,13,24,44,45,46]. As indicated, the present work possesses comparable or superiority such as high quantum yield, simple, convenience, environmental-friendliness, etc.
3.2. Applications of the As-Obtained MoS2 QDs
Cotton fibers were dyed with MoS2 QDs aqueous suspension, washed by deionized water, and then dried at 50 °C in the air and finally observed by the inverted fluorescence microscope. As can be seen in Figure S3, the MoS2 QDs showed well excitation wavelength-dependent fluorescence for the stained cotton fibers, which are red, blue and green staining under the exposure of green, UV and blue light irradiation (Figure S3). This result confirmed the great application potential of the as-prepared MoS2 QDs as valuable fluorochromes in bio-/chem- staining.
Due to the intrisic biocompatiblity of the MoS2, the as-prepared MoS2 QDs were tested in the bioimaging taking bamboo fiber cells as representatives. Images were collected by laser scanning confocal microscopy (LSCM) after incubation of 5% CO2 with MoS2 QD for 4 h at 37 °C. More information in detail was presented in the Supporting Information. As indicated in Figure 4A, the cells incubated with MoS2 QDs exhibited distinct blue PL upon irradiation with a 365 nm excitation light. Due to the small size (<5 nm) of the MoS2 QDs, it is easily taken up by cells, enabling efficient bioimaging [47].
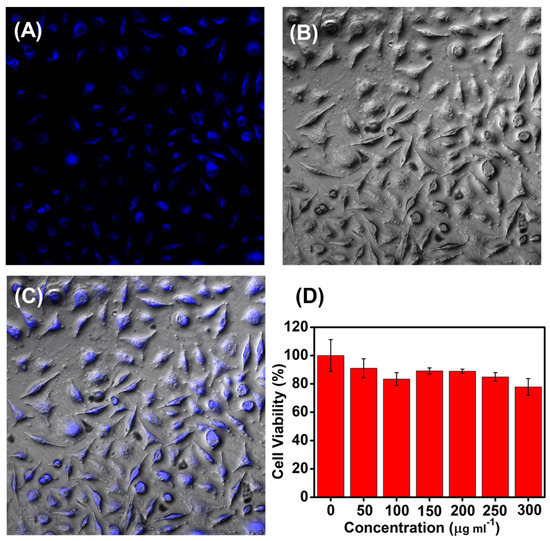
Figure 4.
LSCM images of bamboo fiber cells from incubated with MoS2 QDs of 60 μg mL−1 for 4 h at 37 °C. (A) PL images and (B) bright field images; Excitation wavelength was set at 365 nm; (C) overlay of (A) and (B). (D) MTT assay of the bamboo fiber cells after being treated with of MoS2 QDs at various concentrations of 0, 50, 100, 150, 200, 250, and 300 µg mL−1, respectively. The viability of the cells without MoS2 QDs incubation were set as the control (100%).
The MTT assay was further performed to study the cytotoxicity of the as-obtained MoS2 QDs (Figure 4D). The survival rates slightly went down accompanying with the incremental concentrations of the MoS2 QDs including 0, 50, 100, 150, 200, 250, and 300 μg mL−1, respectively. In the culture medium with the maximum tested MoS2 QDs concentration, the cell viability of the cells reached 80%. The good biocompatibility of the as-obtained MoS2 QDs to the cells was confirmed by MTT assay.
3.3. Application of Precipitate Containing the Nanosheets in EMW Absorption
As reported, MoS2 nanomaterials with rich defects and good conductivity possess abundant polarization centers and dielectric relaxation, thus leading to conspicuous dielectric loss, and eventually efficient absorption towards the EMW [9]. Through the analysis of the morphology and structure of the MoS2 precipitate as-described above, the precipitate containing the nanosheets with poor crystallinity. This may be caused by a large number of defects before the crystal phase transition occurs. Due to MoS2 QDs are formed on the MoS2 sheets, cavities and defects on the surface and edge of MoS2 precursor were formed, and lots of MoS2 nanosheets were created because of the electrolysis process, so the structure of the MoS2 precursor was destroyed to a certain extent. Therefore, MoS2 precipitate should be a good EMW absorbing material.
To understand the EMW absorption performance of the MoS2 precipitate, electromagnetic parameters of MoS2 precipitate–wax and MoS2 precursor–wax composites with 60 wt % wax loadings were studied in the frequency ranging from 2.0 to 18.0 GHz via the coaxial method. The RL curves of MoS2 precipitate–wax and MoS2 precursor–wax composites were obtained from the measured electromagnetic parameters at a suggested layer thickness and frequency by the transmit line theory that is indicated based on the following equations (Equations (1) and (2)) [48,49]
where and are the relative complex permittivity and permeability of the absorber, respectively, while is the impedance of free space, is the velocity of light, is the frequency of microwaves, and are the input impedance and the thickness of the absorber, respectively. Considering the weak magnetic properties of MoS2, and are taken as 1 and 0, respectively. When RL value is lower than −10 dB, 90% of EMW energy could be absorbed, implying the materials can be used as practical applications.
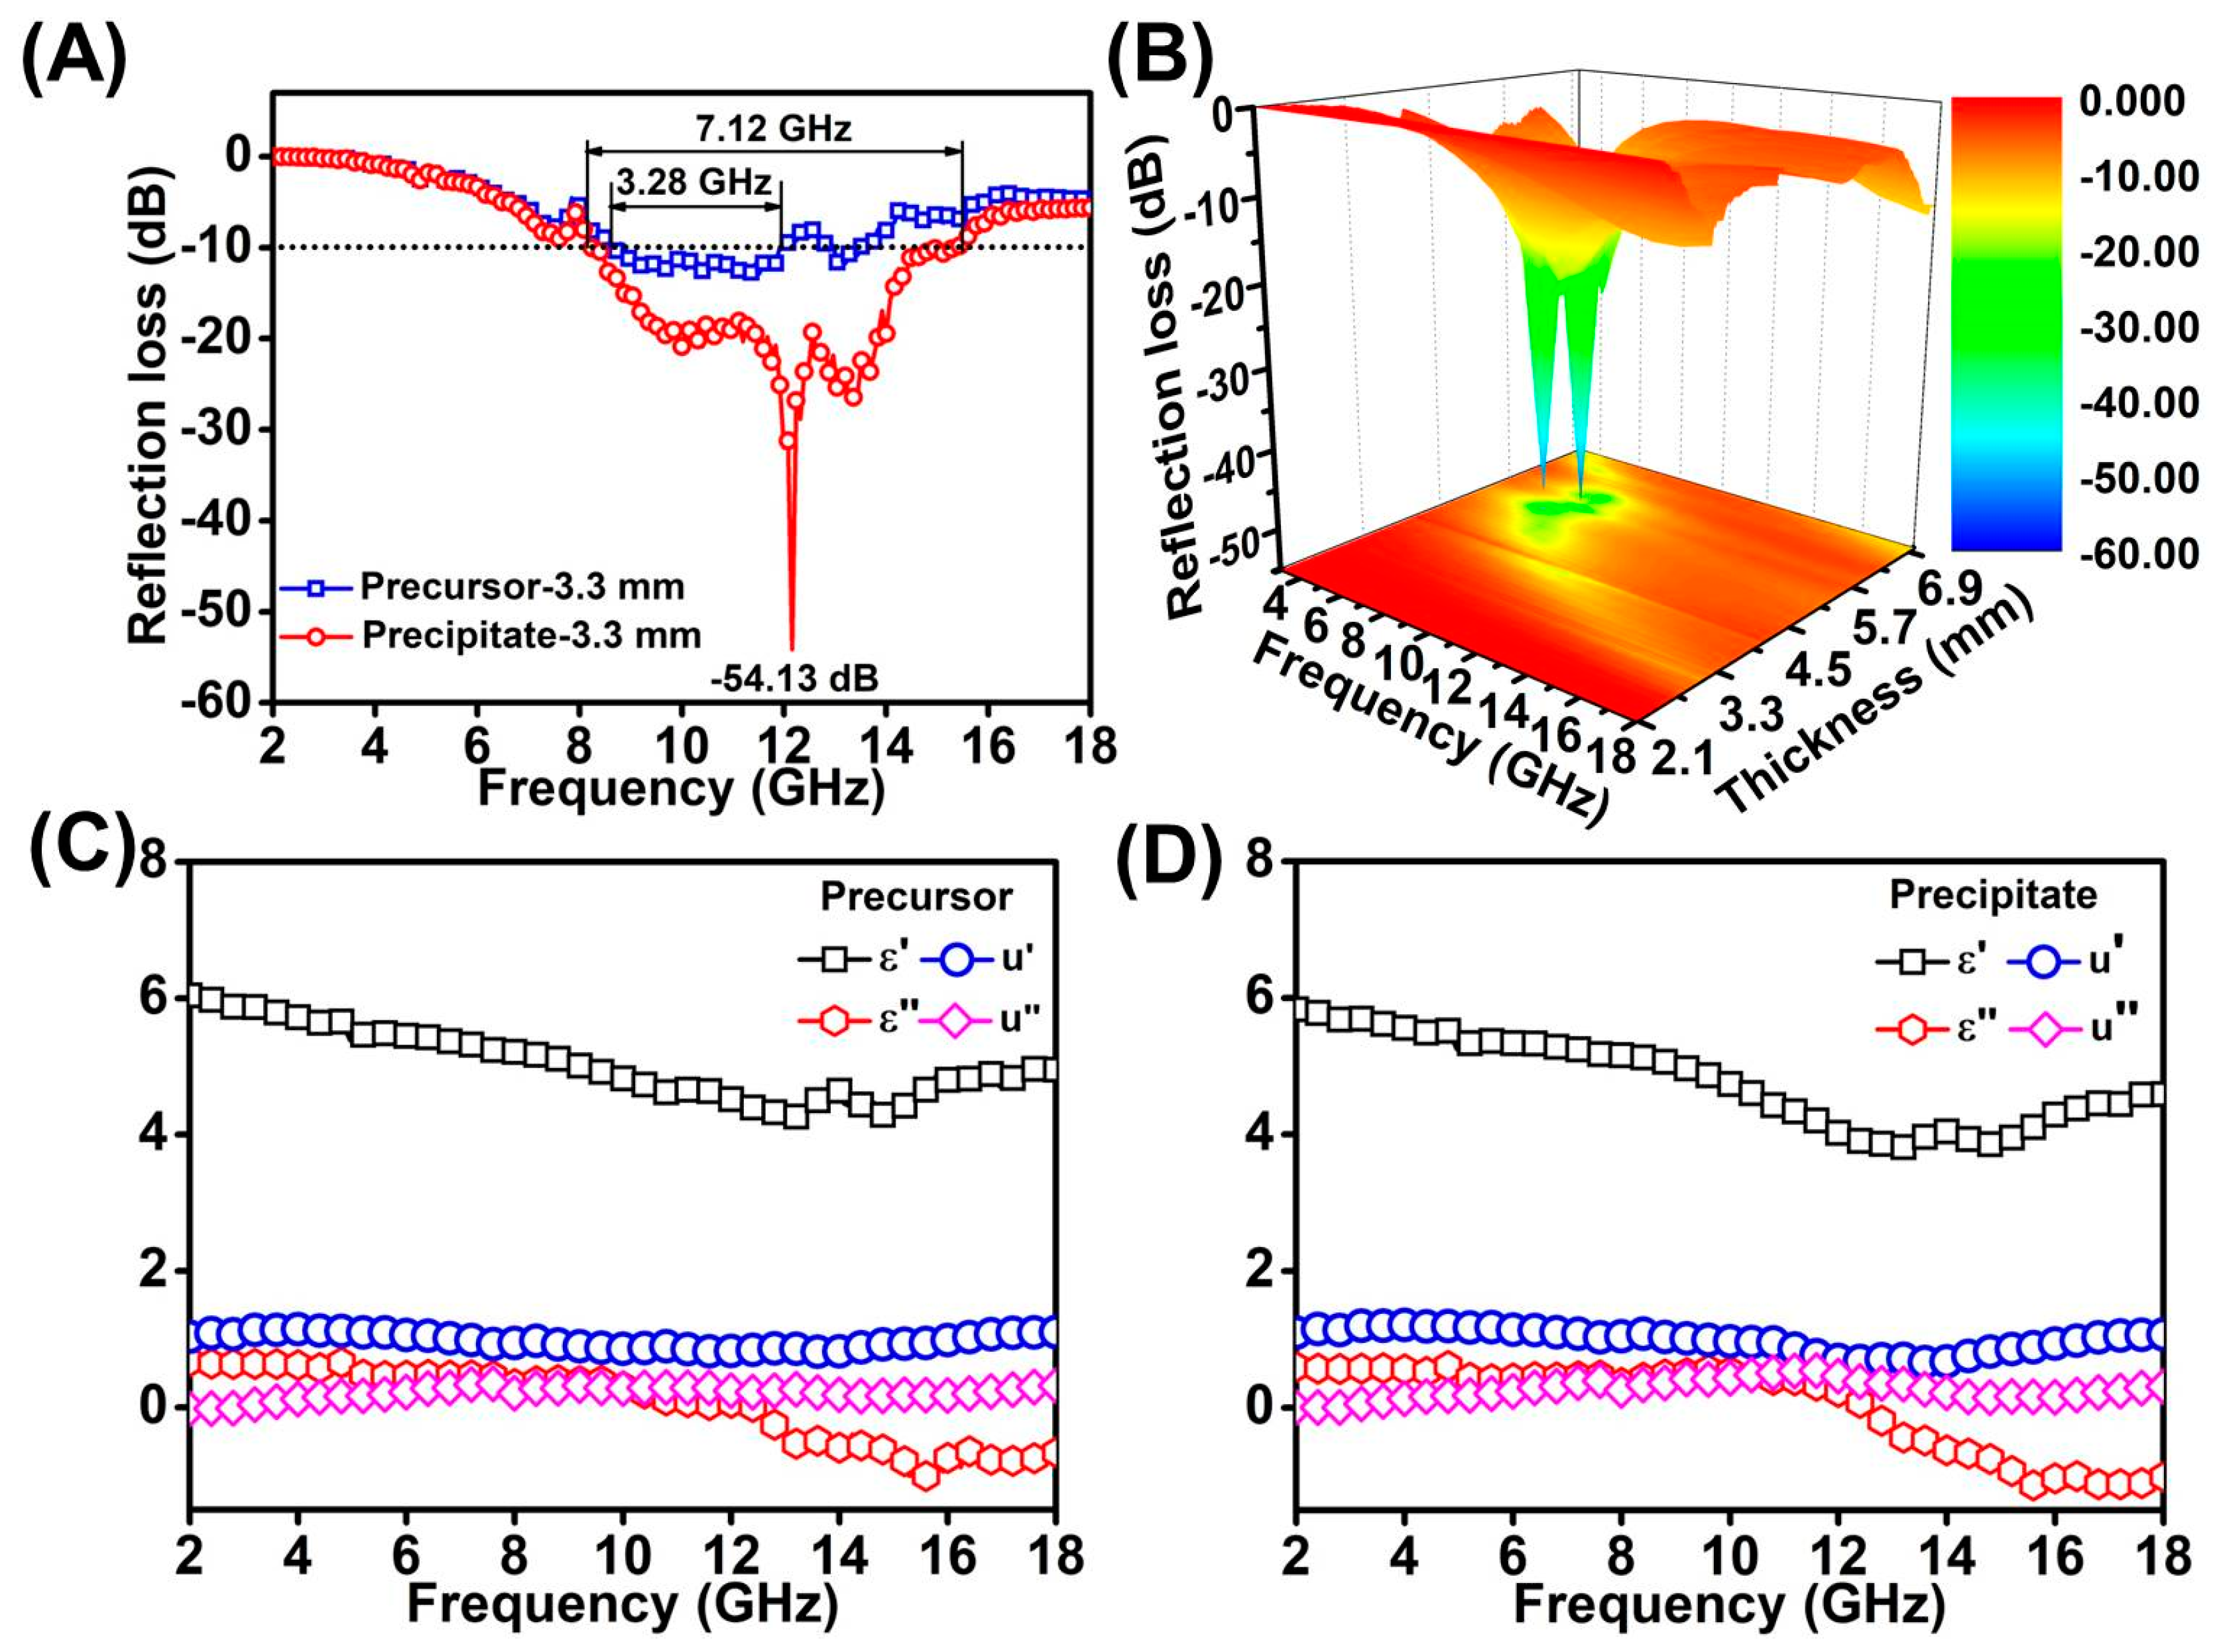
Figure 5A shows the RL values and effective absorption bandwidths (the frequency range of RL ≤ −10 dB) of MoS2 precipitate–wax and MoS2 precursor–wax composites at the thicknesses of 3.3 mm. The lowest RL value of MoS2 precipitate–wax could reach −54.13 dB at a thickness of 3.3 mm, which was stronger than that of the MoS2 precursor–wax composites. The effective absorption bandwidth of 7.12 GHz and 3.28 GHz of MoS2 precipitate–wax and MoS2 precursor–wax composites were achieved at the thicknesses of 3.3 mm, which means that MoS2 precipitate–wax composites exhibit broader absorption bandwidth than MoS2 precursor–wax composites. Figure 6B show the 3D plots of RL with different thickness and frequency of MoS2 precipitate–wax.
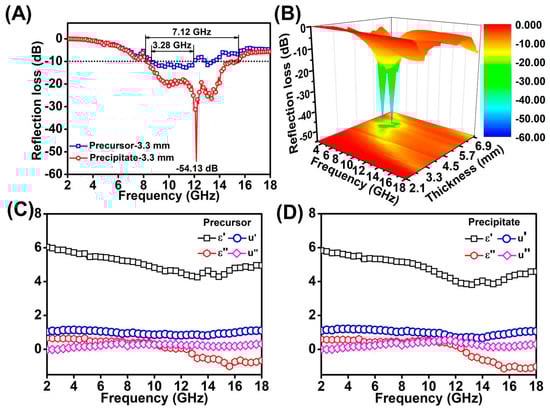
Figure 5.
(A) The RL values and effective absorption bandwidths of MoS2 precipitate–wax and MoS2 precursor–wax composites at thicknesses of 3.3 mm in the range of 2.0–18.0 GHz. (B) 3D RL plots of MoS2 precipitate–wax composites at thicknesses in the range of 2.0–18.0 GHz. The electromagnetic parameters of MoS2 precursor–wax composites (C) and MoS2 precipitate–wax composites (D).
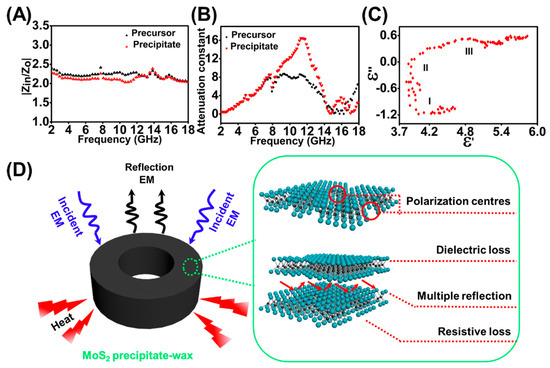
Figure 6.
ratios (A) and (B) of MoS2 precursor–wax composites and MoS2 precipitate–wax composites. (C) Cole–Cole plots for MoS2 precipitate–wax composites. (D) The mechanism of high EM wave absorption efficiency based on the MoS2 precipitate.
The real parts of complex permittivity () and imaginary parts () stand for the storage and the loss capability of electromagnetic energy, respectively. As can be seen from Figure 5C,D, the and of the two samples have similar trends with the change of frequency and the values of and for MoS2 precursor–wax composites are slightly smaller than MoS2 precipitate–wax composites. The values and are found to descend with the rising of frequency in the 2.0–13.0 GHz. Resulting from the lack of magnetism for the two samples, the real part () and the imaginary part () of the complex permeability was independent of the frequency, and remain 1 and 0, respectively.
There are two key factors to evaluate an excellent absorber. One is the impedance matching (), which requires the equality of the electromagnetic parameters based on Equation (2). When is close to 1, the EMW could enter into the absorber with greater ease, instead of reflecting into the air, and then the optimal absorption performance can be achieved. The other is the EMW attenuation constant () in the interior of the absorber, the larger the value, the more electromagnetic energy is absorbed. The values of determining the attenuation properties of materials and can be denoted by [50]
Figure 6A gives the frequency dependence of and values for MoS2 precipitate–wax composites and MoS2 precursor–wax composites in the frequency range between 2.0 and 18.0 GHz. As can be seen from Figure 6A, of MoS2 precipitate–wax composites are closer to 1. It shows that the characteristic of the MoS2 precipitate–wax composites is better than MoS2 precursor–wax composites, which means that the EMW is easier to enter the absorber of MoS2 precipitate–wax composites. Figure 6B exhibits the frequency dependence of the in the range of 2.0–18.0 GHz. The MoS2 precipitate–wax composites have larger values in the frequency range of 8.2–14.3 GHz, which means compared with MoS2 precursor–wax composites more EMW energy is absorbed for MoS2 precipitate–wax composites. Therefore, due to the good and high , MoS2 precipitate have better electromagnetic absorption properties than that of MoS2 precursor.
Based on the Debye theory, and can be described as [15]
where is angular frequency, is polarization relaxation time, is static permittivity, is relative dielectric permittivity at high-frequency limit and is electrical conductivity. From the Debye theory Equation (4), we can conclude that with increasing of frequency the value would be decreased, and that is consistent with the results of Figure 5C [51]. Equation (5) shows that is depended on the polarization and .
When the second part of the Equation (4) is not considered, the connection between and can be described as
The Equation (6) represents to a circle centered at , and every section of the arc form corresponds a Debye relaxation process. Figure 6C indicates the relationship of between for MoS2 precipitate–wax composites in the frequency range of 2.0–18.0 GHz, and three clear semicircles can be obtained, which indicated that three Debye dipolar relaxation processes benefited to the dielectric loss mechanism for the MoS2 precipitate–wax composites [52].
The mechanism of excellent EM wave absorption property for the MoS2 precipitate was should be due to the following reasons (Figure 6D). Compared with MoS2 precursor material, MoS2 precipitate exhibits excellent and enhanced EMW attenuation capability, which results from good and high . The good comes from the increasing of the amount of MoS2 nanosheets after electrolysis. The high derives from the enhanced dielectric loss, which mainly caused by the increased polarization relaxation. When EMW propagates into the MoS2 precipitate–wax composites, some electrons could hop across the defects and the interface, which could contribute to the dielectric loss [8]. The enhanced dipolar polarization is enhanced by the increased surface point defects. After electrolysis, MoS2 QDs are formed and peel off from the MoS2 precursor, and plentiful QDs cavities on the surface and edge of MoS2 were formed. The point defects could act as polarization centers under an alternating electric field. The interfacial polarization was enhanced, too, which mainly originates from the interface generated by the increased MoS2 layers. Also, due to the phase variation from 2H MoS2 to 1T MoS2 in the process of electrolysis, the existed high conductivity of 1T MoS2 in the MoS2 precipitate composites has a positive contribution, that is enhanced resistive loss, towards EMW energy attenuation. The efficient EMW performance of the precipitate not only suggested the great application potential of the by-product of the MoS2 QDs, but also gave indirect evidence of the defects and phase variation generated during the BPE process.
4. Conclusions
In summary, a low cytotoxicity, simple, and nondestructive BPE electrochemical method has been developed to synthesize MoS2 QDs with a narrow size distribution and excellent aqueous solubility. Meanwhile, MoS2 nanosheets could also be observed in the electrolyzed precipitate, which showed excellent electromagnetic absorption performance. The BPE electrochemical process was not limited with the shape of the MoS2 precursor and could lead to the defects and phase variation of the MoS2 precursor, finally resulting in the as-prepared QDs and nanosheets. The advantages of this work can be summarized as follows. Firstly, MoS2 QDs was produced via simple, one-step top-down method, which is relatively low-cost and environmentally friendly due to the simple electrochemical instrument and low cytotoxicity PBS electrolyte. Secondly, the as-prepared MoS2 QDs is hydrosoluble, has low cytotoxicity, and is confirmed to be a promising alternative in PL staining and cell imaging. Furthermore, due to the defects and the phase transformation of the MoS2 deduced in the EC process, the as-produced precipitates containing the MoS2 nanosheets are highly efficient as an EMW absorber with its strong RL value and broad bandwidth absorption. The BPE design provides a versatile approach to prepare 2D layered nanomaterials in a convenient way. This work would widen the applicability of both the electrochemical methods and the 2D micro-/nano- materials.
Supplementary Materials
The following are available online at https://www.mdpi.com/2079-4991/9/6/906/s1, Figure S1: FL emission spectra with various excitation wavelengths of the supernatant under different peeling conditions. (A) 0.2 M NH4F, 5 V, 20 h; (B) 0.2 M H2SO4, 5 V, 20 h; (C) 0.2 M PBS (pH = 7.4), 3 V, 20 h; (D) 0.2 M PBS (pH = 7.4), 7 V, 20 h; (E) 0.2 M PBS (pH = 7.4), 5 V, 10 h; (F) 0.2 M PBS (pH = 7.4), 5 V, 30 h. Figure S2: XPS spectra of the S 2p peak regions of MoS2 precursor (above) and MoS2 precipitate (below) samples. Figure S3: (A) Bright-field and (B–D) fluorescent images of cotton fiber stained with MoS2 QDs. The fluorescent images were obtained at the excitation wavelengths of (B) 510–550 nm, (C) 330–385 nm, (D) 450–480 nm. Scale bar: 50 mm. Table S1: To further elucidate the novelty of this work, comparison of previous works with this one.
Author Contributions
Conceptualization, Y.X.; Data curation, Y.L. and X.W.; Formal analysis, Y.L. and X.W.; Investigation, Y.L.; Methodology, Y.L., M.L., and Y.X.; Project administration, M.L. and Y.X.; Resources, X.W., H.L., L.D., L.H., S.W., and C.Z.; Supervision, Y.X.; Validation, Y.L.; Writing—original draft, Y.L., and X.W.; Writing—review & editing, Y.L. and Y.X.
Funding
This work was supported by the National Nature Science Foundation of China (nos. 21575071 and 21874079), Nature Science Foundation for Outstanding Young Scientists of Shandong Province (ZR2018JL011), Science & Technology Fund Planning Project of Shandong Colleges and Universities (J16LA13), Qingdao Science & Technology Planning Project (17-6-3-15-gx).
Conflicts of Interest
The authors declare no conflict of interest.
References
- Pavlović, S.; Peeters, F.M. Electronic properties of triangular and hexagonal MoS2 quantum dots. Phys. Rev. B 2015, 91, 155410. [Google Scholar] [CrossRef]
- Wang, X.; Wu, Q.; Jiang, K.; Wang, C.; Zhang, C. One-step synthesis of water-soluble and highly fluorescent MoS2 quantum dots for detection of hydrogen peroxide and glucose. Sens. Actuators B Chem. 2017, 252, 183–190. [Google Scholar] [CrossRef]
- Lee, Y.H.; Zhang, X.Q.; Zhang, W.; Chang, M.T.; Lin, C.T.; Chang, K.D.; Yu, Y.C.; Wang, J.T.W.; Chang, C.S.; Li, L.J.; et al. Synthesis of large-area MoS2 atomic layers with chemical vapor deposition. Adv. Mater. 2012, 24, 2320–2325. [Google Scholar] [CrossRef] [PubMed]
- Zhang, G.; Liu, H.; Qu, J.; Li, J. Two-dimensional layered MoS2: Rational design, properties and electrochemical applications. Energy Environ. Sci. 2016, 4, 1190–1209. [Google Scholar] [CrossRef]
- Huang, L.B.; Zhao, L.; Zhang, Y.; Chen, Y.Y.; Zhang, Q.H.; Luo, H.; Zhang, X.; Tang, T.; Gu, L.; Hu, J.S. Self-limited on-site conversion of MoO3 nanodots into vertically aligned ultrasmall monolayer MoS2 for efficient hydrogen evolution. Adv. Energy Mater. 2018, 8, 1800734. [Google Scholar] [CrossRef]
- Yan, Y.; Xia, B.; Xu, Z.; Wang, X. Recent development of molybdenum sulfides as advanced electrocatalysts for hydrogen evolution reaction. ACS Catal. 2014, 4, 1693–1705. [Google Scholar] [CrossRef]
- Liang, X.; Zhang, X.; Liu, W.; Tang, D.; Zhang, B.; Ji, G. A simple hydrothermal process to grow MoS2 nanosheets with excellent dielectric loss and microwave absorption performance. J. Mater. Chem. C 2016, 4, 6816–6821. [Google Scholar] [CrossRef]
- Li, B.L.; Chen, L.X.; Zou, H.L.; Lei, J.L.; Luo, H.Q.; Li, N.B. Electrochemically induced Fenton reaction of few-layer MoS2 nanosheets: Preparation of luminescent quantum dots via a transition of nanoporous morphology. Nanoscale 2014, 6, 9831–9838. [Google Scholar] [CrossRef] [PubMed]
- Ning, M.Q.; Lu, M.M.; Li, J.B.; Chen, Z.; Dou, Y.K.; Wang, C.Z.; Rehman, F.; Cao, M.S.; Jin, H.B. Two-dimensional nanosheets of MoS2: A promising material with high dielectric properties and microwave absorption performance. Nanoscale 2015, 7, 15734–15740. [Google Scholar] [CrossRef]
- Xu, G.; Wang, X.; Sun, Y.; Chen, X.; Zheng, J.; Sun, L.; Jiao, L.; Li, J. Metallic and ferromagnetic MoS2 nanobelts with vertically aligned edges. Nano Res. 2015, 9, 2946–2953. [Google Scholar] [CrossRef]
- Lin, H.; Wang, C.; Wu, J.; Xu, Z.; Huang, Y.; Zhang, C. Colloidal synthesis of MoS2 quantum dots: Size-dependent tunable photoluminescence and bioimaging. New J. Chem. 2015, 39, 8492–8497. [Google Scholar] [CrossRef]
- Zhu, H.; Zhang, H.; Xia, Y. Monodisperse three-layered MoS2 quantum dots as fluorescent reporters for 2,4,6-trinitrotoluene sensing in environmental water and luggage cases. Anal. Chem. 2018, 90, 3942–3949. [Google Scholar] [CrossRef] [PubMed]
- Gopalakrishnan, D.; Damien, D.; Shaijumon, M.M. MoS2 quantum dot-interspersed exfoliated MoS2 nanosheets. ACS Nano 2014, 8, 5297–5303. [Google Scholar] [CrossRef] [PubMed]
- Wang, Q.; Li, J. Facilitated lithium storage in MoS2 overlayers supported on coaxial carbon nanotubes. J. Phys. Chem. C 2007, 4, 1675–1682. [Google Scholar] [CrossRef]
- Wu, F.; Xie, A.; Sun, M.; Wang, Y.; Wang, M. Reduced graphene oxide (RGO) modified spongelike polypyrrole (PPy) aerogel for excellent electromagnetic absorption. J. Mater. Chem. A 2015, 3, 14358–14369. [Google Scholar] [CrossRef]
- Dong, H.; Tang, S.; Hao, Y.; Yu, H.; Dai, W.; Zhao, G.; Cao, Y.; Lu, H.; Zhang, X.; Ju, H. Fluorescent MoS2 quantum dots: Ultrasonic preparation, up-conversion and down-conversion bioimaging, and photodynamic therapy. ACS Appl. Mater. Inter. 2016, 8, 3107–3114. [Google Scholar] [CrossRef] [PubMed]
- Arul, N.S.; Nithya, V.D. Molybdenum disulfide quantum dots: Synthesis and applications. RSC Adv. 2016, 6, 65670–65682. [Google Scholar] [CrossRef]
- Leong, S.X.; Mayorga-Martinez, C.C.; Chia, X.; Luxa, J.; Sofer, Z.; Pumera, M. 2H → 1T phase change in direct synthesis of WS2 nanosheets via solution-based electrochemical exfoliation and their catalytic properties. ACS Appl. Mater. Inter. 2017, 9, 26350–26356. [Google Scholar] [CrossRef]
- Gui, R.; Jin, H.; Wang, Z.; Li, J. Black phosphorus quantum dots: Synthesis, properties, functionalized modification and applications. J. Chem. Soc. Rev. 2018, 47, 6795–6823. [Google Scholar] [CrossRef]
- Mayorga-Martinez, C.C.; Khezri, B.; Eng, A.Y.S.; Sofer, Z.; Ulbrich, P.; Pumera, M. Bipolar electrochemical synthesis of WS2 nanoparticles and their application in magneto-immunosandwich assay. Adv. Funct. Mater. 2016, 26, 4094–4098. [Google Scholar] [CrossRef]
- Liu, H.; Ye, T.; Mao, C. Fluorescent carbon nanoparticles derived from candle soot. Angew. Chem. 2007, 119, 6593–6595. [Google Scholar] [CrossRef]
- Huang, H.; Du, C.; Shi, H.; Feng, X.; Li, J.; Tan, Y.; Song, W. Water-soluble monolayer molybdenum disulfide quantum dots with upconversion fluorescence. Part. Part. Syst. Charact. 2015, 32, 72–79. [Google Scholar] [CrossRef]
- Liu, Y.; Nan, H.; Wu, X.; Pan, W.; Wang, W.; Bai, J.; Zhao, W.; Sun, L.; Wang, X.; Ni, Z. Layer-by-layer thinning of MoS2 by plasma. ACS Nano 2013, 7, 4202. [Google Scholar] [CrossRef]
- Wang, Y.; Ni, Y. Molybdenum disulfide quantum dots as a photoluminescence sensing platform for 2,4,6-trinitrophenol detection. Anal. Chem. 2014, 86, 7463–7470. [Google Scholar] [CrossRef] [PubMed]
- Hinnemann, B.; Moses, P.G.; Bonde, J.; Jørgensen, K.P.; Nielsen, J.H.; Horch, S.; Chorkendorff, I.; Nørskov, J.K. Biomimetic hydrogen evolution: MoS2 nanoparticles as catalyst for hydrogen evolution. J. Am. Chem. Soc. 2005, 127, 5308–5309. [Google Scholar] [CrossRef] [PubMed]
- Melhuish, W.H. A standard fluorescence spectrum for calibrating spectro-fluorophotometers. J. Phys. Chem. 1961, 65, 229–235. [Google Scholar] [CrossRef]
- Vadivelmurugan, A.; Anbazhagan, R.; Tsai, H.C. Preparation of fluorescent MoS2 quantum dots conjugated with various ligands, and its fluorescence imaging. Mater. Lett. 2018, 218, 285–289. [Google Scholar] [CrossRef]
- Lee, C.; Yan, H.; Brus, L.E.; Heinz, T.F.; Hone, J.; Ryu, S. Anomalous lattice vibrations of single- and few-layer MoS2. ACS Nano 2010, 4, 2695–2700. [Google Scholar] [CrossRef]
- Li, H.; Wu, J.; Yin, Z.; Zhang, H. Preparation and applications of mechanically exfoliated single-layer and multilayer MoS2 and WSe2 nanosheets. Acc. Chem. Res. 2014, 47, 1067–1075. [Google Scholar] [CrossRef]
- Zhao, M.; Chen, A.Y.; Huang, D.; Chai, Y.Q.; Zhuo, Y.; Yuan, R. MoS2 quantum dots as new electrochemiluminescence emitters for ultrasensitive bioanalysis of lipopolysaccharide. Anal. Chem. 2017, 89, 8335–8342. [Google Scholar] [CrossRef]
- Li, H.; Chen, S.; Jia, X.; Xu, B.; Lin, H.; Yang, H.; Song, L.; Wang, X. Amorphous nickel-cobalt complexes hybridized with 1T-phase molybdenum disulfide via hydrazine-induced phase transformation for water splitting. Nat. Commun. 2017, 8, 15377. [Google Scholar] [CrossRef] [PubMed]
- Joensen, P.; Frindt, R.F.; Morrison, S.R. Single-layer MoS2. Mater. Res. Bull. 1986, 21, 457–461. [Google Scholar] [CrossRef]
- Bai, R.; Wang, P.; Fang, Y. Probing microstructures of molybdenum disulfide quantum dots by resonant Raman scattering. Appl. Phys. Lett. 2017, 110, 161910. [Google Scholar] [CrossRef]
- Molina-Sánchez, A.; Wirtz, L. Phonons in single-layer and few-layer MoS2 and WS2. Phys. Rev. B 2011, 84, 155413. [Google Scholar] [CrossRef]
- Ha, H.D.; Han, D.J.; Choi, J.S.; Park, M.; Seo, T.S. Dual role of blue luminescent MoS2 quantum dots in fluorescence resonance energy transfer phenomenon. Small 2014, 10, 3858–3862. [Google Scholar] [CrossRef] [PubMed]
- Gu, W.; Yan, Y.; Cao, X.; Zhang, C.; Ding, C.; Xian, Y. A facile and one-step ethanol-thermal synthesis of MoS2 quantum dots for two-photon fluorescence imaging. J. Mater. Chem. B 2016, 4, 27–31. [Google Scholar] [CrossRef]
- Mouri, S.; Miyauchi, Y.; Matsuda, K. Tunable photoluminescence of monolayer MoS2 via chemical doping. Nano Lett. 2013, 13, 5944–5948. [Google Scholar] [CrossRef] [PubMed]
- Li, H.; Lu, G.; Yin, Z.; He, Q.; Li, H.; Zhang, Q.; Zhang, H. Optical identification of single- and few-layer MoS2 sheets. Small 2012, 8, 682–686. [Google Scholar] [CrossRef]
- Clark, R.M.; Carey, B.J.; Daeneke, T.; Atkin, P.; Bhaskaran, M.P.; Latham, K.; Cole, I.S.; Kalantar-zadeh, K. Two-step synthesis of luminescent MoS2–ZnS hybrid quantum dots. Nanoscale 2015, 7, 16763. [Google Scholar] [CrossRef]
- Lin, Y.C.; Dumcenco, D.O.; Huang, Y.S.; Suenaga, K. Atomic mechanism of the semiconducting-to-metallic phase transition in single-layered MoS2. Nat. Nanotechnol. 2014, 9, 391. [Google Scholar] [CrossRef]
- Wang, Y.; Wang, S.; Li, C.; Qian, M.; Bu, J.; Wang, J.; Huang, R. Facile growth of well-dispersed and ultra-small MoS2 nanodots in ordered mesoporous silica nanoparticles. Chem. Commun. 2016, 52, 10217–10220. [Google Scholar] [CrossRef] [PubMed]
- Ren, X.; Pang, L.; Zhang, Y.; Ren, X.; Fan, H.; Liu, S. One-step hydrothermal synthesis of monolayer MoS2 quantum dots for highly efficient electrocatalytic hydrogen evolution. J. Mater. Chem. A 2015, 3, 10693. [Google Scholar] [CrossRef]
- Xiao, S.J.; Zhao, X.J.; Zuo, J.; Huang, H.Q.; Zhang, L. Highly photoluminescent MoOx quantum dots: Facile synthesis and application in off-on Pi sensing in lake water samples. Anal. Chim. Acta 2016, 906, 148–155. [Google Scholar] [CrossRef] [PubMed]
- Štengl, V.; Henych, J. Strongly luminescent monolayered MoS2 prepared by effective ultrasound exfoliation. Nanoscale 2013, 5, 3387–3394. [Google Scholar] [CrossRef] [PubMed]
- Qiao, W.; Yan, S.; Song, X.; Zhang, X.; He, X.; Zhong, W.; Du, Y. Luminescent monolayer MoS2 quantum dots produced by multi-exfoliation based on lithium intercalation. Appl. Surf. Sci. 2015, 359, 130–136. [Google Scholar] [CrossRef]
- Zhou, K.; Zhang, Y.; Xia, Z.; Wei, W. As-prepared MoS2 quantum dot as a facile fluorescent probe for long-term tracing of live cells. Nanotechnology 2016, 27, 275101. [Google Scholar] [CrossRef]
- Shi, W.; Li, X.; Ma, H. A tunable ratiometric pH sensor based on carbon nanodots for the quantitative measurement of the intracellular pH of whole cells. Angew. Chem. 2012, 51, 6432–6435. [Google Scholar] [CrossRef]
- Naito, Y.; Suetake, K. Application of ferrite to electromagnetic wave absorber and its characteristics. IEEE Trans. Microw. Theory 1971, 19, 65–72. [Google Scholar] [CrossRef]
- Zheng, Y.; Wang, X.; Wei, S.; Zhang, B.; Yu, M.; Zhao, W.; Liu, J. Fabrication of porous graphene-Fe3O4 hybrid composites with outstanding microwave absorption performance. Compos. Part A Appl. Sci. 2017, 95, 237–247. [Google Scholar] [CrossRef]
- Xiang, J.; Li, J.; Zhang, X.; Ye, Q.; Xu, J.; Shen, X. Magnetic carbon nanofibers containing uniformly dispersed Fe/Co/Ni nanoparticles as stable and high-performance electromagnetic wave absorbers. J. Mater. Chem. A 2014, 2, 16905–16914. [Google Scholar] [CrossRef]
- Wen, B.; Cao, M.S.; Hou, Z.L.; Song, W.L.; Zhang, L.; Lu, M.M.; Jin, H.B.; Fang, X.Y.; Wang, W.Z.; Yuan, J. Temperature dependent microwave attenuation behavior for carbon-nanotube/silica composites. Carbon 2013, 65, 124–139. [Google Scholar] [CrossRef]
- Zhang, X.; Ji, G.; Liu, W.; Quan, B.; Liang, X.; Shang, C.; Cheng, Y.; Du, Y. Thermal conversion of an Fe3O4@metal–organic framework: A new method for an efficient Fe–Co/nanoporous carbon microwave absorbing material. Nanoscale 2015, 7, 12932–12942. [Google Scholar] [CrossRef] [PubMed]


© 2019 by the authors. Licensee MDPI, Basel, Switzerland. This article is an open access article distributed under the terms and conditions of the Creative Commons Attribution (CC BY) license (http://creativecommons.org/licenses/by/4.0/).