Article

Rapid Quantitative Detection of Live Escherichia coli Based on Chronoamperometry

1
School of Environmental and Chemical Engineering, Xi’an Polytechnic University, Xi’an 710600, China
2
Tianjin Institute of Environmental Medicine and Operational Medicine, Tianjin 300050, China
3
School of Marine Science and Technology, Tianjin University, Tianjin 300072, China
*
Authors to whom correspondence should be addressed.
These authors contributed equally to this work.
Biosensors 2022, 12(10), 845; https://doi.org/10.3390/bios12100845
Submission received: 30 August 2022 / Revised: 27 September 2022 / Accepted: 27 September 2022 / Published: 8 October 2022
(This article belongs to the Section Environmental Biosensors and Biosensing)

Abstract

:
The rapid quantitative detection of Escherichia coli (E. coli) is of great significance for evaluating water and food safety. At present, the conventional bacteria detection methods cannot meet the requirements of rapid detection in water environments. Herein, we report a method based on chronoamperometry to rapidly and quantitatively detect live E. coli. In this study, the current indicator i0 and the electricity indicator A were used to record the cumulative effect of bacteria on an unmodified glassy carbon electrode (GCE) surface during chronoamperometric detection. Through the analysis of influencing factors and morphological characterization, it was proved that the changes of the two set electrochemical indicator signals had a good correlation with the concentration of E. coli; detection time was less than 5 min, the detection range of E. coli was 104–108 CFU/mL, and the error range was <30%. The results of parallel experiments and spiking experiments showed that this method had good repeatability, stability, and sensitivity. Humic acid and dead cells did not affect the detection results. This study not only developed a rapid quantitative detection method for E. coli in the laboratory, but also realized a bacterial detection scheme based on the theory of bacterial dissolution and adsorption for the first time, providing a new direction and theoretical basis for the development of electrochemical biosensors in the future.

1. Introduction

According to the reports conducted by the World Health Organization, common human illnesses are fundamentally related to the lack of access to safe drinking water and food [1,2]. Pathogens, as the main source of water- and foodborne diseases, have become a major threat worldwide [3,4]. Several pathogenic strains of bacteria are known to cause diverse illnesses and infections, which in some cases can even lead to death [5]. The contamination of water sources with pathogenic bacteria, such as Salmonella, Staphylococcus, and Escherichia coli, can cause typhoid fever, gastroenteritis, diarrhea, cholera, and so on [6]. E. coli is one of most important pathogenic bacteria and is widely distributed in nature [7]. It is facultative, anaerobic, Gram-negative, non-sporulating coccobacilli [6]. Considering the pathogenicity and wide distribution of E. coli strains in drinking water, food, and river and industrial waters, it is of great significance to develop not only accurate but also rapid methods to detect E. coli in these sources to protect human health [8].
At present, culture and molecular biology–based methods are conventionally used for E. coli detection and enumeration [9]. However, these traditional methods are associated with certain disadvantages, such as complicated operation and long detection time (it generally takes 1–2 days to obtain test results); thus, rapid analysis becomes challenging [9]. In recent years, many methods based on different detection principles have been developed, such as PCR [10], immunological detection [11], ATP bioluminescence [12], and flow cytometry [13]. In comparison with traditional culture methods, these new detection technologies have their own advantages, such as short detection time, high sensitivity, and excellent accuracy, but they still have the disadvantage of expensive experimental instruments, high cost, and complex operations. Biosensor-based methods have been established over the past 15 years to accelerate detection speed and enhance detection sensitivity [14,15]. Electrochemical biosensors are one of the most promising tools to detect foodborne pathogens, and accordingly, an increasing number of studies have focused on their application [9]. Some of their advantages, in comparison with other methods, include comparable sensitivity, fast response, ability to analyze a turbid solution, and ability to be miniaturized. In addition, electrochemical biosensors are inexpensive, portable, fast, and easy to operate. However, it is difficult to directly use electrochemical biosensors to detect pathogenic bacteria in untreated samples [9].
Chronoamperometry is an electrochemical detection technique in which step voltage is applied to the working electrode, and a current–time curve is obtained by measuring the current of analyte(s). As compared with other detection methods, chronoamperometry is usually used to quantify known analytes, as it is associated with a better signal-to-noise ratio. The thickness of natural bacterial cell membranes is 5–10 nm [16]. Owing to the selective permeability of the membrane, bacterial resistance is 102–105 Ω cm2, and the capacitance is 0.5–1.3 μF/cm2. Therefore, the adhesion of bacterial cells to the electrode surface causes changes in the electrochemical reaction speed; chronoamperometry is known for sensitively collecting such signal modulations. Consequently, it is theoretically feasible to use the chronoamperometric method to detect bacterial cells in solution without complex functional modifications. However, as the output signal of the chronoamperometric method is difficult to judge intuitively, it is still necessary to carefully analyze the output electrical signal.
Based on the chronoamperometry method, Foroughi [17,18] calculated the diffusion coefficient of electroactive substances under diffusion control with the Cottrell equation. Jandaghi [19] and Foroughi [20] used the calculation equation of cyclic voltammetry peak current ip to obtain the active surface area of the electrode and took the oxidation peak as the index to determine the actual reaction surface area ratio of the electrode before and after modification. Thus, it is effective and feasible to use the Cottrell equation to analyze the output signal under the condition of diffusion control. At the same time, the detection research based on chronoamperometry still has some defects. Yingdi Zhu [21] realized the specific detection of E. coli by the immunoaffinity current method based on redox reaction; however, the detection time was as long as several hours, and the pretreatment of bacterial labeling was needed. Lior Sepunaru [22] used anodic particle coulometry technology and nano-modification to achieve non-specific quantitative detection of E. coli; however, this method still demonstrated a detection error that could not be ignored. Based on the principle of bacteria blocking redox reaction, Couto [23] realized the quantitative detection of E. coli by analyzing collision frequency; however, this method could not distinguish dead bacteria, and the detection limit was as high as 108 CFU/mL. Therefore, in addition to the detection and analysis methods, the soluble impurities in the solution are also one of the important factors affecting the detection performance.
In this study, based on the detection principle of chronoamperometry, we used an unmodified glassy carbon electrode (GCE) to detect live E. coli cells, and the mechanism underlying the effect of live bacterial cells on electrochemical response indices was investigated. Our study complements and perfects the theory of adsorption of bacteria on electrode surfaces under electric fields and realizes the quantitative detection of E. coli in solution instead of remaining at the level of a single cell. We believe that our findings will provide a new direction and theoretical basis for the future development of electrochemical biosensors.

2. Material and Methods

2.1. Chemicals and Reagents

Chemically pure K4Fe(CN)6·3H2O (99.0%) and K3Fe(CN)6 (99.5%) were purchased from MACKLIN (Shanghai MACKLIN Biochemical Technology, Shanghai, China). The electrode detection solution was composed of 0.2 M KNO3 and 1.0 mM K3Fe(CN)6. An aqueous solution of 20.0 mM K4Fe(CN)6 was used as the detection solution. All solutions were freshly prepared using ultrapure deionized water (R > 18.2 MΩ) and filtered to remove bacterial contamination.

2.2. Bacterial Cells, Growth Conditions, and Intracellular Lysate Preparation

E. coli K12-MG1655 (ATCC 47076) was inoculated in Luria–Bertani (LB, Sangon Biotech, Shanghai, China) broth and cultured for 10 h in a shaker (150.0 rpm) maintained at a constant temperature of 37.0 °C (THZ-82A, Tianjin Sateris Experimental Analysis Instrument Company, Tianjin, China). Bacterial suspensions were centrifuged at 4629.0× g for 5 min (5804R, Eppendorf, Hamburg, Germany) and washed thrice with phosphate buffered saline (PBS, pH 7.2–7.4) to remove any broth residuals. Finally, bacterial cells were resuspended in PBS, and concentrations were adjusted to 108, 107, 106, 105, 104, 103, and 102 CFU/mL, followed by storage at 4.0 °C until needed; the bacterial concentration was confirmed before electrochemical detection.
Ultrasonic fragmentation was performed to obtain intracellular lysate. Different concentrations of bacterial suspensions were ultrasonically treated with a cell disrupter (SCIENTZ-IID, Ningbo Xinzhi Biotechnology Company, Ningbo, China) at 600.0 W for 15 min in an ice bath, followed by filtration through a 0.22 μm filter membrane to remove membrane fragments. The filtrates were subsequently stored at 4.0 °C.
Inactivated bacterial cells with an intact cell structure were obtained via glutaraldehyde fixation. Different concentrations of bacterial cell precipitates were prepared by centrifugation for 5 min at 4629.0× g, followed by fixation in 2.5% glutaraldehyde (Phygene, Fujian, China) for 24 h at 4.0 °C. The inactivated cells were then centrifuged at 1157.0× g for 15 min and washed thrice with PBS to remove any residual fixative solution. Finally, the cells were resuspended in PBS and stored at 4.0 °C until needed.

2.3. Electrochemical System

Electrochemical measurements were performed using an electrochemical workstation (CHI660E, Beijing Huake Putian Technology Company, Beijing, China) in a three-electrode system. A GCE (diameter of 3.0 mm) served as the working electrode, a platinum wire electrode as the auxiliary electrode, and an Ag/AgCl electrode as the reference electrode; the electrolytic cell volume was 10.0 mL. All electrodes were purchased from CHI, Beijing Huake Putian Technology Company, China.
Before electrochemical measurements, the working electrode (GCE) was polished with alumina powder with different particle sizes (1.0, 0.3, and 0.05 μm) successively and then cleaned using 1.0 M HNO3, 1.0 M NaOH, acetone, ethanol, and ultrapure water in an ultrasonic bath (KQ-100E, Kunshan Ultrasonic Instrument Company, Jiangsu, China) at 100.0 W for 5 min. The electrode was then activated by cyclic voltammetry in 0.5 M H2SO4 [24]. As for the activation parameters, the scanning range was −1.0 to 1 V.0 and the scanning speed was 500.0 mV/s; cyclic voltammetry measurements were obtained for 100 cycles. Further, to test the performance of the GCE, cyclic voltammetry measurements were obtained for another 20 cycles at −0.2 to 0.6 V and 50.0 mV/s. When the ΔEp was <80.0 mV and peak current ratio was approximately 1:1, the GCE was used for detection purposes.

2.4. Electrochemical Measurements

Bacterial suspensions (1.0 mL) were added to the detection solution (5.0 mL), gently mixed, and then transferred to the electrolytic cell. When the open circuit potential was stable, chronoamperometry measurements were obtained, using three independent tests for each sample. The electrochemical parameters were as follows: the initial potential was 0.6 V (vs. Ag/AgCl), measurement time was 200 s, sampling interval was 0.1 s, and standing time was 2.0 s. The current signal was recorded for analyses. After every test, the solution remaining on the GCE surface was gently rinsed with ultrapure water. All experimental procedures were performed in a sterile environment.

2.5. Data Analysis

Output data from the electrochemical workstation control software was obtained in Excel format and analyzed using the data module of Origin (Origin 2020, OriginLab, Northampton, MA, USA).
The original data of the i-t curve was fitted with Formula (1) [25]:
i = i 0 + E R s e t R s C d
where E = step voltage, t = time, Rs = equivalent resistance of the external circuit, Cd = equivalent capacitance of the electric double layer, and i0 = stable current. i0 can be calculated using the fitting curve. When the charging process reached equilibrium, i0 could be expressed as follows:
i 0 = E R s
where E = step voltage, and Rs = equivalent resistance of the external circuit. Bacterial cell adhesion to the electrode surface may affect Rs, so i0 was selected as an indicator of electrochemical response.
Integration has a smoothing effect on random noise in transient currents. The electric quantity Q is the integral of the current I [25]. The i-t curve was integrated to obtain the i-q curve, which was fitted using the following equation:
Q = 2 n F S D 0 1 2 C 0 * t 1 2 π 1 2 + Q d l + n F S Γ 0
where n = number of electrons involved in the reaction, F = Faraday constant, S = actual electrode area, DO = diffusion coefficient of substance O, CO* = bulk concentration of substance O, t = time, Qdl = electricity required to charge the electrode double layer, and nFSГO = Faraday component of surface adsorption O reduction.
Formula (3) is the chronographic electric quantity curve when the electrolyte remains stationary in homogeneous phase, where 2nFSD01/2C0*t1/21/2 represents the amount of electricity required for the electrochemical indicator to diffuse to the electrode surface for oxidation or reduction within a certain detection time. Qdl represents the electric quantity required for GCE double-layer charging, and nFSГ0 represents the electricity required for the oxidation of K4Fe(CN)6 adsorbed on the surface.
A was calculated as follows:
A = 2 n F S D 0 1 2 C 0 * π 1 2
The actual electrode area S was a variable, the rest were constants [25]. Bacterial cell adhesion to the electrode surface may affect S, so A was selected as another indicator of electrochemical response.
The two electrochemical response indices i0 and A were assessed under different bacterial concentrations, and equations to determine the relationship between them were established.

2.6. Analysis of Spiked Samples

Different concentrations of E. coli suspensions in phosphate buffer solution (PBS) were obtained, followed by plate counting and electrochemical measurements. The plate counting data were compared with the electrochemically measured E. coli concentration results to analyze differences between them. The plate counting results served as the standard, and the error range of the electrochemical detection method was calculated.

2.7. Changes in E. coli Concentration in the Detection Solution

The plate counting method [26,27] was used to detect E. coli concentration in the detection solution before and after electrochemical testing. The changes in bacterial concentrations were calculated using the following formulae:
Δ E = ( C 2 C 0 + C 1 2 ) × V
Δ C = C 2 ( C 0 + C 1 ) 2 ( C 0 + C 1 ) 2 × 100 %
where C0 = E. coli concentration in the control electrolyte, C1 = E. coli concentration in the electrolyte before testing, C2 = E. coli concentration in the electrolyte after testing, V = electrolyte volume, ΔE = changes in E. coli quantities in the electrolyte before and after testing, and ΔC = percentage change in E. coli concentration in the electrolyte.

2.8. Fluorescence Microscopy

After electrochemical testing, the working electrode (GCE) was immediately removed from the detection solution, and its surface was gently washed using sterilized PBS to remove any residual detection solution and non-adsorbed bacterial cells. A DAPI kit (DAPI, Sangon Biotech, Shanghai, China) was used for staining E. coli cells on the electrode surface, according to manufacturer’s instructions, followed by observation under a fluorescence microscope (Olympus BX51, Olympus Corporation, Tokyo, japan). The excitation wavelength was 340.0 nm, and the emission wavelength was 488.0 nm. The GCE that detected electrolytes without bacteria served as the blank control.

2.9. Scanning Electron Microscopy

The pretreatment method was similar to the aforementioned method. After electrochemical testing, the working electrode (GCE) was immediately removed from the detection solution, and its surface was gently washed with sterilized PBS. Glutaraldehyde was used to fix bacteria cells adsorbed on the electrode surface; the fixation solution was added dropwise on the electrode surface, followed by incubation at 4.0 °C for 24 h. Subsequently, any residual solution was rinsed away with sterilized PBS. The electrode was then dried and observed under a scanning electron microscope (KYKY-EM6200, Zhongke Science Instrument, Beijing, China).

2.10. Fulvic Acid Sample

Fulvic acid (FA) was selected to simulate dissolved organic matter in the river. The detection sample solution was replaced with PBS solution containing 10 mg/L FA; the other experimental conditions remained unchanged.

2.11. Statistical Analysis

All experiments were conducted independently in biological triplicate. Curve fitting used the Levenberg-Marquardt algorithm.

3. Results and Discussion

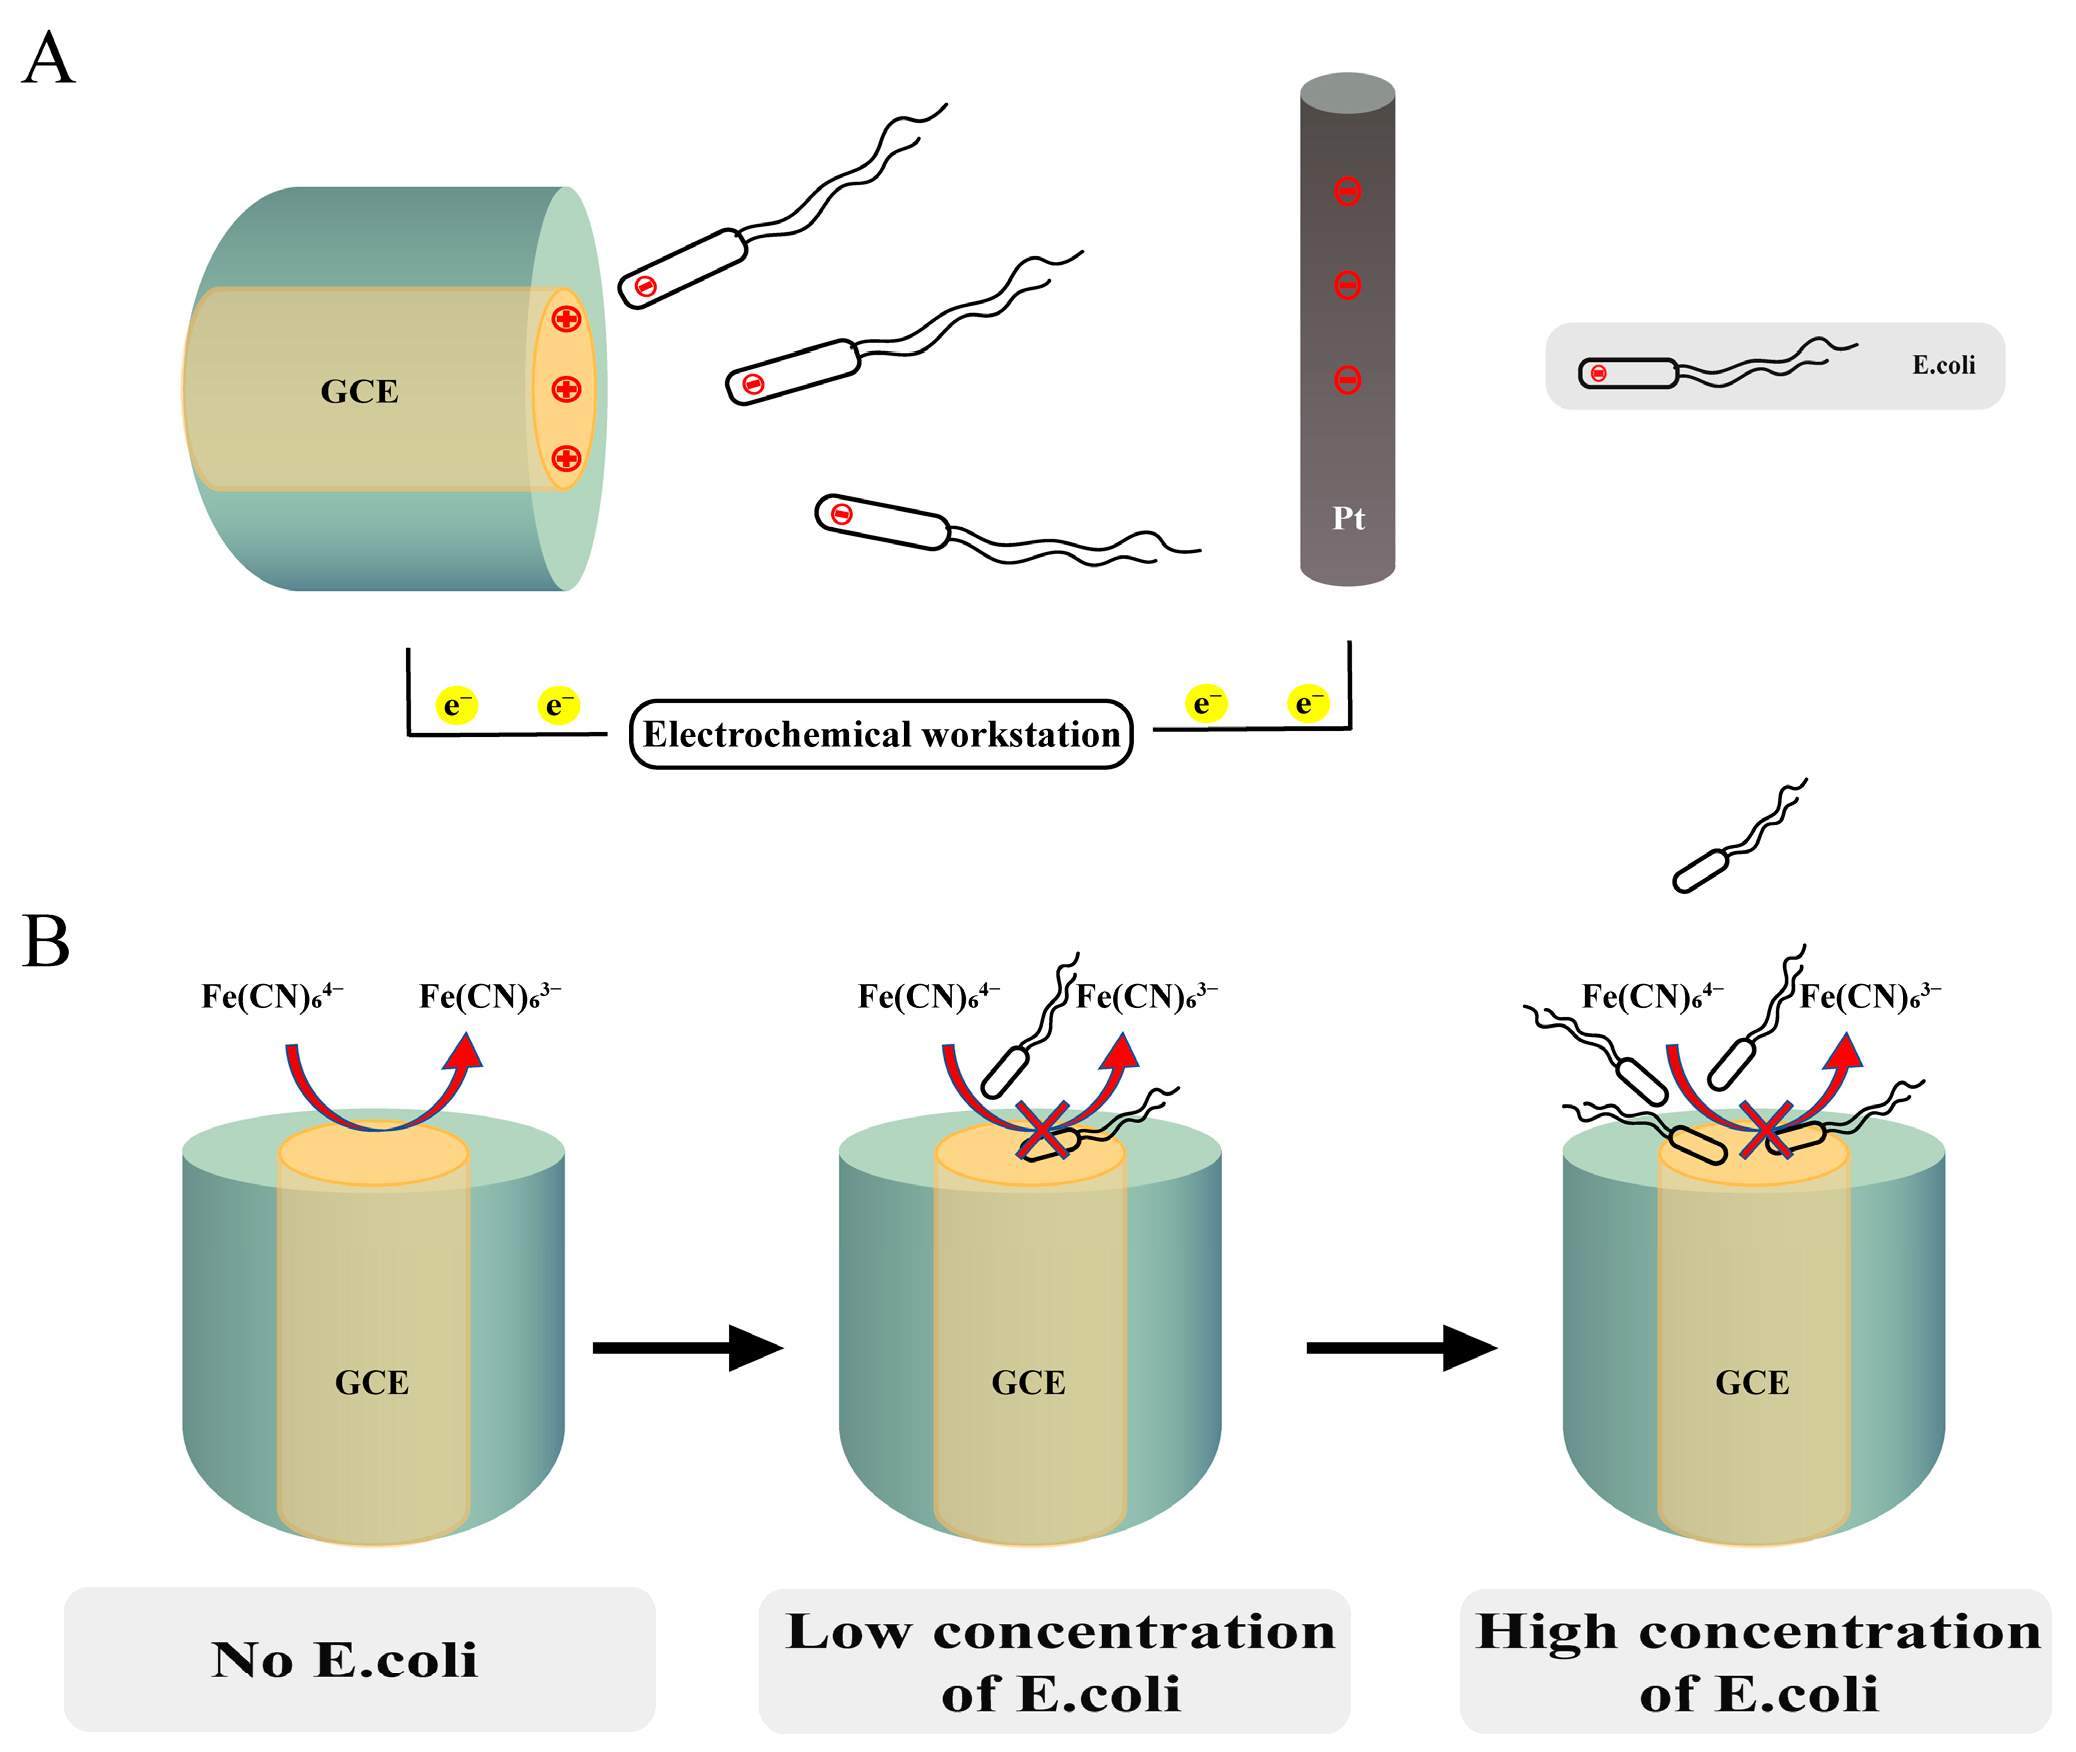
3.1. Establishment of the Detection Method

Herein we report a quantitative method involving the use of a GCE to detect live E. coli cells (Figure 1). As the selected E. coli strain carries a negative charge on its cell membrane surface when pH is greater than 4.4, and the electrolyte pH was 7.15, owing to electrotaxis [28], it should move toward the anode by electrophoresis in a direct current electric field [29]. Because the galvanotaxis threshold of E. coli depends on solution conductivity [28], the migration rate of E. coli in the electric field is bound to remain stable under constant electrolyte concentration and constant voltage. In this study, a GCE was used as the anode, and electrolytes remained the same. E. coli was observed to migrate from the electrolyte to diffusion layer on the GCE surface (Figure 1A), and it was finally adsorbed on the electrode surface as a result of electrostatic interaction between the charge carried by E. coli cells and the micropores on the GCE surface [30] as well as covalent bonding between the functional groups on the surface of E. coli cells and the rich functional groups on the GCE surface [31]. The pH of the test solution was 7.15, and there is no evidence that a neutral pH would have a significant effect on the functional groups and the charge on the electrode surface. We believe that under this detection condition, the electrostatic force between the negative charge of E. coli and the positive charge of GCE with the anodic polarization potential would be the key factor to cause bacterial adsorption. E. coli adsorption on the GCE surface sealed the electrode and inhibited the reaction, i.e., the oxidation of Fe(CN)64− (Figure 1B). In this manner, changes in the effective area of the electrode can be recorded by detecting changes in electrochemical parameters, obtaining an estimate of the number of adsorbed E. coli cells.
First, we established a method for the electrochemical activation of the GCE (Figure S1). As mentioned above, we obtained cyclic voltammetry measurements over 100 cycles (refer to Section 2.3). The electrochemically activated GCE not only eliminated bacteria and impurities on its surface but also promoted the formation of a weak porous film, owing to the rupture of some crosslinks between polyaromatic rings on the glassy carbon surface [32]. The electrode surface became rough, and the microscopic surface became larger, but the effective surface did not show a significant change.
Second, K4Fe(CN)6 was included in the detection solution as a source of electroactive ions, which had the advantages of good reversibility and high stability; it also showed fast electron transfer ability to generate sensitive electrochemical signals on the electrode [33]. To maintain the osmotic pressure and activity of E. coli, 20.0 mM K4Fe(CN)6 was used as the electrolyte [34].
Third, the step voltage was set to 0.6 V (vs. Ag/AgCl). The reaction rate of Fe(CN)64− ions on the electrode surface at 0.6 V (vs. Ag/AgCl) was adequately fast; the entire electrochemical process was controlled by diffusion (Figure S2). In a previous study, a single E. coli cell could be detected on the surface of an ultramicroelectrode by using the step voltage of 0.6 V while avoiding damage to bacterial cells [34]. However, that study only explained the phenomenon and could not quantitatively detect a large number of E. coli in the test sample; our method made up for this deficiency. Voltage as low as 0.6 V is unlikely to have a substantial impact on bacterial activity, particularly as the response current was well below the minimum value lethal to bacteria (25 mA) [35].
Finally, detection time was another important parameter. If the detection time is too short, the current may not reach a stable state; however, if it is too long, E. coli cells adsorbed on the electrode surface may form clusters. Moreover, it is difficult to prolong the measurement time beyond 300 s [25]. Thus, the measurement time used herein was set at 200 s (Figure S3).
During the whole testing process, accumulation of cells was the key factor affecting the accuracy of this technique; this took place from the beginning to the end of the detection. With the application of step voltage, bacteria continuously migrated and adhered to the electrode surface within the direct current electric field. With the increase of detection time, the number of bacteria continually accumulated on the electrode surface, which resulted in a change in the level of the current. The quantitative detection of bacteria was based on analyzing of the change in current. After we carried out a series of experiments, the optimal detection time (Figure S3) was determined, and the detection time was unified under all concentrations to prevent the difference of cumulative time affecting the results.

3.2. Quantitative Detection of E. coli by Monitoring i0 and A

As no shielding device was used in the electrochemical measurement, the detected current signal was considerably affected by environmental noise, which made the calculation of electrochemical parameters difficult. The method of curve fitting was used to deal with electrochemical signals. Similar to the study by He and Zhang [36,37], we used Formulas (7) and (8) to fit the electric current–time curve and its integral electric quantity–time curve, respectively. Here two indexes were constructed to represent two different verification ideas. The parameter A, which represented the electric quantity index, was used to verify the influence of bacteria on the effective reaction area of the electrode from the perspective of the actual reaction rate of the electrode. The current index i0, which represented the constant current, was used to verify the influence of bacteria on the equivalent resistance in the electrochemical system from the perspective of the equivalent circuit.
y = y 0 + A e x t
y = A x 1 2 + B
Consequently, as evident from Figure S4, interference by environmental noise was markedly reduced, and the fitting of the curves did not affect the original electrochemical results. Using this method, it became feasible to analyze changes in i0 and A within 200 s. As the current response in this study was the oxidation current, I < 0 and Q < 0. In fact, the current and electricity were not usually expressed as negative numbers, so the two indicators were taken as absolute values in the follow-up discussion. In addition, i0 showed an obvious decrease with an increase in bacterial concentration.
According to Formulas (7) and (8), y0 and A in the fitting result corresponded to i0 and A, respectively.
To verify the accuracy of our method, we performed the same experiment using multiple electrode systems (Figure S5). Figure 2A,B show the correlation among A, i0, and the bacterial concentration under the same electrode system. There was an obvious negative correlation among them. With an increase in bacterial concentration, the number of bacteria adsorbed on the electrode surface increased, resulting in a decrease in the actual electrode area S and an increase in equivalent resistance of the external circuit Rs. According to Formulas (2) and (4), A and i0 would show a decrease. The electrochemical response index was linearly related to the bacterial concentration (lg value). Under the same electrode system, the relationship between the electrochemical response index and E. coli concentration was as follows:
| A | = 9.330 × 10 7 × l g C + 5.942 × 10 5
| i 0 | = 5.907 × 10 7 × l g C + 2.908 × 10 5
the R2 of Formulas (9) and (10) are 0.885 and 0.851, respectively.
Figure S5A,B show the correlation between A, i0, and the bacterial concentration under different electrode systems. As evident, the different systems had a considerable influence on the electrochemical response. Due to the large difference in the actual reaction area (microscopic area) between the different electrodes, the effect of bacterial adsorption on the actual reaction area of the electrode was different, but the calculated error range remained below 30.0%.
This could be attributed to two reasons. First, the electrochemical response index had a better relationship with the adsorption position of E. coli on the electrode surface, which could be due to the “edge effect”, whereby the electric field strength at the edge of the electrode was higher than that at the center [38]. Thus, the adsorption of bacteria on the entire electrode surface was not uniform. Second, E. coli cells adsorbed on the electrode surface might agglomerate or overlap [30], leading to individual cells affecting the electrochemical response index to different degrees.
To the best of our knowledge, the electrochemical response indices A and i0 have not as yet been used for the quantitative detection of bacteria. Lebègue et al. [39] recently reported a quantitative method to detect bacterial concentration, which involved monitoring the collision frequency and adsorption of bacteria on the surface of an ultra-microelectrode. The detection accuracy of their method was, however, low, being two orders of magnitude different from the actual bacterial concentration. Moreover, the method was unable to differentiate between dead and live bacterial cells. Herein, the effect of dead bacteria and the error range of our method were assessed, and the results are shown in Figure 3 and Table S1, respectively.
When different concentrations of bacteria were ultrasonically disrupted, and intracellular lysates were used as the test sample, A and i0 showed no obvious correlation with bacterial concentration, and A and i0 values were much larger than those for live bacteria (Figure 3A,B). This could be because the lysate may not be effectively adsorbed on the electrode surface, validating that our method was able to differentiate between live bacteria and intracellular lysates of dead bacteria. Similarly, when bacterial cells were fixed with glutaraldehyde, A and i0 showed no obvious correlation with bacterial concentration and were much higher than those for live bacteria (Figure 3C,D). To explain, after fixation, the two aldehyde groups of glutaraldehyde are bound to have cross-linked with the amino or imine groups on adjacent peptide chains, forming a dense network structure on the cell surface and considerably reducing the negative charge, consequently decreasing the migration rate in the electric field [40]. The experimental results showed that neither the cracked cell fragments nor the dead bacterial cells with complete cell structures could affect the equivalent resistance of the electrochemical system and the effective reaction area of the electrode. The reason behind this phenomenon was that the dead bacterial cells or cellular components could not migrate in the electrolyte and adhere stably on the electrode surface. To summarize, our method could distinguish dead bacteria (irrespective of them being intact or disrupted) from live bacteria. Only live bacteria can show a specific effect on the electrochemical response; intracellular lysates and cell structure did not affect the detection results.
The test results of the spiked samples (Table S1) showed that although the difference in the actual area (microscopic area) of the electrodes results in greater dispersion of the test results of the different electrode systems, the relative standard deviations (RSDs) were all lower than 10%, which indicated that this method, though it used a different electrode system, still had certain stability and reproducibility. Due to the different micro surface areas of different electrodes, bacteria were not completely adsorbed on the electrode surface; the recovery rate was less than 100%. E. coli with a concentration of 108 CFU/mL was selected, and the same electrode was used for intermittent detection and repeated verification, 10 times; the final RSD was 6.98%, which further indicated that the established sensor had certain stability and repeatability. There were few practical application scenarios where the bacterial concentration was higher than 109 CFU/mL; these were not considered.
In summary, our method was able to rapidly detect E. coli within 5 min. As we used unmodified GCE in this study, the sensitivity of the method to lower bacterial concentrations was not sufficiently high. We compared the detection limit of our method with that of other chronoamperometric methods involving a functionally modified electrode [41,42,43,44,45]. Although the lowest detection limit was not outstanding, the detection method we reported had obvious advantages in terms of detection speed and difficulty of sensor preparation. The performance comparison of some E. coli electrochemical biosensors is listed in Table S2. In addition, for severely polluted water environments and rapid quantification of E. coli solutions in the laboratory, this detection range was appropriate, and the detection of solutions with lower bacterial concentrations could be achieved by pre-concentration treatment.

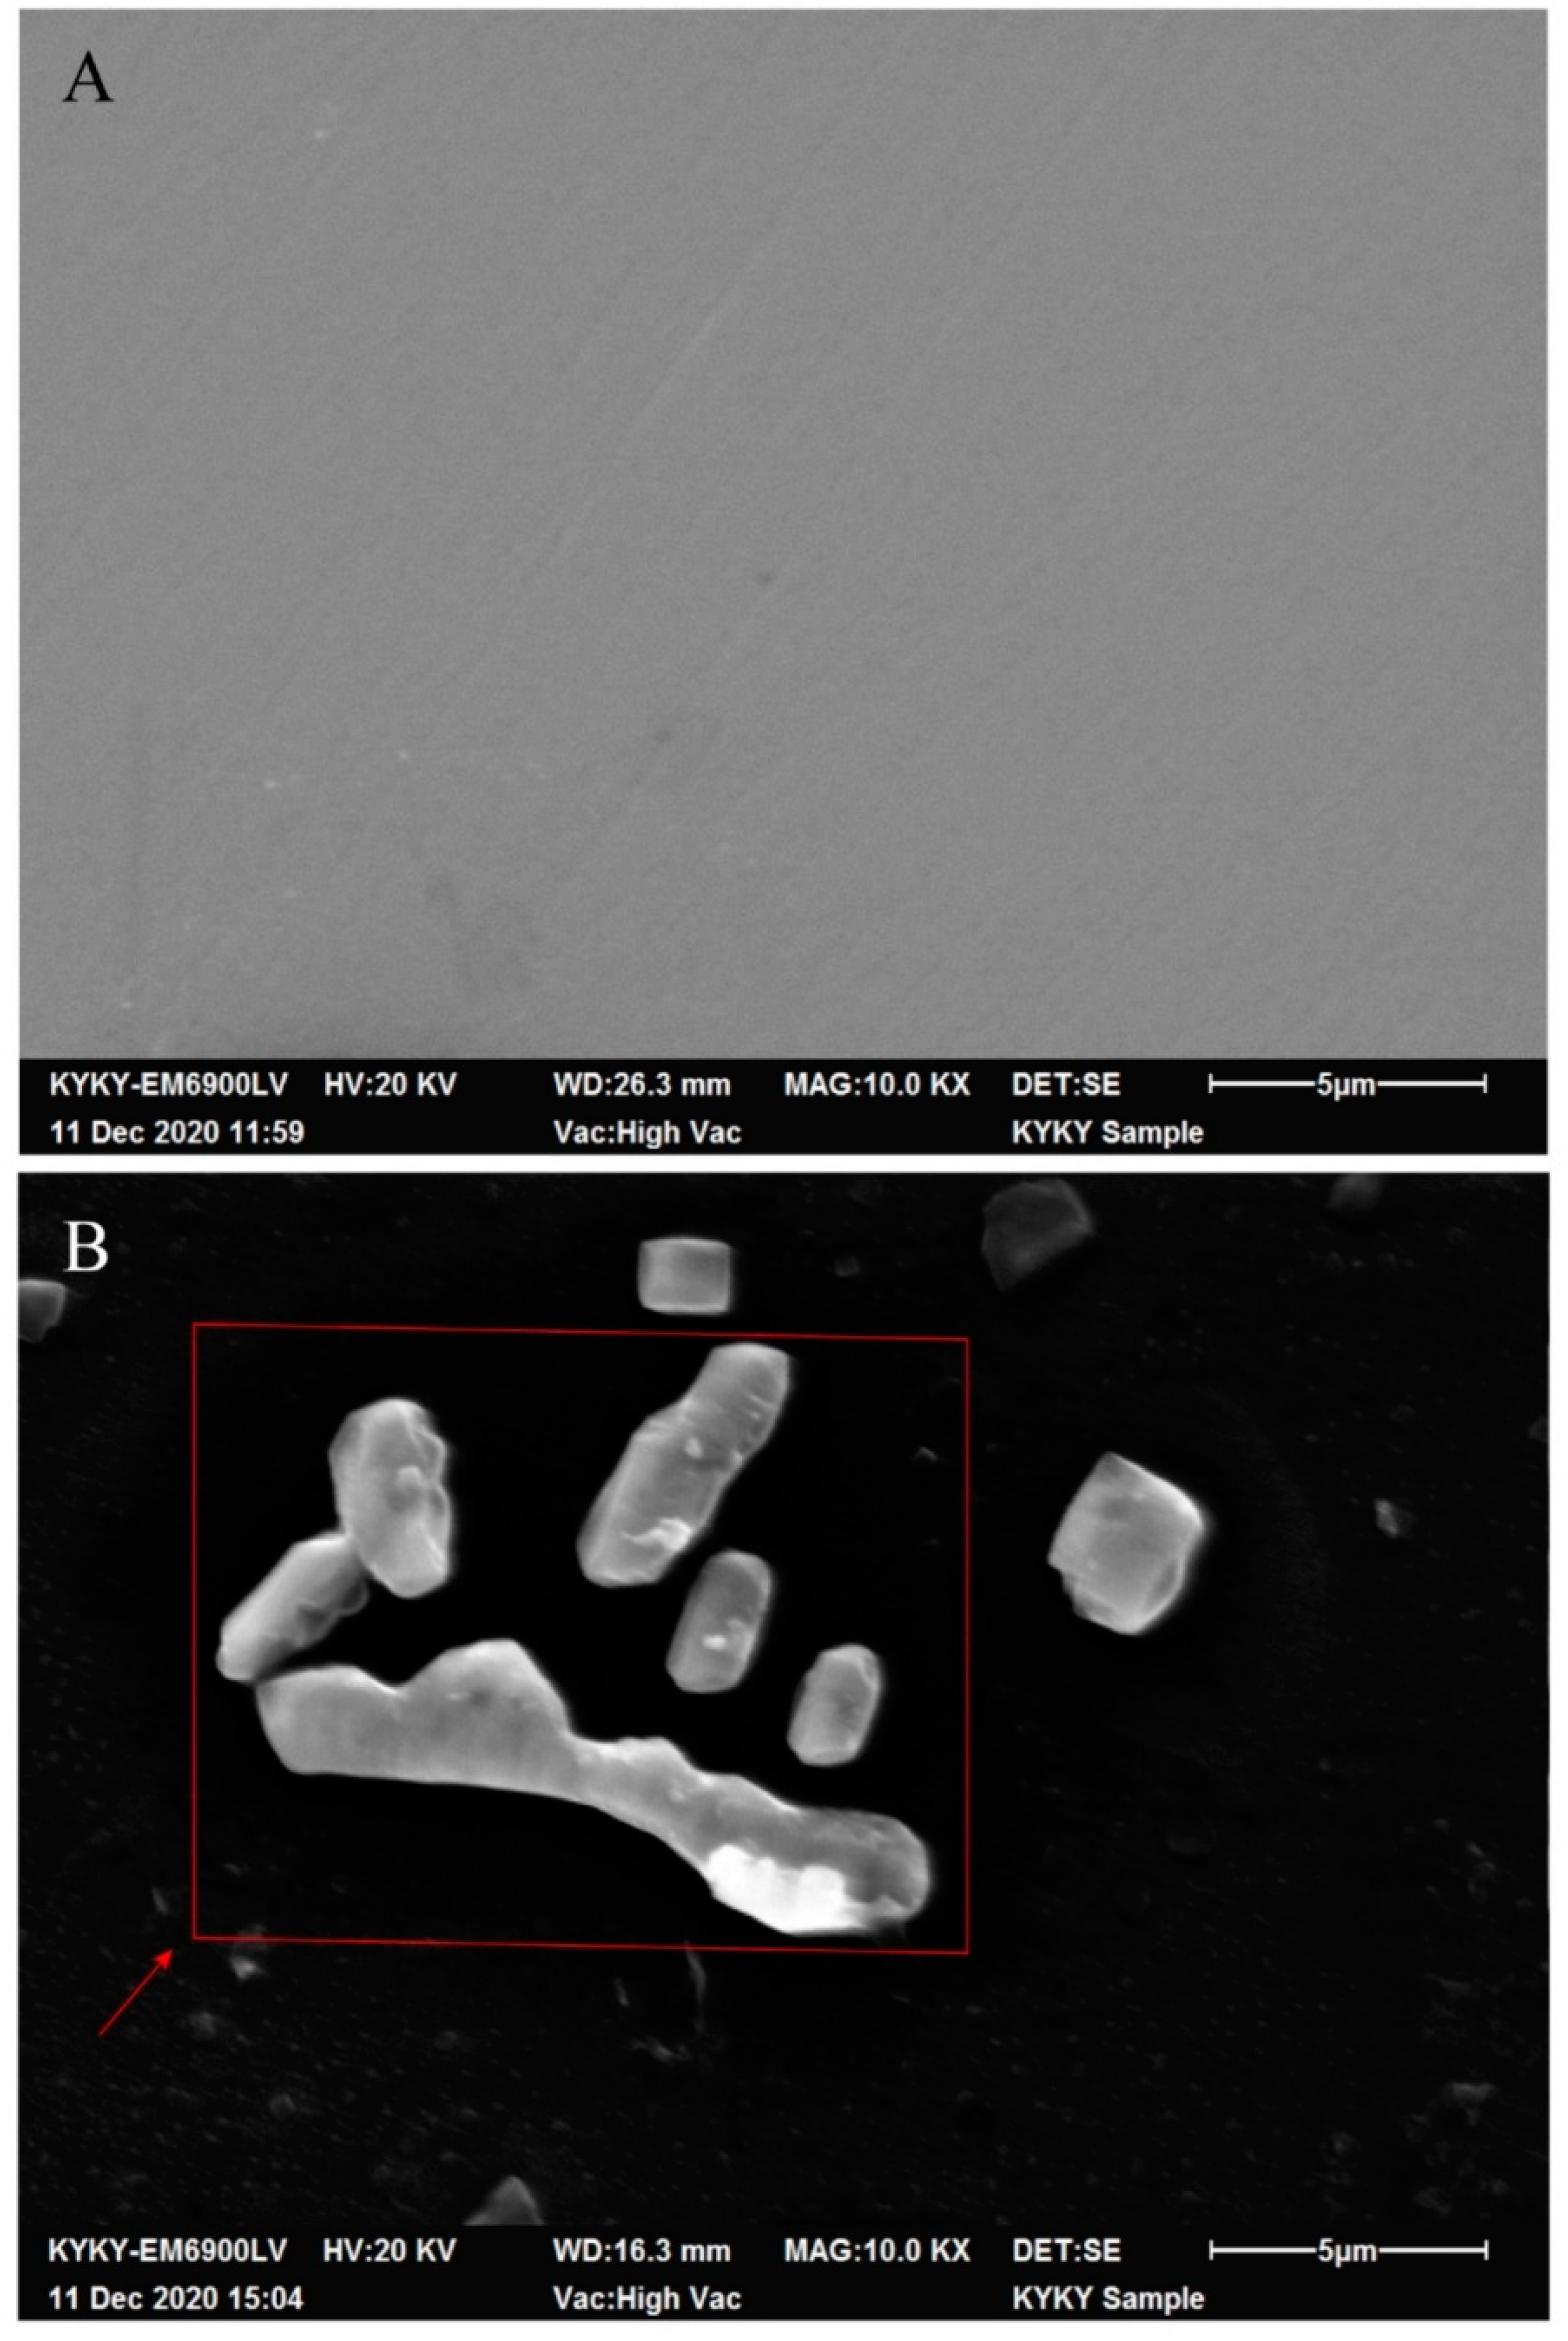
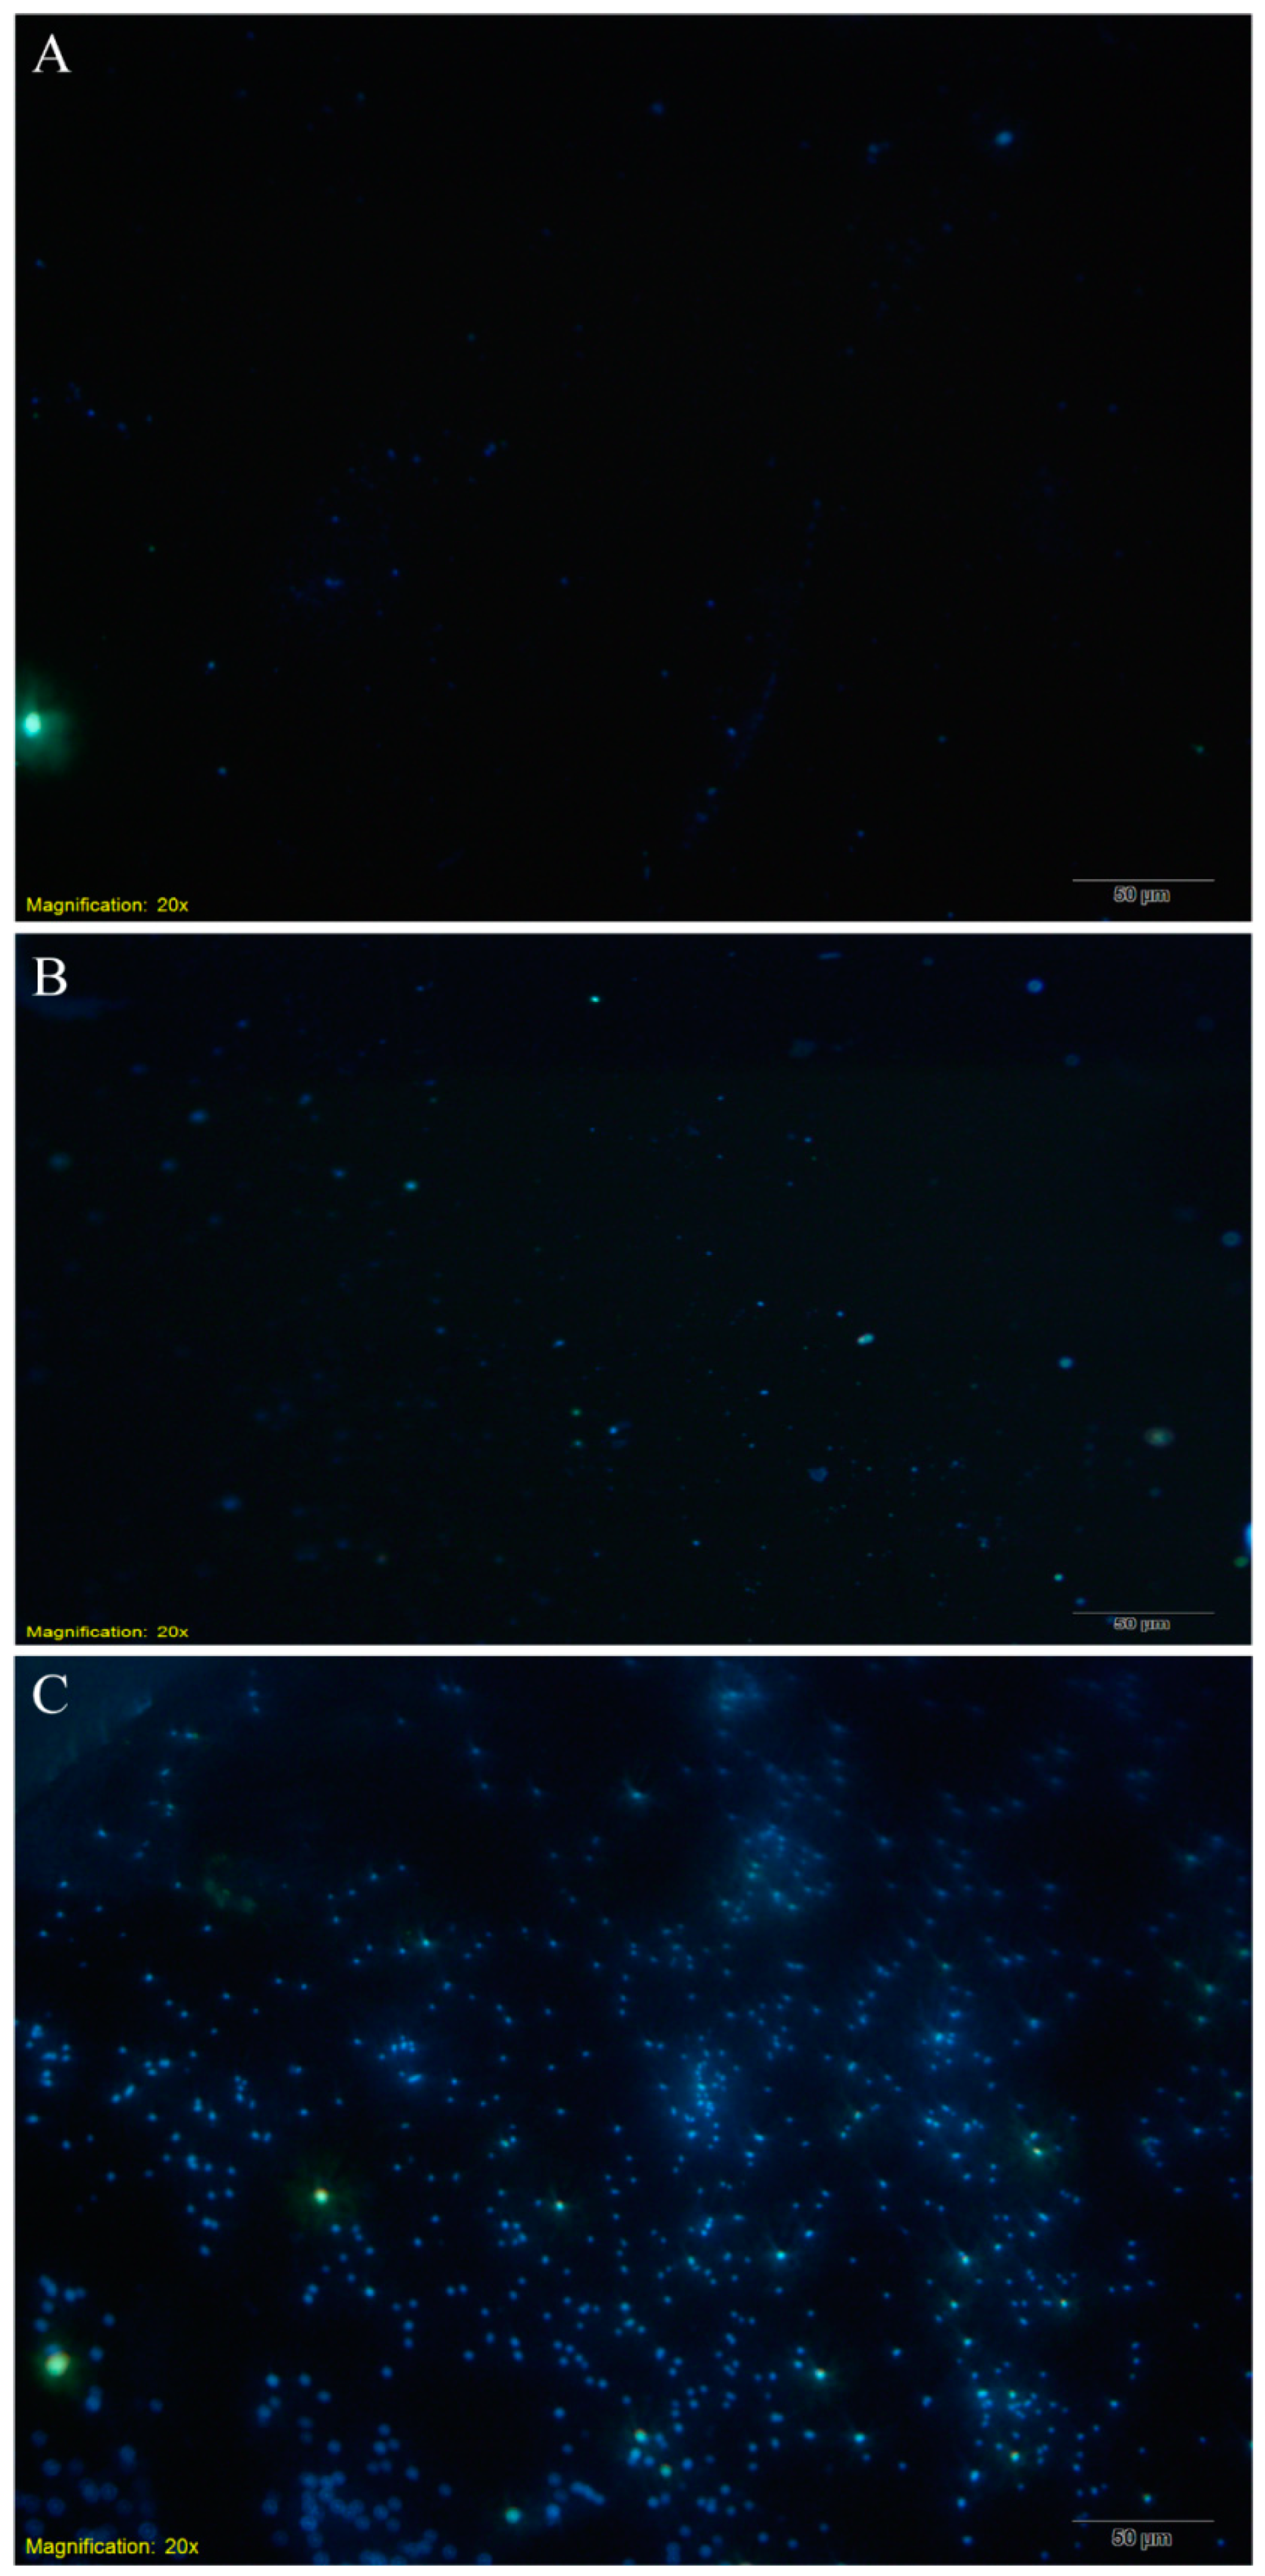
3.3. Relationship between Bacterial Adsorption on the Electrode Surface and Bacterial Concentration

Ronspees and Thorgaard [30] reported that E. coli was adsorbed on the electrode surface with positive charge under the electric field, continuously hindering the oxidation of ions in the electrolyte on the electrode surface and consequently reducing the response current. Guanyue et al. [46] also showed that bacteria had a “blocking effect” on the response current and that this was related to the adsorption rate of bacteria on the electrode surface, adsorption position on the electrode surface, and longitudinal distance between the electrode and bacteria. However, the response current decreased to a certain extent when individual cells were adsorbed on the electrode surface. In addition, it is noteworthy that the blocking effect of each bacterial cell on the response current was not the same, resulting in differences in the reduction of the response current. In this study, we evaluated the relationship between the number of bacteria adsorbed on the electrode surface and changes in the total response current, establishing the relationship based on the principle of E. coli adsorption on the GCE surface.
We first performed scanning electron microscopy (Figure 4) to assess the adsorption state of E. coli on the GCE surface. Then, the number of bacteria adsorbed on the electrode surface was detected via fluorescence microscopy (Figure 5). Finally, differences in the bacterial concentration in the electrolyte before and after electrochemical detection were calculated to quantify the number of E. coli adsorbed on the electrode surface (Figure 6).
The GCE surface (Figure 4A) was smooth and neat, showing no bacterial cells or impurities. Short rod-like particles with a length of 2–3 μm were evident on the electrode surface after electrochemical detection (Figure 4B). Because the detection system was unmodified and all procedures were performed under sterile conditions, we strongly believe that these particles were in fact E. coli cells (even cell debris) that had been adsorbed on the GCE surface after electrochemical detection.
As shown in Figure 5, the higher the bacterial concentration, the higher was the number of E. coli cells adsorbed on the electrode surface. However, this bacterial adsorption was not uniform, which might be due to the roughness of the GCE surface at a microscopic level. This uneven adsorption could also be caused by the aforementioned “edge effect” [38].
In the present study, we also examined the electrochemical response of the Gram-positive strain S. aureus (Figures S6 and S7), which was found to be significantly different from that of E. coli. This could be attributed to the unique cell wall structure [47] and smaller cell size [48] of S. aureus. Ronspees and Thorgaard [30] reported that Bacillus subtilis, another Gram-positive bacteria, bounced off after collision on the surface of an ultra-microelectrode instead of showing continuous adsorption; this could be due to the electroosmotic flow in the electrolytic cell [49]. This partially explains why the collision state and adsorption efficiency of S. aureus on the electrode surface were quite different from those of E. coli. Therefore, the collision frequency, adsorption state, and adsorption efficiency of different kinds of bacteria on the GCE surface were also different, which leads to their different effects on electrochemical reactions; thus, it was theoretically feasible to use this method to specificity detect the bacteria.
Figure 6A, B show changes in the number and concentration of E. coli in the electrolyte before and after electrochemical detection. As evident, the higher the bacterial concentration, the higher the number of bacteria adsorbed on the electrode surface. Figure 6 further determined the quantitative relationship between the number of bacteria adsorbed on the electrode surface (i.e., the electrode area covered by bacteria) and the bacterial concentration based on Figure 4 and Figure 5. Further, different bacterial concentrations showed the same adsorption efficiency. The amount of negative charge on the surface of E. coli was basically the same, and the zeta potential was approximately −53.0 mV [30]. Therefore, the electrophoretic effect was the same under the same electric field.
In addition, by linear fitting the data in Figure 6A, we could calculate the following:
l g | Δ E | = 0.976 l g C 1.589
the R2 of Formula (11) is 0.997.
Further, according to Formulas (4), (9) and (11), we could calculate the following:
S = π 1 2 2 n F D 0 1 2 C 0 * × ( 9.559 × 10 7 l g | Δ E | + 5.790 × 10 5 )
Using Formula (12), we could determine that the number of E. coli cells adsorbed on the electrode surface ΔE was inversely proportional to the actual area S of the electrode, which conforms to the theoretical explanation and expected results.
In general, the greatest significance of Formula (12) was that through the change of parameters in the formula, the influence of bacterial concentration on the electrical signal and the reason for the influence of the process machine could be analyzed very intuitively. In addition, Formula (12) also indirectly verified the accuracy of Formulas (2) and (4). For example, Formula (2) described the relationship between the equivalent resistance of the electrochemical system and the bacterial concentration in the process. With the increase of the bacterial concentration in the detection solution, the equivalent circuit Rs in the detection system increased. On the premise that the transition voltage E remained unchanged, the current index i0 decreased with the increase of Rs. Another example was Formula (4), which described the relationship between the effective area of the electrode and the bacterial concentration. The increase of the bacterial concentration would increase the number of bacteria attached to the electrode surface, resulting in the decrease of the effective reaction area S of the electrode. Under the condition that other detection conditions remained unchanged, the constants or parameters such as n, F, Do, Co*, and π remained unchanged, and the electrical index A decreased with the decrease of S. These formulae explained the experimental phenomena from the principle level, and intuitively reflected the influence mechanism of bacteria on electrical signals.

3.4. Influence of Humus on Test Results

Humus is widely distributed in nature and is formed by the decay of terrestrial animal and plant materials through the biological activities of microorganisms such as bacteria and algae in the soil environment [50]. These include the degradation products of carbohydrates, lignin, and proteins [51], which are generally divided into three categories: humin, HA, and FA. Dissolved humic acid (humic acid and fulvic acid) was rich in the water environment, accounting for 40–60% of DOM in the aquatic system [52]; fulvic acid (FA) was the main component of natural organic matter (NOM) [53]. In this experiment, FA dissolved in water was selected as the sample of common pollutants in water.
Hwang [54], Nagao [52] and Mir-zavand [55] selected humic acid with a concentration of 10 mg/L to simulate the river environment. In this experiment, 10 mg/L water-soluble FA was used as a distractor to observe the impact of pollutants in water on the detection results. The results showed that under the conditions of this experiment, FA had almost no effect on the detection results (Figure S8), which might be due to the fact that although humic acid had a negative charge when pH was greater than 5.5 [53], it could not generate a redox reaction on the electrode surface or affect the actual reaction area of the electrode by adsorption. Therefore, it could be inferred that the soluble humic acid in the water environment and small molecules that cannot undergo redox reaction cannot affect the detection results of E. coli.

4. Conclusions

In this study, we report a quantitative label-free method involving an unmodified GCE to detect live E. coli. Considering the characteristics of E. coli in a direct current electric field, bacterial cells were observed to migrate toward the GCE and were adsorbed on the electrode surface, which consequently hindered electron transfer and indirectly affected the electrochemical response. By monitoring this response over a period of time, the bacterial concentration could be determined. In addition to being simpler, faster, and more straightforward, our method was less affected by environmental noise and thus suitable for detecting 104–108 CFU/mL concentrations of bacteria. Compared with other similar studies, the electrode used in this study had not undergone any complex modification; it could be reused many times. In addition, the detection time was reduced to less than 5 min. This study analyzed the influence mechanism of bacteria on electrical signals. Compared with other studies focusing on the modification, preparation, and performance analysis of electrochemical biosensors, this study was more inclined to discuss and analyze the influence mechanism of bacteria on the electrochemical system.
As mentioned in the text, our method solved the shortcomings of the reported detection methods, did not need complex modification pretreatment, reduced the detection time to less than a few minutes, reduced the detection error, and could eliminate the interference of dead bacteria and humic acid. This study is expected to become an effective alternative to the plate counting method in the laboratory; thus, it is possible to realize the rapid estimation of the total number of bacteria in water after solving the challenge of adsorption efficiency of multi-strain complex systems in the future. We believe that our findings provide new ideas and a foundation for the development of robust detection technologies in the future.

Supplementary Materials

The following supporting information can be downloaded at https://www.mdpi.com/article/10.3390/bios12100845/s1: Figure S1, GCE activation process. A, activation cyclic voltammogram; B, detection cyclic voltammogram. After activation, ΔEp was <80 mV, and the peak current ratio was around 1:1, confirming that the GCE surface was free of impurities and that the reaction was sensitive. Figure S2, Step voltage selection. A, the response current under different step voltages; B, the stable current i0 under different step voltages. When the step voltage was >0.5 V, the stable current i0 did not change with the voltage, and the electrochemical process was controlled by diffusion. To ensure the stability of the electrochemical process, the step voltage used was 0.6 V. Figure S3, Detection time selection. A, the response current under different detection times; B, the stable current i0 under different detection times. When the detection time reached 200 s, the current was basically stable. Excessively high detection time might lead to the accumulation of surface-adsorbed E. coli, affecting the detection result. Therefore, the detection time used was 200 s. Figure S4, Schematic diagram of curve fitting. A and B, original i-t curve; C and D, fitted i-t curve; E and F, original Q-T curve; G and H, fitted Q-T curve. Figure S5, Electrochemical response of the different electrode system to bacterial solution. A, electric quantity index; B, electric current index. Figure S6, Electrochemical response of S. aureus. A, electric quantity index; B, electric current index. Under the same detection method, the electrochemical response of S. aureus was completely different from that of E. coli, and there was no similar correlation observed in the diagram, so the method of quantify E. coli was unsuitable for the analysis of S. aureus. This might be because the degree of adsorption of S. aureus on the GCE surface had a limited effect on the electrochemical process, but in fact the electrochemical process was still controlled by diffusion. Figure S7, Fluorescence microscopy of the electrode surface after the electrochemical detection of S. aureus. A, electrode surface with 105 CFU/mL bacteria and B, 108 CFU/mL bacteria. When the concentration of S. aureus was the same as that of Escherichia coli, the amount of S. aureus adsorbed on the GCE surface was much lesser than that of E. coli. Even if high concentrations of S. aureus were electrochemically detected, the amount adsorbed on the GCE surface was still very low. This might be related to some of the characteristics of S. aureus mentioned in the main text. Figure S8, Effect of humic acid on the electrochemical response of Escherichia coli. The red mark indicated the control group without humic acid, and the black mark indicated the experimental group containing 10 mg/L fulvic acid. A, electric quantity index; B, electric current index. Table S1, Recoveries of E. coli in PBS. Table S2, Performance comparison of Escherichia coli electrochemical biosensors [56,57,58,59].

Author Contributions

Conceptualization, Z.Q. Methodology, F.S. Validation, J.W. Resources, C.L. Investigation, Z.C., C.G., H.Z. and Y.Y. Data Curation, S.W. and B.X. Formal Analysis, Z.C. and X.Y. Visualization, X.Z. and C.Z. Writing—Original Draft, Z.C. Writing—Review and Editing, C.L. and Z.Q. Supervision, Z.S. Project Administration, Z.Q. Funding Acquisition, Z.Q. All authors have read and agreed to the published version of the manuscript.

Funding

This study was supported by the National Key R&D Program of China (2018YFD0800104), Special Fund of China (AWS18J004, 2019-JCJQ-JJ-163), Xi’an Municipal Science and Technology Project (2022JH-RYFW-0023) and Xi’an Polytechnic University Graduate Innovation Fund Project (CHX2020026).

Institutional Review Board Statement

Not applicable.

Informed Consent Statement

Not applicable.

Conflicts of Interest

The authors declare no conflict of interest.

References

  1. World Health Organization; United Nations Children’s Fund (UNICEF). Progress on Drinking Water and Sanitation—2014 Update; World Health Organization: Geneva, Switzerland, 2012; Volume 2, p. 902. [Google Scholar] [CrossRef]
  2. World Health Organization. Hazard Characterization for Pathogens in Food and Water: Guidelines; Food & Agriculture Org; World Health Organization: Geneva, Switzerland, 2003. [Google Scholar]
  3. Kim, S.U.; Jo, E.-J.; Mun, H.; Noh, Y.; Kim, M.-G. Ultrasensitive Detection of Escherichia coli O157:H7 by Immunomagnetic Separation and Selective Filtration with Nitroblue Tetrazolium/5-Bromo-4-chloro-3-indolyl Phosphate Signal Amplification. J. Agric. Food Chem. 2018, 66, 4941–4947. [Google Scholar] [CrossRef] [PubMed]
  4. Razmi, N.; Hasanzadeh, M.; Willander, M.; Nur, O. Recent Progress on the Electrochemical Biosensing of Escherichia coli O157:H7: Material and Methods Overview. Biosensors 2020, 10, 54. [Google Scholar] [CrossRef] [PubMed]
  5. Li, T.; Zhu, F.; Guo, W.; Gu, H.; Zhao, J.; Yan, M.; Liu, S. Selective capture and rapid identification of E. coli O157:H7 by carbon nanotube multilayer biosensors and microfluidic chip-based LAMP. RSC Adv. 2017, 7, 30446–30452. [Google Scholar] [CrossRef] [Green Version]
  6. Wu, W.; Zhao, S.; Mao, Y.; Fang, Z.; Lu, X.; Zeng, L. A sensitive lateral flow biosensor for Escherichia coli O157:H7 detection based on aptamer mediated strand displacement amplification. Anal. Chim. Acta 2015, 861, 62–68. [Google Scholar] [CrossRef] [PubMed]
  7. Yu-Wen, Z.; Hai-Xia, W.; Guang-Cheng, J.; Zheng, L. Application of Aptamer-Based Biosensor for Rapid Detection of Pathogenic Escherichia coli. Sensors 2018, 18, 2518. [Google Scholar] [CrossRef] [Green Version]
  8. Li, F.; Yu, Z.; Han, X.; Lai, R. Electrochemical aptamer-based sensors for food and water analysis: A review. Anal. Chim. Acta 2019, 1051, 1–23. [Google Scholar] [CrossRef]
  9. Xu, M.; Wang, R.; Li, Y. Electrochemical biosensors for rapid detection of Escherichia coli O157:H7. Talanta 2017, 162, 511–522. [Google Scholar] [CrossRef]
  10. Deisingh, A.K.; Thompson, M. Strategies for the detection of Escherichia coli O157:H7 in foods. J. Appl. Microbiol. 2004, 96, 419–429. [Google Scholar] [CrossRef]
  11. Li, Z.; He, L.; He, N.; Shi, Z.; Wang, H.; Li, S.; Liu, H.; Li, X.; Dai, Y.; Wang, Z. Chemiluminescent Detect of E. coli O157:H7 Using Immunological Method Based on Magnetic Nanoparticles. J. Nanoence 2010, 10, 696. [Google Scholar] [CrossRef]
  12. Hunter, D.M.; Lim, D.V. Rapid detection and identification of bacterial pathogens by using an ATP bioluminescence immunoassay. J. Food Prot. 2010, 73, 739. [Google Scholar] [CrossRef]
  13. Velican, A.M.; Kamerzan, C.; Maruțescu, L.; Lambert, C.; Chifiriuc, M.C. The development of an analysis protocol based on flow cytometry for rapid detection of uropathogenic E. coli in artificially contaminated urine samples. Rom. Biotechnol. Lett. 2019, 24, 563–570. [Google Scholar] [CrossRef]
  14. Law, W.F.; Ab Mutalib, N.S.; Chan, K.G.; Lee, L.H. Rapid methods for the detection of foodborne bacterial pathogens: Principles, applications, advantages and limitations. Front. Microbiol. 2015, 5, 770. [Google Scholar] [CrossRef] [PubMed] [Green Version]
  15. Vigneshvar, S.; Sudhakumari, C.C.; Balasubramanian, S.; Hridayesh, P. Recent Advances in Biosensor Technology for Potential Applications—An Overview. Front. Bioeng. Biotechnol. 2016, 4, 11. [Google Scholar] [CrossRef] [PubMed] [Green Version]
  16. Wang, Y.; Ye, Z.; Ying, Y. New Trends in Impedimetric Biosensors for the Detection of Foodborne Pathogenic Bacteria. Sensors 2012, 12, 3449. [Google Scholar] [CrossRef] [PubMed] [Green Version]
  17. Foroughi, M.M.; Jahani, S.; Aramesh-Broujeni, Z.; Dolatabad, M.R.; Shahbazkhani, K. Synthesis of 3D cubic of Eu3+/Cu2O with clover-like faces nanostructures and their application as an electrochemical sensor for determination of antiretroviral drug nevirapine. Ceram. Int. 2021, 47, 19727–19736. [Google Scholar] [CrossRef]
  18. Foroughi, M.M.; Noroozifar, M.; Khorasani-Motlagh, M. Simultaneous determination of hydroquinone and catechol using a modified glassy carbon electrode by ruthenium red/carbon nanotube. J. Iran. Chem. Soc. 2015, 12, 1139–1147. [Google Scholar] [CrossRef]
  19. Jandaghi, N.; Jahani, S.; Foroughi, M.M.; Kazemipour, M.; Ansari, M. Cerium-doped flower-shaped ZnO nano-crystallites as a sensing component for simultaneous electrochemical determination of epirubicin and methotrexate. Microchim. Acta 2020, 187, 1–11. [Google Scholar] [CrossRef]
  20. Foroughi, M.M.; Jahani, S.; Rajaei, M. Facile fabrication of 3D dandelion-like cobalt oxide nanoflowers and its functionalization in the first electrochemical sensing of oxymorphone: Evaluation of kinetic parameters at the surface electrode. J. Electrochem. Soc. 2019, 166, B1300. [Google Scholar] [CrossRef]
  21. Zhu, Y.; Jović, M.; Lesch, A.; Tissières Lovey, L.; Prudent, M.; Pick, H.; Girault, H.H. Immuno-Affinity Amperometric Detection of Bacterial Infections. Angew. Chem. Int. Ed. 2018, 57, 14942–14946. [Google Scholar] [CrossRef]
  22. Sepunaru, L.; Tschulik, K.; Batchelor-McAuley, C.; Gavish, R.; Compton, R.G. Electrochemical detection of single E. coli bacteria labeled with silver nanoparticles. Biomater. Sci. 2015, 3, 816–820. [Google Scholar] [CrossRef]
  23. Couto, R.A.; Chen, L.; Kuss, S.; Compton, R.G. Detection of Escherichia coli bacteria by impact electrochemistry. Analyst 2018, 143, 4840–4843. [Google Scholar] [CrossRef] [PubMed]
  24. Gilman, S. The anodic film on Platinum Electrodes. Electroanal. Chem. 1967, 2, 112–189. [Google Scholar]
  25. Allen, J.B.; Larry, R.F. Electrochemical Methods Fundamentals and Applications; John Wiley & Sons: Hoboken, NJ, USA, 2001. [Google Scholar]
  26. Zhao, B.; Randall, A.A.; Taylor, J.S. Drinking water heterotrophic plate count: Monitoring method precision. Fresenius Environ. Bull. 2012, 21, 1202–1211. [Google Scholar]
  27. Kim, T.G.; Knudsen, G.R. Comparison of plate count, microscopy, and DNA quantification methods to quantify a biocontrol fungus. Appl. Soil Ecol. 2016, 98, 285–288. [Google Scholar] [CrossRef]
  28. Adler:, J.; Shi, W. Galvanotaxis in Bacteria. Cold Spring Harb. Symp. Quant. Biol. 1988, 53, 23–25. [Google Scholar] [CrossRef] [PubMed]
  29. Liu, Z.; Chen, W.; Papadopoulos, K.D. Electrokinetic movement of Escherichia coli in capillaries. Environ. Microbiol. 2010, 1, 99–102. [Google Scholar] [CrossRef]
  30. Ronspees, A.T.; Thorgaard, S.N. Blocking electrochemical collisions of single E. coli and B. subtilis bacteria at ultramicroelectrodes elucidated using simultaneous fluorescence microscopy. Electrochim. Acta 2018, 278, 412–420. [Google Scholar] [CrossRef]
  31. Hanchang, Z.; Xiaobing, Z.; Zhaorong, W. Glassy carbon electrode modified by Electrochemical Pretreatment. Anal. Instrum. 1997, 1, 2–7. [Google Scholar]
  32. Nagaoka, T.; Katayama, M.; Fujimoto, M.; Nakao, H.; Ogura, K.; Okada, T. Electrochemically pretreated glassy carbon as a chromatographic sensor for cationic and redox species. Anal. Chim. Acta 1994, 285, 135–141. [Google Scholar] [CrossRef]
  33. Fang, D.; Gao, G.; Yang, Y.; Wang, Y.; Gao, L.; Zhi, J. Redox Mediator-Based Microbial Biosensors for Acute Water Toxicity Assessment: A Critical Review. ChemElectroChem 2020, 7, 2513–2526. [Google Scholar] [CrossRef]
  34. Lee, J.Y.; Kim, B.K.; Kang, M.; Park, J.H. Label-Free Detection of Single Living Bacteria via Electrochemical Collision Event. Sci. Rep. 2016, 6, 1–6. [Google Scholar] [CrossRef] [PubMed] [Green Version]
  35. Pareilleux, A.; Sicard, N. Lethal Effects of Electric Current on Escherichia coli. Appl. Microbiol. 1970, 19, 421–424. [Google Scholar] [CrossRef] [PubMed]
  36. He, Y.T.; Zhang, Y. Theory of Electrochemical Kinetics for Perovskite Solar Cells: Fitting Current–Voltage Curves. Russ. J. Electrochem. 2019, 55, 1299–1304. [Google Scholar] [CrossRef]
  37. Liu, K.; Duan, X.; Yuan, M.; Xu, Y.; Gao, T.; Li, Q.; Zhang, X.; Huang, M.; Wang, J. How to fit a response current-concentration curve? A semi-empirical investigation of non-enzymatic glucose sensor based on PANI-modified nickel foam. J. Electroanal. Chem. 2019, 840, 384–390. [Google Scholar] [CrossRef]
  38. Boika, A.; Thorgaard, S.N.; Bard, A.J. Monitoring the electrophoretic migration and adsorption of single insulating nanoparticles at ultramicroelectrodes. J. Phys. Chem. B 2013, 117, 4371. [Google Scholar] [CrossRef]
  39. Lebègue, E.; Costa, N.L.; Louro, R.O.; Barrière, F. Communication—Electrochemical Single Nano-Impacts of Electroactive Shewanella Oneidensis Bacteria onto Carbon Ultramicroelectrode. J. Electrochem. Soc. 2020, 167, 105501. [Google Scholar] [CrossRef]
  40. Ye, S.-J.; He, Z.-H.; Hong, G.-F.; Tian, Z.-S.; Shi, X.-Y. Influence of Chemical Disinfectant on Zeta Potential of Free Bacterial Surface in Sewage Treatment System. Chin. J. Disinfect. 2006, 5, 415–418. [Google Scholar]
  41. Guner, A.; Cevik, E.; Senel, M.; Alpsoy, L. An electrochemical immunosensor for sensitive detection of Escherichia coli O157:H7 by using chitosan, MWCNT, polypyrrole with gold nanoparticles hybrid sensing platform. Food Chem. 2017, 229, 358–365. [Google Scholar] [CrossRef]
  42. Fanjun, Z.; Guangying, Z.; Wenchao, D. A non-enzymatic electrochemical immunoassay for quantitative detection of Escherichia coli O157:H7 using Au@Pt and graphene. Anal. Biochem. 2018, 559, 34–43. [Google Scholar] [CrossRef]
  43. Jaiswal, N.; Pandey, C.M.; Soni, A.; Tiwari, I.; Rosillo-Lopez, M.; Salzmann, C.G.; Malhotra, B.D.; Sumana, G. Electrochemical genosensor based on carboxylated graphene for detection of water-borne pathogen. Sens. Actuators B Chem. 2018, 275, 312–321. [Google Scholar] [CrossRef]
  44. Ye, L.; Zhao, G.; Dou, W. An electrochemical immunoassay for Escherichia coli O157:H7 using double functionalized Au@Pt/SiO2 nanocomposites and immune magnetic nanoparticles. Talanta Int. J. Pure Appl. Anal. Chem. 2018, 182, 354–362. [Google Scholar] [CrossRef] [PubMed]
  45. Das, R.; Chaterjee, B.; Kapil, A.; Kumar, T. Aptamer-NanoZyme mediated sensing platform for the rapid detection of Escherichia coli in fruit juice. Sens. Bio-Sens. Res. 2020, 27, 100313. [Google Scholar] [CrossRef]
  46. Guanyue, G.; Dengchao, W.; Brocenschi, R.F.; Jin-Fang, Z.; Mirkin, M.V. Toward the Detection and Identification of Single Bacteria by Electrochemical Collision Technique. Anal. Chem. 2018, 90, acsanalchem8b03043. [Google Scholar] [CrossRef]
  47. Szumski, M.; Buszewski, B. Effect of Applied Voltage on Viability of Bacteria during Separation under Electrophoretic Conditions. J. Liq. Chromatogr. Relat. Technol. 2011, 34, 2689–2698. [Google Scholar] [CrossRef]
  48. Daya, K.S.; Tirumalai, P.S.; Alocilja, E. Impedance and Magnetohydrodynamic Measurements for Label Free Detection and Differentiation of E. coli and S. aureus Using Magnetic Nanoparticles. IEEE Trans. Nanobioscience 2018, 17, 443–448. [Google Scholar] [CrossRef]
  49. Thorgaard, S.N.; Jenkins, S.; Tarach, A.R. Influence of Electroosmotic Flow on Stochastic Collisions at Ultramicroelectrodes. Anal. Chem. 2020, 92, 12663–12669. [Google Scholar] [CrossRef]
  50. Esmaeili, H.; Ebrahimi, A.; Hajian, M.; Pourzamani, H.R. Kinetic and isotherm studies of humic acid adsorption onto iron oxide magnetic nanoparticles in aqueous solutions. Int. J. Environ. Health Eng. 2012, 1, 33. [Google Scholar]
  51. Tan, K.H. Humic Matter in Soil and the Environment: Principles and Controversies; CRC Press: Boca Raton, FL, USA, 2014. [Google Scholar]
  52. Nagao, S.; Aramaki, T.; Fujitake, N.; Kodama, H.; Tanaka, T.; Ochiai, S.; Uchida, M.; Shibata, Y.; Yamamoto, M. Variation of Δ14C and δ13C Values of Dissolved Humic and Fulvic Acids in the Tokachi River System in Northern Japan. Radiocarbon 2013, 55, 1007–1016. [Google Scholar] [CrossRef]
  53. Islam, M.A.; Morton, D.W.; Johnson, B.B.; Angove, M.J. Adsorption of humic and fulvic acids onto a range of adsorbents in aqueous systems, and their effect on the adsorption of other species: A review. Sep. Purif. Technol. 2020, 247, 116949. [Google Scholar] [CrossRef]
  54. Hwang, G.; Han, Y.; Choi, S.Q.; Cho, S.; Kim, H. Bacterial inactivation by ultrasonic waves: Role of ionic strength, humic acid, and temperature. Water Air Soil Pollut. 2015, 226, 1–9. [Google Scholar] [CrossRef]
  55. Mirzavand, R.; Honari, M.M.; Laribi, B.; Khorshidi, B.; Sadrzadeh, M.; Mousavi, P. An unpowered sensor node for real-time water quality assessment (humic acid detection). Electronics 2018, 7, 231. [Google Scholar] [CrossRef] [Green Version]
  56. Mathelié-Guinlet, M.; Cohen-Bouhacina, T.; Gammoudi, I.; Martin, A.; Beven, L.; Delville, M.H.; Grauby-Heywang, C. Silica Nanoparticles-Assisted Electrochemical Biosensor for the Rapid, Sensitive and Specific Detection of Escherichia coli. Sens. Actuators B Chem. 2019, 292, 314–320. [Google Scholar] [CrossRef]
  57. Zhang, J.; Wang, J.; Zhang, X.; He, F. Rapid Detection of Escherichia Coli Based on 16 S Rdna Nanogap Network Electrochemical Biosensor. Biosens. Bioelectron. 2018, 118, 9–15. [Google Scholar] [CrossRef]
  58. Wang, D.; Hinkley, T.; Chen, J.; Talbert, J.N.; Nugen, S.R. Phage Based Electrochemical Detection of Escherichia Coli in Drinking Water Using Affinity Reporter Probes. Analyst 2019, 144, 1345–1352. [Google Scholar] [CrossRef]
  59. Mo, X.; Wu, Z.; Huang, J.; Zhao, G.; Dou, W. A Sensitive and Regenerative Electrochemical Immunosensor for Quantitative Detection of Escherichia Coli O157:H7 Based on Stable Polyaniline Coated Screen-Printed Carbon Electrode and Rgo-Nr-Au@Pt. Analytical Methods 2019, 11, 1475–1482. [Google Scholar] [CrossRef]
Figure 1. Schematic diagram of the proposed detection method. (A) E. coli migrates towards GCE in the electrolyte; (B) adsorption of E. coli on the glassy carbon electrode (GCE) surface, resulting in electron transfer being blocked.
Biosensors 12 00845 g001
Figure 2. Electrochemical response of the same electrode system to different Escherichia coli concentrations. (A) electric quantity index; (B) electric current index. These two detection indicators were inversely proportional to the concentration of E. coli.
Biosensors 12 00845 g002
Figure 3. Influence of dead bacteria on the electrochemical response indices under different electrode systems. (A) Electric quantity index and (B) electric current index values when analyzing bacterial lysates after ultrasonic disruption; (C) electric quantity index and (D) electric current index values to detect bacterial structure after glutaraldehyde fixation. Black symbols indicate the concentration of original bacterial cells before the dead bacteria inactivation treatment, and red symbols indicate the concentration of viable bacteria; there was a significant difference between dead bacteria and live bacteria response indicators.
Biosensors 12 00845 g003
Figure 4. Scanning electron microscopy of the electrode surface after electrochemical detection. (A) The surface of the GCE after testing the sterile electrolyte was smooth and tidy; (B) after detecting the bacteria-containing electrolyte, the GCE surface had obviously adsorbed the bacterial cell structure.
Biosensors 12 00845 g004
Figure 5. Fluorescence microscopy of the electrode surface after electrochemical detection. (A) The electrode surface after detection of sterile electrolyte; (B) the electrode surface after detecting electrolyte with bacterial concentration of 105 CFU/mL; (C) the electrode surface after detecting electrolyte with bacterial concentration of 108 CFU/mL. The yellow fluorescence represents impurity particles, and the blue fluorescence represents E. coli cells. The number of bacteria adsorbed on the GCE surface increases with the increase of the bacterial concentration in the electrolyte.
Biosensors 12 00845 g005
Figure 6. Changes in the bacterial concentration in the electrolyte before and after the test. The relationship between the changes in the number (A) and concentration (B) of the bacteria in the electrolyte before and after the detection and the initial concentration of E. coli.
Biosensors 12 00845 g006
Publisher’s Note: MDPI stays neutral with regard to jurisdictional claims in published maps and institutional affiliations.

