Article

Fabrication of P and N Co-Doped Carbon Dots for Fe3+ Detection in Serum and Lysosomal Tracking in Living Cells

1
Department of Chemistry, College of Sciences, Northeastern University, Shenyang 110819, China
2
School of Chemistry and Chemical Engineering, Liaoning Normal University, Dalian 116029, China
*
Author to whom correspondence should be addressed.
Biosensors 2023, 13(2), 230; https://doi.org/10.3390/bios13020230
Submission received: 19 December 2022 / Revised: 1 February 2023 / Accepted: 3 February 2023 / Published: 5 February 2023
(This article belongs to the Special Issue Polymer-Dot-Based Biosensors for Biomedical Applications)

Abstract

:
Doping with heteroatoms allows the retention of the general characteristics of carbon dots while allowing their physicochemical and photochemical properties to be effectively modulated. In this work, we report the preparation of ultrastable P and N co-doped carbon dots (PNCDs) that can be used for the highly selective detection of Fe3+ and the tracking of lysosomes in living cells. Fluorescent PNCDs were facilely prepared via a hydrothermal treatment of ethylenediamine and phytic acid, and they exhibited a high quantum yield of 22.0%. The strong coordination interaction between the phosphorus groups of PNCDs and Fe3+ rendered them efficient probes for use in selective Fe3+ detection, with a detection limit of 0.39 μM, and we demonstrated their practicability by accurately detecting the Fe3+ contents in bio-samples. At the same time, PNCDs exhibited high lysosomal location specificity in different cell lines due to surface lipophilic amino groups, and real-time tracking of the lysosome morphology in HeLa cells was achieved. The present work suggests that the fabrication of heteroatom-doped CDs might be an effective strategy to provide promising tools for cytology, such as organelle tracking.

1. Introduction

Lysosomes are acidic subcellular organelles with pH values of 4.0 to 6.0 that occur extensively in all eukaryotic cells [1,2]. As part of the cellular digestive system, lysosomes contain a variety of hydrolases and secretory proteins and constitute the terminal degradation chambers of animal cells [3,4]. They receive foreign species and degrade macromolecules to produce small-molecule nutrients, in addition to playing major parts in various physiological processes (e.g., intracellular transport, energy homeostasis, macromolecule circulation, apoptosis, autophagy metabolism, and immunologic defense). Lysosomal dysfunction is usually related to various pathologies, including inflammation, cancer, neurodegenerative diseases, and atherosclerosis [5,6,7,8,9,10]. Up to now, tremendous efforts have been expended in monitoring lysosomal activities, such as through lysosomal membrane stability tests [11], immunohistochemical (Ih) assays of lysosomal marker enzymes [12], and neutral red retention time assays [13]. The fluorescence imaging of lysosomes has recently been gaining increasing attention, as it provides a means for direct visual observation. Most fluorescent lysosome-targeting probes used in such applications are modified with weakly basic morpholine for accumulation in this acidic organelle following protonation [14]. Due to their leakage from lysosomes, these fluorescence probes might cause the pH of lysosomes to increase after long-term accumulation, leading to the risk of significantly decreased fluorescence intensity of fluorophores, making it difficult to achieve real-time monitoring of lysosome activities. Therefore, the design and development of ultrastable probes that are able to monitor the status and changes of lysosomes in real time is urgently desired for use in advancing our understanding of lysosome dynamics and functions in biological processes.
Ferric ion (Fe3+) is involved in cell metabolism and enzymatic catalysis and is an oxygen carrier in hemoglobin [15,16,17]. Fe3+ overload or paucity can disturb homeostasis in cells and leads to iron deficiency anemia (IDA), arthritis, mental decline, heart failure, diabetes, cancer, and other various diseases [18,19,20,21]. Therefore, the detection of Fe3+ is very important for the early recognition and diagnosis of these diseases [22]. However, the detection selectivity of most spectral probes for sensing Fe3+ is usually inadequate [23,24]. Therefore, the development of fluorescent probes with high specificity for Fe3+ is necessary.
In recent years, carbon-based nanomaterials have stood out as new nanosensors due to their unique chemical and physical properties [25,26,27]. In the family of carbon-based nanomaterials, carbon dots (CDs) have been considered dependable fluorescence probes [28,29] and have gained great attention in various fields such as biomedicine, optoelectronic devices, catalysis, sensing, and bio-imaging [30,31,32,33,34,35]. Theoretically, the physicochemical features and optical properties of CDs could be extensively tunable by modulating precursors and/or manipulating the reaction conditions in the preparation of CDs [36]. Surface passivation, surface modification, and heteroatom doping have been shown to be effective for modulating the characteristics of CDs [37,38]. Huang's group designed and synthesized CDs passivated with polyetherimide (PEI), which significantly improved the fluorescence (FL) quantum yield of CDs and the FL emission stability under different excitation energies [39]. Chen et al. synthesized CDs modified with amine groups and lauryl amine via an 1-ethyl-3-(3-dimethylaminopropyl)carbodiimide hydrochloride (EDC) coupling reaction with citric acid monohydrate and urea as carbon sources. Alkyl chains with different lengths varied the amino to carboxyl group ratio, offering CDs with different pH responses, endocytosis pathways, and organelle-targeting abilities [40]. However, the passivation and modification process was usually tedious, and most examples involved the use of toxic organic reagents. In this respect, heteroatom doping has been gaining increasing attention due to the facile synthesis and remarkable modified effects. Until now, B [41], N [42], P [43], S [44], and halogens [45] have been integrated into CDs, and the generated heteroatom-doped products have exhibited outstanding optical performances in targeted applications. For example, Manioudakis’s group revealed that the quantum yield of CDs could be improved from less than 1% to nearly 60% by increasing the amount of doped nitrogen [46]. Li et al. used a graphite rod as a carbon source to obtain P-doped CDs via the electrolysis of sodium phytate based on the ease of cleaving the C–P bond in CDs using 2,2-diphenyl-1-picrylhydrazyl (DPPH). Therefore, P-doped CDs exhibit an attractive capacity for scavenging free radicals [47]. Moreover, N and P co-doped CDs are gaining increasing popularity in different fields due to their attractive photoluminescence prosperity (Table S1).
In this study, P and N co-doped CDs (PNCDs) were facilely prepared via a mild hydrothermal procedure using phytic acid and ethylenediamine as precursors (Scheme 1). The as-prepared PNCDs exhibited excellent photoluminescence (PL) properties, such as high quantum yield (22.0%), good photostability, and favorable resistance to variations in pH and ionic strength. PNCDs were proven to be sensitive fluorescence probes for highly selective Fe3+ sensing due to the specific coordination interaction between the phosphorus groups of PNCDs and Fe3+, and they were successfully applied in the accurate detection of Fe3+ contents in human serum and cells. At the same time, PNCDs showed high lysosomal location specificity in different cell lines due to their surface lipophilic amines, and the dynamic tracking of lysosomal status during the apoptosis of HeLa cells was achieved.

2. Materials and Methods

2.1. Materials

Phytic acid was purchased from McLean Biochemical Technology Co., Ltd. (Shanghai, China). Ethylenediamine, NaCl, FeCl3·6H2O, CaCl2, FeCl2, MgCl2·6H2O, HgCl2, MnSO4·H2O, CuSO4·5H2O, ZnCl2, ammonium acetate, potassium permanganate, and potassium dichromate were provided by the Damao Chemical Reagent Plant (Tianjin, China). All amino acids were purchased from Mellon Biotechnology Co., Ltd. (Dalian, China). 3-(4,5-Dimethylthiazole)-2,5-phenyltetrazolium bromide (MTT) and dimethyl sulfoxide (DMSO) were purchased from Sigma (Shanghai, China). ER-Tracker Red, Lyso-Tracker Red, and Mito-Tracker Deep Red were obtained from Beyotime Biotechnology Co., Ltd. (Shanghai, China). Cells were provided by Procell Life Science & Technology Co., Ltd. (Wuhan, China). Deionized water (18 MΩ cm) was used in all experiments.

2.2. Instruments and Measurements

Transmission electron microscopy (TEM) was performed using a JEM-ARM200F field-emission electron microscope (JEOL, Tokyo, Japan). Fourier transform infrared spectrum (FT-IR) were conducted using a Tensor II FT-IR spectrometer (Bruker, Saarbrucken, Germany). An X-ray photoelectron spectroscopy (XPS) analysis was recorded using an ESCALAB 250Xi analysis system (Thermo Fisher Scientific, Waltham, MA, USA). Ultraviolet-visible (UV–vis) spectra were measured using a U-3900 spectrophotometer (Hitachi, Tokyo, Japan). Fluorescent spectra were recorded using an F-7000 fluorescence spectrometer (Hitachi, Tokyo, Japan) with 1 cm quartz cells. A cytotoxicity assay was conducted using a Synergy H1 ELISA plate reader at an absorbance of 570 nm, and cell images were captured using a widefield fluorescence microscope (Olympus, Tokyo, Japan).

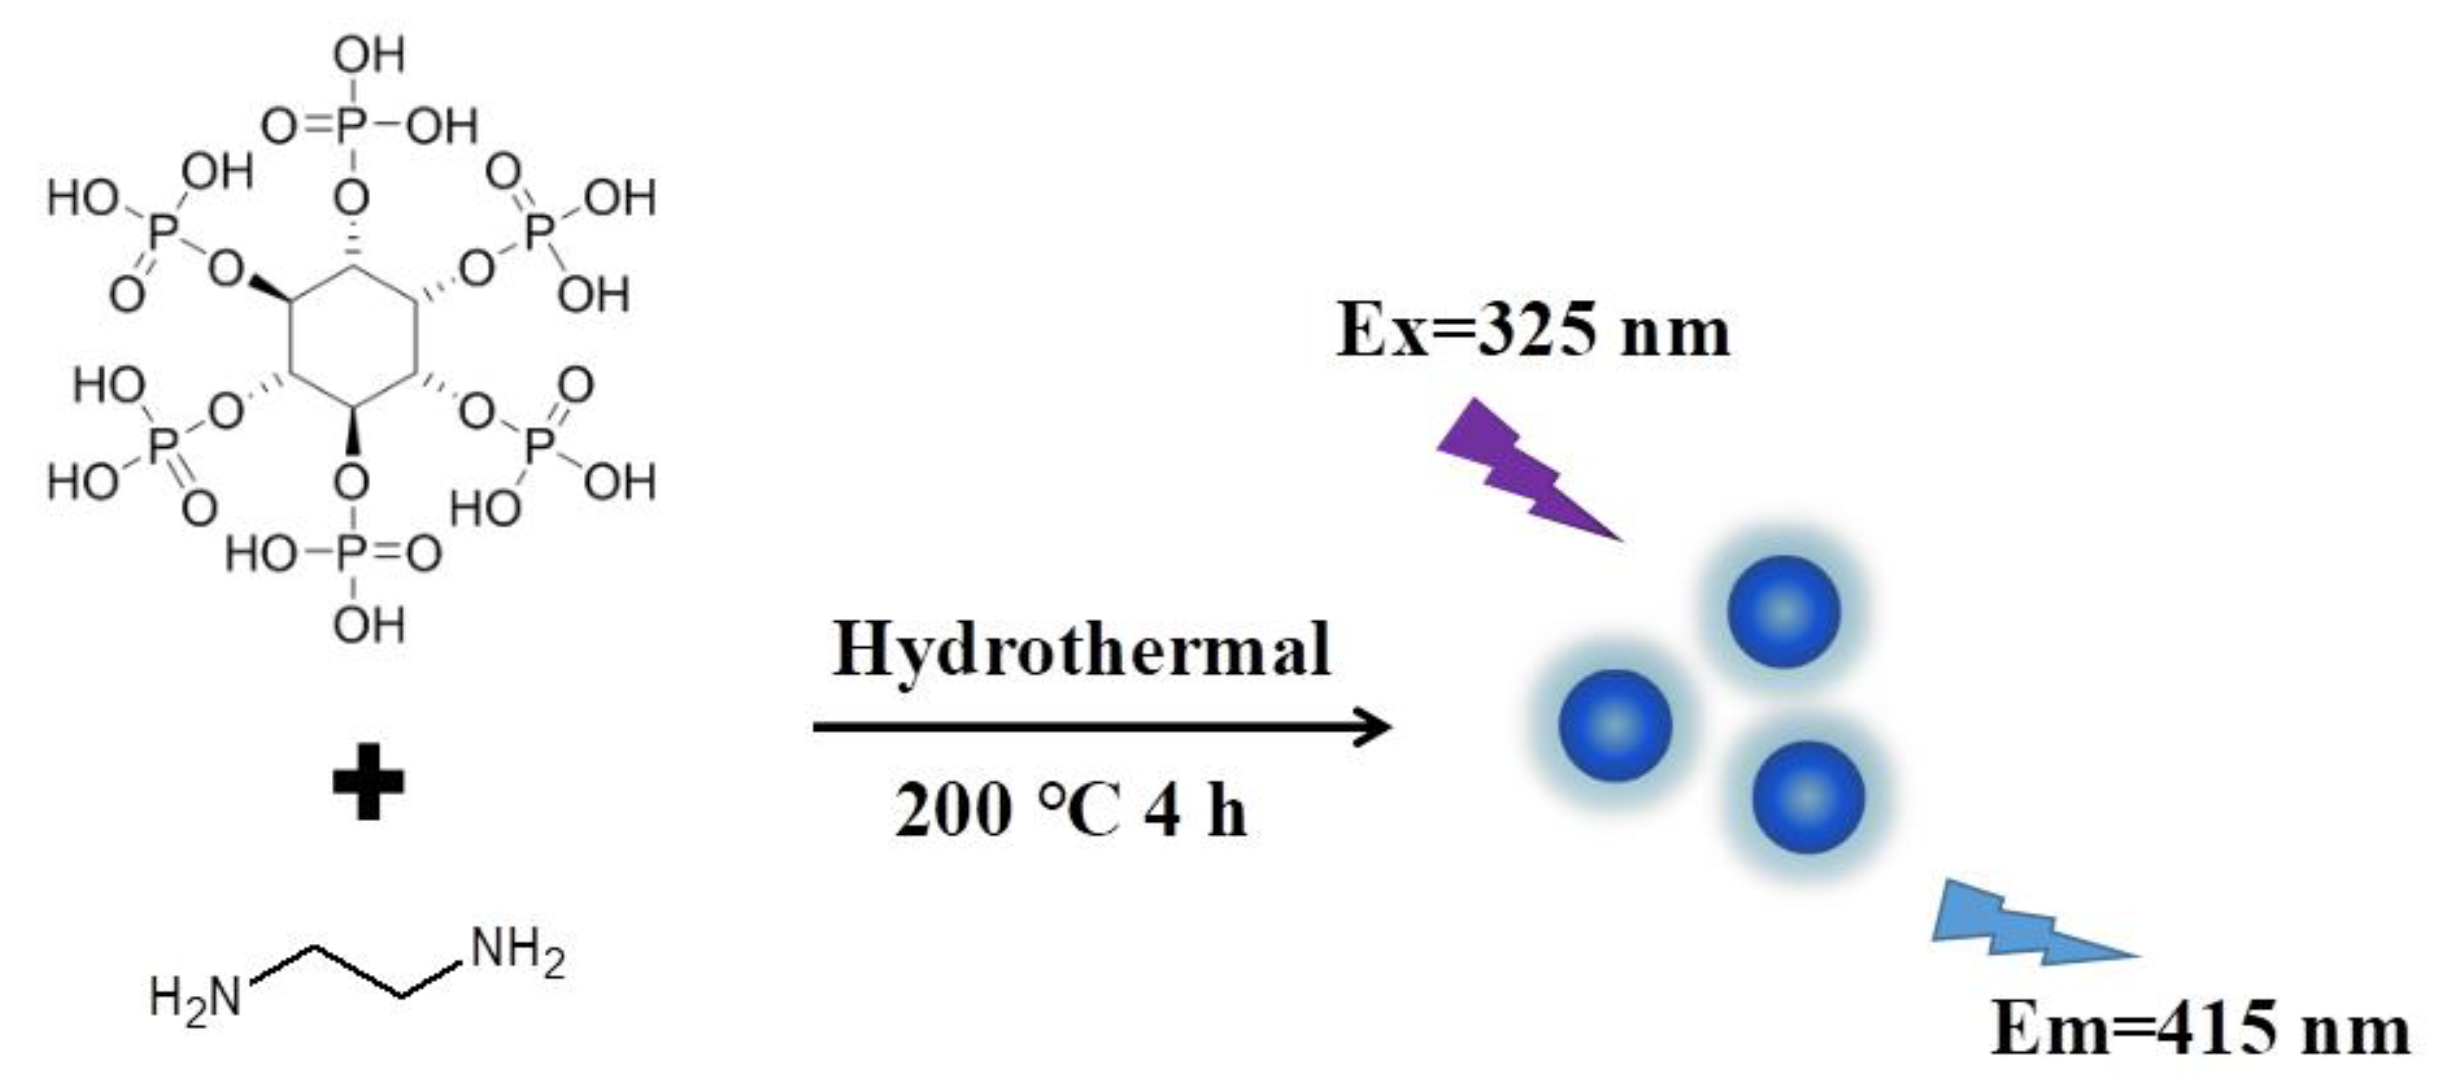
2.3. Preparation of PNCDs

Ethylenediamine (2.1 mL) and 1 mL of phytic acid (70%, v/v) were dissolved into 25 mL of deionized water and stirred for 15 min. Then, the mixture was sealed in a 50 mL Teflon autoclave. After heating at 200 °C for 4 h, the resultant product was collected and dialyzed using a dialysis membrane (2000 Da) to remove unreacted small molecules. The obtained solution was dried and re-dispersed into deionized water.
For comparison, N-doped carbon dots (NCDs) were also prepared using only ethylenediamine as a precursor via the same preparation procedure, and the characterizations are summarized in Figure S1.

2.4. PL Assay of Fe3+ with PNCDs

Assays of Fe3+ were conducted using PNCDs as the fluorescence probes. Briefly, 0.25 mL of an Fe3+ solution (0–1000 μM) was mixed with 50 μL of a PNCD solution (50 μg mL−1, prepared in PBS buffer of pH 7.40). The resultant mixture was incubated for 5 min at 25 °C, and the PL spectra were then obtained at λex = 325 nm.
The calibration curve was deduced based on the relationship between the Fe3+ content and the fluorescence quenching efficiency ((F0 − F)/F0, where F0 and F indicate the PL intensities of PNCDs in the absence/presence, respectively, of Fe3+).
The selectivity was investigated by adding other interfering substances (including various ions, amino acids, and proteins) into the assay system. Each measurement was implemented in triplicate to evaluate the experimental error.

2.5. Detection of Fe3+ Content in Human Serum and SH-SY5Y Cells

Whole-blood samples were obtained from Northeastern University Hospital. First, fresh human serum was mixed with an equal volume of anhydrous ethanol, followed by heating at 90 °C for 10 min. After cooling to 25°C, the serum was treated with ultrasound for 10 min and centrifuged at 5000 rpm for 5 min, and the protein sediment was discarded. Thereafter, the supernatant was carefully collected for a subsequent quantitative assay following the above PL assay procedure.
Around 70% of adherent SH-SY5Y cells were digested with pancreatin. After subsequent washing with PBS buffer (pH 7.40), deposits of cells were transferred into lysis buffer on ice for 30 min with agitation. Then, the cell solution was centrifuged at 10,000 rpm for 10 min to remove cell fragments. Finally, the supernatant was collected and diluted twice for a subsequent quantitative assay following the above PL assay procedure.

2.6. Cytotoxicity Assay

The standard MTT test was adopted to assess the cytotoxicity of PNCDs. HeLa cells were cultured in a 96-well plate with different concentrations of PNCDs (100 μL, prepared in a serum-free DMEM medium). After incubation for 24 h, the old DMEM medium was aspirated, and 10 μL of MTT (5 mg mL−1) was then added before incubation for 4 h. Next, 100 μL of DMSO was added, and the absorbance at 570 nm was recorded to determine the cell viability of each sample.

2.7. Subcellular Localization of PNCDs

HeLa cells were adhered to the culture dish and preincubated with 0.20 mg mL−1 PNCDs for 40 min before a subsequent incubation with Lyso-Tracker Red, ER-Tracker Red, or Mito-Tracker Deep Red, according to the manufacturer’s instructions. Fluorescence images were obtained using a wide-field fluorescence microscope with a 60 × objective lens. The following microscopy settings were used: blue/red channel and Ex = 330–380 nm/510–560 nm. Pearson’s correlation coefficients were analyzed using Image J software.

2.8. Lysosomal Tracking

HeLa cells were pretreated with 0.20 mg mL−1 PNCDs for 40 min, and dexamethasone (50 mM) was then added to induce cell apoptosis. After thoroughly washing with PBS, fluorescence imaging of PNCDs in the HeLa cells was performed using a wide-field fluorescence microscope. The blue fluorescence channel observation conditions were set as follows: Ex = 330–380 nm.

3. Results and Discussion

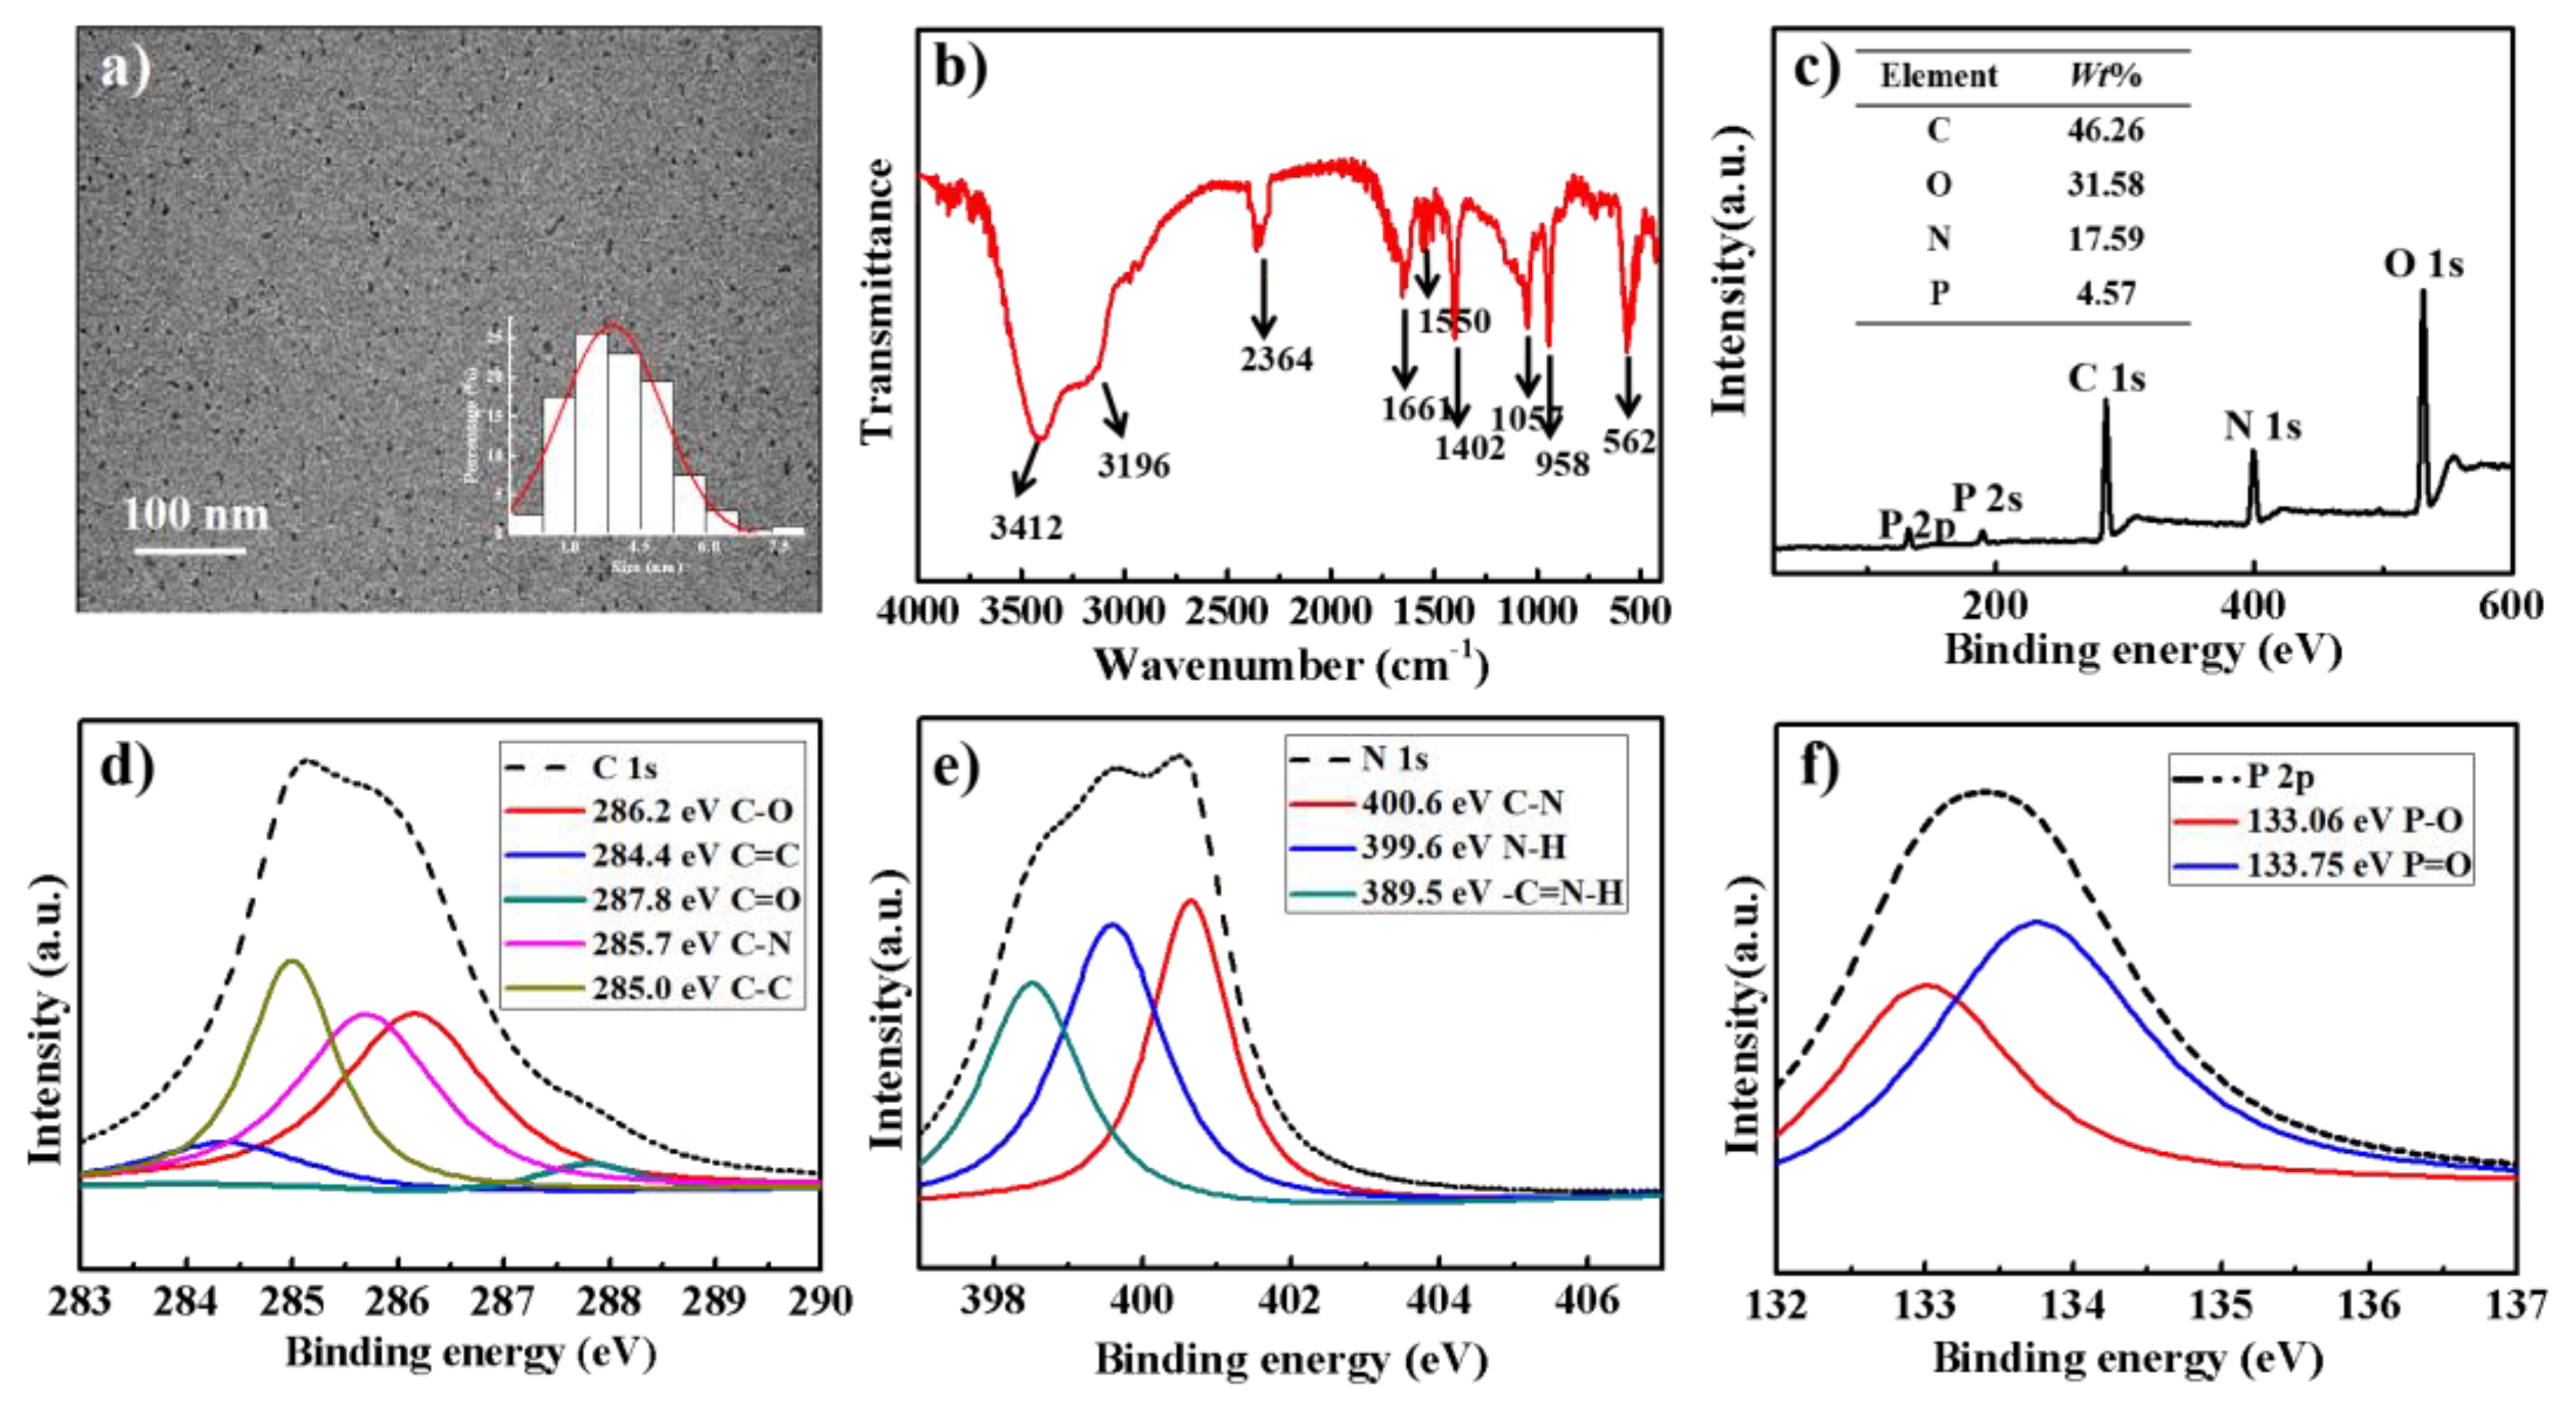
3.1. Preparation and Characterization of PNCDs

Herein, PNCDs were fabricated via a simple hydrothermal route using phytic acid and ethylenediamine as precursors. To obtain highly fluorescent CDs, the impact of the mole ratio of phytic acid/ethylenediamine was studied, and PNCDs prepared with a phytic acid/ethylenediamine mole ratio of 1:20 exhibited the highest quantum yield (Table S2). This phenomenon may be due to the modulation of the electronic and chemical properties of CDs based on the proportion of co-doped N and P [48]. Figure 1a shows a TEM image of the as-prepared PNCDs. On the basis of about 100 random particles, the size distribution of PNCDs was found to range from 1.87 to 7.89 nm, with an average diameter of about 4.03 nm. The XRD pattern of PNCDs displayed one broad peak centered at 20° (Figure S2), which was attributed to the amorphous structure of the PNCDs. In the FT-IR spectra of PNCDs (Figure 1b), the band at 562 cm−1 represented P–O. The bands at 958 and 1057 cm−1 suggested the existence of P–OH and P=O, respectively. The band at 2364 cm−1 was ascribed to C–N vibration. The typical broad bands at 1550 and 1661 cm−1 were, respectively, assigned to C=N and C=O stretching vibrations. The bands at 3196 and 3412 cm−1, respectively, represented N–H stretching vibrations and the O–H stretching mode of the carboxylic functional group. The FT-IR spectra confirmed the presence of carboxyl, hydroxyl, amino, and phosphate groups in the obtained PNCDs. XPS was further used to study the surface components and the elemental chemical state of PNCDs. As shown in Figure 1c, the P 2s, P 2p, C 1s, N 1s, and O 1s signals appeared at 190.7, 131.0, 285.3, 398.7, and 531.0 eV, respectively. The C 1s spectrum was well deconvoluted into C=C (284.4 eV), C–C/C–P (285.0 eV), C–N (285.7 eV), C–O (286.2 eV), and O–C=O (287.8 eV) (Figure 1d). The three distinct peaks at 400.6, 399.8, and 398.5 eV in the N 1s spectrum, respectively, corresponded to C–N, N–H, and C=N–H (Figure 1e). The high-resolution scan of P 2p decomposed into two distinct peaks at 133.8 and 133.1 eV, indicating the formation of P=O and P–O, respectively (Figure 1f). The XPS results of PNCDs were consistent with those of FT-IR, suggesting that the P and N elements were successfully doped into the final product.

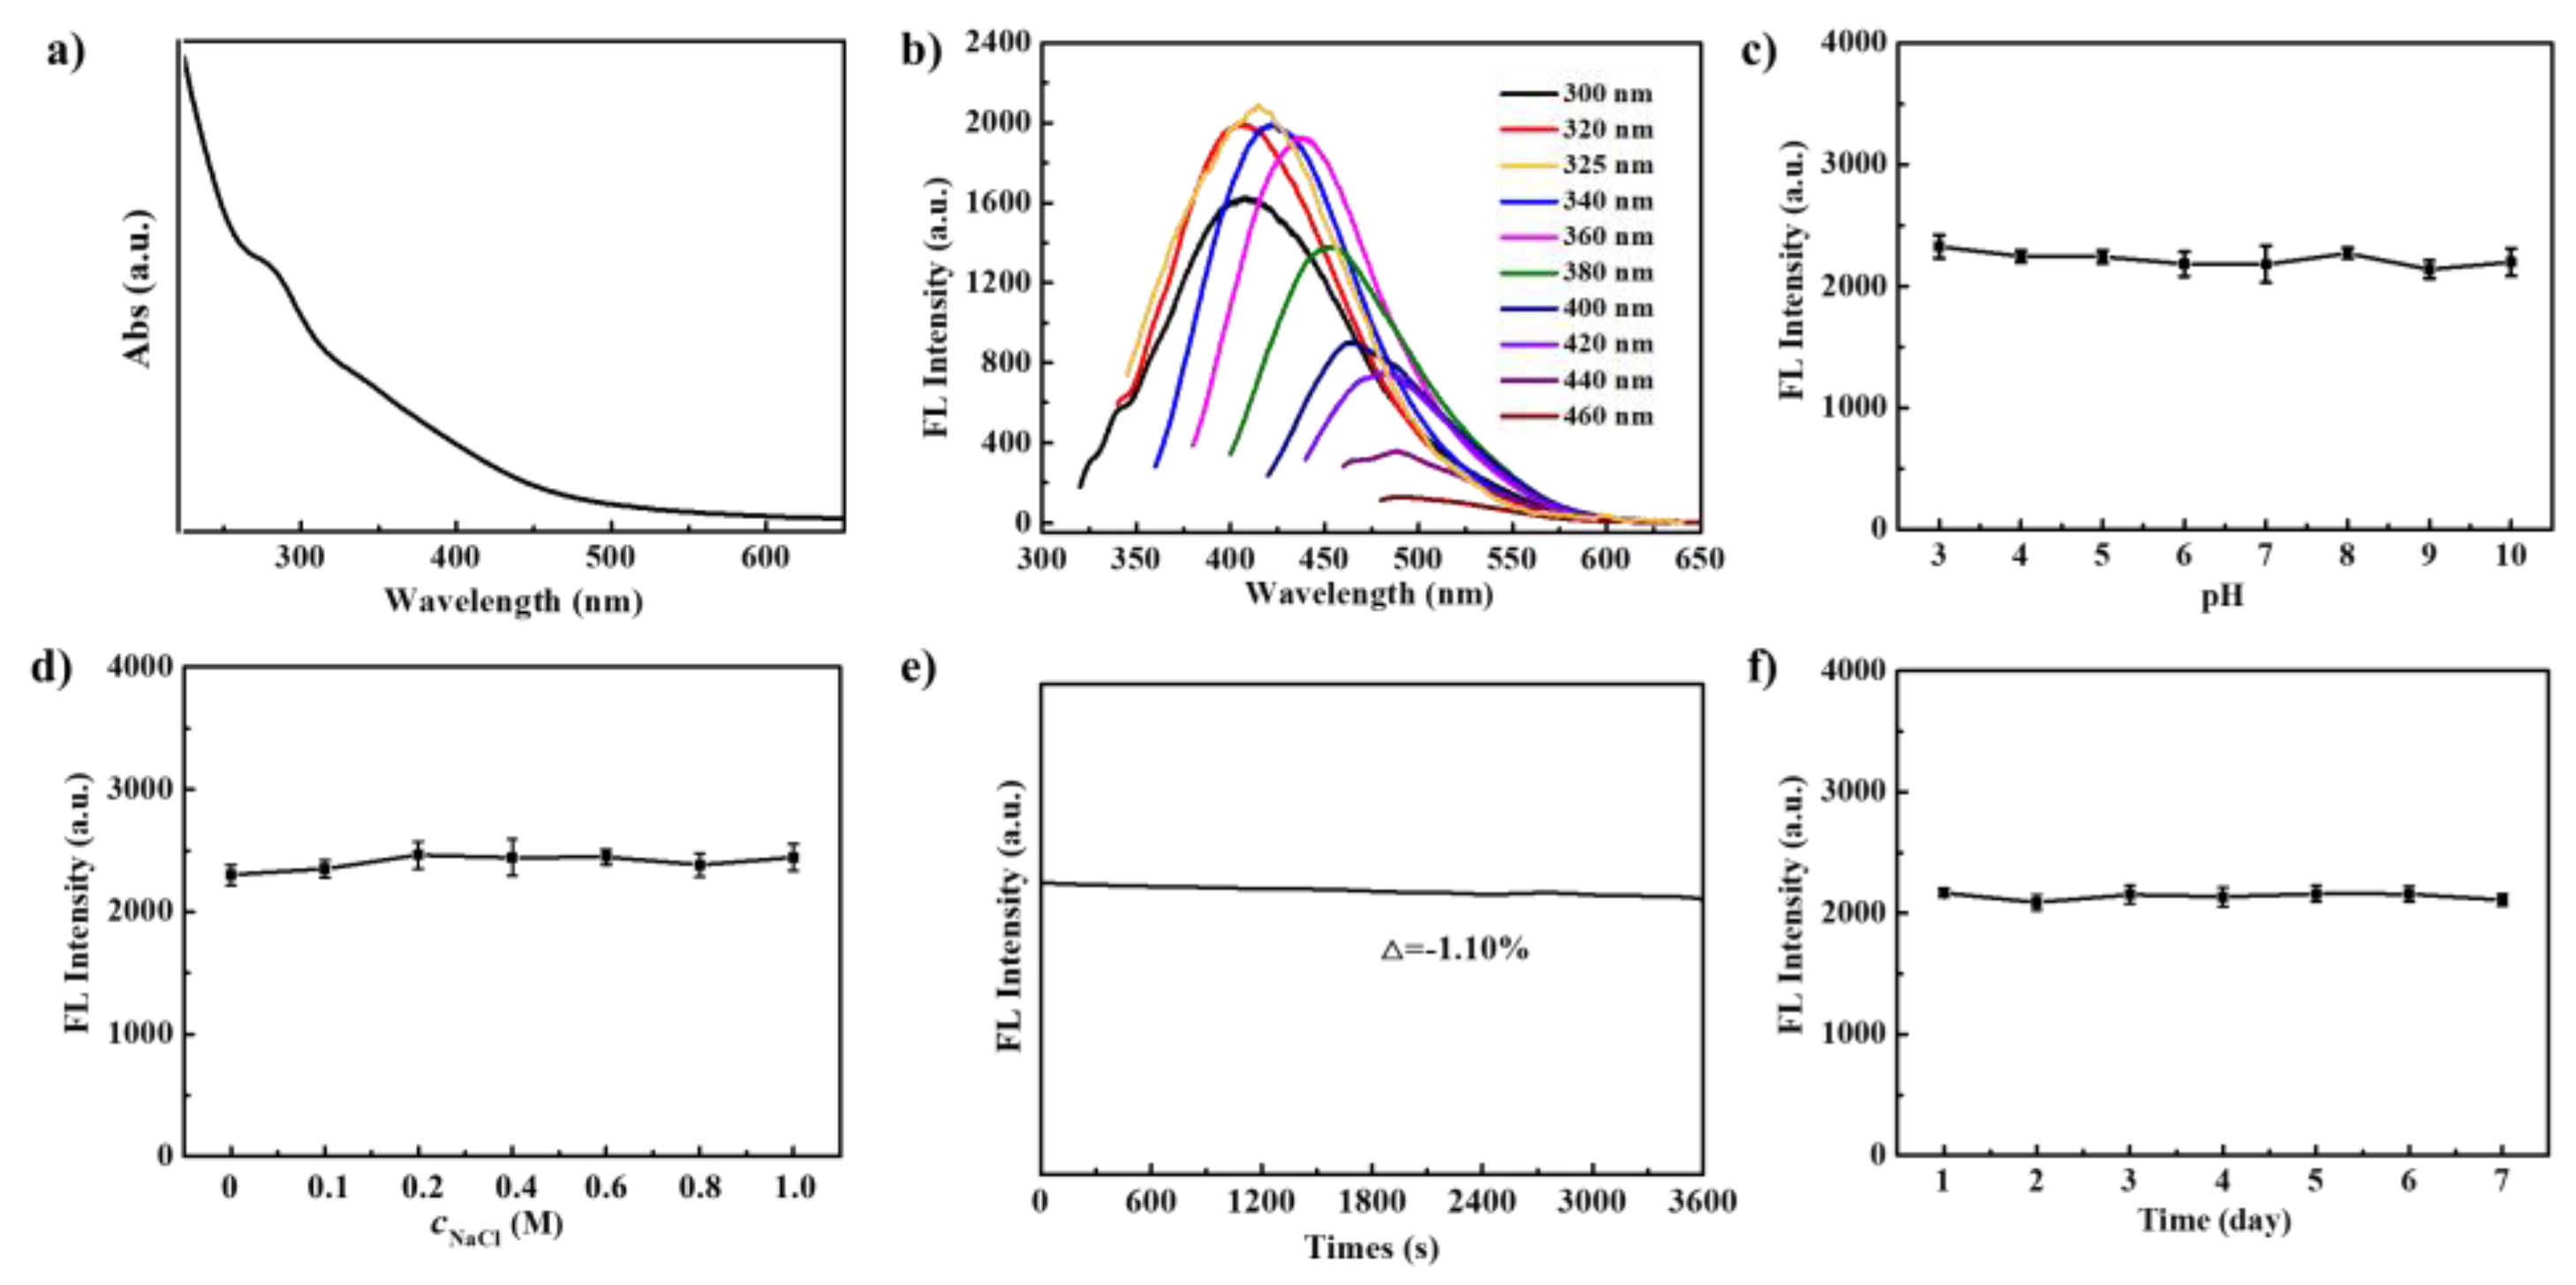
3.2. Optical Properties of PNCDs

The remarkable optical features of PNCDs were explored using UV–vis and fluorescence spectroscopy. It can be seen in Figure 2a that the PNCDs exhibited intense absorption bands around 270 nm, which were attributed to the π–π* transitions of C=C/C=N/N=P groups [49]. Figure 2b shows the fluorescence behaviors of PNCDs under excitation from 300 to 460 nm. A redshift in fluorescence emission was observed, and the excitation/emission maxima were found at 325/415 nm. The CIE color parameters obtained using the PNCD emission were spectrally blue light (Figure S3). The quantum yield of PNCDs was deduced to be 22.0% using quinine sulfate (0.05 M, prepared in H2SO4) as the reference substance.
Figure 2c demonstrates that the photoluminescence of PNCDs remained quite stable at pH 3–10. Additionally, little variation in PNCD photoluminescence was observed at high ionic strengths (NaCl concentrations up to 1.0 M could be tolerated) (Figure 2d). The PL intensity of PNCDs was unchanged under 325 nm irradiation for 60 min (Figure 2e). PNCDs displayed sustained photostability after being stored at room temperature for 7 days (Figure 2f). These results suggest that PNCDs have good potential as stable fluorescent probes in biological samples where pH fluctuations, high ionic strengths, or long irradiation times might be encountered.

3.3. Highly Sensitive Sensing of Fe3+ Using PNCDs

Inspired by the unique optical properties of the prepared PNCDs, their potential sensing applications were further investigated. An extensive screening test was performed, and distinct PL quenching of PNCDs was only observed in the presence of Fe3+. PL quenching was hardly influenced by pH (Figure S4), demonstrating that the PNCDs are powerful nanoprobes that can be used for Fe3+ sensing. It can be seen in Figure 3a that the PL intensity of PNCDs decreased with increasing Fe3+ concentrations. The quenching efficiency ((F0 − F)/F0) of PNCDs presents piecewise linear relationships versus the concentration of Fe3+ over a wide range of 1–1000 µM (Figure 3b). The linear equations are (F0 − F)/F0 = 0.01426cFe3+ + 0.06452 (R2 = 0.9961) in the Fe3+ concentration range of 1–10 µM and (F0 − F)/F0 = 0.0004757cFe3+ + 0.2104 (R2 = 0.9930) in the Fe3+ concentration range of 10-1000 µM. The detection limit was deduced to be 0.39 µM, which complied with the IUPAC criteria (S/N = 3). Compared to other CD probes reported for Fe3+ sensing, the as-prepared PNCDs had high sensing sensitivity (Table S3), which might be attributed to the favorable photostability and the effective fluorescence quenching response of PNCDs to Fe3+. The detection limit of the PNCDs to Fe3+ was far below the minimum value of the normal Fe3+ level in serum [50]. The as-prepared PNCDs displayed sensitive responses to a wide range of Fe3+. Therefore, the PNCDs could serve as powerful probes to evaluate the abnormalities of Fe3+ contents in bio-samples.
In order to assess the sensing selectivity of PNCDs, different ions (Na+, K+, Ca2+, Mg2+, Fe2+, Zn2+, Mn2+, Cu2+, Ni2+, Cd2+, Pb2+, Cr3+, Cl, CH3COO, NO3, SO42−, PO42−, and S2−; 500 μM), typical amino acids (His, Thr, Ser, Leu, Val, Ala, Lys, Arg, Orn, Pro, Cys, Glu, Phe, and Leu; 100 μM) and proteins (BSA, HigG, and Myo; 5 × 10⁻⁴ mg mL−1) were used as potential interferents in the biological assay system, and the fluorescence responses of PNCDs to these species were recorded to evaluate their interference. In Figure 3c, it can be seen that significant fluorescence quenching was only observed for Fe3+, suggesting excellent selectivity of PNCDs toward Fe3+ in sensing.

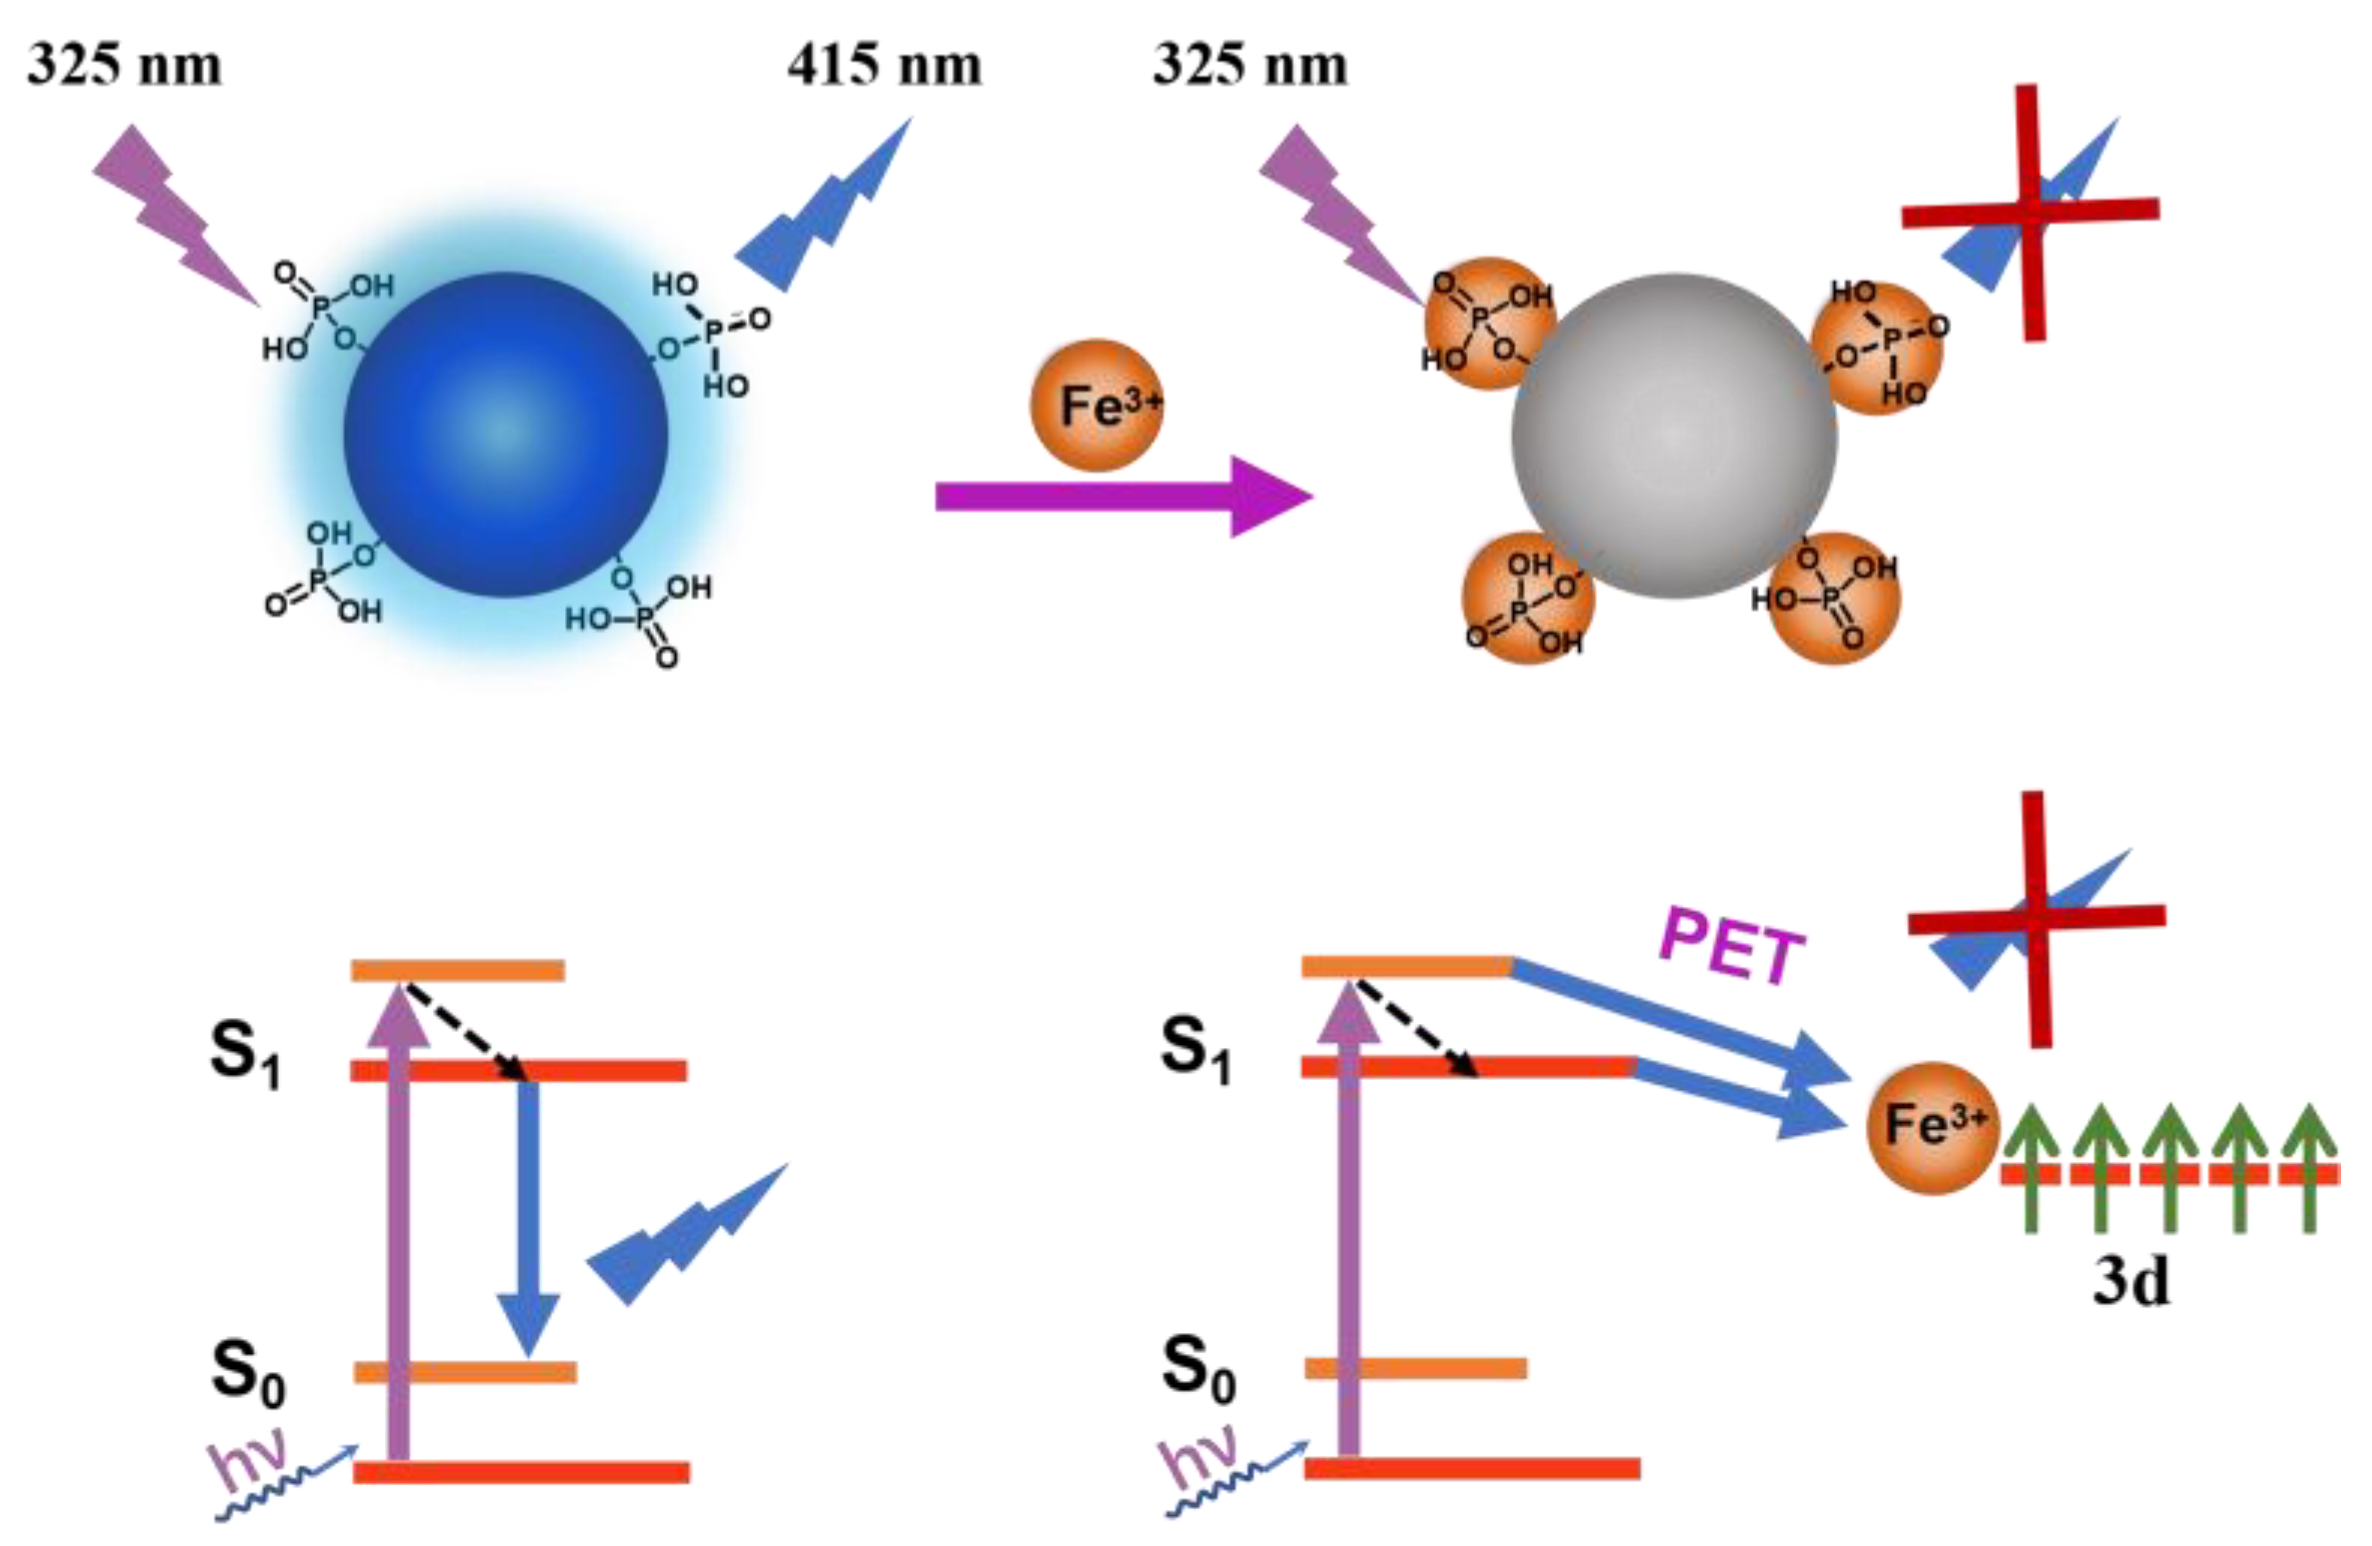
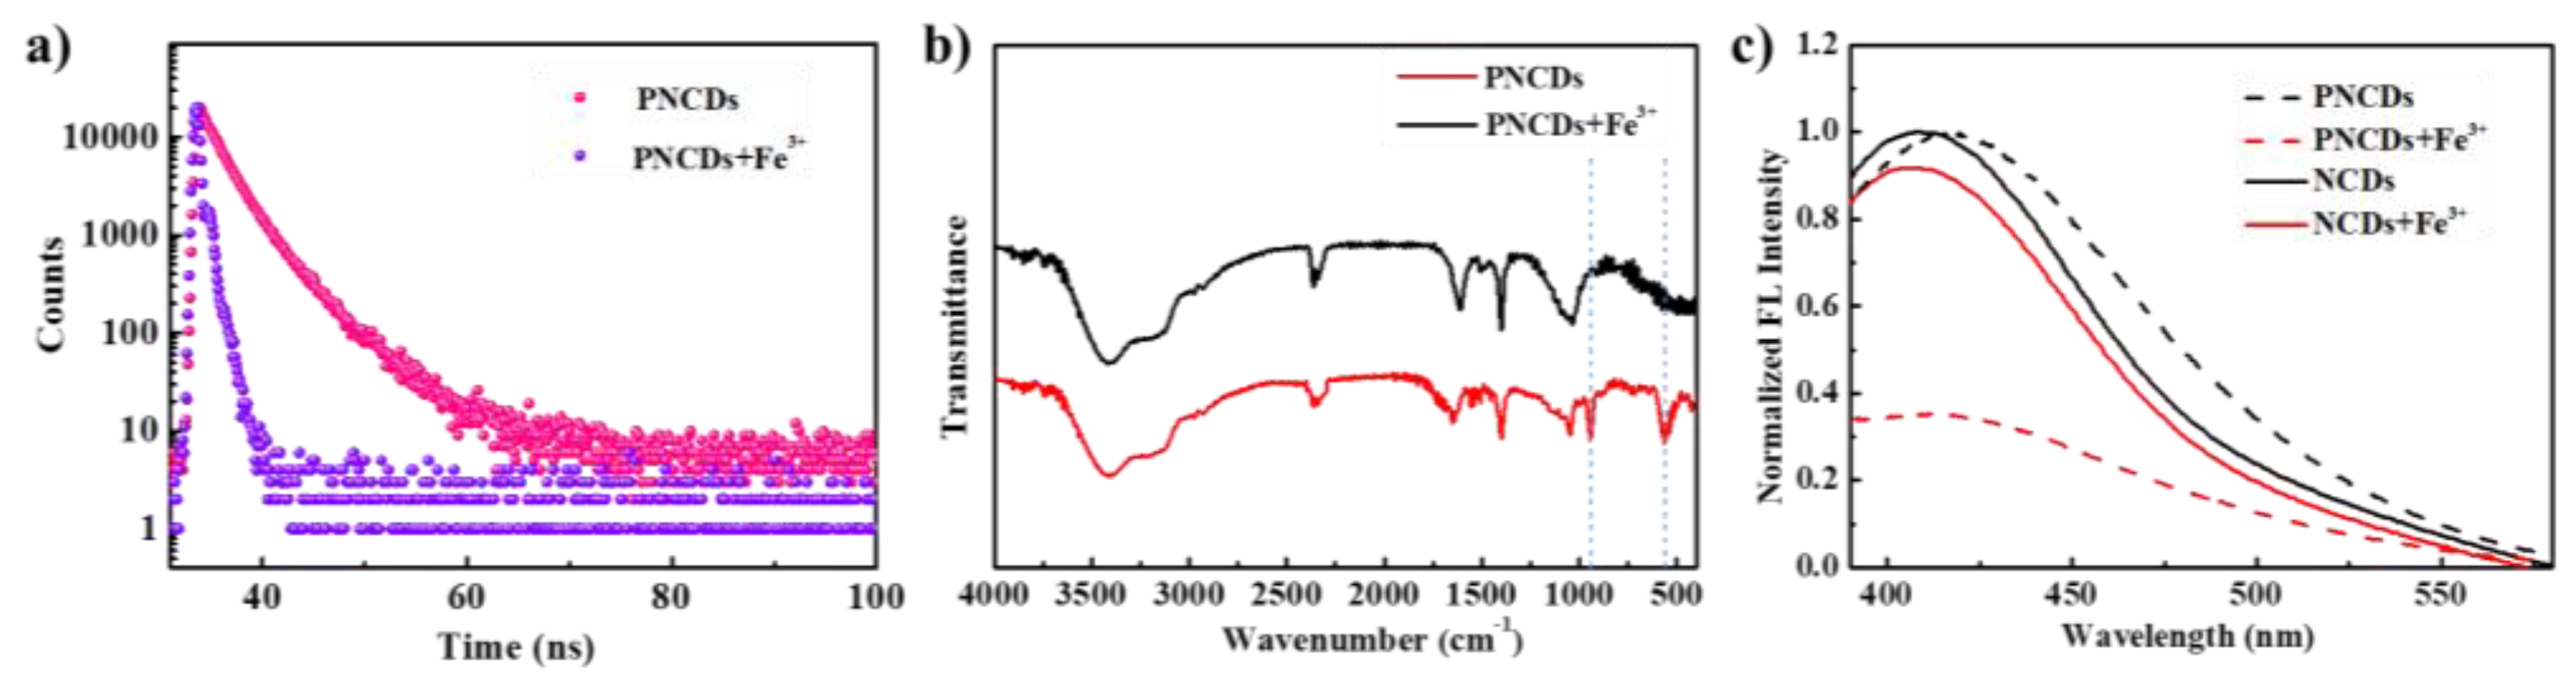
3.4. Quenching Mechanism of PNCDs by Fe3+

It is well known that most transition metals are apt to form complexes owing to the existence of empty d orbitals. Fe3+ possesses special 3d orbits with an electron-half-filled state and can coordinate with the phosphorus groups of PNCDs to form PNCD–Fe3+ complexes. Compared with other ions, the electron transferred from the excited state of PNCDs to the semi-filled 3d orbitals of Fe3+ is easier, promoting the recombination of nonradiative electron holes and resulting in fluorescence quenching, as illustrated in Figure 4. Moreover, the high selectivity of PNCDs towards Fe3+ sensing may also be related to the higher thermodynamic affinity of Fe3+ and the faster coordination process [51]. After the chelation sites of PNCDs are occupied by Fe3+, other metal ions, including Fe2+, are not easy to combine with PNCDs, thus contributing to the favorable detection selectivity to Fe3+. To comprehend the PL quenching process, the fluorescence lifetimes of PNCDs with/without Fe3+ were determined (Figure 5a). The average lifetime of PNCDs was 5.07 ns, which decreased to 2.52 ns when adding Fe3+. It was indicated that a photoinduced process of electron transfer occurs between PNCDs and Fe3+ [52].
Figure 5b illustrates the FT-IR spectra of PNCDs before and after reaction with Fe3+. The bands at 562 and 1057 cm−1, respectively, correspond to the P–O and P=O of PNCD and disappear after the addition of Fe3+ due to the formation of Fe–O–P. In order to further verify the contribution of P doping to Fe3+ sensing, the fluorescence response of ethylenediamine-derived CDs (N-CDs) to Fe3+ was also recorded (Figure 5c). Compared to PNCDs, only slight quenching of the PL intensity was observed for NCDs after adding Fe3+, which demonstrated that the sensitive response of PNCDs towards Fe3+ indeed correlated closely with the doping of P in PNCDs.

3.5. Determination of Fe3+ Contents in Human Serum and SH-SY5Y Cells

The practicability of the sensitive fluorescence quench response of PNCDs was verified by determining the Fe3+ contents in serum and SH-SY5Y cells samples, and the determination accuracy was assessed based on the standard addition method. As depicted in Table 1, the determined values of Fe3+ in human serum using PNCDs as fluorescence probes were in good accordance with the normal range of Fe3+ levels [50], and the determined Fe3+ content in SH-SY5Y cell lysate agreed well with the reported value [53]. The recoveries of Fe3+ were in the range of 90.27–113.23%, demonstrating the reliability of the as-prepared PNCDs for application in determining the Fe3+ contents in biological samples.

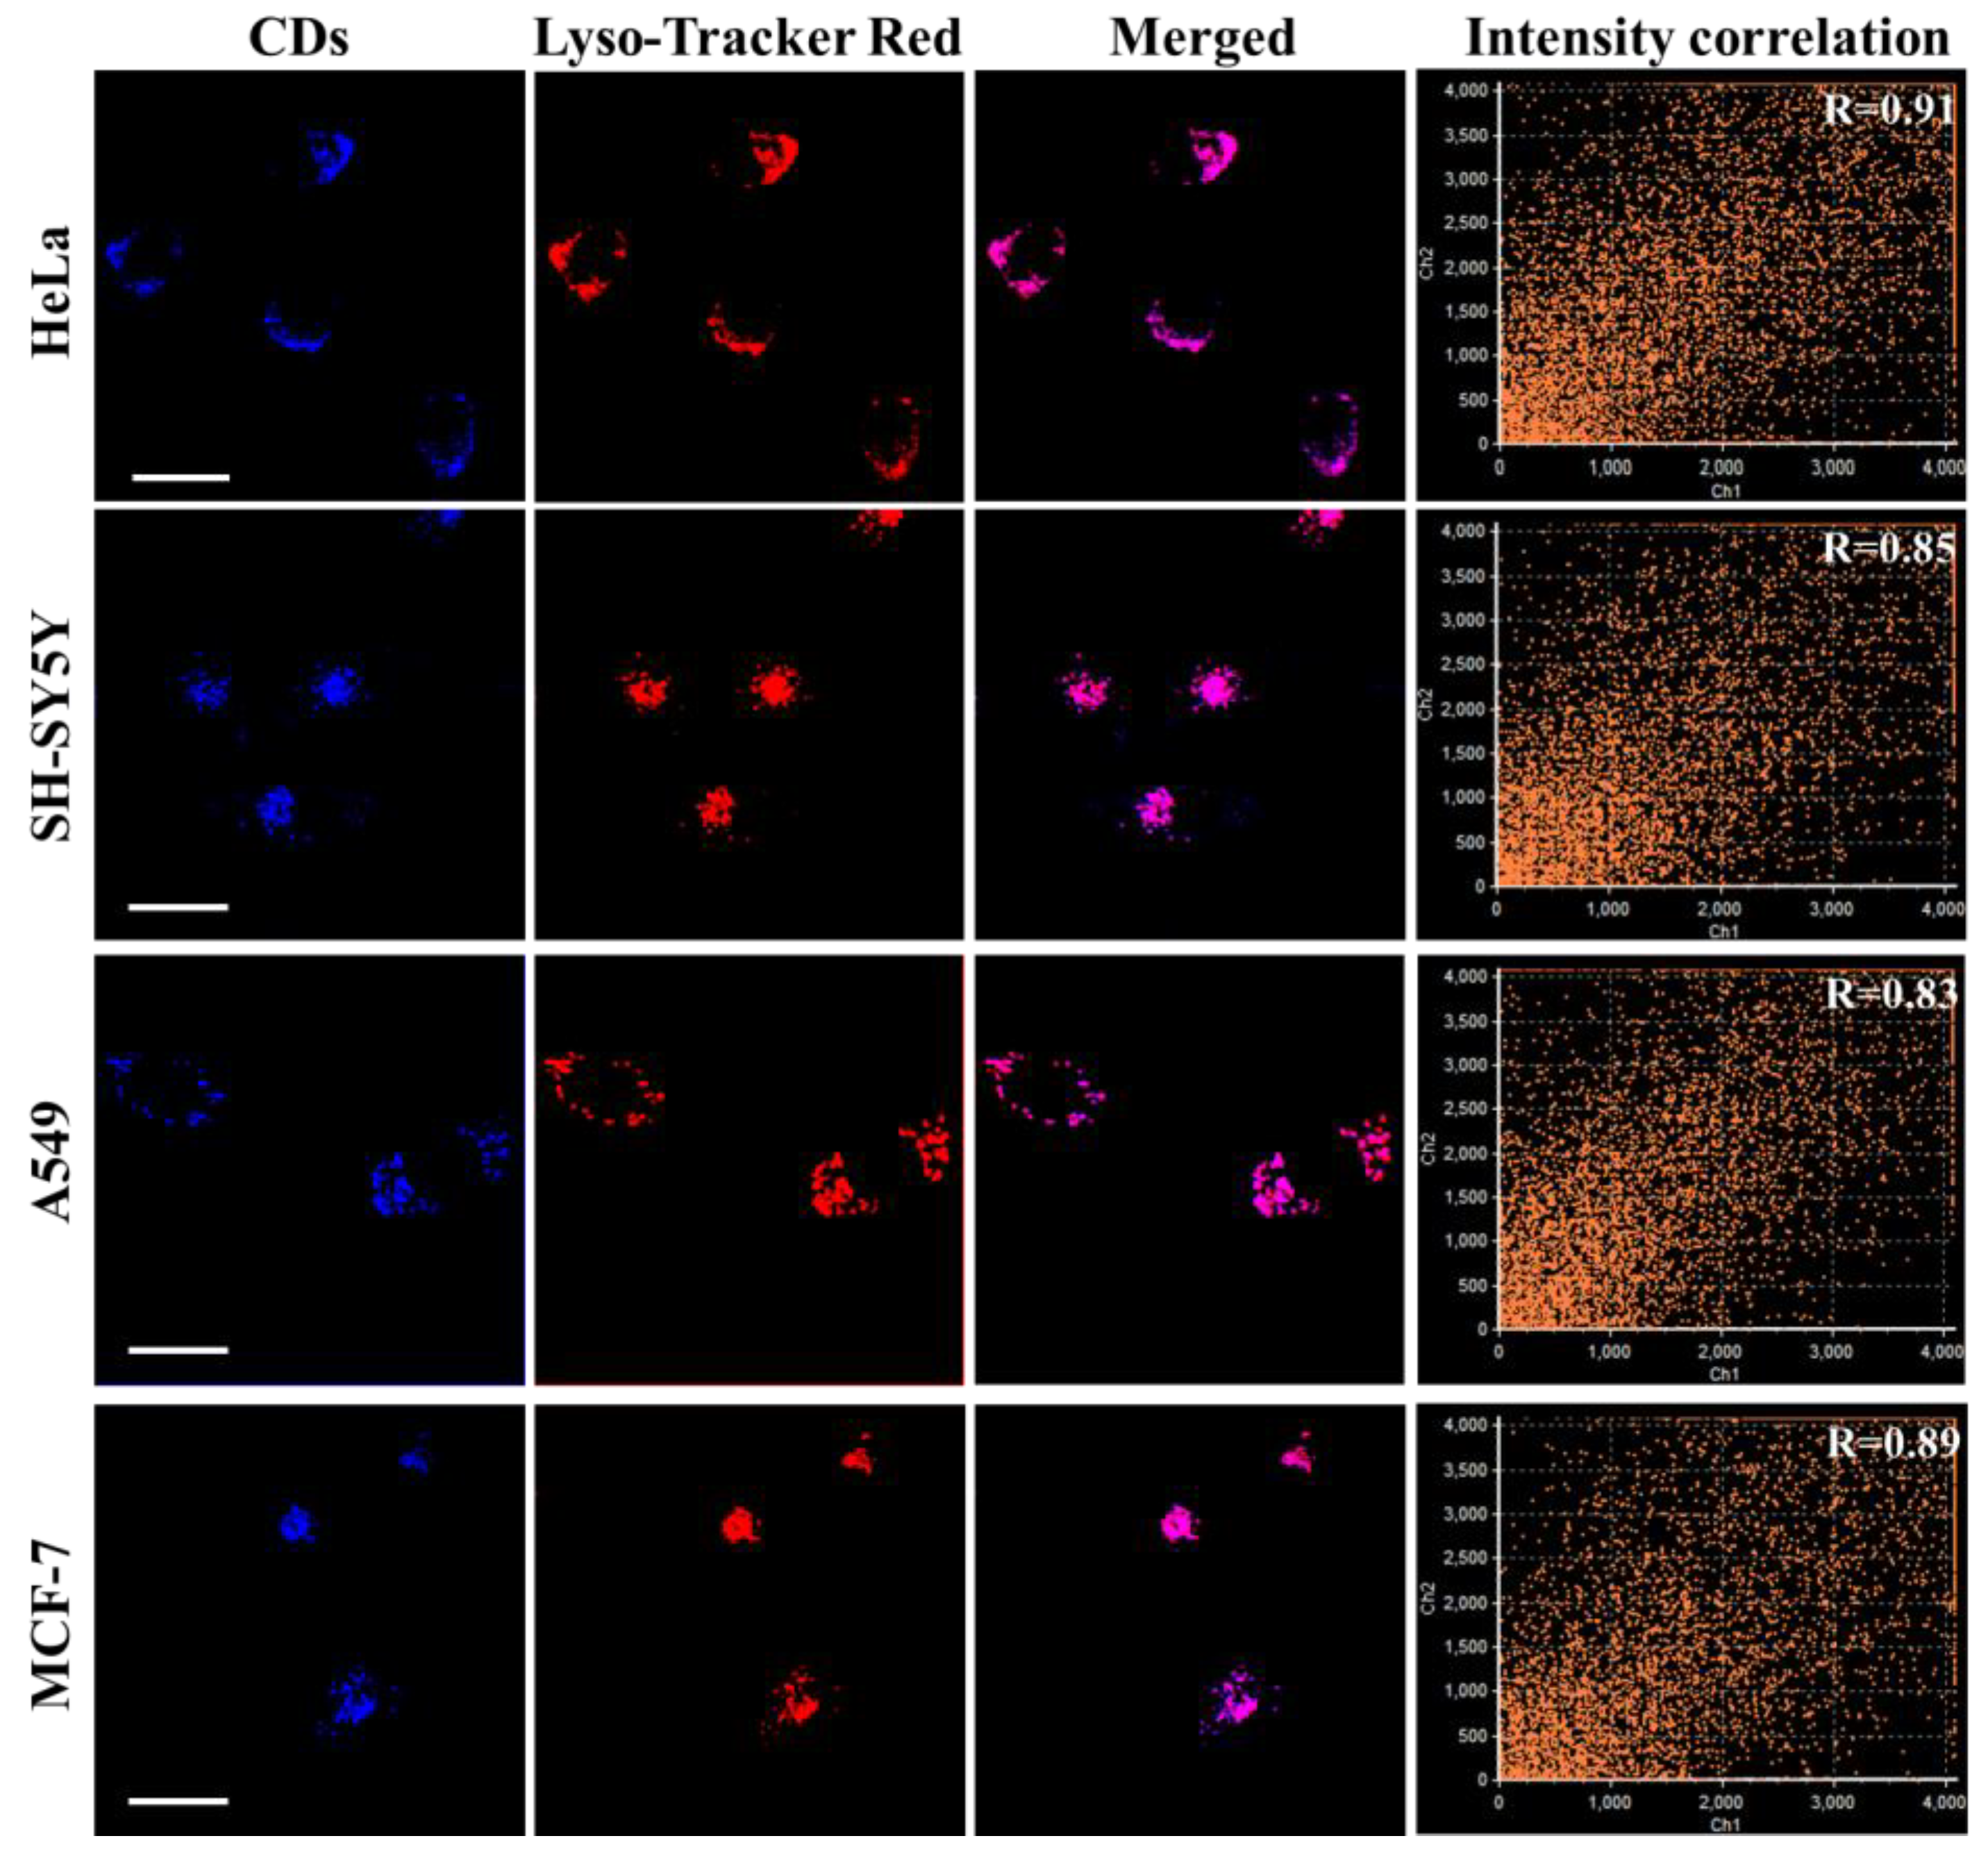
3.6. Intracellular Localization of PNCDs

Favorable biocompatibility is crucial in guaranteeing the application of spectral probes in cell imaging [54]. As illustrated in Figure S5, 84% of cells remained alive when the PNCD concentration was 400 μg mL−1, indicating the remarkable biocompatibility of PNCDs.
The distributions of PNCD were investigated in different cell lines, including HeLa, SH-SY5Y, A549, and MCF-7 cells. As can be seen in Figure 6, the blue CLSM images of PNCDs overlapped well with the red CLSM images of Lyso-Tracker Red, and the Pearson’s correlation coefficients were 0.91, 0.85, 0.83, and 0.89, respectively. The results clearly indicate that the PNCDs predominantly localized to lysosomes. The excellent co-localization results indicate that the PNCDs exhibit high lysosomal location specificity and can achieve universal lysosomal staining, regardless of the cell type. On the contrary, the co-localization regions of PNCDs with ER-Tracker Red and Mito-Tracker Deep Red were significantly different (Figure S6), with low Pearson’s correlation coefficients of 0.31 and 0.63, respectively. The lysosome targeting ability was attributed to the abundance of lipophilic amino groups [55,56], which enable PNCDs to access the cells and accumulate in intracellular acidic regions due to their acidophilic effect [2,57,58]. Lysosomes are acidic organelles that can provide protons, and the protonation of the amino groups of PNCDs takes place under acidic conditions, leading to the localization of PNCDs around lysosomes following internalization [40].
Figure 7 illustrates the photostability of PNCDs in cell imaging. It can be seen that the fluorescence of PNCDs remained unchanged within 60 min, while obvious fading of Lyso-Tracker Red fluorescence was observed at imaging times longer than 20 min. The excellent anti-photobleaching property of PNCDs makes them promising probes for the long-term monitoring and tracking of lysosomes.

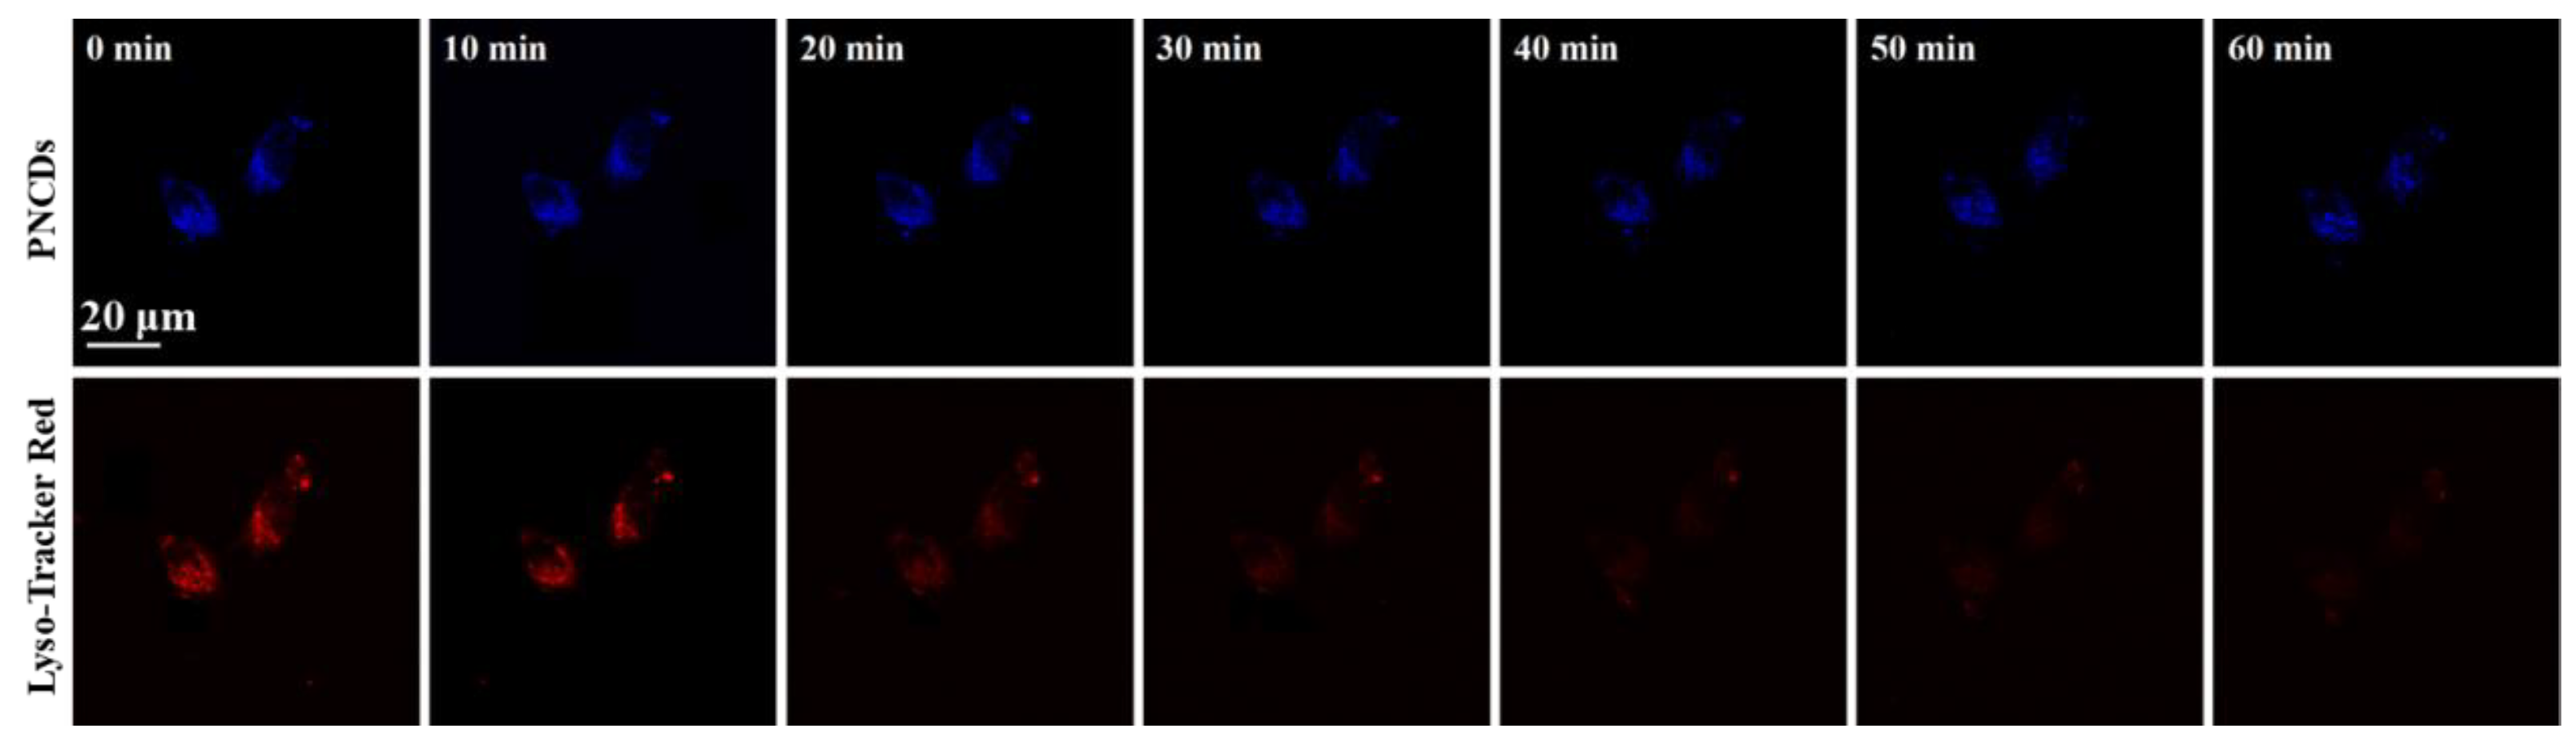
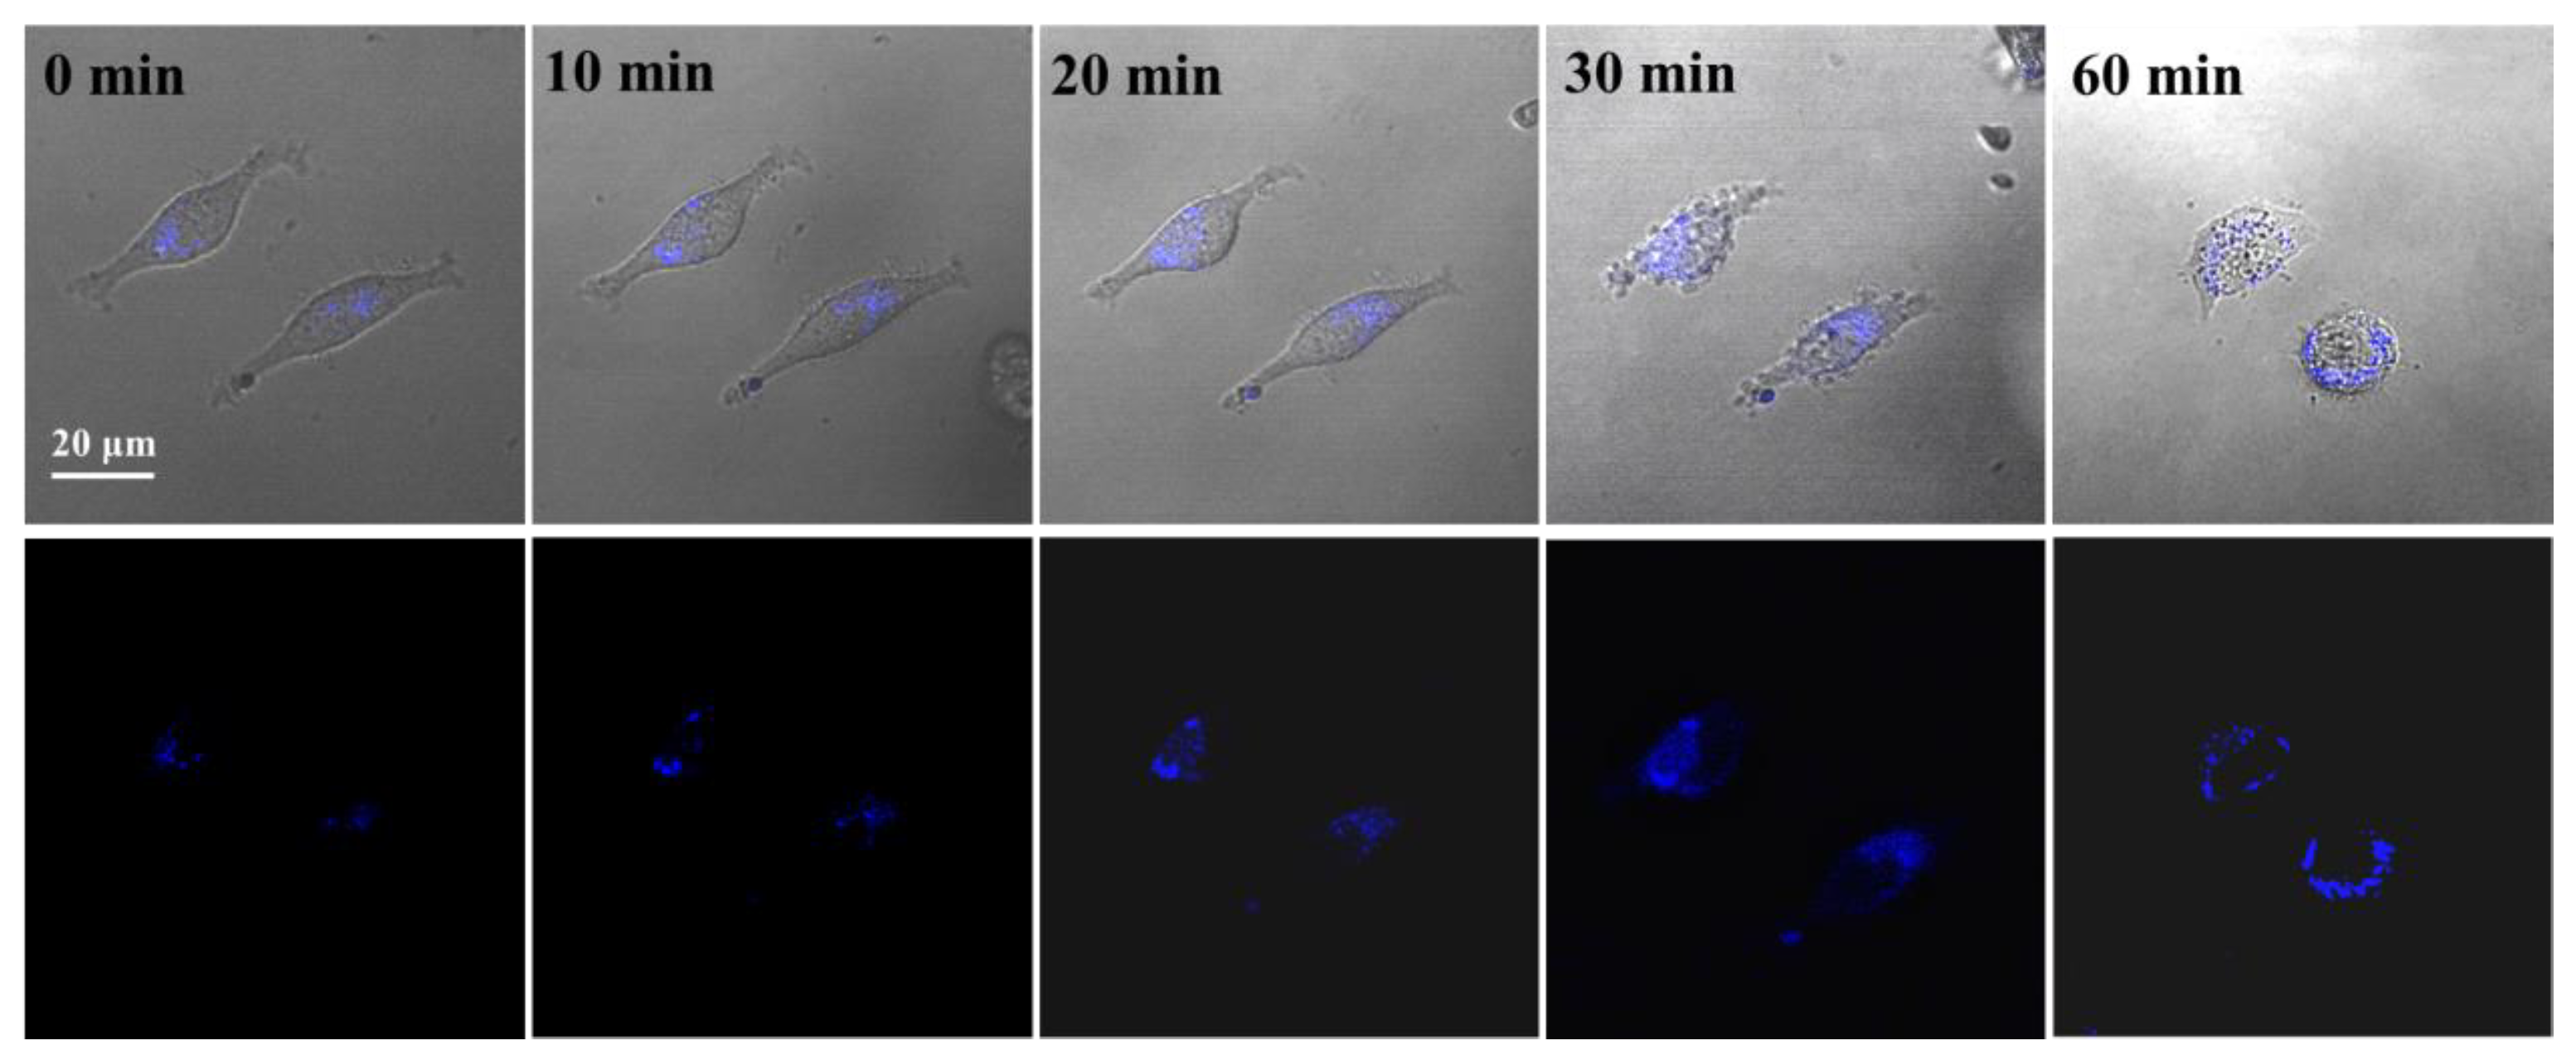
3.7. Lysosomal Tracking in Cells with PNCDs

It has been reported that apoptosis can affect the function of lysosomes, and the increase in total lysosome volume is a common feature of apoptotic processes [59,60]. Dexamethasone is an anti-inflammatory agent that can induce cellular apoptosis due to proton leakage [35]. Figure 8 shows the results from the imaging of HeLa cells after a dexamethasone treatment. It can be clearly observed that the cell shape changed from spindle (in normal healthy cells) to circle (in affected cells). Meanwhile, the fluorescence images indicate that the volumes of lysosomes were significantly enlarged to the point of rupture during the cellular apoptotic death process, which was accompanied by changes in fluorescence intensity and location. The successful real-time tracking of lysosome morphology in HeLa cells sufficiently demonstrated the great potential of the as-prepared PNCDs for application as powerful probes in cytology.

4. Conclusions

In summary, fluorescent P and N co-doped CDs were facilely fabricated by a hydrothermal treatment of phytic acid and ethylenediamine. The introduced phosphorus groups resulted in the production of sensitive probes for selective Fe3+ sensing in serum samples. The formed lipophilic amino groups offer favorable lysosome location specificity, and the excellent photo-/pH stability means the prepared PNCDs are suitable for long-term lysosomal tracking in living cells, which might provide useful information regarding lysosome-related diseases and in-clinic diagnosis. The method for the fabrication of the proposed CDs represents not only a means for providing efficient probes for sensing/imaging but also a practical strategy for regulating the physicochemical features and optical properties of CDs through the rational selection of precursors for multifunctional applications.

Supplementary Materials

The following supporting information can be downloaded at https://www.mdpi.com/article/10.3390/bios13020230/s1. Figure S1: (a) TEM image, (b) XRD pattern, (c) FT-IR spectrum, (d) XPS spectrum (e) UV–vis absorption, and (f) fluorescence spectra of NCDs; Figure S2: XRD pattern of PNCDs; Figure S3: CIE 1931 coordinates of PNCDs (black dot); Figure S4: Normalized PL intensity of PNCDs before and after adding Fe3+ at 415 nm under different pH conditions; Figure S5: Cytotoxicity of PNCDs; Figure S6: Fluorescence images of HeLa cells co-cultured with PNCDs and other organelle probes (ER-Tracker Red and Mito-Tracker Deep Red); Table S1: Summary of the preparation and applications of N and P co-doped CDs; Table S2: Quantum yields of PNCDs with different phytic acid/ethylenediamine mole ratios; Table S3: Performance of CD-based fluorescence probes in Fe3+ sensing [52,61,62,63,64,65,66,67,68,69,70,71,72,73,74,75].

Author Contributions

Conceptualization, Y.X.; validation, Y.X. and M.Y.; data curation, Y.X. and M.Y.; investigation, Y.X.; writing—original draft preparation, Y.X.; writing—review and editing, X.C.; supervision, X.C.; project administration, X.C. All authors have read and agreed to the published version of the manuscript.

Funding

This research was funded by the LiaoNing Science and Technology Development Foundation Guided by Central Government (2022JH6/100100024).

Institutional Review Board Statement

Not applicable.

Informed Consent Statement

Not applicable.

Data Availability Statement

The data presented in this work are available in the article.

Conflicts of Interest

The authors declare no conflict of interest.

References

  1. Han, J.Y.; Burgess, K. Fluorescent indicators for intracellular pH. Chem. Rev. 2010, 110, 2709–2728. [Google Scholar] [CrossRef] [PubMed]
  2. Xu, W.; Zeng, Z.B.; Jiang, J.H.; Chang, Y.T.; Yuan, L. Discerning the chemistry in individual organelles with small-molecule fluorescent probes. Angew. Chem. Int. Ed. 2016, 55, 13658–13699. [Google Scholar] [CrossRef]
  3. Saftig, P.; Klumperman, J. Lysosome biogenesis and lysosomal membrane proteins: Trafficking meets function. Nat. Rev. Mol. Cell Biol. 2009, 10, 623–635. [Google Scholar] [CrossRef] [PubMed]
  4. Luzio, J.P.; Pryor, P.R.; Bright, N.A. Lysosomes: Fusion and function. Nat. Rev. Mol. Cell Biol. 2007, 8, 622–632. [Google Scholar] [CrossRef]
  5. Mohamed, M.M.; Sloane, B.F. Near-infrared optical imaging of proteases in cancer. Nat. Rev. Cancer 2006, 6, 764–775. [Google Scholar] [CrossRef]
  6. Cai, Y.J.; Gui, C.; Samedov, K.; Su, H.F.; Gu, X.G.; Li, S.W.; Luo, W.W.; Sung, H.H.Y.; Lam, J.W.Y.; Kwok, R.T.K.; et al. An acidic pH independent piperazine-TPE AIEgen as a unique bioprobe for lysosome tracing. Chem. Sci. 2017, 8, 7593–7603. [Google Scholar] [CrossRef]
  7. Soreghan, B.; Thomas, S.N.; Yang, A.J. Aberrant sphingomyelin/ceramide metabolic-induced neuronal endosomal/lysosomal dysfunction: Potential pathological consequences in age-related neurodegeneration. Adv. Drug Deliv. Rev. 2003, 55, 1515–1524. [Google Scholar] [CrossRef]
  8. Ge, W.; Li, D.X.; Gao, Y.P.; Cao, X.T. The roles of lysosomes in inflammation and autoimmune diseases. Int. Rev. Immunol. 2015, 34, 415–431. [Google Scholar] [CrossRef]
  9. Platt, F.M. Sphingolipid lysosomal storage disorders. Nature 2014, 510, 68–75. [Google Scholar] [CrossRef]
  10. Wan, Q.Q.; Chen, S.M.; Shi, W.; Li, L.H.; Ma, H.M. Lysosomal pH rise during heat shock monitored by a lysosom-targeting near-infrared ratiometric fluorescent probe. Angew. Chem. 2014, 126, 11096–11100. [Google Scholar] [CrossRef]
  11. Moore, M.N. Cytochemical demonstration of latency of lysosomal hydrolases in digestive cells of the common mussel, Mytilus edulis, and changes induced by thermal stress. Cell Tissue Res. 1976, 175, 279–287. [Google Scholar] [CrossRef] [PubMed]
  12. Lekube, X.; Cajaraville, M.P.; Marigómez, I. Use of polyclonal antibodies for the detection of changes induced by cadmium in lysosomes of aquatic organisms. Sci. Total Environ. 2000, 247, 201–212. [Google Scholar] [CrossRef] [PubMed]
  13. Koukouzika, N.; Dimitriadis, V.K. Multiple biomarker comparison in Mytilus galloprovincialis from the Greece coast: “lysosomal membrane stability, neutral red retention, micronucleus frequency and stress on stress”. Ecotoxicology 2005, 14, 449–463. [Google Scholar] [CrossRef] [PubMed]
  14. Fan, J.L.; Dong, H.J.; Hu, M.M.; Wang, J.Y.; Zhang, H.; Zhu, H.; Sun, W.; Peng, X.J. Fluorescence imaging lysosomal changes during cell division and apoptosis observed using Nile Blue based near-infrared emission. Chem. Commun. 2013, 50, 882–884. [Google Scholar] [CrossRef]
  15. Wu, J.S.; Liu, W.M.; Ge, J.C.; Zhang, H.Y.; Wang, P.F. New sensing mechanisms for design of fluorescent chemosensors emerging in recent years. Chem. Soc. Rev. 2011, 40, 3483–3495. [Google Scholar] [CrossRef]
  16. Proos, V.N.; Lundberg, M. Protein effects in non-heme iron enzyme catalysis: Insights from multiscale models. J. Biol. Inorg. Chem. 2016, 21, 645–657. [Google Scholar] [CrossRef]
  17. Korolnek, T.; Hamza, I. Macrophages and iron trafficking at the birth and death of red cells. Blood J. Am. Soc. Hematol. 2015, 125, 2893–2897. [Google Scholar] [CrossRef]
  18. Wang, X.; Li, R.Y.; Fan, S.Y.; Li, Z.J.; Wang, G.L.; Gu, Z.G.; Liu, J.K. D-penicillamine-functionalized graphene quantum dots for fluorescent detection of Fe3+ in iron supplement oral liquids. Sens. Actuators B 2017, 243, 211–220. [Google Scholar] [CrossRef]
  19. Li, G.C.; Tang, J.; Ding, P.G.; Ye, Y. A rhodamine-benzimidazole based chemosensor for Fe3+ and its application in living cells. J. Fluoresc. 2016, 26, 155–161. [Google Scholar] [CrossRef]
  20. Torti, S.V.; Torti, F.M. Iron and cancer: More ore to be mined. Nat. Rev. Cancer 2013, 13, 342–355. [Google Scholar] [CrossRef] [Green Version]
  21. Zhang, S.W.; Li, J.X.; Zeng, M.Y.; Xu, J.Z.; Wang, X.K.; Hu, W.P. Polymer nanodots of graphitic carbon nitride as effective fluorescent probes for the detection of Fe3+ and Cu2+ ions. Nanoscale 2014, 6, 4157–4162. [Google Scholar] [CrossRef]
  22. Li, S.H.; Li, Y.C.; Cao, J.; Zhu, J.; Fan, L.Z.; Li, X.H. Sulfur-doped graphene quantum dots as a novel fluorescent probe for highly selective and sensitive detection of Fe3+. Anal. Chem. 2014, 86, 10201–10207. [Google Scholar] [CrossRef] [PubMed]
  23. Siahcheshm, P.; Heiden, P. High quantum yield carbon quantum dots as selective fluorescent turn-off probes for dual detection of Fe2+/Fe3+ ions. J. Photochem. Photobiol. A 2023, 435, 114284. [Google Scholar] [CrossRef]
  24. Iqbal, A.; Tian, Y.J.; Wang, X.D.; Gong, D.Y.; Guo, Y.L.; Iqbal, K.; Wang, Z.P.; Liu, W.S.; Qin, W.W. Carbon dots prepared by solid state method via citric acid and 1, 10-phenanthroline for selective and sensing detection of Fe2+ and Fe3+. Sens. Actuators B 2016, 237, 408–415. [Google Scholar] [CrossRef]
  25. Pallavolu, M.R.; Kumar, Y.A.; Mani, G.; Nallapureddy, R.R.; Parvathala, A.; Albaqami, M.D.; Karamic, A.M.; Joo, S.W. A novel hybridized needle-like Co3O4/N-CNO composite for superior energy storage asymmetric supercapacitors. J. Alloys Compd. 2022, 908, 164447. [Google Scholar] [CrossRef]
  26. Hu, Q.; Wujcik, E.K.; Kelarakis, A.; Cyriac, J.; Gong, X.J. Carbon-based nanomaterials as novel nanosensors. J. Nanomater. 2017, 1, 323–347. [Google Scholar] [CrossRef]
  27. Rajaji, U.; Govindasamy, M.; Sha, R.; Alshgari, R.A.; Juang, R.S.; Liu, T.Y. Surface engineering of 3D spinel Zn3V2O8 wrapped on sulfur doped graphitic nitride composites: Investigation on the dual role of electrocatalyst for simultaneous detection of antibiotic drugs in biological fluids. Compos. Part B 2022, 242, 110017. [Google Scholar] [CrossRef]
  28. Liu, H.Y.; Sun, Y.Q.; Yang, J.; Hu, Y.L.; Yang, R.; Li, Z.H.; Qu, L.B.; Lin, Y.H. High performance fluorescence biosensing of cysteine in human serum with superior specificity based on carbon dots and cobalt-derived recognition. Sens. Actuators B 2019, 28, 62–68. [Google Scholar] [CrossRef]
  29. Shi, X.X.; Meng, H.M.; Sun, Y.Q.; Qu, L.B.; Lin, Y.H.; Li, Z.H. Du, D. Far-red to near-infrared carbon dots: Preparation and applications in biotechnology. Small 2019, 15, 1901507. [Google Scholar] [CrossRef]
  30. Li, T.Z.; Wang, J.H.; Chen, X.W. Regulating the properties of carbon dots via a solvent-involved molecule fusion strategy for improved sensing selectivity. Anal. Chim. Acta 2019, 1088, 107–115. [Google Scholar] [CrossRef]
  31. Baker, S.N.; Baker, G.A. Luminescent carbon nanodots: Emergent nanolights. Angew. Chem. Int. Ed. 2010, 49, 6726–6744. [Google Scholar] [CrossRef]
  32. Xu, D.; Lin, Q.L.; Chang, H.T. Recent advances and sensing applications of carbon dots. Small Methods 2020, 4, 1900387. [Google Scholar] [CrossRef]
  33. Li, R.Y.; Li, Z.J.; Sun, X.L.; Ji, J.; Liu, L.; Gu, Z.G.; Wang, G.L. Graphene quantum dot-rare earth upconversion nanocages with extremely high efficiency of upconversion luminescence, stability and drug loading towards controlled delivery and cancer theranostics. Chem. Eng. J. 2020, 382, 122992. [Google Scholar] [CrossRef]
  34. Zhai, Y.C.; Wang, Y.; Li, D.; Zhou, D.; Jing, P.T.; Shen, D.Z.; Qu, S.N. Red carbon dots-based phosphors for white light-emitting diodes with color rendering index of 92. J. Colloid Interface Sci. 2018, 528, 281–288. [Google Scholar] [CrossRef] [PubMed]
  35. Li, H.; Guo, S.J.; Li, C.X.; Huang, H.; Liu, Y.; Kang, Z.H. Tuning laccase catalytic activity with phosphate functionalized carbon dots by visible light. ACS Appl. Mater. Interfaces 2015, 7, 10004–10012. [Google Scholar] [CrossRef]
  36. Zheng, A.Q.; Guo, T.T.; Guan, F.L.; Chen, X.W.; Shu, Y.; Wang, J.H. Ionic liquid mediated carbon dots: Preparations, properties and applications. Trends Anal. Chem. 2019, 119, 115638. [Google Scholar] [CrossRef]
  37. Wang, F.T.; Wang, L.N.; Xu, J.; Huang, K.J.; Wu, X. Synthesis and modification of carbon dots for advanced biosensing application. Analyst 2021, 146, 4418–4435. [Google Scholar] [CrossRef] [PubMed]
  38. Kou, X.L.; Jiang, S.C.; Park, S.J.; Meng, L.Y. A review: Recent advances in preparations and applications of heteroatom-doped carbon quantum dots. Dalton Trans. 2020, 49, 6915–6938. [Google Scholar] [CrossRef] [PubMed]
  39. Wu, L.L.; Li, X.L.; Ling, Y.F.; Huang, C.; Jia, N.Q. Morpholine derivative-functionalized carbon dots-based fluorescent probe for highly selective lysosomal imaging in living cells. ACS Appl. Mater. Interfaces 2017, 9, 28222–28232. [Google Scholar] [CrossRef]
  40. Mao, Q.X.; Yuan, X.L.; Kong, X.L.; Chen, X.W.; Wang, J.H. Targeted imaging of the lysosome and endoplasmic reticulum and their pH monitoring with surface regulated carbon dots. Nanoscale 2018, 10, 12788–12796. [Google Scholar] [CrossRef]
  41. de Medeiros, T.V.; Manioudakis, J.; Noun, F.; Macairan, J.R.; Victoria, F.; Naccache, R. Microwave-assisted synthesis of carbon dots and their applications. J. Mater. Chem. C 2019, 7, 7175–7195. [Google Scholar] [CrossRef]
  42. Rais, A.; Rawat, K.; Prasad, T.; Bohidar, H.B. Boron-doped carbon quantum dots: A ‘turn-off’fluorescent probe for dopamine detection. Nanotechnology 2020, 32, 025501. [Google Scholar] [CrossRef] [PubMed]
  43. Lee, A.; Yun, S.; Kang, E.S.; Kim, J.W.; Park, J.H.; Choi, J.S. Effect of heteroatoms on the optical properties and enzymatic activity of N-doped carbon dots. RSC Adv. 2021, 11, 18776–18782. [Google Scholar] [CrossRef] [PubMed]
  44. Zhi, B.; Gallagher, M.J.; Frank, B.P.; Lyons, T.Y.; Qiu, T.A.; Da, J.; Mensch, A.C.; Hamers, R.J.; Rosenzweig, Z.; Fairbrother, D.H.; et al. Investigation of phosphorous doping effects on polymeric carbon dots: Fluorescence, photostability, and environmental impact. Carbon 2018, 129, 438–449. [Google Scholar] [CrossRef]
  45. Luo, K.; Wen, Y.M.; Kang, X.H. Halogen-Doped Carbon Dots: Synthesis, Application, and Prospects. Molecules 2022, 27, 4620. [Google Scholar] [CrossRef] [PubMed]
  46. Wang, C.J.; Wang, Y.B.; Shi, H.X.; Yan, Y.J.; Liu, E.Z.; Hu, X.Y.; Fan, J. A strong blue fluorescent nanoprobe for highly sensitive and selective detection of mercury (II) based on sulfur doped carbon quantum dots. Mater. Chem. Phys. 2019, 232, 145–151. [Google Scholar] [CrossRef]
  47. Li, Y.; Li, S.; Wang, Y.M.; Wang, J.; Liu, H.; Liu, X.Q.; Wang, L.F.; Liu, X.G.; Xue, W.D.; Ma, N. Electrochemical synthesis of phosphorus-doped graphene quantum dots for free radical scavenging. Phys. Chem. Chem. Phys. 2017, 19, 11631–11638. [Google Scholar] [CrossRef]
  48. Shangguan, J.F.; Huang, J.; He, D.G.; He, X.X.; Wang, K.M.; Ye, R.Z.; Yang, X.; Qing, T.P.; Tang, J.H. Highly Fe3+-selective fluorescent nanoprobe based on ultrabright N/P codoped carbon dots and its application in biological samples. Anal. Chem. 2017, 89, 7477–7484. [Google Scholar] [CrossRef]
  49. Sun, X.C.; Bruückner, C.; Lei, Y. One-pot and ultrafast synthesis of nitrogen and phosphorus co-doped carbon dots possessing bright dual wavelength fluorescence emission. Nanoscale 2015, 7, 17278–17282. [Google Scholar] [CrossRef]
  50. He, S.L.; Qi, S.W.; Sun, Z.C.; Zhu, G.S.; Zhang, K.; Chen, W.W. Si, N-codoped carbon dots: Preparation and application in iron overload diagnosis. J. Mater. Sci. 2019, 54, 4297–4305. [Google Scholar] [CrossRef]
  51. Xu, L.N.; Mao, W.; Huang, J.R.; Li, S.H.; Huang, K.; Li, M.; Xia, J.L.; Chen, Q. Economical, green route to highly fluorescence intensity carbon materials based on ligninsulfonate/graphene quantum dots composites: Application as excellent fluorescent sensing platform for detection of Fe3+ ions. Sens. Actuators B Chem. 2016, 230, 54–60. [Google Scholar] [CrossRef]
  52. Jadhav, R.W.; Khobrekar, P.P.; Bugde, S.T.; Bhosale, S.V. Nanoarchitectonics of neomycin-derived fluorescent carbon dots for selective detection of Fe3+ ions. Anal. Methods 2022, 14, 3289–3298. [Google Scholar] [CrossRef]
  53. Michalke, B.; Willkommen, D.; Venkataramani, V. Setup of capillary electrophoresis-inductively coupled plasma mass spectrometry (CE-ICP-MS) for quantification of iron redox species (Fe (II), Fe (III)). JoVE 2020, 159, e61055. [Google Scholar] [CrossRef]
  54. Zhang, X.F.; Wang, C.; Han, Z.; Xiao, Y. A photostable near-infrared fluorescent tracker with pH-independent specificity to lysosomes for long time and multicolor imaging. ACS Appl. Mater. Interfaces 2014, 6, 21669–21676. [Google Scholar] [CrossRef]
  55. Wu, L.L.; Li, X.L.; Huang, C.; Jia, N.Q. Dual-modal colorimetric/fluorescence molecular probe for ratiometric sensing of pH and its application. Anal. Chem. 2016, 88, 8332–8338. [Google Scholar] [CrossRef]
  56. Wu, L.L.; Wang, Y.; James, T.D.; Jia, N.Q.; Huang, C.S. A hemicyanine based ratiometric fluorescence probe for mapping lysosomal pH during heat stroke in living cells. Chem. Commun. 2018, 54, 5518–5521. [Google Scholar] [CrossRef]
  57. Zhou, X.F.; Su, F.Y.; Lu, H.G.; Senechal-Willis, P.; Tian, Y.Q.; Johnson, R.H.; Meldrum, D.R. An FRET-based ratiometric chemosensor for in vitro cellular fluorescence analyses of pH. Biomaterials 2012, 33, 171–180. [Google Scholar] [CrossRef]
  58. Wang, L.; Xiao, Y.; Tian, W.M.; Deng, L.Z. Activatable rotor for quantifying lysosomal viscosity in living cells. J. Am. Chem. Soc. 2013, 135, 2903–2906. [Google Scholar] [CrossRef] [PubMed]
  59. Qin, H.Y.; Sun, Y.Q.; Geng, X.; Zhao, K.R.; Meng, H.M.; Yang, R.; Qu, L.B.; Li, Z.H. A wash-free lysosome targeting carbon dots for ultrafast imaging and monitoring cell apoptosis status. J. Am. Chem. Soc. 2020, 1106, 207–215. [Google Scholar] [CrossRef] [PubMed]
  60. Ono, K.; Wang, X.; Han, J. Resistance to tumor necrosis factor-induced cell death mediated by PMCA4 deficiency. Mol. Cell. Biol. 2001, 21, 8276–8288. [Google Scholar] [CrossRef] [Green Version]
  61. Jiang, Y.J.; Lin, M.; Yang, T.; Li, R.S.; Huang, C.Z.; Wang, J.; Li, Y.F. Nitrogen and phosphorus doped polymer carbon dots as a sensitive cellular mapping probe of nitrite. J. Mater. Chem. B 2019, 7, 2074–2080. [Google Scholar] [CrossRef]
  62. Zhang, L.; Wang, H.P.; Hu, Q.; Guo, X.Q.; Li, L.; Shuang, S.M.; Gong, X.J.; Dong, C. Carbon quantum dots doped with phosphorus and nitrogen are a viable fluorescent nanoprobe for determination and cellular imaging of vitamin B12 and cobalt (II). Microchim. Acta 2019, 186, 506. [Google Scholar] [CrossRef] [PubMed]
  63. Zheng, M.; Ruan, S.B.; Liu, S.; Sun, T.T.; Qu, D.; Zhao, H.F.; Xie, Z.G.; Gao, H.L.; Jing, X.B.; Sun, Z.C. Self-targeting fluorescent carbon dots for diagnosis of brain cancer cells. ACS Nano 2015, 9, 11455–11461. [Google Scholar] [CrossRef]
  64. Omer, K.M. Highly passivated phosphorous and nitrogen co-doped carbon quantum dots and fluorometric assay for detection of copper ions. Anal. Bioanal. Chem. 2018, 410, 6331–6336. [Google Scholar] [CrossRef]
  65. Tammina, S.K.; Yang, D.; Koppala, S.; Cheng, C.; Yang, Y. Highly photoluminescent N, P doped carbon quantum dots as a fluorescent sensor for the detection of dopamine and temperature. J. Photochem. Photobiol. B 2019, 194, 61–70. [Google Scholar] [CrossRef] [PubMed]
  66. Lin, L.P.; Wang, Y.H.; Xiao, Y.L.; Liu, W. Hydrothermal synthesis of carbon dots codoped with nitrogen and phosphorus as a turn-on fluorescent probe for cadmium (II). Microchim. Acta 2019, 186, 147. [Google Scholar] [CrossRef]
  67. Qie, X.W.; Zan, M.H.; Li, L.; Gui, P.; Chang, Z.M.; Ge, M.F.; Wang, R.S.; Guo, Z.Z.; Dong, W.F. High photoluminescence nitrogen, phosphorus co-doped carbon nanodots for assessment of microbial viability. Colloids Surf. B 2020, 191, 110987. [Google Scholar] [CrossRef]
  68. Pang, S.; Liu, S.Y. Dual-emission carbon dots for ratiometric detection of Fe3+ ions and acid phosphatase. Anal. Chim. Acta 2020, 1105, 155–161. [Google Scholar] [CrossRef]
  69. Zhao, Y.; Zhu, X.X.; Liu, L.; Duan, Z.Q.; Liu, Y.P.; Zhang, W.Y.; Cui, J.J.; Rong, Y.F.; Dong, C. One-step synthesis of nitrogen/fluorine co-doped carbon dots for use in ferric ions and ascorbic acid detection. Nanomaterials 2022, 12, 2377. [Google Scholar] [CrossRef] [PubMed]
  70. Feng, M.; Wang, Y.M.; He, B.; Chen, X.Y.; Sun, J. Chitin-based carbon dots with tunable photoluminescence for Fe3+ detection. ACS Appl. Nano Mater. 2022, 5, 7502–7511. [Google Scholar] [CrossRef]
  71. Ding, H.; Wei, J.S.; Xiong, H.M. Nitrogen and sulfur co-doped carbon dots with strong blue luminescence. Nanoscale 2014, 6, 13817–13823. [Google Scholar] [CrossRef] [PubMed]
  72. Ramanarayanan, R.; Swaminathan, S. Synthesis and characterisation of green luminescent carbon dots from guava leaf extract. Mater. Today Proc. 2020, 33, 2223–2227. [Google Scholar] [CrossRef]
  73. Zhu, J.T.; Chu, H.Y.; Wang, T.S.; Wang, C.Z.; Wei, Y.M. Fluorescent probe based nitrogen doped carbon quantum dots with solid-state fluorescence for the detection of Hg2+ and Fe3+ in aqueous solution. Microchem. J. 2020, 158, 105142. [Google Scholar] [CrossRef]
  74. Pu, Z.F.; Wen, Q.L.; Yang, Y.J.; Cui, X.M.; Ling, J.; Liu, P.; Cao, Q.E. Fluorescent carbon quantum dots synthesized using phenylalanine and citric acid for selective detection of Fe3+ ions. Spectrochim. Acta Part A 2020, 229, 117944. [Google Scholar] [CrossRef]
  75. Senol, A.M.; Bozkurt, E. Facile green and one-pot synthesis of seville orange derived carbon dots as a fluorescent sensor for Fe3+ ions. Microchem. J. 2020, 159, 105357. [Google Scholar] [CrossRef]
Scheme 1. Schematic diagram for preparing fluorescent P and N co-doped CDs (PNCDs).
Biosensors 13 00230 sch001
Figure 1. (a) Transmission electron microscopy (TEM) image, (b) Fourier transform infrared spectrum (FT-IR) (c) X-ray photoelectron spectroscopy (XPS) spectrum, high-resolution (d) C 1s, (e) N 1s, and (f) P 2p spectra of PNCDs.
Biosensors 13 00230 g001
Figure 2. (a) Ultraviolet-visible (UV–vis) absorption of PNCDs, Fluorescence spectra of PNCDs at various (b) excitation wavelengths, (c) pH values, and (d) ionic strengths and (e) during 60 min of continuous irradiation and (f) during 7 days of storage. λex = 325 nm.
Biosensors 13 00230 g002
Figure 3. (a) Fluorescence responses of PNCDs in the presence of Fe3+ at different concentrations (0–1000 μM); (b) Linear relationships between fluorescence changes ((F0 − F)/F0) and Fe3+ concentration; (c) Fluorescence responses of PNCDs towards different species (500 μM ions, 100 μM amino acids, and 5 × 10⁻⁴ mg mL−1 proteins).
Biosensors 13 00230 g003
Figure 4. The quenching mechanism of PNCDs by Fe3+.
Biosensors 13 00230 g004
Figure 5. (a) Fluorescence lifetime decay curves of PNCDs before and after adding Fe3+. (b) FT-IR spectra of PNCDs before and after adding Fe3+. (c) Fluorescence responses of NCDs and PNCDs toward the addition of Fe3+.
Biosensors 13 00230 g005
Figure 6. Co-localization images of PNCDs and Lyso-Tracker Red in HeLa, SH-SY5Y, A549, and MCF-7 cells.
Biosensors 13 00230 g006
Figure 7. Fluorescence images of HeLa cells after staining with PNCDs and Lyso-Tracker Red, with increasing scanning times.
Biosensors 13 00230 g007
Figure 8. Snapshots of lysosomes in HeLa cells undergoing apoptotic cell death.
Biosensors 13 00230 g008
Table 1. Determination of Fe3+ contents in human serum samples (n = 3).
SampleDetermined
(μM)
Added
(μM)
Found
(μM)
Recovery
(%)
RSD
(%, n = 11)
Serum 12.93 ± 0.2357.44 ± 0.1790.27 ± 1.701.31
Serum 23.22 ± 0.8658.88 ± 0.78113.23 ± 1.771.26
Serum 33.86 ± 0.0558.65 ± 0.0395.76 ± 0.470.94
Serum 44.04 ± 0.3959.58 ± 0.22110.33 ± 3.581.74
SH-SY5Y cells2.58 ± 0.2557.70 ± 0.31102.33 ± 6.071.42
Disclaimer/Publisher’s Note: The statements, opinions and data contained in all publications are solely those of the individual author(s) and contributor(s) and not of MDPI and/or the editor(s). MDPI and/or the editor(s) disclaim responsibility for any injury to people or property resulting from any ideas, methods, instructions or products referred to in the content.

