Abstract
In this work, a coumarin derivative, SWJT-14, was synthesized as a fluorescence probe to distinguish cysteine (Cys), homocysteine (Hcy) and glutathione (GSH) in aqueous solutions. The detection limit of Cys, Hcy and GSH for the probe was 0.02 μM, 0.42 μM and 0.92 μM, respectively, which was lower than biothiols in cells. The probe reacted with biothiols to generate different products with different conjugated structures. Additionally, it could distinguish Cys, Hcy and GSH using fluorescence and UV-Vis spectra. The detection mechanism was confirmed by MS. SWJT-14 was successfully used in cellular experiments and detected both endogenous and exogenous biothiols.
1. Introduction
The biothiols such as Cysteine (Cys), homocysteine (Hcy) and glutathione (GSH) are associated with many physiopathologies in living organisms. Cys helps maintain redox homeostasis and regulates intracellular and intercellular signaling [1,2,3,4,5], Hcy is a direct independent diagnostic factor for many diseases [6,7,8,9,10] and GSH plays an important role in preventing or reducing the effects of harmful ROS in cardiovascular disease [11]. Biothiols are involved in a variety of biometabolic processes in human beings, such as oxidative stress, protein modification, signal transduction, cell apoptosis and cell differentiation. Their abnormal levels are related to many chronic and degenerative diseases [12,13,14,15,16,17].
A variety of methods have been developed for the detection of biothiols [18,19,20,21], most of which have the disadvantages of being inconvenient, time-consuming and non-specific. Fluorescence detection technology based on fluorescence probes can take images of analytes in situ and has the advantages of simple operation and low cost; thus, it developed rapidly. In order to target the identification of Cys, Hcy and GSH, the general approach is to exploit the nucleophilic nature of biothiols. Therefore, some organic reactions have been used to design chemodosimeters as fluorescent probes, such as the cyclization of aldehydes [22,23], Michael addition [24,25], conjugate addition cyclization with acrylates [26,27], aromatic nucleophilic substitution–rearrangement reactions [28], cleavage of sulphonamides and sulphonates [29,30], as well as metal complexation [31,32] and dithiol breakage reactions [33,34]. However, most of the reported probes can only identify one biothiol or do not discriminate between the three biothiols. Thus, chemodosimeters with multisite recognition have been developed as fluorescence probes to discriminate biothiols [35,36,37,38,39,40] (Table S1, Supplementary Materials). Although these probes were good differentiators for the three biothiols, differentiating them in the high water phase remained a great challenge.
In connection with our continuing research on biothiols [41,42,43], herein we report a coumarin derivative as a fluorescence probe to distinguish three biothiols in an aqueous solution. Sodium 2-mercaptoethanesulfonate was introduced as a leaving group on coumarin, which can increase the aqueous solubility of the probe. It also synergistically provided multiple reaction sites with double bonds. The reaction of the probe with three biothiols could produce different products with different conjugated structures (Scheme 1), resulting in different UV-Vis changes and fluorescence changes at different excitation wavelengths for the purpose of the identification of the three biothiols. The reaction mechanism was confirmed by mass spectrometry and TD-DFT calculations. Furthermore, the probe could be used to image biothiols in HeLa cells.

Scheme 1.
Response of SWJT-14 to biothiols.
2. Synthesis of Probe SWJT-14
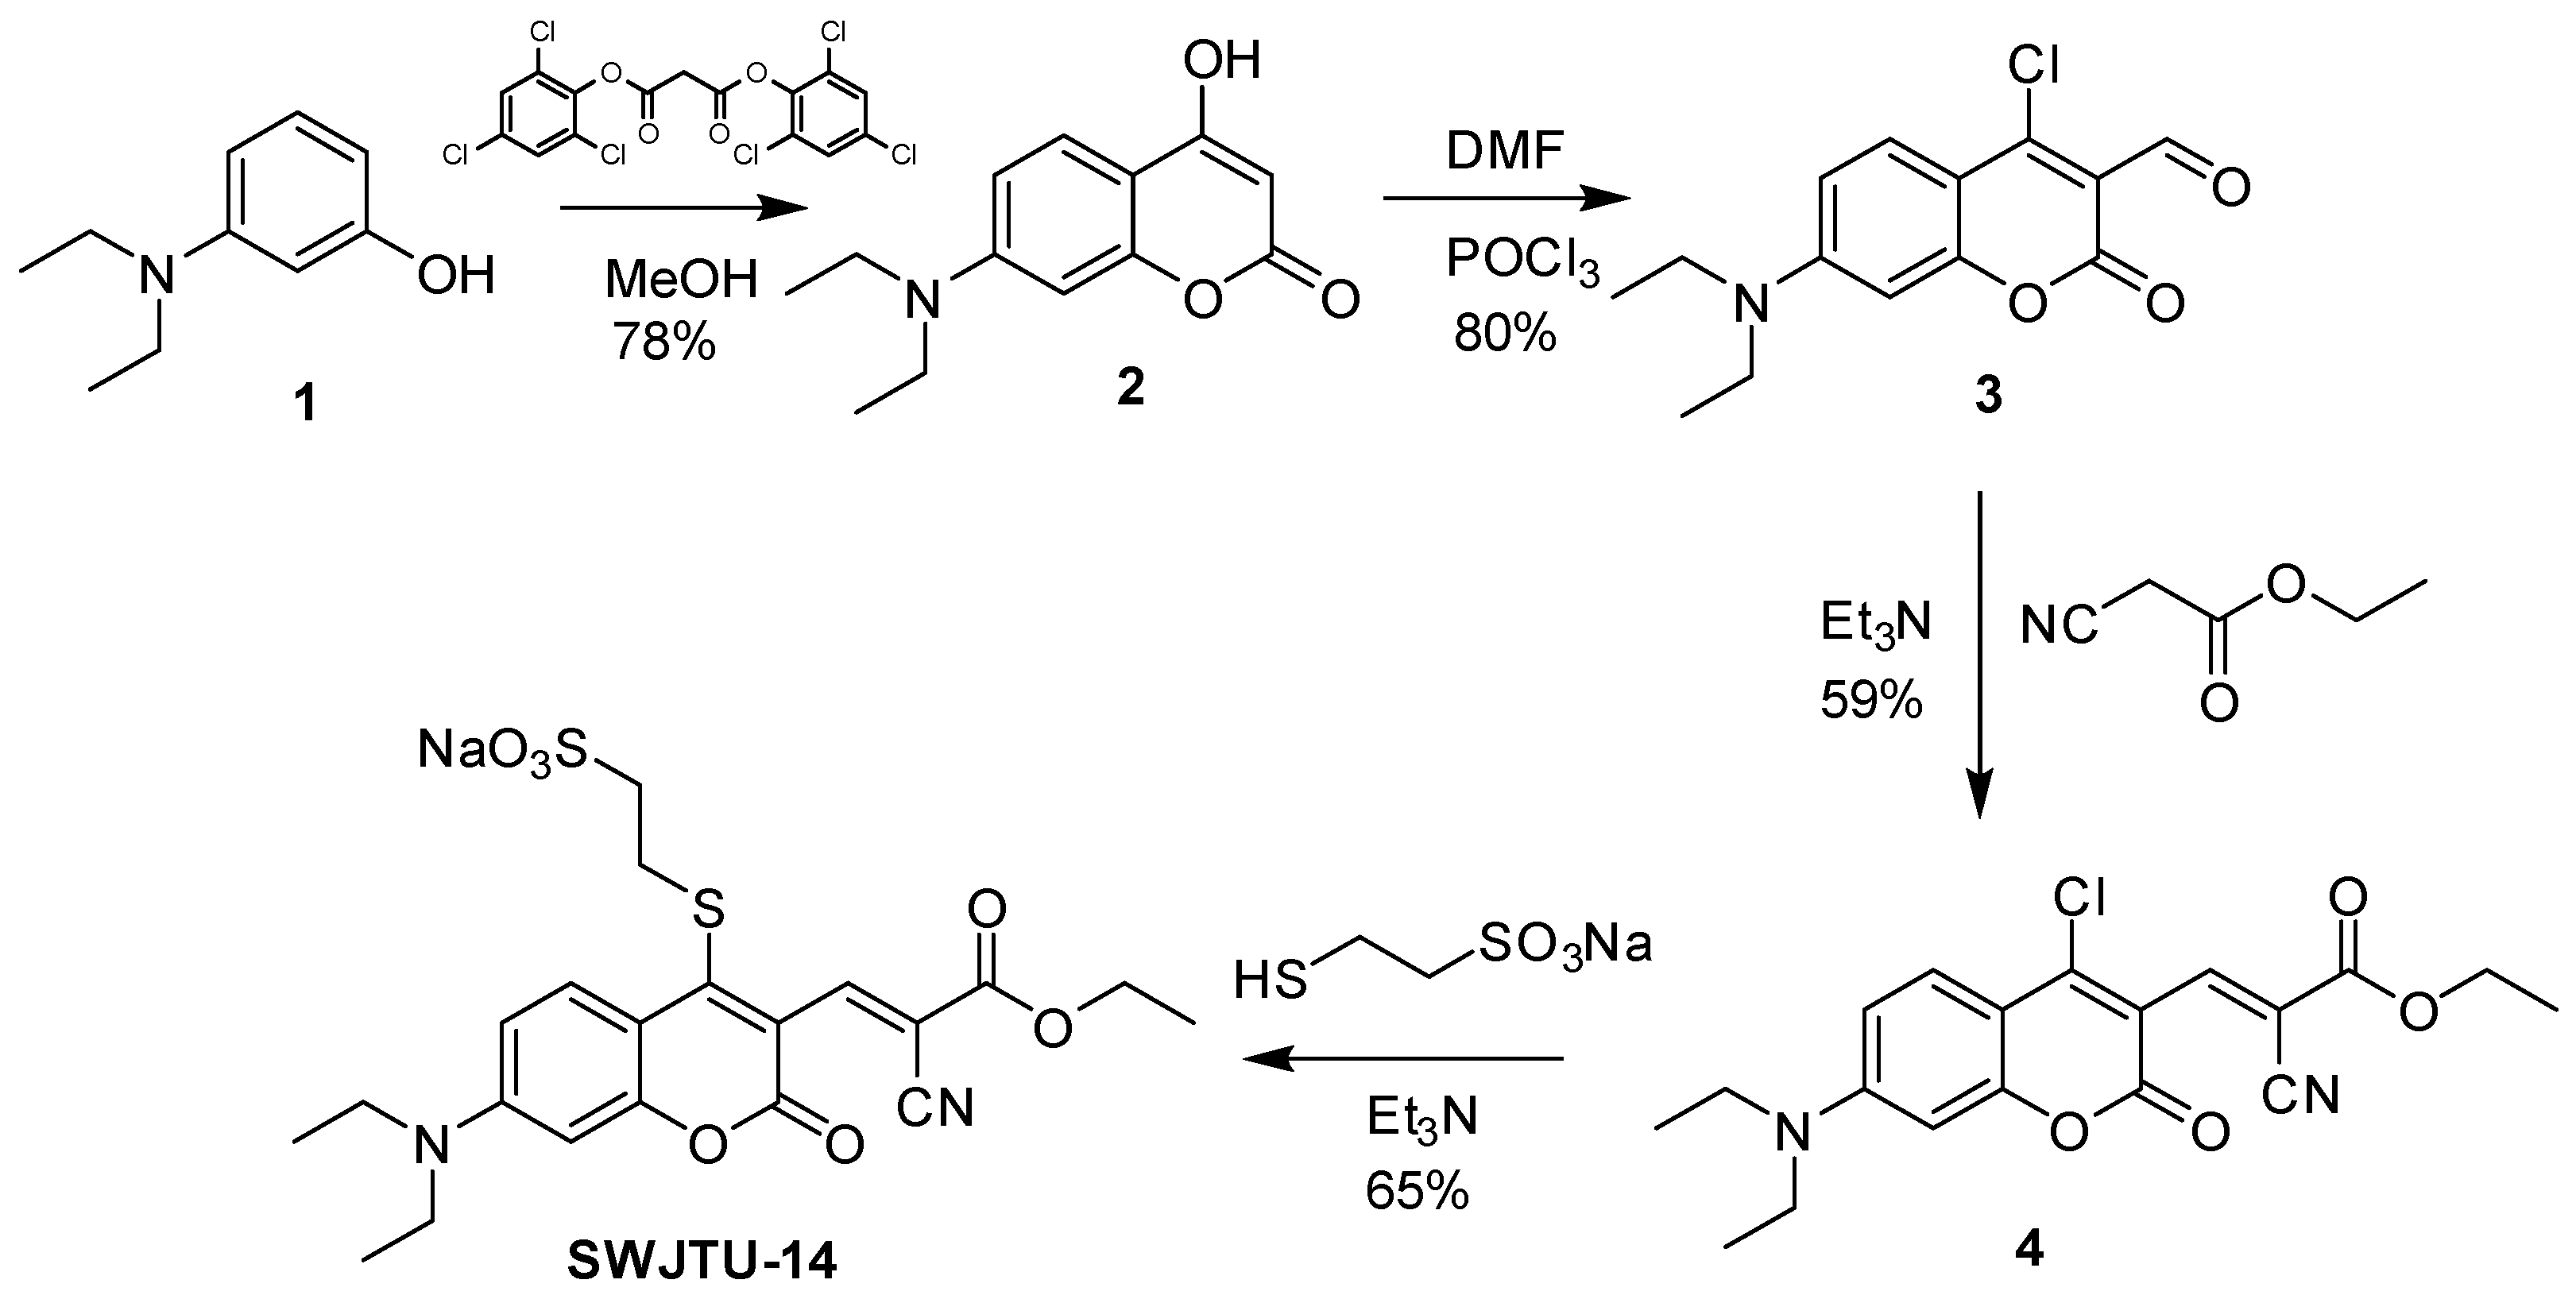
The synthetic route was shown in Scheme 2. Compounds 2–4 were obtained based on the published literature [36,44,45].
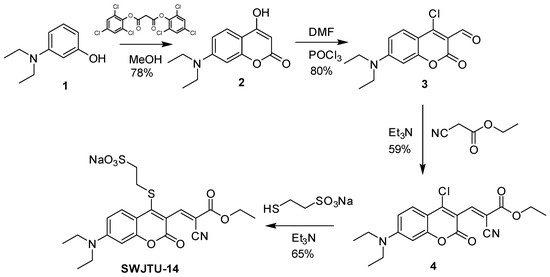
Scheme 2.
Syntheses of probe SWJT-14.
A solution of sodium 2-mercaptoethanesulfonate (52 mg, 0.317 mmol) in 1 mL water was added to a solution of 4 (100 mg, 0.267 mmol) in 4 mL acetonitrile and stirred for 5 min, then two drops of triethylamine were added to the mixture. After stirring at room temperature for 15 min, the solvents were removed by evaporation and the residue was purified by column chromatography (DCM:MeOH = 15:1) to obtain red solids (87 mg, yield: 65%). 1H NMR (D2O, 400 MHz) δ = 8.18 (s, 1H), 7.55 (d, J = 9.2 Hz, 1H), 6.53 (d, J = 8.4 Hz, 1H), 6.17 (brs, 1H), 4.38 (q, J = 6.4 Hz, 2H), 3.35 (m, 4H), 3.25–3.15 (m, 2H), 3.10–3.02 (m, 2H), 1.41 (t, J = 6.4 Hz, 3H), 1.13 (t, J = 7.2 Hz, 6H) ppm.13C NMR (DMSO-d6, 100 MHz) δ = 162.77, 158.23, 156.51, 155.91, 153.28, 149.80, 130.19, 115.00, 114.74, 111.01, 109.62, 106.23, 96.90, 62.76, 51.84, 44.97, 33.49, 14.49, 12.88 ppm. ESI-MS: m/z 479.06 [M − Na]− (Figures S1–S3, Supplementary Materials).
3. Results
3.1. The Spectral Responses of SWJT-14 for Biothiols in Aqueous Solution
The absorption and fluorescence spectra of SWJT-14 in different solvents were used for the research (Table S2, Figures S4 and S5, Supplementary Materials). The absorption of SWJT-14 in most solutions did not show recognition for biothiols. However, there was a clear distinction between the probe and the three biothiols in HEPES, Tris and PBS buffer solutions. In HEPES and Tris buffer solutions, the absorption peaks of the probe and GSH were almost the same. However, in the PBS buffer solution, SWJT-14 exhibited a maximum absorption peak at 504 nm. Upon the addition of Cys, Hcy or GSH to the solution, the maximum absorption peak blue shifted to 380 nm, 460 nm and 490 nm, respectively. For fluorescence spectra, when the excitation wavelength was 380 nm, the fluorescence of the probe increased after the addition of three biothiols in HEPES, Tris and PBS buffer solutions. Then, the pH effect on the probe was measured. As shown in Figure S6 (Supplementary Materials), the SWJT-14 and SWJT-14 + biothiols system had good fluorescence in aqueous solutions and exhibited good stability from pH 2.0 to 11.0. Considering the application in biological systems, the PBS solution with pH 7.40 was selected for the subsequent experiment.
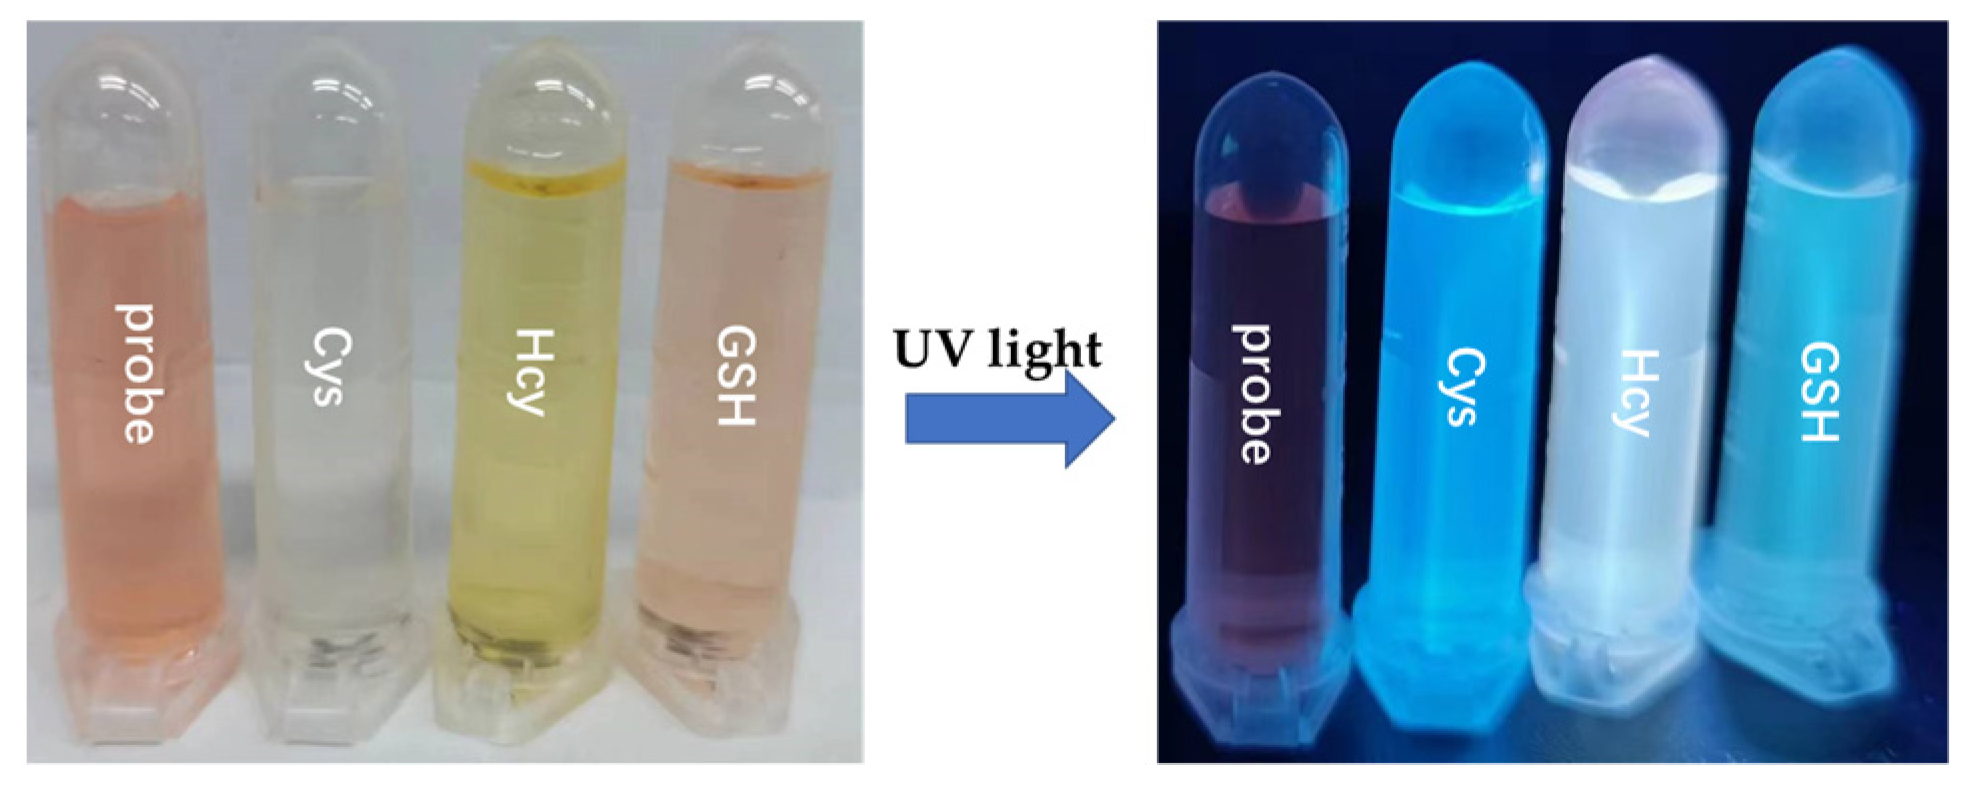
In order to study the SWJT-14 for three biothiols in detail, UV-Vis spectra (Figure S7, Supplementary Materials) and color changes (Figure 1) in PBS buffer solution were used. UV-Vis spectra of the probe + Cys system showed that the absorption peak at 504 nm decreased, accompanied by a new peak at 380 nm, enhanced within 20 min (Figure S7a, Supplementary Materials). For the probe + Hcy system, the absorption peak at 504 nm decreased, accompanied by new peaks at 460 nm and 375 nm, enhanced within 40 min (Figure S7b, Supplementary Materials). For the probe + GSH system, the absorption peak at 504 nm shifted to 490 within 20 min (Figure S7c, Supplementary Materials). As shown in Figure 1 (left), the color of the solution showed a distinct change from pink (SWJT-14) to colorless (SWJT-14 + Cys), yellow (SWJT-14+ Hcy) and pale pink (SWJT-14 + GSH). As shown in Figure 1 (right), the fluorescence color of the solution changed from colorless (SWJT-14) to blue (SWJT-14 + Cys), green (SWJT-14+ Hcy) and pale green (SWJT-14 + GSH). These results showed that SWJT-14 could recognize the three biothiols in UV-Vis mode and by the naked eye.
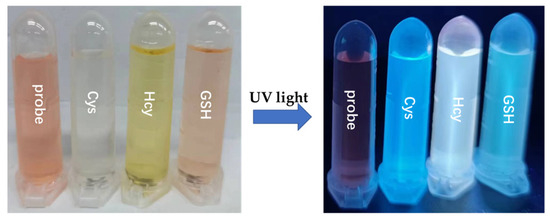
Figure 1.
The photos of SWJT-14 with Cys, Hcy and GSH in visible light and UV light at 365 nm.
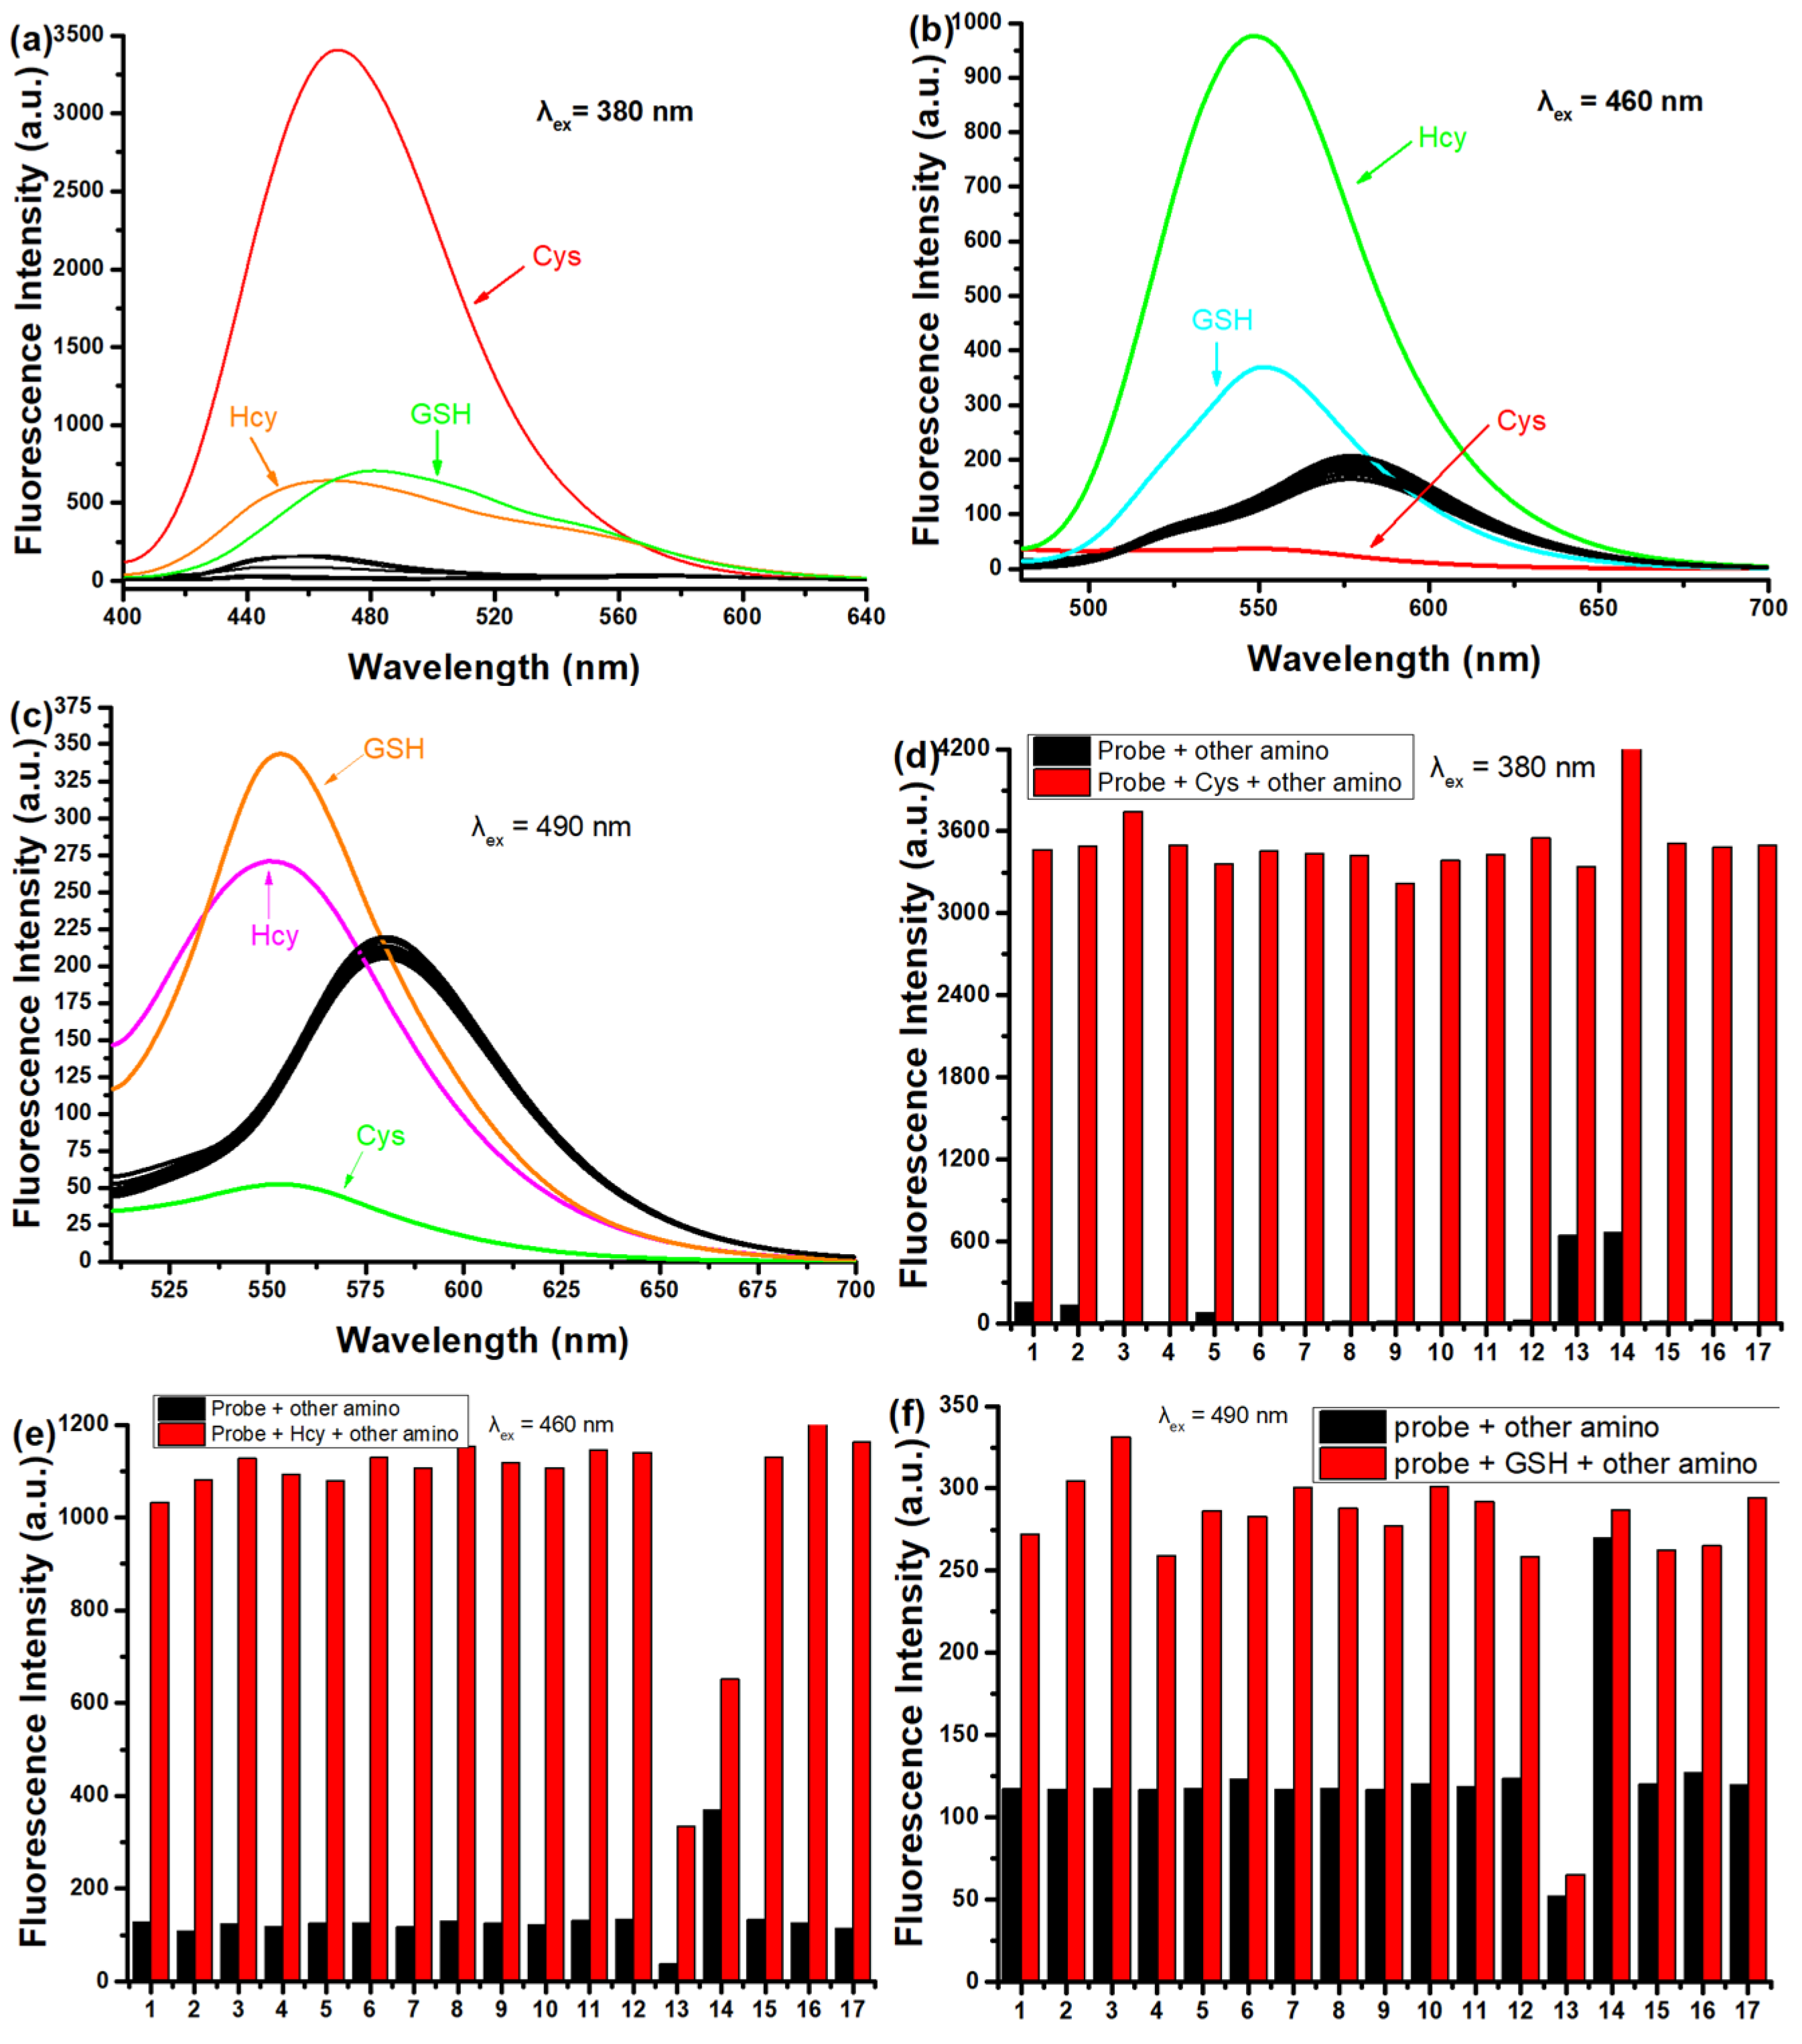
Then, the fluorescence of SWJT-14 for the three biothiols was studied in detail. The emission peak of SWJT-14 itself at different excitation wavelengths showed almost no difference, and the photostability of the probe was good (Figure S8, Supplementary Materials). SWJT-14 showed weak fluorescence at 584 nm, the quantum yield Ф [46,47] was 0.32% (λex = 490 nm), 0.26% (λex = 460 nm) and 0.06% (λex = 380 nm). As shown in Figure 2a, compared with other analytes, upon the addition of Cys to the solution, the fluorescence enhanced at 470 nm (λex = 380 nm, Ф = 2.8%) and Hcy and GSH made weak emission peaks at 467 nm and 481 nm, respectively. Notably, when the excitation wavelength was changed to 460 nm, the SWJT-14 + Hcy system had a distinct emission wavelength at 550 nm (Ф = 2.3%) (Figure 2b). When the excitation wavelength was 490 nm, GSH exhibited a maximum emission peak at 553 nm (Ф = 1.67%) (Figure 2c). As shown in Figure 2d, the presence of other analytes had no effect on the recognition of Cys by SWJT-14. Due to different reaction rates, there was, to a certain extent, an effect on the recognition of Hcy or GSH by SWJT-14 (Figure 2e,f). These results showed that SWJT-14 could detect the three biothiols in fluorescence mode, and combined with UV and naked-eye recognition, the three biothiols could be distinguished.
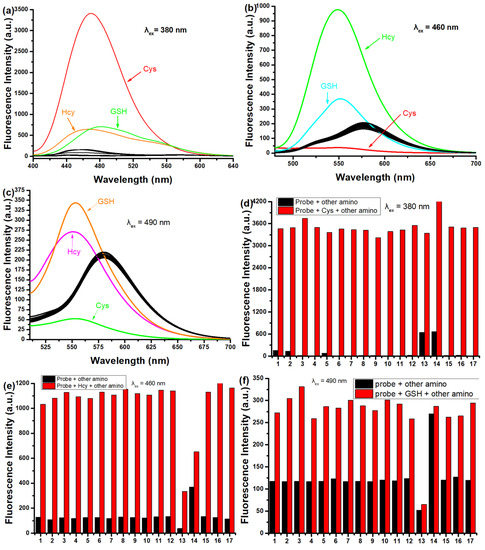
Figure 2.
(a–c) Fluorescence responses and (d,e) competitive responses of SWJT-14 (10.0 µM) with different analytes in PBS buffer solution (0.5% DMSO, pH 7.40). Analytes: Met, Leu, Pro, Thr, Try, Arg, Glu, Gly, Phe, Ser, Ala, H2S, Cys, Hcy, GSH, Lys, His and Et3N. (a,d) λem = 470 nm, λex = 380 nm (b,e) λem = 550 nm, λex = 460 nm and (c,f) λem = 553 nm, λex = 490 nm. (e,f) The black bars represent the fluorescence responses after the addition of the probe and other analytes. The red bars represent the fluorescent responses to the subsequent addition of (d) Cys, (e) Hcy or (f) GSH to the above solution.
To further investigate the change in fluorescence intensity with increasing concentrations of biothiols, titration experiments were made. As shown in Figure S9 (Supplementary Materials), with the addition of biothiols to the solution, the fluorescence intensity of SWJT-14 was enhanced 311-fold for Cys at 470 nm (λex = 380 nm), 13.7-fold for Hcy at 550 nm (λex = 460 nm) and 2-fold for GSH at 553 nm (λex = 490 nm). As shown in Figure S10 (Supplementary Materials), SWJT-14 had a good linear relationship with biothiols at low concentrations, thus the detection limits were calculated to be 0.0287 μM for Cys, 0.422 μM for Hcy and 0.924 μM for GSH [43]. The kinetic studies of SWJT-14 with the three biothiols were performed at 37 °C using the corresponding excitation wavelengths. As shown in Figure S11 (Supplementary Materials), the reaction process conformed to the pseudo first-order kinetic equation. The slope of the linear fit was the rate constant, which was calculated to be 10.98 min−1 for Cys, 0.326 min−1 for Hcy, and 0.442 min−1 for GSH [48].
3.2. Proposed Mechanism
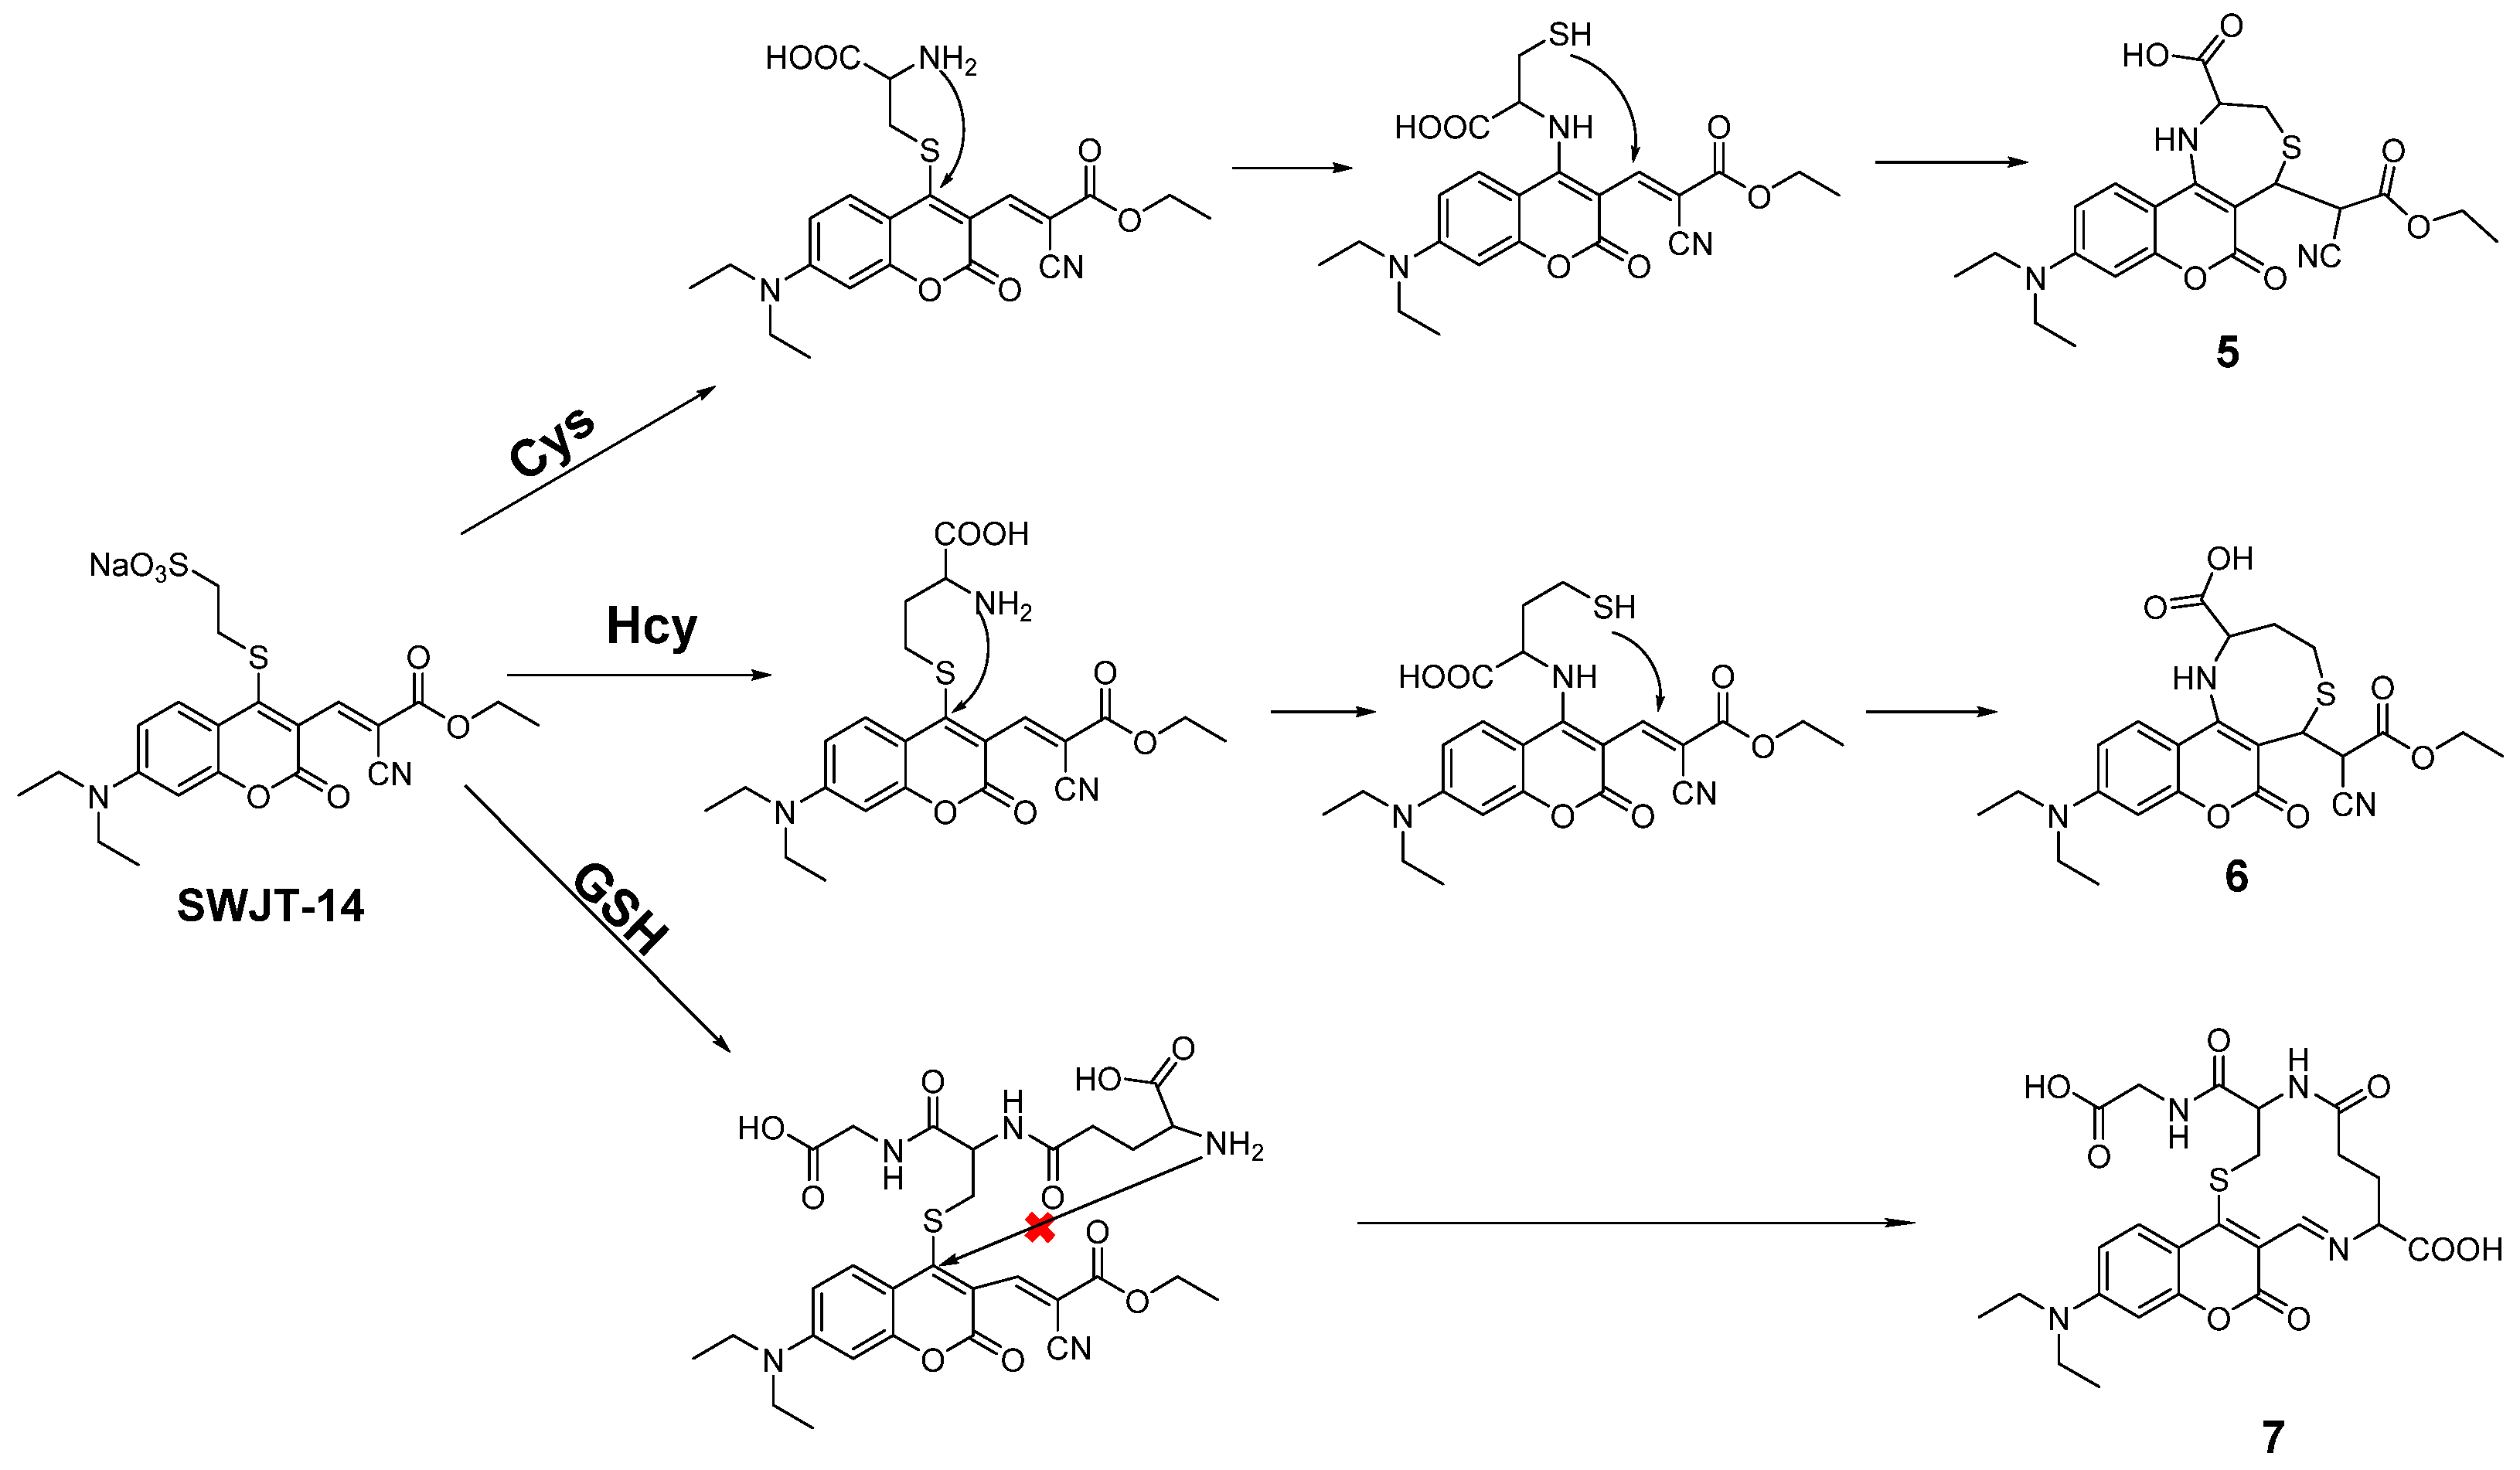
According to the proposed mechanism [40,45], SWJT-14 would react with biothiols to obtain the thiol derivatives, which were formed by replacing the mercaptosulfonic acid from the probe with sulfhydryl groups of biothiols, which quickly underwent intramolecular rearrangement to form a Schiff base (Figure 3). The exposed sulfhydryl groups further underwent a Michael addition reaction and formed structurally similar polycyclic products with Cys and Hcy. The difference in reaction rate was attributed to different potential space resistances. For GSH, the product underwent thiol coumarin and formed Schiff bases due to the large size and strong spatial site resistance of GSH. As shown in Figure S12 (Supplementary Materials), the peak of m/z 458.08 in MS was confirmed as a heptacyclic coumarin derivative was obtained after the reaction of SWJT-14 with Cys. The peaks of m/z 472.13 and m/z 533.26 were the corresponding products of Hcy and GSH with SWJT-14, respectively (Figures S13 and S14, Supplementary Materials). These results indicated that different products were obtained, which was the origin of different spectral changes. The precise mechanism is still under study.
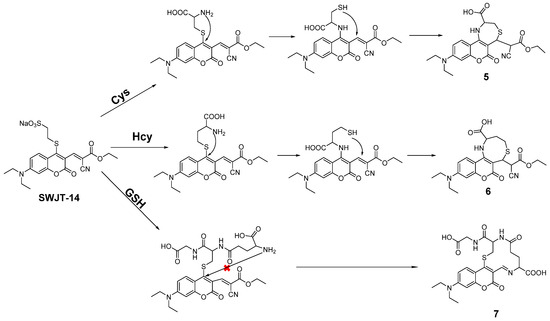
Figure 3.
Proposed mechanism of SWJT-14 to the biothiols.
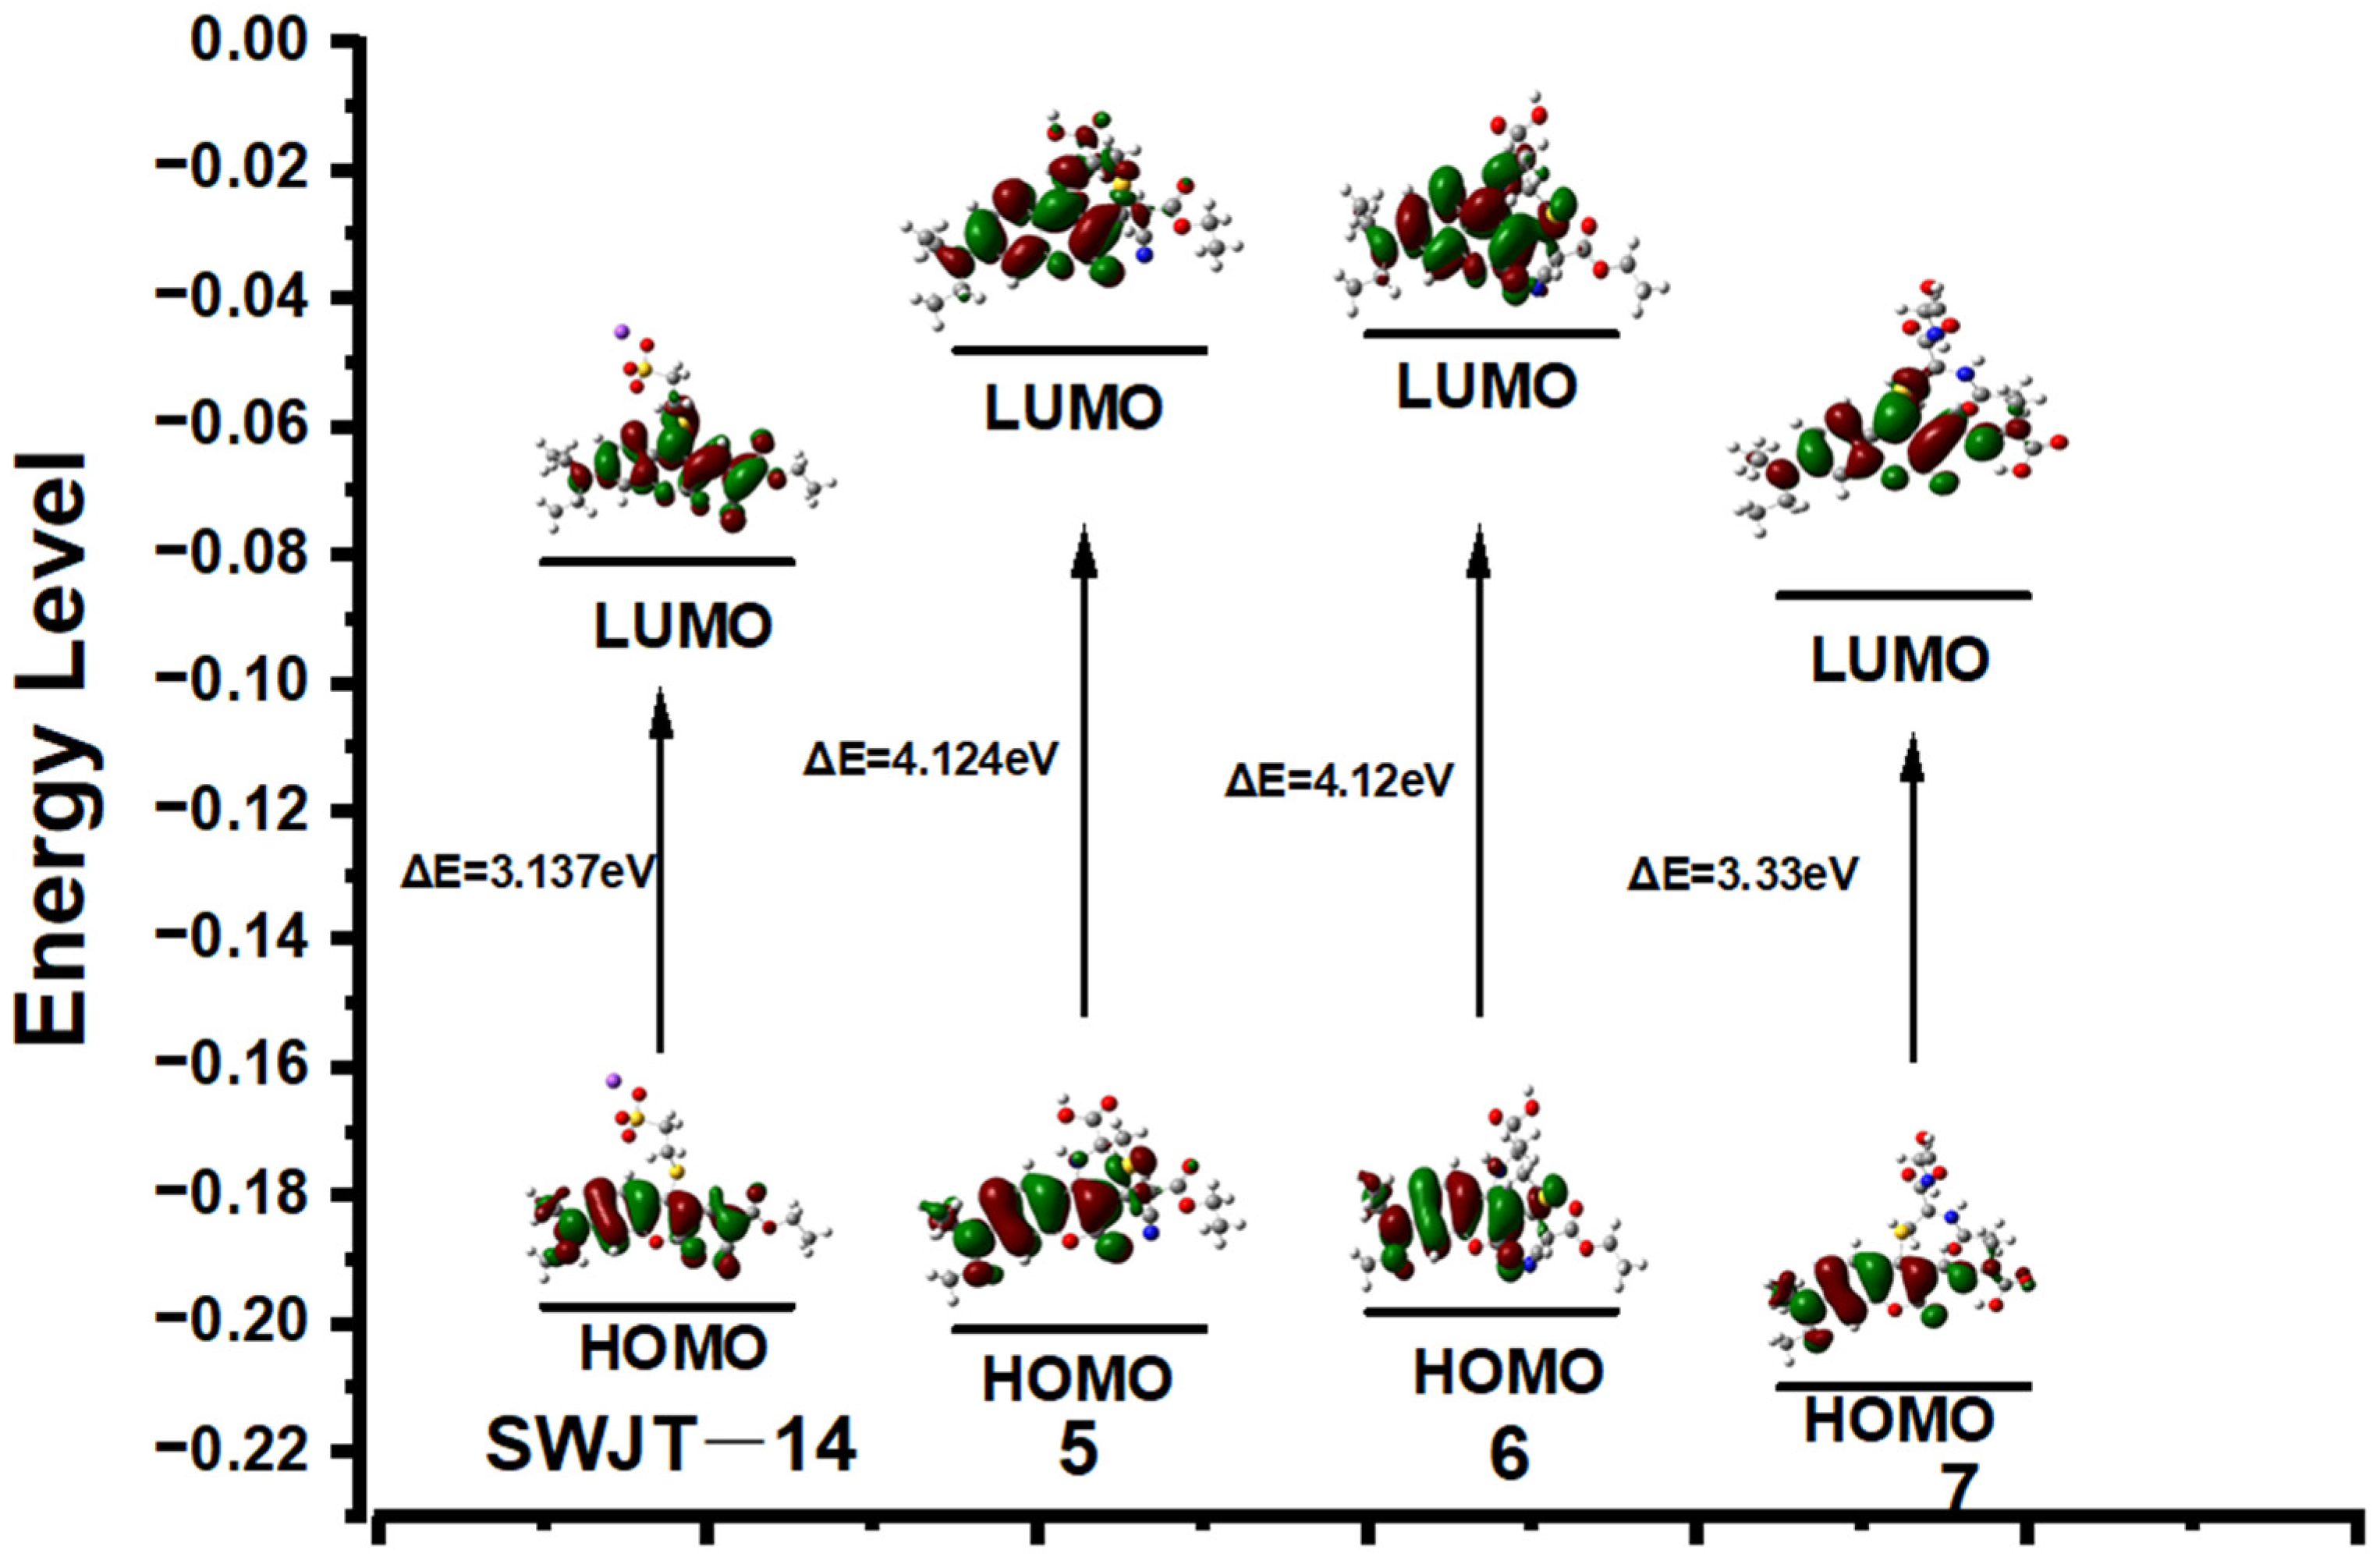
To investigate the relationship between spectra changes and structure, Gaussian calculations were performed. The optimized structures used the B3LYP/6-31G (d, p) basis set [49]. As shown in Figure 4, the electron density of LUMO was mainly distributed over coumarin and the adjacent ethyl cyanoacetate group. When the probe reacted with Cys or Hcy to obtain 5 or 6, the decrease in electron density of the coumarin fraction indicated that the conjugated system was reduced and therefore higher energy excitation wavelengths were required. Compared with 5 or 6, the electron density of 7 was similar to that of the probe, and therefore required a similar excitation wavelength to the probe. For 5, 6 and 7, the larger energy gap indicated a blue shift in absorption wavelength, which was consistent with the observed experimental results.
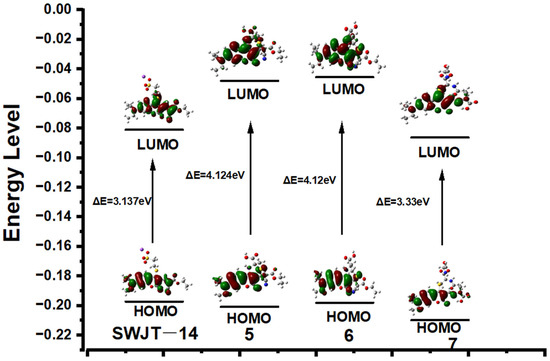
Figure 4.
Energy levels and optimized structure of SWJT-14, 5, 6 and 7.
3.3. Bioimaging in Living Cells
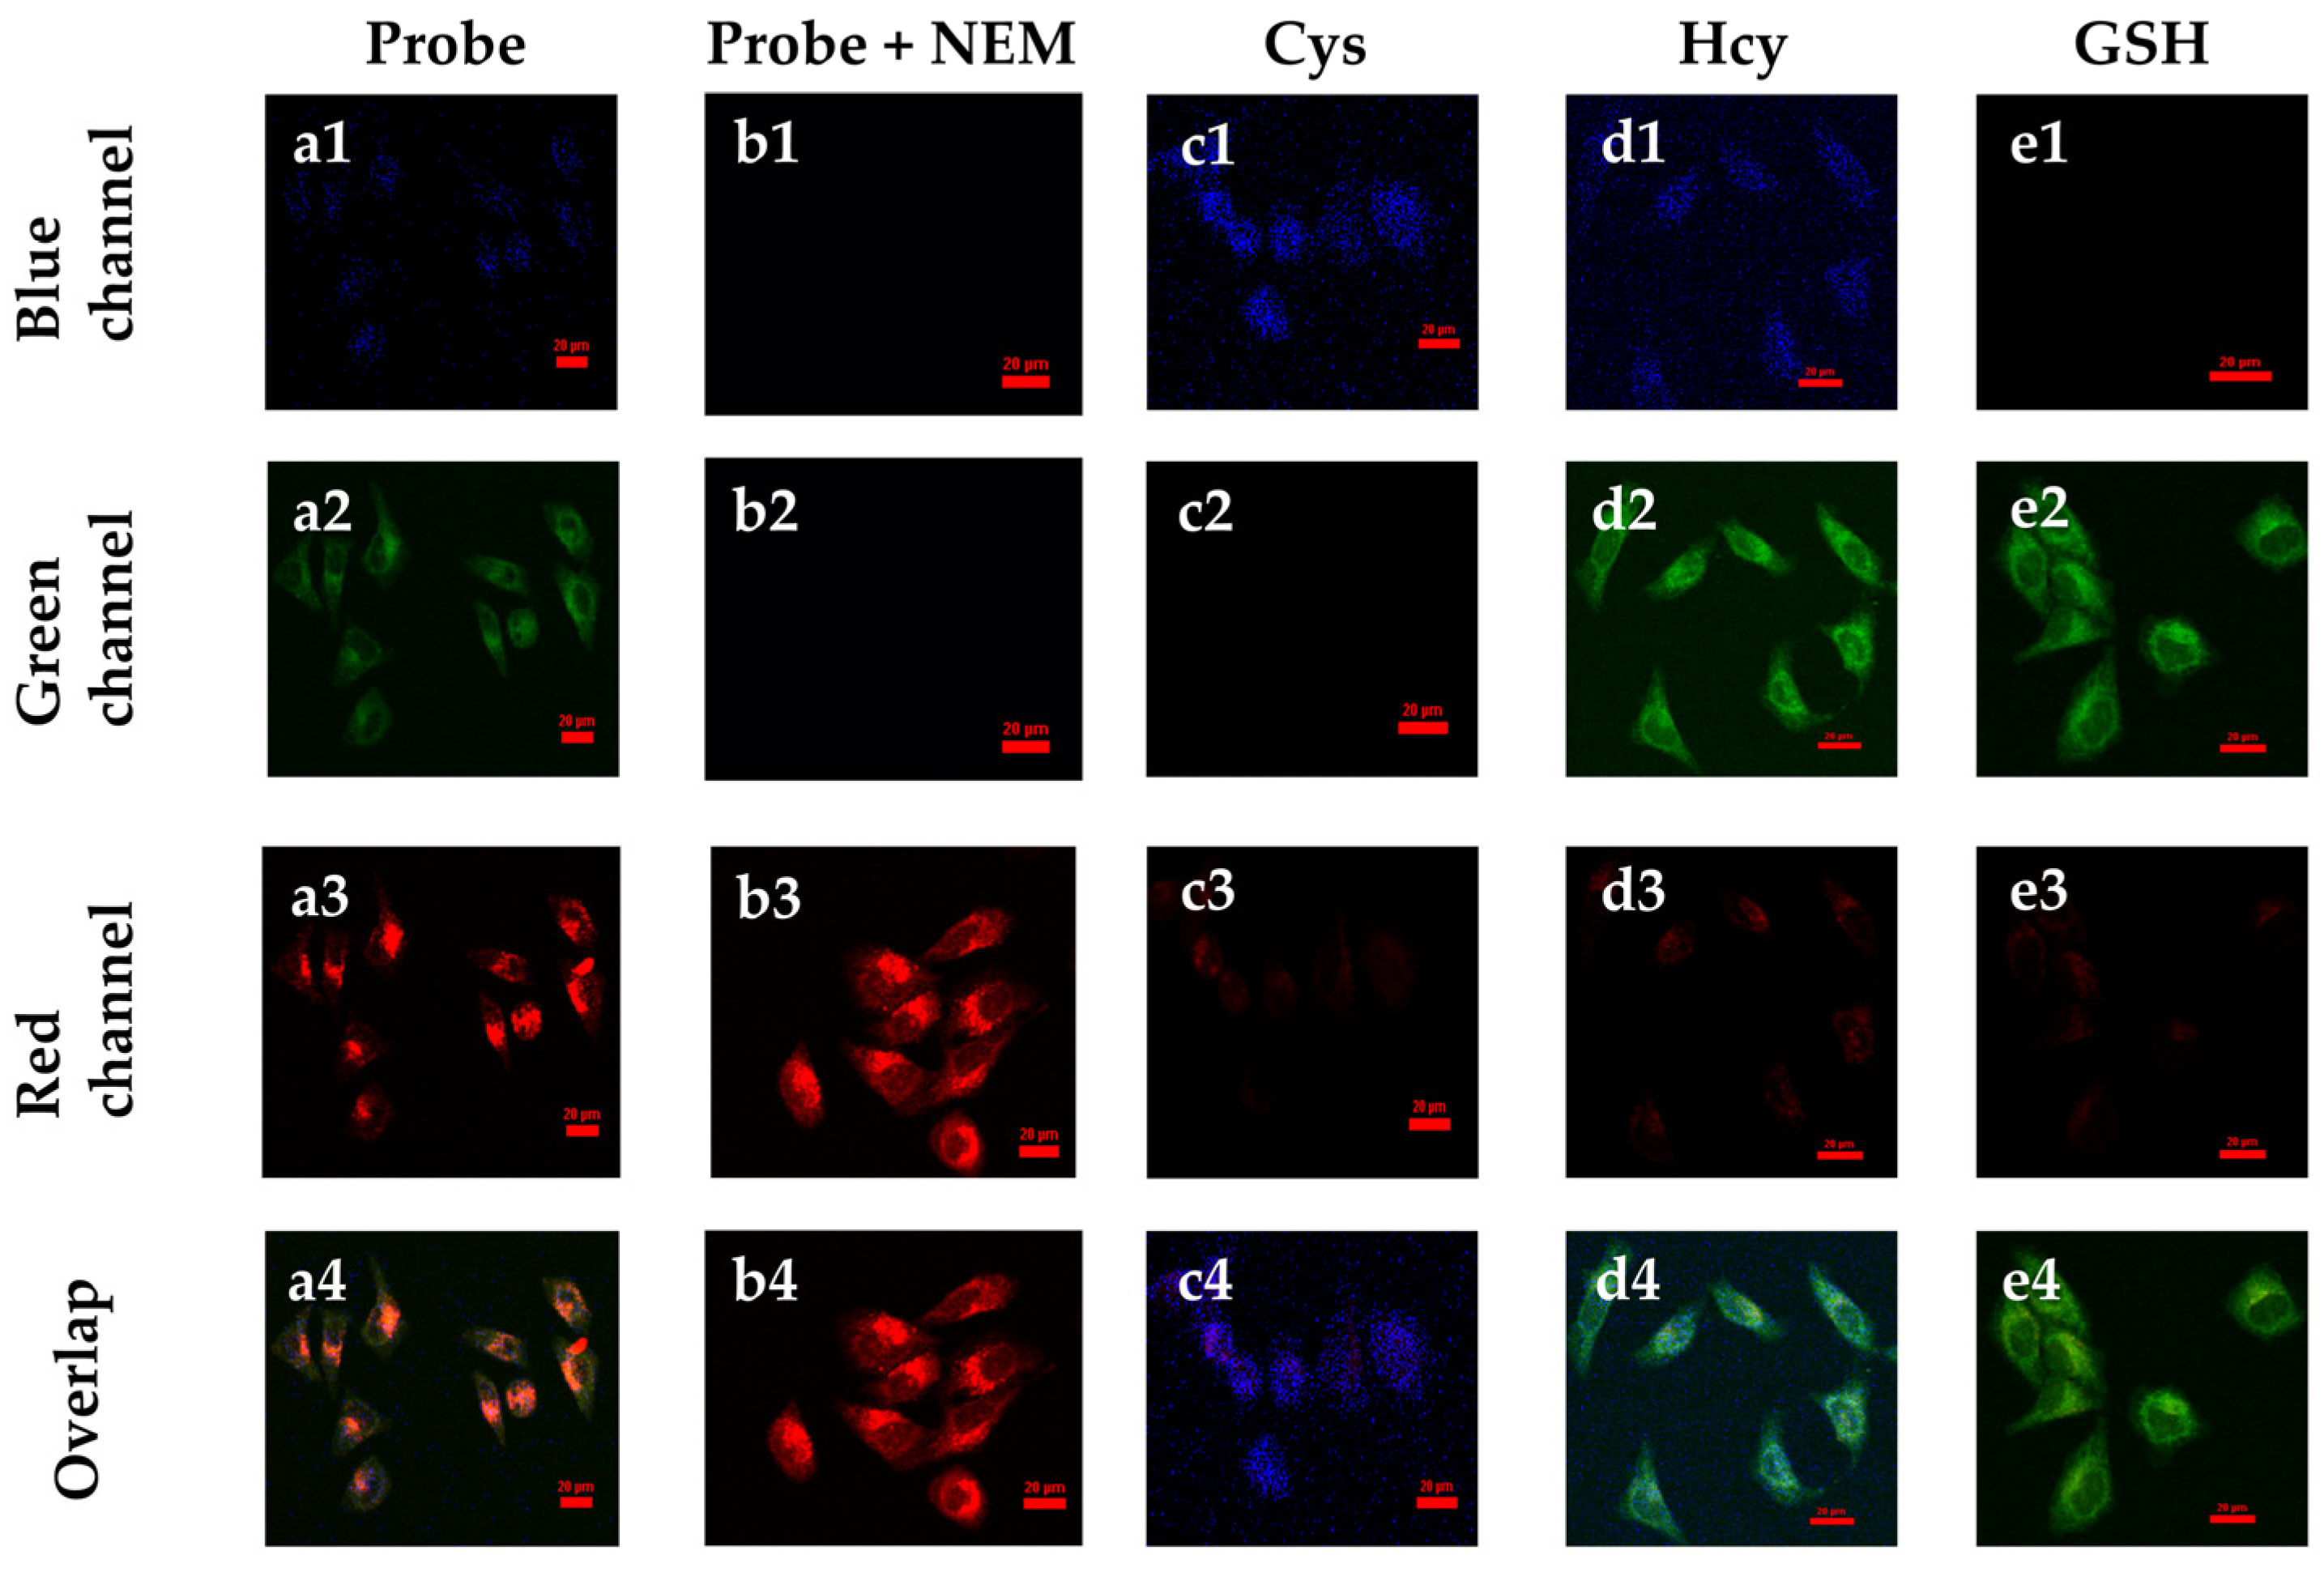
To further investigate the imaging of the SWJT-14 inside living cells, HeLa cells were selected for the experiments. As shown in Figure 5(a1–a4), faint fluorescence in the blue, green and red channels was observed after 40 min of co-incubation of the SWJT-14 with HeLa cells. After adding 200.0 μM of NEM (N-Ethylmaleimide, thiol blocking reagent) to block endogenous biothiols, the fluorescence of SWJT-14 itself in the red channel was shown (Figure 5(b1–b4)). When Cys was added to the cells that were shielded from endogenous biothiols, and incubated for 30 min, followed by incubation with SWJT-14 for 40 min, weak fluorescence in the blue channel and almost no fluorescence in the red or green channels was observed (Figure 5(c1–c4)). Hcy (Figure 5(d1–d4)) or GSH (Figure 5(e1–e4)) were added in the same way and showed fluorescence in the blue and green or green channels, while there was almost no fluorescence in the red channel. These results indicated that SWJT-14 could detect exogenous biothiols in living cells, which was consistent with the fluorescence detection results.
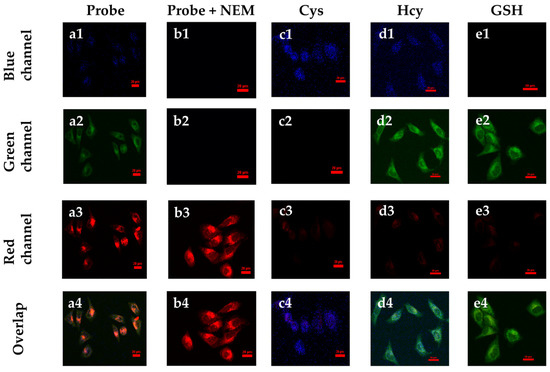
Figure 5.
Confocal fluorescence images in HeLa cells. (a1–a4) Cells incubated with SWJT-14 (20.0 μM) for 40 min. (b1–b4) Cells were incubated with NEM (200.0 μM) for 30 min, followed by the addition of SWJT-14 and continued incubation for 40 min. (c–e) Cells were incubated with NEM for 30 min, followed by the addition of biothiol for 30 min and then the probe was added for 40 min. (c1–c4) Cys (200.0 μM), (d1–d4) Hcy (200.0 μM), (e1–e4) GSH (200.0 μM). Scale bar: 20.0 μm. λex = 405 nm, λem = 425–475 nm for blue channel; λex = 488 nm, λem = 500–550 nm for green channel; λex = 561 nm, λem = 570–620 nm for red channel.
4. Conclusions
A coumarin derivative as a fluorescent probe was designed and synthesized. It can react with biothiols in aqueous solutions to generate products with different conjugated structures, resulting in different emission peaks at different excitation wavelengths, which achieved the purpose of differential detection of Cys, Hcy and GSH. The fluorescence imaging of SWJT-14 had also been demonstrated in living cells.
Supplementary Materials
The following supporting information can be downloaded at: https://www.mdpi.com/article/10.3390/bios13040447/s1, Copies of 1H, 13C NMR, ESI-MS spectra, spectral data and other materials. Table S1: Summary of representative probes for distinguishing of biothiols; Figure S1: 1H NMR spectrum (400 MHz, D2O) of SWJT-14; Figure S2: 13C NMR spectrum (100 MHz, DMSO-d6) of SWJT-14; Figure S3: LC-MS spectrum of probe SWJT-14; Table S2: Photophysical properties of SWJT-14; Figure S4: Absorption spectra of SWJT-14 (10.0 μM) with biothiols in different solvents; Figure S5: Fluorescence of SWJT-14 (10.0 μM) with biothiols in different solvents (λex = 380 nm); Figure S6: Fluorescence intensity changes before and after the addition of Cys, Hcy, GSH (200.0 μM) to the solution of SWJT-14 (10.0 μM, λex = 380 nm for Cys, λex = 460 nm for Hcy, λex = 380 nm for GSH) at different pH value; Figure S7: UV-vis absorption spectra of the time profiles. (a) SWJT-14 (10.0 μM) with Cys, (b) SWJT-14 with Hcy, (c) SWJT-14 with GSH in PBS buffer (0.5% DMSO, pH = 7.4); Figure S8: Emission peaks of the probe under different excitations and photostability of the probe (λex = 490 nm, λem = 584 nm); Figure S9: Titration curves of SWJT-14 (10.0 μM) with (a) Cys, λex = 380 nm; (b) Hcy, λex = 460 nm; (c) GSH, λex = 490 nm; Figure S10: The detection limit of probe SWJT-14 (10.0 μM) to Cys (λex = 380 nm), Hcy (λex = 460 nm), GSH (λex = 380 nm); Figure S11: (a–c) Kinetic fitting of SWJT-14 (10.0 μM) to Cys, Hcy and GSH (200.0 μM); Figure S12: LC-MS of SWJT-14 + Cys; Figure S13: LC-MS of SWJT-14 + Hcy; Figure S14: LC-MS of SWJT-14 + GSH; Figure S15: The viability of HeLa cells was determined by cck8 assay after incubation with different concentrations of SWJT-14 for 24 h; Figure S16: Optimized structure of SWJT-14; Figure S17: Optimized structure of 5; Figure S18: Optimized structure of 6; Figure S19: Optimized structure of 7.
Author Contributions
Y.-W.W. conceived and designed the experiments; W.D. performed the experiments; W.D., X.-L.G., Y.T., X.Z., Y.-W.W. and Y.P. analyzed the data; W.D., Y.-W.W. and Y.P. wrote the paper. All authors have read and agreed to the published version of the manuscript.
Funding
This work was supported by the National Natural Science Foundation of China (No. 21572091). We also thank the Science and Technology Department of Sichuan Province (2020JDRC0021), and the Key Research Project of Sichuan Province Science and Technology Plan (2020YFS0489).
Institutional Review Board Statement
Not applicable.
Informed Consent Statement
Not applicable.
Data Availability Statement
Not applicable.
Acknowledgments
We would like to thank the Analytical and Testing Center of Southwest Jiaotong University for the NMR and laser confocal microscope test.
Conflicts of Interest
The authors declare no conflict of interest.
References
- Mohamed, M.M.; Sloane, B.F. Cysteine cathepsins: Multifunctional enzymes in cancer. Nat. Rev. Cancer 2006, 6, 764–775. [Google Scholar] [CrossRef]
- Weerapana, E.; Wang, C.; Simon, G.M.; Richter, F.; Khare, S.; Dillon, M.B.D.; Bachovchin, D.A.; Mowen, K.; Baker, D.; Cravatt, B.F. Quantitative reactivity profiling predicts functional cysteines in proteomes. Nature 2010, 468, 790–795. [Google Scholar] [CrossRef]
- Lipton, S.A.; Choi, Y.B.; Takahashi, H.; Zhang, D.; Li, W.; Godzik, A.; Bankston, L.A. Cysteine regulation of protein function--as exemplified by nmda-receptor modulation. Trends Neurosci. 2002, 25, 474–480. [Google Scholar] [CrossRef]
- Chu, P.Y.; Liu, M.Y. Amino acid cysteine induces senescence and decelerates cell growth in melanoma. J. Funct. Foods 2015, 18, 455–462. [Google Scholar] [CrossRef]
- Annamaria, F.; Edgar, D.; Yoboue, E.D.; Roberto, S. Cysteines as Redox Molecular Switches and Targets of Disease. Front. Mol. Neurosci. 2017, 10, 167. [Google Scholar]
- Smith, A.D.; Refsum, H. Homocysteine–from disease biomarker to diseaseprevention. J. Intern. Med. 2021, 290, 826–854. [Google Scholar] [CrossRef]
- Seshadri, S.; Beiser, A.; Selhub, J.; Jacques, P.F.; Rosenberg, I.H.; D’agostino, R.B.; Wolf, P.A. Plasma homocysteine as a risk factor for dementia and alzheimer’s disease. N. Engl. J. Med. 2002, 346, 476–483. [Google Scholar] [CrossRef]
- Refsum, H.; Ueland, P.M.; Nygård, O.; Vollset, S.E. Homocysteine and cardiovascular disease. Annu. Rev. Med. 1998, 49, 31–62. [Google Scholar] [CrossRef]
- Harris, C.; Hansen, J.M. Oxidative stress, thiols, and redox profiles. Methods Mol. Biol. 2012, 889, 325–346. [Google Scholar]
- Finkelstein, J.D.; Martin, J.J. Homocysteine. Int. J. Biochem. Cell Biol. 2000, 32, 385–389. [Google Scholar] [CrossRef]
- Deyamira, M.M.; Héctor, R.R.; María Magdalena, V.L.; Héctor, V.M. Glutathione Participation in the Prevention of Cardiovascular Diseases. Antioxidants 2021, 10, 1220. [Google Scholar]
- Hwang, C.; Sinskey, A.J.; Lodish, H.F. Oxidized redox state of glutathione in the endoplasmic reticulum. Science 1992, 257, 1496–1502. [Google Scholar] [CrossRef]
- Schulz, J.B.; Lindenau, J.; Seyfried, J.; Dichgans, J. Glutathione, oxidative stress and neurodegeneration. Eur. J. Biochem. 2000, 267, 4904–4911. [Google Scholar] [CrossRef]
- Wood, Z.A.; Schröder, E.; Robin Harris, J.; Poole, L.B. Structure, mechanism and regulation of peroxiredoxins. Trends Biochem. Sci. 2003, 28, 32–40. [Google Scholar] [CrossRef]
- Wang, X.F.; Cynader, M.S. Pyruvate released by astrocytes protects neurons from copper-catalyzed cysteine neurotoxicity. J. Neurosci. J. Off. Soc. Neurosci. 2001, 21, 3322–3331. [Google Scholar] [CrossRef]
- Refsum, H.; Smith, A.D.; Ueland, P.M.; Nexo, E.; Clarke, R.; McPartlin, J.; Johnston, C.; Engbaek, F.; Schneede, J.; McPartlin, C.; et al. Facts and recommendations about total homocysteine determinations: An expert opinion. Clin. Chem. 2004, 50, 3–32. [Google Scholar] [CrossRef]
- Townsend, D.M.; Tew, K.D.; Tapiero, H. The importance of glutathione in human disease. Biomed. Pharmacother. 2003, 57, 145–155. [Google Scholar] [CrossRef]
- Liang, S.C.; Wang, H.; Zhang, Z.M.; Zhang, H.S. Determination of thiol by high-performance liquid chromatography and fluorescence detection with 5-methyl-(2-(m-iodoacetylaminophenyl) benzoxazole. Anal. Bioanal. Chem. 2005, 381, 1095–1100. [Google Scholar] [CrossRef]
- Forgacsova, A.; Galba, J.; Mojzisova, J.; Mikus, P.; Piestansky, J.; Kovac, A. Ultra-high performance hydrophilic interaction liquid chromatography–triple quadrupole tandem mass spectrometry method for determination of cysteine, homocysteine, cysteinyl-glycine and glutathione in rat plasma. J. Pharm. Biomed. Anal. 2018, 164, 442–451. [Google Scholar] [CrossRef]
- Inoue, T.; Kirchhoff, J.R. Determination of thiols by capillary electrophoresis with amperometric detection at a coenzyme pyrroloquinoline quinone modified electrode. Anal. Chem. 2002, 74, 1349–1354. [Google Scholar] [CrossRef]
- Cao, X.N.; Lin, L.; Xian, Y.Z.; Zhang, W.; Xie, Y.F.; Jin, L.T. In vivo monitoring of the thiols in rat striatum by liquid chromatography with amperometric detection at a functionalized multi-wall carbon nanotubes modified electrode. Electroanalysis 2010, 15, 892–897. [Google Scholar] [CrossRef]
- Yue, Y.; Guo, Y.; Xu, J.; Shao, S. A Bodipy-based derivative for selective fluorescence sensing of homocysteine and cysteine. New J. Chem. 2011, 35, 61–64. [Google Scholar] [CrossRef]
- Li, J.; Kwon, Y.; Chung, K.S.; Lim, C.S.; Lee, D.; Yue, Y.; Kim, G.; Yoon, J. Naphthalene-based fluorescent probes for glutathione and their applications in living cells and patients with sepsis. Theranostics 2018, 8, 1411–1420. [Google Scholar] [CrossRef]
- JungáKim, M.A. Thiol-specific fluorescent probe and its application for bioimaging. Chem. Commun. 2010, 46, 2751–2753. [Google Scholar]
- Chen, X.; Xu, H.; Ma, S.; Tong, H.; Lou, K.; Wang, W. A simple two-photon turn-on fluorescent probe for the selective detection of cysteine based on a dual PeT/ICT mechanism. RSC Adv. 2018, 8, 13388–13392. [Google Scholar] [CrossRef]
- Yang, X.; Guo, Y.; Strongin, R.M. Conjugate addition/cyclization sequence enables selective and simultaneous fluorescence detection of cysteine and homocysteine. Angew. Chem. 2011, 123, 10878–10881. [Google Scholar] [CrossRef]
- Liang, B.; Wang, B.; Ma, Q.; Xie, C.; Li, X.; Wang, S. A lysosome-targetable turn-on fluorescent probe for the detection of thiols in living cells based on a 1,8-naphthalimide derivative. Spectrochim. Acta Part A Mol. Biomol. Spectrosc. 2018, 192, 67–74. [Google Scholar] [CrossRef]
- Biswas, S.; Pal, K.; Kumar, P.; Koner, A.L. A fluorogenic probe for in vitro and in vivo detection of biothiols and vitamin-C with an in-depth mechanistic understanding. Sens. Actuators B Chem. 2018, 256, 186–194. [Google Scholar] [CrossRef]
- Zhang, W.; Weijing, G.; Cheng, T.; Wang, B.; Jiang, Y.; Shen, J. A novel near-infrared and naked-eyes turn on fluorescent probe for detection of biothiols with a large Stokes shift and its application in living cells. Anal. Methods 2018, 10, 3991–3999. [Google Scholar] [CrossRef]
- Li, M.; Wu, X.; Wang, Y.; Li, Y.; Zhu, W.; James, T.D. A near-infrared colorimetric fluorescent chemodosimeter for the detection of glutathione in living cells. Chem. Commun. 2014, 50, 1751–1753. [Google Scholar] [CrossRef]
- Iqbal, S.; Yu, S.; Zhao, F.; Wang, Y.; Tian, J.; Jiang, L.; Du, Y.; Pu, L. Discriminating three biothiols by using one fluorescent probe. Tetrahedron Lett. 2018, 59, 3397–3400. [Google Scholar] [CrossRef]
- Tsay, O.G.; Lee, K.M.; Churchill, D.G. Selective and competitive cysteine chemosensing: Resettable fluorescent “turn on” aqueous detection via Cu2+ displacement and salicylaldimine hydrolysis. New J. Chem. 2012, 36, 1949–1952. [Google Scholar] [CrossRef]
- Yin, C.; Tang, Y.; Li, X.; Yang, Z.; Li, J.; Li, X.; Huang, W.; Fan, Q. A Single Composition Architecture-Based Nanoprobe for Ratiometric Photoacoustic Imaging of Glutathione (GSH) in Living Mice. Small 2018, 14, 1703400. [Google Scholar] [CrossRef]
- Ye, M.; Wang, X.; Tang, J.; Guo, Z.; Shen, Y.; Tian, H.; Zhu, W.-H. Dual-channel NIR activatable theranostic prodrug for in vivo spatiotemporal tracking thiol-triggered chemotherapy. Chem. Sci. 2016, 7, 4958–4965. [Google Scholar] [CrossRef]
- Liu, J.; Sun, Y.Q.; Huo, Y.Y.; Zhang, H.X.; Wang, L.F.; Zhang, P.; Song, D.; Shi, Y.W.; Guo, W. Simultaneous Fluorescence Sensing of Cys and GSH from Different Emission Channels. J. Am. Chem. Soc. 2014, 136, 574–577. [Google Scholar] [CrossRef]
- Yin, G.X.; Niu, T.T.; Gan, Y.B.; Yu, T.; Yin, P.; Chen, H.M.; Zhang, Y.Y.; Li, H.T.; Yao, S.Z. A Multi-signal Fluorescent Probe with Multiple Binding Sites for Simultaneous Sensing of Cysteine, Homocysteine, and Glutathi-one. Angew. Chem. Int. Ed. 2018, 57, 4991–4994. [Google Scholar] [CrossRef]
- Zhang, H.; Xu, L.Z.; Chen, W.Q.; Huang, J.; Huang, C.S.; Sheng, J.R.; Song, X.Z. Simultaneous Discrimination of Cysteine, Homocysteine, Glutathione, and H2S in Living Cells through a Multisignal Combination Strategy. Anal. Chem. 2019, 91, 1904–1911. [Google Scholar] [CrossRef]
- Yue, X.X.; Chen, J.L.; Chen, W.Q.; Wang, B.H.; Zhang, H.; Song, X.Z. An endoplasmic reticulum-targeting fluorescent probe for discriminatory detection of Cys, Hcy and GSH in living cells. Spectrochim. Acta Part A Mol. Biomol. Spectrosc. 2021, 250, 119347. [Google Scholar] [CrossRef]
- Tian, Y.; Zhu, B.C.; Yang, W.; Jing, J.; Zhang, X.L. A fluorescent probe for differentiating Cys, Hcy and GSH via a stepwise interaction. Sens. Actuators B 2018, 262, 345–349. [Google Scholar] [CrossRef]
- Wang, Y.T.; Yue, Y.K.; Huo, F.J.; Ma, K.Q.; Yin, C.X. Substitution-rearrangement-cyclization strategy to construct fluorescent probe for multicolor discriminative analysis biothiols in cells and zebrafish. Spectrochim. Acta Part A Mol. Biomol. Spectrosc. 2021, 261, 120026. [Google Scholar] [CrossRef]
- Fu, Z.H.; Han, X.; Shao, Y.; Fang, J.G.; Zhang, Z.H.; Wang, Y.W.; Peng, Y. Fluorescein-based chromogenic and ratiometric fluorescence probe for highly selective detection of cysteine and its application in bioimaging. Anal. Chem. 2017, 89, 1937–1944. [Google Scholar] [CrossRef]
- Du, W.; Liu, R.J.; Fang, J.G.; Gao, H.; Wang, Y.W.; Peng, Y. Two chemodosimeters for fluorescence recognition of biothiols in aqueous solution and their bioimaging application. Tetrahedron 2019, 75, 130477. [Google Scholar] [CrossRef]
- Wang, B.J.; Liu, R.J.; Fang, J.G.; Gao, H.; Wang, Y.W.; Peng, Y. A water-soluble dual-site fluorescent probe for the rapid detection of cysteine with high sensitivity and specificity. Chem. Commun. 2019, 55, 11762. [Google Scholar] [CrossRef]
- Chevalier, A.; Renard, P.Y.; Romieu, A. Straightforward Access to Water-Soluble Unsymmetrical Sulfoxanthene Dyes: Application to the Preparation of Far-Red Fluorescent Dyes with Large Stokes’ Shifts. Chem. Eur. J. 2014, 20, 8330–8337. [Google Scholar] [CrossRef]
- Yin, G.X.; Niu, T.T.; Yu, T.; Gan, Y.B.; Sun, X.Y.; Yin, P.; Chen, H.M.; Zhang, Y.Y.; Li, H.T.; Yao, S.Z. Simulta-neous Visualization of Endogenous Homocysteine, Cysteine, Glutathione, and their Transformation through Dif-ferent Fluorescence Channels. Angew. Chem. Int. Ed. 2019, 58, 4557–4561. [Google Scholar] [CrossRef]
- Sun, Q.; Yang, S.; Wu, L.; Dong, Q.; Yang, W.; Yang, G. Detection of intracellular selenol-containing molecules using a fluorescent probe with near-zero background signal, Anal. Chem. 2016, 88, 6084–6091. [Google Scholar]
- Brouwer, A. Standards for photoluminescence quantum yield measurements in solution (IUPAC Technical Re-port). Pure Appl. Chem. 2011, 83, 2213–2228. [Google Scholar] [CrossRef]
- Zhou, Y.; Xu, H.; Li, Q.Q.; Hou, Z.R.; Wang, Y.W.; Peng, Y. A dual-mode probe based on AIE and TICT effects for the detection of the hypochlorite anion and its bioimaging in living cells. Org. Biomol. Chem. 2023, 21, 1270–1274. [Google Scholar] [CrossRef]
- Frisch, M.J.; Trucks, G.W.; Schlegel, H.B.; Scuseria, G.E.; Robb, M.A.; Cheeseman, J.R.; Scalmani, G.; Barone, V.; Mennucci, B.; Petersson, G.A.; et al. GAUSSIAN 09 (Revision A.1); Gaussian. Inc.: Wallingford, CT, USA, 2009. [Google Scholar]
Disclaimer/Publisher’s Note: The statements, opinions and data contained in all publications are solely those of the individual author(s) and contributor(s) and not of MDPI and/or the editor(s). MDPI and/or the editor(s) disclaim responsibility for any injury to people or property resulting from any ideas, methods, instructions or products referred to in the content. |
© 2023 by the authors. Licensee MDPI, Basel, Switzerland. This article is an open access article distributed under the terms and conditions of the Creative Commons Attribution (CC BY) license (https://creativecommons.org/licenses/by/4.0/).


