Single-Cell RNA Sequencing in Organ and Cell Transplantation


Abstract
:1. Introduction
2. Single-Cell RNA Sequencing
2.1. Single-Cell Isolation Methods
2.1.1. FACS
2.1.2. Micromanipulation
2.1.3. Passive Hydrodynamic Trap-Based Microfluidics
2.1.4. Active Cell Manipulation Microfluidics
2.1.5. Valve-Based Microfluidics
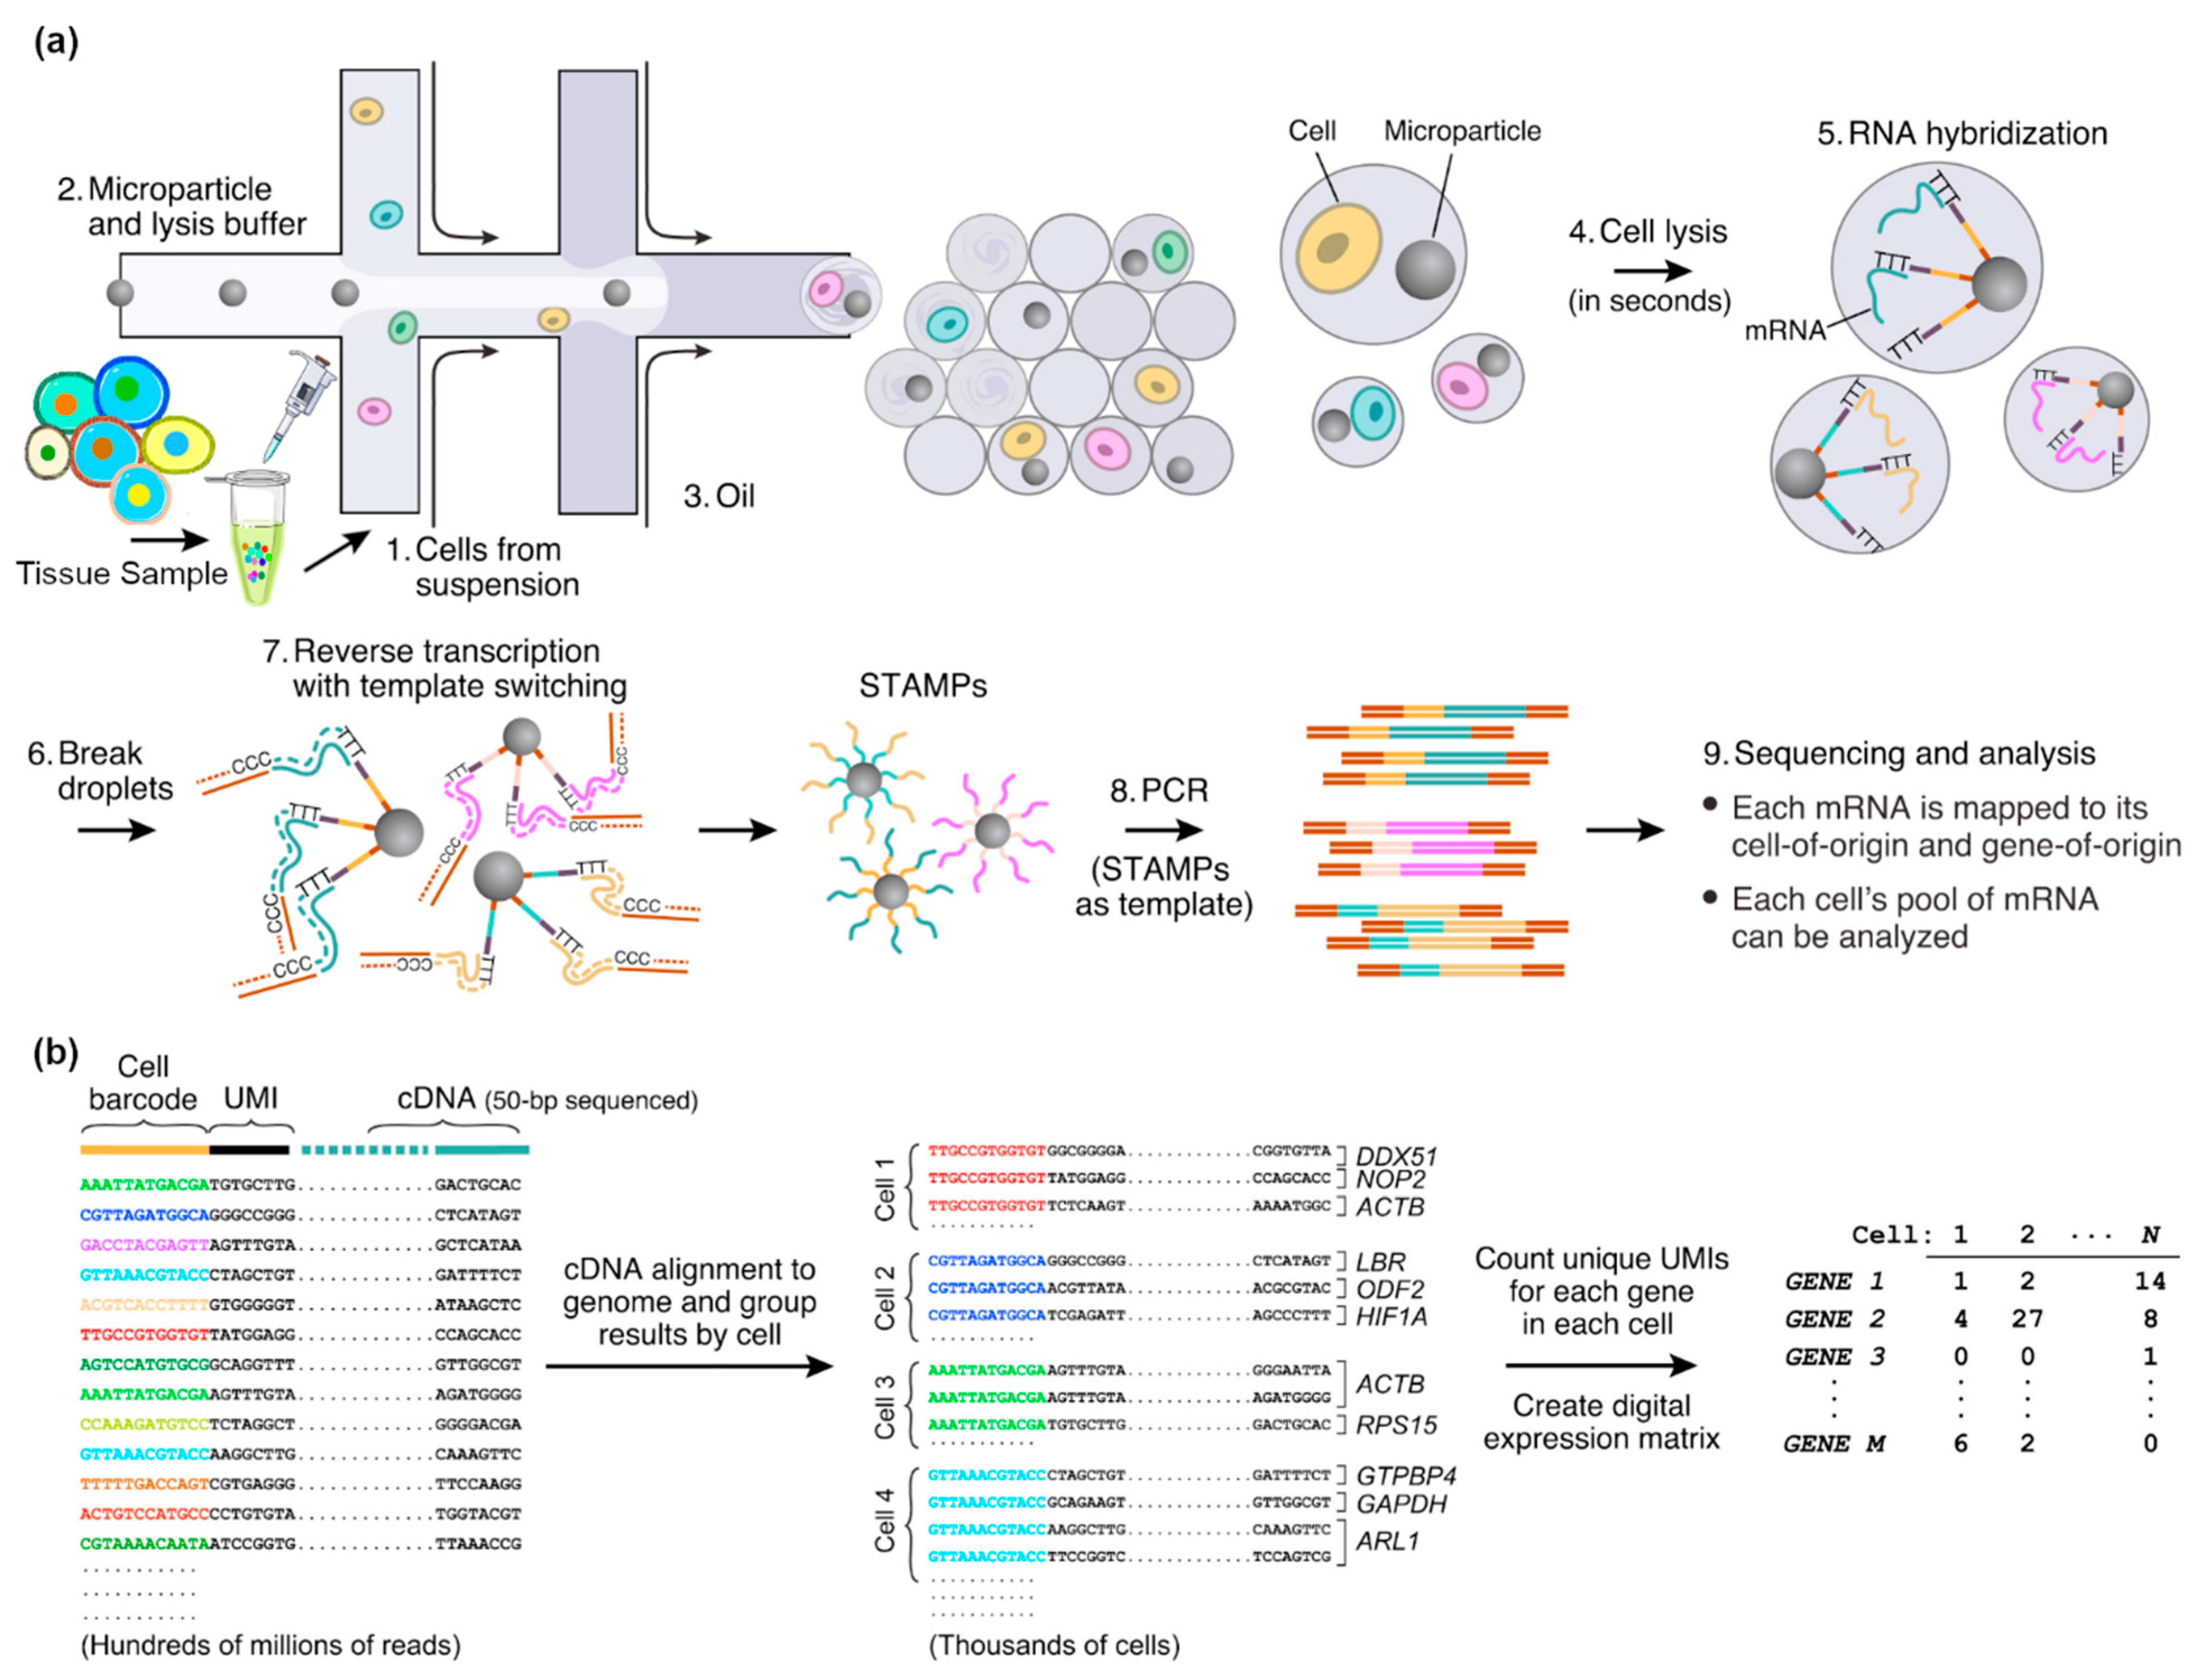
2.1.6. Droplet-Based Microfluidics
2.2. scRNA-Seq Methods
3. Single-Cell RNA Sequencing in Organ Transplantation
3.1. Heart Transplantation
3.2. Kidney Transplantation
3.3. Lung Transplantation
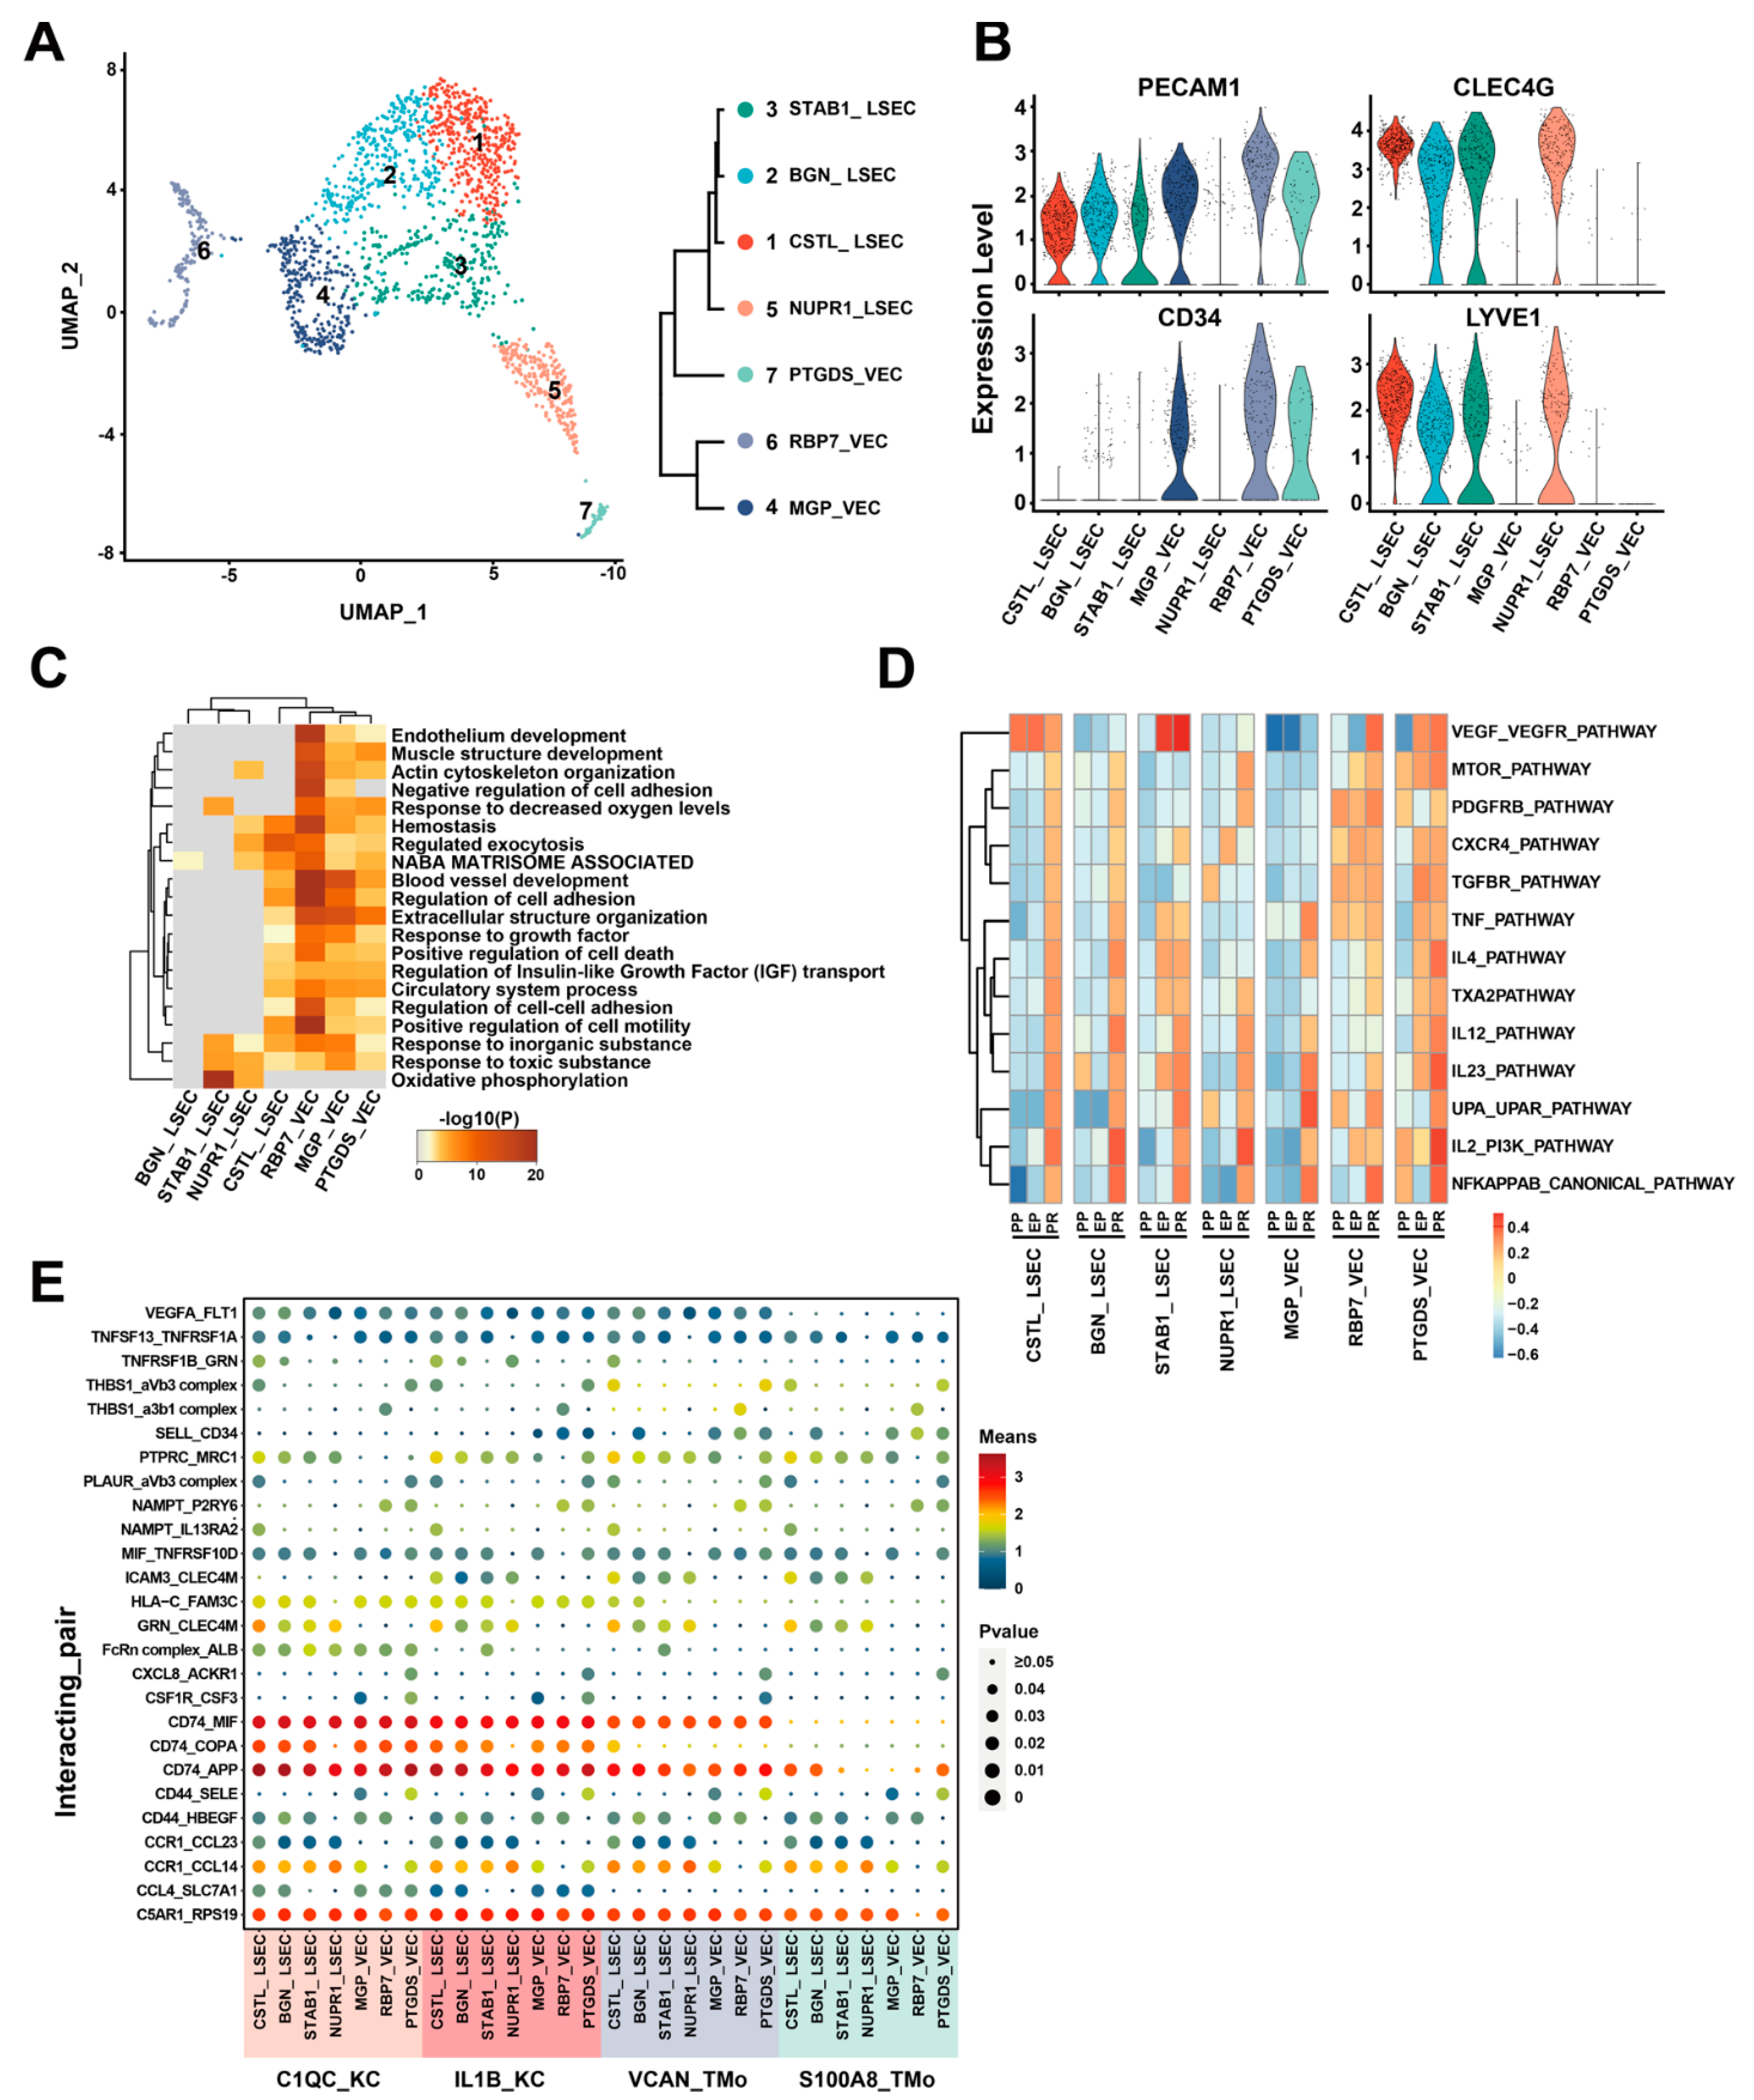
3.4. Liver Transplantation
3.5. Other Transplants
4. Stem Cell Transplantation
5. Tumor Transplantation
6. Conclusions
Funding
Data Availability Statement
Conflicts of Interest
References
- Jia, Q.; Chu, H.; Jin, Z.; Long, H.; Zhu, B. High-throughput single-cell sequencing in cancer research. Signal Transduct. Target. Ther. 2022, 7, 145. [Google Scholar] [CrossRef] [PubMed]
- Eum, H.H.; Jeong, D.; Kim, N.; Jo, A.; Na, M.; Kang, H.; Hong, Y.; Kong, J.S.; Jeong, G.H.; Yoo, S.A.; et al. Single-cell RNA sequencing reveals myeloid and T cell co-stimulation mediated by IL-7 anti-cancer immunotherapy. Br. J. Cancer 2024. [Google Scholar] [CrossRef] [PubMed]
- Eze, U.C.; Bhaduri, A.; Haeussler, M.; Nowakowski, T.J.; Kriegstein, A.R. Single-cell atlas of early human brain development highlights heterogeneity of human neuroepithelial cells and early radial glia. Nat. Neurosci. 2021, 24, 584–594. [Google Scholar] [CrossRef] [PubMed]
- Dopp, J.; Ortega, A.; Davie, K.; Poovathingal, S.; Baz, E.-S.; Liu, S. Single-cell transcriptomics reveals that glial cells integrate homeostatic and circadian processes to drive sleep–wake cycles. Nat. Neurosci. 2024, 27, 359–372. [Google Scholar] [CrossRef] [PubMed]
- Wu, H.; Malone, A.F.; Donnelly, E.L.; Kirita, Y.; Uchimura, K.; Ramakrishnan, S.M.; Gaut, J.P.; Humphreys, B.D. Single-Cell Transcriptomics of a Human Kidney Allograft Biopsy Specimen Defines a Diverse Inflammatory Response. J. Am. Soc. Nephrol. 2018, 29, 2069–2080. [Google Scholar] [CrossRef] [PubMed]
- Papalexi, E.; Satija, R. Single-cell RNA sequencing to explore immune cell heterogeneity. Nat. Rev. Immunol. 2018, 18, 35–45. [Google Scholar] [CrossRef] [PubMed]
- Tang, Y.; Wang, J.; Zhang, Y.; Li, J.; Chen, M.; Gao, Y.; Dai, M.; Lin, S.; He, X.; Wu, C.; et al. Single-Cell RNA Sequencing Identifies Intra-Graft Population Heterogeneity in Acute Heart Allograft Rejection in Mouse. Front. Immunol. 2022, 13, 832573. [Google Scholar] [CrossRef] [PubMed]
- Thareja, G.; Muthukumar, T. Partners in Crime: Inferring Cell-to-cell Interactions in Kidney Allograft Rejection from Single-cell RNA Sequencing. Transplantation 2024, 108, 325–326. [Google Scholar] [CrossRef]
- Elmentaite, R.; Ross, A.D.B.; Roberts, K.; James, K.R.; Ortmann, D.; Gomes, T.; Nayak, K.; Tuck, L.; Pritchard, S.; Bayraktar, O.A.; et al. Single-Cell Sequencing of Developing Human Gut Reveals Transcriptional Links to Childhood Crohn’s Disease. Dev. Cell 2020, 55, 771–783.e5. [Google Scholar] [CrossRef]
- Bye, C.R.; Penna, V.; de Luzy, I.R.; Gantner, C.W.; Hunt, C.P.J.; Thompson, L.H.; Parish, C.L. Transcriptional Profiling of Xenogeneic Transplants: Examining Human Pluripotent Stem Cell-Derived Grafts in the Rodent Brain. Stem Cell Rep. 2019, 13, 877–890. [Google Scholar] [CrossRef]
- Abedini-Nassab, R.; Pouryosef Miandoab, M.; Sasmaz, M. Microfluidic Synthesis, Control, and Sensing of Magnetic Nanoparticles: A Review. Micromachines 2021, 12, 768. [Google Scholar] [CrossRef] [PubMed]
- Mantri, M.; Scuderi, G.J.; Abedini-Nassab, R.; Wang, M.F.Z.; McKellar, D.; Shi, H.; Grodner, B.; Butcher, J.T.; De Vlaminck, I. Spatiotemporal single-cell RNA sequencing of developing chicken hearts identifies interplay between cellular differentiation and morphogenesis. Nat. Commun. 2021, 12, 1771. [Google Scholar] [CrossRef] [PubMed]
- Buchwald, J.E.; Martins, P.N. Designer organs: The future of personalized transplantation. Artif. Organs 2022, 46, 180–190. [Google Scholar] [CrossRef] [PubMed]
- Shi, T.; Roskin, K.; Baker, B.M.; Woodle, E.S.; Hildeman, D. Advanced Genomics-Based Approaches for Defining Allograft Rejection with Single Cell Resolution. Front. Immunol. 2021, 12, 750754. [Google Scholar] [CrossRef]
- Raza, S.S.; Wagner, A.P.; Hussain, Y.S.; Khan, M.A. Mechanisms underlying dental-derived stem cell-mediated neurorestoration in neurodegenerative disorders. Stem Cell Res. Ther. 2018, 9, 245. [Google Scholar] [CrossRef] [PubMed]
- McCauley, H.A.; Guasch, G. Serial orthotopic transplantation of epithelial tumors in single-cell suspension. Methods Mol. Biol. 2013, 1035, 231–245. [Google Scholar] [CrossRef] [PubMed]
- Kim, H.K.; Ha, T.W.; Lee, M.R. Single-Cell Transcriptome Analysis as a Promising Tool to Study Pluripotent Stem Cell Reprogramming. Int. J. Mol. Sci. 2021, 22, 5988. [Google Scholar] [CrossRef] [PubMed]
- Herzenberg, L.A.; Parks, D.; Sahaf, B.; Perez, O.; Roederer, M.; Herzenberg, L.A. The history and future of the fluorescence activated cell sorter and flow cytometry: A view from Stanford. Clin. Chem. 2002, 48, 1819–1827. [Google Scholar] [CrossRef] [PubMed]
- Bonner, W.A.; Hulett, H.R.; Sweet, R.G.; Herzenberg, L.A. Fluorescence activated cell sorting. Rev. Sci. Instrum. 1972, 43, 404–409. [Google Scholar] [CrossRef]
- McKinnon, K.M. Flow Cytometry: An Overview. Curr. Protoc. Immunol. 2018, 120, 5.1.1–5.1.11. [Google Scholar] [CrossRef]
- Koike, Y.; Kodera, S.; Yokoyama, Y.; Hayakawa, T. Real-time irradiation system using patterned light to actuate light-driven on-chip gel actuators. Robomech J. 2022, 9, 5. [Google Scholar] [CrossRef]
- Adam, G.; Chidambaram, S.; Reddy, S.S.; Ramani, K.; Cappelleri, D.J. Towards a Comprehensive and Robust Micromanipulation System with Force-Sensing and VR Capabilities. Micromachines 2021, 12, 784. [Google Scholar] [CrossRef] [PubMed]
- Kato, Y.; Matsumoto, T.; Kino-Oka, M. Effect of liquid flow by pipetting during medium change on deformation of hiPSC aggregates. Regen. Ther. 2019, 12, 20–26. [Google Scholar] [CrossRef] [PubMed]
- Di Carlo, D.; Wu, L.Y.; Lee, L.P. Dynamic single cell culture array. Lab. Chip 2006, 6, 1445–1449. [Google Scholar] [CrossRef] [PubMed]
- Narayanamurthy, V.; Nagarajan, S.; Firus Khan, A.Y.; Samsuri, F.; Sridhar, T.M. Microfluidic hydrodynamic trapping for single cell analysis: Mechanisms, methods and applications. Anal. Methods 2017, 9, 3751–3772. [Google Scholar] [CrossRef]
- Luan, Q.; Macaraniag, C.; Zhou, J.; Papautsky, I. Microfluidic systems for hydrodynamic trapping of cells and clusters. Biomicrofluidics 2020, 14, 031502. [Google Scholar] [CrossRef] [PubMed]
- Abedini-Nassab, R. Magnetophoretic Circuit Biocompatibility. J. Mech. Med. Biol. 2020, 20, 2050050. [Google Scholar] [CrossRef]
- Ahmadi, F.; Tran, H.; Letourneau, N.; Little, S.R.; Fortin, A.; Moraitis, A.N.; Shih, S.C.C. An Automated Single-Cell Droplet-Digital Microfluidic Platform for Monoclonal Antibody Discovery. Small 2024. [Google Scholar] [CrossRef] [PubMed]
- Abedini-Nassab, R.; Mahdaviyan, N. A Microfluidic Platform Equipped with Magnetic Nano Films for Organizing Bio-Particle Arrays and Long-Term Studies. IEEE Sens. J. 2020, 20, 9668–9676. [Google Scholar] [CrossRef]
- Abedini-Nassab, R.; Shourabi, R. High-throughput precise particle transport at single-particle resolution in a three-dimensional magnetic field for highly sensitive bio-detection. Sci. Rep. 2022, 12, 6380. [Google Scholar] [CrossRef]
- Zhang, Y.; Zhou, A.; Chen, S.; Lum, G.Z.; Zhang, X. A perspective on magnetic microfluidics: Towards an intelligent future. Biomicrofluidics 2022, 16, 011301. [Google Scholar] [CrossRef] [PubMed]
- Xu, H.; Liao, C.; Zuo, P.; Liu, Z.; Ye, B.C. Magnetic-Based Microfluidic Device for On-Chip Isolation and Detection of Tumor-Derived Exosomes. Anal. Chem. 2018, 90, 13451–13458. [Google Scholar] [CrossRef]
- Abedini-Nassab, R.; Ding, X.; Xie, H. A novel magnetophoretic-based device for magnetometry and separation of single magnetic particles and magnetized cells. Lab. Chip 2022, 22, 738–746. [Google Scholar] [CrossRef] [PubMed]
- Sadeghidelouei, N.; Abedini-Nassab, R. Unidirectional particle transport in microfluidic chips operating in a tri-axial magnetic field for particle concentration and bio-analyte detection. Microfluid. Nanofluidics 2023, 28, 6. [Google Scholar] [CrossRef]
- Yu, E.S.; Lee, H.; Lee, S.M.; Kim, J.; Kim, T.; Lee, J.; Kim, C.; Seo, M.; Kim, J.H.; Byun, Y.T.; et al. Precise capture and dynamic relocation of nanoparticulate biomolecules through dielectrophoretic enhancement by vertical nanogap architectures. Nat. Commun. 2020, 11, 2804. [Google Scholar] [CrossRef]
- Punjiya, M.; Nejad, H.R.; Mathews, J.; Levin, M.; Sonkusale, S. A flow through device for simultaneous dielectrophoretic cell trapping and AC electroporation. Sci. Rep. 2019, 9, 11988. [Google Scholar] [CrossRef]
- Mugele, F.; Baret, J.-C. Electrowetting: From basics to applications. J. Physics Condens. Matter 2005, 17, R705. [Google Scholar] [CrossRef]
- Abedini-Nassab, R.; Wirfel, J.; Talebjedi, B.; Tasnim, N.; Hoorfar, M. Quantifying the dielectrophoretic force on colloidal particles in microfluidic devices. Microfluid. Nanofluidics 2022, 26, 38. [Google Scholar] [CrossRef]
- Yang, S.; Rufo, J.; Zhong, R.; Rich, J.; Wang, Z.; Lee, L.P.; Huang, T.J. Acoustic tweezers for high-throughput single-cell analysis. Nat. Protoc. 2023, 18, 2441–2458. [Google Scholar] [CrossRef]
- Abedini-Nassab, R.; Emami, S.M.; Nowghabi, A.N. Nanotechnology and Acoustics in Medicine and Biology. Recent Pat. Nanotechnol. 2022, 16, 198–206. [Google Scholar] [CrossRef]
- Rufo, J.; Cai, F.; Friend, J.; Wiklund, M.; Huang, T.J. Acoustofluidics for biomedical applications. Nat. Rev. Methods Primers 2022, 2, 30. [Google Scholar] [CrossRef]
- Zhang, Y.; Chen, X. Particle separation in microfluidics using different modal ultrasonic standing waves. Ultrason. Sonochem. 2021, 75, 105603. [Google Scholar] [CrossRef]
- Ohiri, K.A.; Kelly, S.T.; Motschman, J.D.; Lin, K.H.; Wood, K.C.; Yellen, B.B. An acoustofluidic trap and transfer approach for organizing a high density single cell array. Lab. Chip 2018, 18, 2124–2133. [Google Scholar] [CrossRef]
- Volpe, G.; Maragò, O.M.; Rubinsztein-Dunlop, H.; Pesce, G.; Stilgoe, A.B.; Volpe, G.; Tkachenko, G.; Truong, V.G.; Chormaic, S.N.; Kalantarifard, F.; et al. Roadmap for optical tweezers. J. Phys. Photonics 2023, 5, 022501. [Google Scholar] [CrossRef]
- Wang, M.M.; Tu, E.; Raymond, D.E.; Yang, J.M.; Zhang, H.; Hagen, N.; Dees, B.; Mercer, E.M.; Forster, A.H.; Kariv, I.; et al. Microfluidic sorting of mammalian cells by optical force switching. Nat. Biotechnol. 2005, 23, 83–87. [Google Scholar] [CrossRef] [PubMed]
- Yang, Y.; Mao, Y.; Shin, K.S.; Chui, C.O.; Chiou, P.Y. Self-Locking Optoelectronic Tweezers for Single-Cell and Microparticle Manipulation across a Large Area in High Conductivity Media. Sci. Rep. 2016, 6, 22630. [Google Scholar] [CrossRef] [PubMed]
- Schraivogel, D.; Kuhn, T.M.; Rauscher, B.; Rodriguez-Martinez, M.; Paulsen, M.; Owsley, K.; Middlebrook, A.; Tischer, C.; Ramasz, B.; Ordonez-Rueda, D.; et al. High-speed fluorescence image-enabled cell sorting. Science 2022, 375, 315–320. [Google Scholar] [CrossRef] [PubMed]
- Valle, M.; O’Brien, B.; Green, T.D.; Reiner, J.E.; Seashols-Williams, S. Droplet-based optical trapping for cell separation in mock forensic samples. J. Forensic Sci. 2024, 69, 273–281. [Google Scholar] [CrossRef] [PubMed]
- Schneckenburger, H.; Hendinger, A.; Sailer, R.; Gschwend, M.H.; Strauss, W.S.; Bauer, M.; Schütze, K. Cell viability in optical tweezers: High power red laser diode versus Nd:YAG laser. J. Biomed. Opt. 2000, 5, 40–44. [Google Scholar] [CrossRef]
- Konishi, S.; Ohya, C.; Yamada, T. Selective control of the contact and transport between droplet pairs by electrowetting-on-dielectric for droplet-array sandwiching technology. Sci. Rep. 2021, 11, 12355. [Google Scholar] [CrossRef]
- Vallet, M.; Berge, B.; Vovelle, L. Electrowetting of water and aqueous solutions on poly(ethylene terephthalate) insulating films. Polymer 1996, 37, 2465–2470. [Google Scholar] [CrossRef]
- Abedini-Nassab, R.; Sadeghidelouei, N.; Shields Iv, C.W. Magnetophoretic circuits: A review of device designs and implementation for precise single-cell manipulation. Anal. Chim. Acta 2023, 1272, 341425. [Google Scholar] [CrossRef] [PubMed]
- Abedini-Nassab, R. Magnetomicrofluidic Circuits for Single-Bioparticle Transport; Springer Nature: Singapore, 2023. [Google Scholar]
- Abedini-Nassab, R. Magnetomicrofluidic Platforms for Organizing Arrays of Single-Particles and Particle-Pairs. J. Microelectromech. Syst. 2019, 28, 732–738. [Google Scholar] [CrossRef]
- Dashti, R.; Abedini-Nassab, R. A High-Throughput Hybrid Electromicrofluidic Platform for Organizing Single-Cell Protein Secretion Profiling Assays. IEEE Sens. J. 2024, 24, 7448–7455. [Google Scholar] [CrossRef]
- Au, A.K.; Lai, H.; Utela, B.R.; Folch, A. Microvalves and Micropumps for BioMEMS. Micromachines 2011, 2, 179–220. [Google Scholar] [CrossRef]
- Studer, V.; Hang, G.; Pandolfi, A.; Ortiz, M.; French Anderson, W.; Quake, S.R. Scaling properties of a low-actuation pressure microfluidic valve. J. Appl. Phys. 2003, 95, 393–398. [Google Scholar] [CrossRef]
- Thorsen, T.; Maerkl, S.J.; Quake, S.R. Microfluidic large-scale integration. Science 2002, 298, 580–584. [Google Scholar] [CrossRef] [PubMed]
- Marcus, J.S.; Anderson, W.F.; Quake, S.R. Microfluidic single-cell mRNA isolation and analysis. Anal. Chem. 2006, 78, 3084–3089. [Google Scholar] [CrossRef]
- Macosko, E.Z.; Basu, A.; Satija, R.; Nemesh, J.; Shekhar, K.; Goldman, M.; Tirosh, I.; Bialas, A.R.; Kamitaki, N.; Martersteck, E.M.; et al. Highly Parallel Genome-wide Expression Profiling of Individual Cells Using Nanoliter Droplets. Cell 2015, 161, 1202–1214. [Google Scholar] [CrossRef]
- Jain, A.; Stavrakis, S.; deMello, A. Droplet-based microfluidics and enzyme evolution. Curr. Opin. Biotechnol. 2024, 87, 103097. [Google Scholar] [CrossRef]
- Nan, L.; Zhang, H.; Weitz, D.A.; Shum, H.C. Development and future of droplet microfluidics. Lab. Chip 2024, 24, 1135–1153. [Google Scholar] [CrossRef] [PubMed]
- Shi, J.; Zhang, Y.; Fan, Y.; Liu, Y.; Yang, M. Recent advances in droplet-based microfluidics in liquid biopsy for cancer diagnosis. Droplet 2024, 3, e92. [Google Scholar] [CrossRef]
- Zhang, J.; Xu, W.; Xu, F.; Lu, W.; Hu, L.; Zhou, J.; Zhang, C.; Jiang, Z. Microfluidic droplet formation in co-flow devices fabricated by micro 3D printing. J. Food Eng. 2021, 290, 110212. [Google Scholar] [CrossRef]
- Cramer, C.; Fischer, P.; Windhab, E.J. Drop formation in a co-flowing ambient fluid. Chem. Eng. Sci. 2004, 59, 3045–3058. [Google Scholar] [CrossRef]
- Yao, J.; Lin, F.; Kim, H.S.; Park, J. The Effect of Oil Viscosity on Droplet Generation Rate and Droplet Size in a T-Junction Microfluidic Droplet Generator. Micromachines 2019, 10, 808. [Google Scholar] [CrossRef] [PubMed]
- Ushikubo, F.Y.; Birribilli, F.S.; Oliveira, D.R.B.; Cunha, R.L. Y- and T-junction microfluidic devices: Effect of fluids and interface properties and operating conditions. Microfluid. Nanofluidics 2014, 17, 711–720. [Google Scholar] [CrossRef]
- Garstecki, P.; Fuerstman, M.J.; Stone, H.A.; Whitesides, G.M. Formation of droplets and bubbles in a microfluidic T-junction—Scaling and mechanism of break-up. Lab. Chip 2006, 6, 437–446. [Google Scholar] [CrossRef] [PubMed]
- Yin, Z.; Huang, Z.; Lin, X.; Gao, X.; Bao, F. Droplet Generation in a Flow-Focusing Microfluidic Device with External Mechanical Vibration. Micromachines 2020, 11, 743. [Google Scholar] [CrossRef]
- Dewandre, A.; Rivero-Rodriguez, J.; Vitry, Y.; Sobac, B.; Scheid, B. Microfluidic droplet generation based on non-embedded co-flow-focusing using 3D printed nozzle. Sci. Rep. 2020, 10, 21616. [Google Scholar] [CrossRef]
- Bageritz, J.; Raddi, G. Single-Cell RNA Sequencing with Drop-Seq. Methods Mol. Biol. 2019, 1979, 73–85. [Google Scholar] [CrossRef]
- Klein, A.M.; Mazutis, L.; Akartuna, I.; Tallapragada, N.; Veres, A.; Li, V.; Peshkin, L.; Weitz, D.A.; Kirschner, M.W. Droplet barcoding for single-cell transcriptomics applied to embryonic stem cells. Cell 2015, 161, 1187–1201. [Google Scholar] [CrossRef] [PubMed]
- Lu, Y.; Shiau, F.; Yi, W.; Lu, S.; Wu, Q.; Pearson, J.D.; Kallman, A.; Zhong, S.; Hoang, T.; Zuo, Z.; et al. Single-Cell Analysis of Human Retina Identifies Evolutionarily Conserved and Species-Specific Mechanisms Controlling Development. Dev. Cell 2020, 53, 473–491.e9. [Google Scholar] [CrossRef] [PubMed]
- Gierahn, T.M.; Wadsworth, M.H.; Hughes, T.K.; Bryson, B.D.; Butler, A.; Satija, R.; Fortune, S.; Love, J.C.; Shalek, A.K. Seq-Well: Portable, low-cost RNA sequencing of single cells at high throughput. Nat. Methods 2017, 14, 395–398. [Google Scholar] [CrossRef] [PubMed]
- Ramskold, D.; Luo, S.; Wang, Y.C.; Li, R.; Deng, Q.; Faridani, O.R.; Daniels, G.A.; Khrebtukova, I.; Loring, J.F.; Laurent, L.C.; et al. Author Correction: Full-length mRNA-Seq from single-cell levels of RNA and individual circulating tumor cells. Nat. Biotechnol. 2020, 38, 374. [Google Scholar] [CrossRef] [PubMed]
- Isakova, A.; Neff, N.; Quake, S.R. Single-cell quantification of a broad RNA spectrum reveals unique noncoding patterns associated with cell types and states. Proc. Natl. Acad. Sci. USA 2021, 118, e2113568118. [Google Scholar] [CrossRef] [PubMed]
- Picelli, S.; Faridani, O.R.; Björklund, Å.K.; Winberg, G.; Sagasser, S.; Sandberg, R. Full-length RNA-seq from single cells using Smart-seq2. Nat. Protoc. 2014, 9, 171–181. [Google Scholar] [CrossRef] [PubMed]
- Picelli, S.; Björklund, Å.K.; Faridani, O.R.; Sagasser, S.; Winberg, G.; Sandberg, R. Smart-seq2 for sensitive full-length transcriptome profiling in single cells. Nat. Methods 2013, 10, 1096–1098. [Google Scholar] [CrossRef] [PubMed]
- Hagemann-Jensen, M.; Ziegenhain, C.; Chen, P.; Ramsköld, D.; Hendriks, G.-J.; Larsson, A.J.M.; Faridani, O.R.; Sandberg, R. Single-cell RNA counting at allele and isoform resolution using Smart-seq3. Nat. Biotechnol. 2020, 38, 708–714. [Google Scholar] [CrossRef] [PubMed]
- Cao, J.; Packer, J.S.; Ramani, V.; Cusanovich, D.A.; Huynh, C.; Daza, R.; Qiu, X.; Lee, C.; Furlan, S.N.; Steemers, F.J.; et al. Comprehensive single-cell transcriptional profiling of a multicellular organism. Science 2017, 357, 661–667. [Google Scholar] [CrossRef]
- Sheng, K.; Cao, W.; Niu, Y.; Deng, Q.; Zong, C. Effective detection of variation in single-cell transcriptomes using MATQ-seq. Nat. Methods 2017, 14, 267–270. [Google Scholar] [CrossRef]
- Hashimshony, T.; Wagner, F.; Sher, N.; Yanai, I. CEL-Seq: Single-cell RNA-Seq by multiplexed linear amplification. Cell Rep. 2012, 2, 666–673. [Google Scholar] [CrossRef] [PubMed]
- Hashimshony, T.; Senderovich, N.; Avital, G.; Klochendler, A.; de Leeuw, Y.; Anavy, L.; Gennert, D.; Li, S.; Livak, K.J.; Rozenblatt-Rosen, O.; et al. CEL-Seq2: Sensitive highly-multiplexed single-cell RNA-Seq. Genome Biol. 2016, 17, 77. [Google Scholar] [CrossRef] [PubMed]
- Branton, D.; Deamer, D.W.; Marziali, A.; Bayley, H.; Benner, S.A.; Butler, T.; Di Ventra, M.; Garaj, S.; Hibbs, A.; Huang, X.; et al. The potential and challenges of nanopore sequencing. Nat. Biotechnol. 2008, 26, 1146–1153. [Google Scholar] [CrossRef] [PubMed]
- Philpott, M.; Watson, J.; Thakurta, A.; Brown, T., Jr.; Brown, T., Sr.; Oppermann, U.; Cribbs, A.P. Nanopore sequencing of single-cell transcriptomes with scCOLOR-seq. Nat. Biotechnol. 2021, 39, 1517–1520. [Google Scholar] [CrossRef]
- Shiau, C.K.; Lu, L.; Kieser, R.; Fukumura, K.; Pan, T.; Lin, H.Y.; Yang, J.; Tong, E.L.; Lee, G.; Yan, Y.; et al. High throughput single cell long-read sequencing analyses of same-cell genotypes and phenotypes in human tumors. Nat. Commun. 2023, 14, 4124. [Google Scholar] [CrossRef]
- Abedini-Nassab, R. Nanotechnology and Nanopore Sequencing. Recent. Pat. Nanotechnol. 2017, 11, 34–41. [Google Scholar] [CrossRef] [PubMed]
- Wang, Y.; Zhao, Y.; Bollas, A.; Wang, Y.; Au, K.F. Nanopore sequencing technology, bioinformatics and applications. Nat. Biotechnol. 2021, 39, 1348–1365. [Google Scholar] [CrossRef] [PubMed]
- Louie, S.M.; Moye, A.L.; Wong, I.G.; Lu, E.; Shehaj, A.; Garcia-de-Alba, C.; Ararat, E.; Raby, B.A.; Lu, B.; Paschini, M.; et al. Progenitor potential of lung epithelial organoid cells in a transplantation model. Cell Rep. 2022, 39, 110662. [Google Scholar] [CrossRef]
- Kono, N.; Arakawa, K. Nanopore sequencing: Review of potential applications in functional genomics. Dev. Growth Differ. 2019, 61, 316–326. [Google Scholar] [CrossRef]
- Koenig, A.L.; Shchukina, I.; Amrute, J.; Andhey, P.S.; Zaitsev, K.; Lai, L.; Bajpai, G.; Bredemeyer, A.; Smith, G.; Jones, C.; et al. Single-cell transcriptomics reveals cell-type-specific diversification in human heart failure. Nat. Cardiovasc. Res. 2022, 1, 263–280. [Google Scholar] [CrossRef]
- Paik, D.T.; Tian, L.; Williams, I.M.; Rhee, S.; Zhang, H.; Liu, C.; Mishra, R.; Wu, S.M.; Red-Horse, K.; Wu, J.C. Single-Cell RNA Sequencing Unveils Unique Transcriptomic Signatures of Organ-Specific Endothelial Cells. Circulation 2020, 142, 1848–1862. [Google Scholar] [CrossRef] [PubMed]
- Cai, J.; Deng, J.; Gu, W.; Ni, Z.; Liu, Y.; Kamra, Y.; Saxena, A.; Hu, Y.; Yuan, H.; Xiao, Q.; et al. Impact of Local Alloimmunity and Recipient Cells in Transplant Arteriosclerosis. Circ. Res. 2020, 127, 974–993. [Google Scholar] [CrossRef] [PubMed]
- Kopecky, B.J.; Dun, H.; Amrute, J.M.; Lin, C.Y.; Bredemeyer, A.L.; Terada, Y.; Bayguinov, P.O.; Koenig, A.L.; Frye, C.C.; Fitzpatrick, J.A.J.; et al. Donor Macrophages Modulate Rejection after Heart Transplantation. Circulation 2022, 146, 623–638. [Google Scholar] [CrossRef]
- Hu, Z.; Liu, W.; Hua, X.; Chen, X.; Chang, Y.; Hu, Y.; Xu, Z.; Song, J. Single-Cell Transcriptomic Atlas of Different Human Cardiac Arteries Identifies Cell Types Associated with Vascular Physiology. Arterioscler. Thromb. Vasc. Biol. 2021, 41, 1408–1427. [Google Scholar] [CrossRef] [PubMed]
- Anto Michel, N.; Ljubojevic-Holzer, S.; Bugger, H.; Zirlik, A. Cellular Heterogeneity of the Heart. Front. Cardiovasc. Med. 2022, 9, 868466. [Google Scholar] [CrossRef] [PubMed]
- Wan, J.; Zhang, Z.; Tian, S.; Huang, S.; Jin, H.; Liu, X.; Zhang, W. Single cell study of cellular diversity and mutual communication in chronic heart failure and drug repositioning. Genomics 2022, 114, 110322. [Google Scholar] [CrossRef]
- Chen, Z.; Xu, H.; Li, Y.; Zhang, X.; Cui, J.; Zou, Y.; Yu, J.; Wu, J.; Xia, J. Single-Cell RNA sequencing reveals immune cell dynamics and local intercellular communication in acute murine cardiac allograft rejection. Theranostics 2022, 12, 6242–6257. [Google Scholar] [CrossRef] [PubMed]
- Martini, E.; Kunderfranco, P.; Peano, C.; Carullo, P.; Cremonesi, M.; Schorn, T.; Carriero, R.; Termanini, A.; Colombo, F.S.; Jachetti, E.; et al. Single-Cell Sequencing of Mouse Heart Immune Infiltrate in Pressure Overload–Driven Heart Failure Reveals Extent of Immune Activation. Circulation 2019, 140, 2089–2107. [Google Scholar] [CrossRef]
- Kong, D.; Huang, S.; Miao, X.; Li, J.; Wu, Z.; Shi, Y.; Liu, H.; Jiang, Y.; Yu, X.; Xie, M.; et al. The dynamic cellular landscape of grafts with acute rejection after heart transplantation. J. Heart Lung Transplant. 2023, 42, 160–172. [Google Scholar] [CrossRef]
- Jung, Y.; Kim, J.; Jang, H.; Kim, G.; Kwon, Y.-W. Strategy of Patient-Specific Therapeutics in Cardiovascular Disease through Single-Cell RNA Sequencing. Korean Circ. J. 2023, 53, 1–16. [Google Scholar] [CrossRef]
- Loupy, A.; Duong Van Huyen, J.P.; Hidalgo, L.; Reeve, J.; Racapé, M.; Aubert, O.; Venner, J.M.; Falmuski, K.; Bories, M.C.; Beuscart, T.; et al. Gene Expression Profiling for the Identification and Classification of Antibody-Mediated Heart Rejection. Circulation 2017, 135, 917–935. [Google Scholar] [CrossRef] [PubMed]
- Hua, X.; Hu, G.; Hu, Q.; Chang, Y.; Hu, Y.; Gao, L.; Chen, X.; Yang, P.-C.; Zhang, Y.; Li, M.; et al. Single-Cell RNA Sequencing to Dissect the Immunological Network of Autoimmune Myocarditis. Circulation 2020, 142, 384–400. [Google Scholar] [CrossRef]
- Yang, L.; Zhu, Y.; Tian, D.; Wang, S.; Guo, J.; Sun, G.; Jin, H.; Zhang, C.; Shi, W.; Gershwin, M.E.; et al. Transcriptome landscape of double negative T cells by single-cell RNA sequencing. J. Autoimmun. 2021, 121, 102653. [Google Scholar] [CrossRef]
- Schumacher, D.; Kramann, R. Multiomic Spatial Mapping of Myocardial Infarction and Implications for Personalized Therapy. Arterioscler. Thromb. Vasc. Biol. 2023, 43, 192–202. [Google Scholar] [CrossRef]
- Clark, A.R.; Greka, A. The power of one: Advances in single-cell genomics in the kidney. Nat. Rev. Nephrol. 2020, 16, 73–74. [Google Scholar] [CrossRef]
- Wilson, P.C.; Wu, H.; Kirita, Y.; Uchimura, K.; Ledru, N.; Rennke, H.G.; Welling, P.A.; Waikar, S.S.; Humphreys, B.D. The single-cell transcriptomic landscape of early human diabetic nephropathy. Proc. Natl. Acad. Sci. USA 2019, 116, 19619–19625. [Google Scholar] [CrossRef] [PubMed]
- Young, M.D.; Mitchell, T.J.; Vieira Braga, F.A.; Tran, M.G.B.; Stewart, B.J.; Ferdinand, J.R.; Collord, G.; Botting, R.A.; Popescu, D.M.; Loudon, K.W.; et al. Single-cell transcriptomes from human kidneys reveal the cellular identity of renal tumors. Science 2018, 361, 594–599. [Google Scholar] [CrossRef]
- Muto, Y.; Wilson, P.C.; Ledru, N.; Wu, H.; Dimke, H.; Waikar, S.S.; Humphreys, B.D. Single cell transcriptional and chromatin accessibility profiling redefine cellular heterogeneity in the adult human kidney. Nat. Commun. 2021, 12, 2190. [Google Scholar] [CrossRef] [PubMed]
- Shen, Q.; Wang, Y.; Chen, J.; Ma, L.; Huang, X.; Tang, S.C.W.; Lan, H.; Jiang, H. Single-Cell RNA Sequencing Reveals the Immunological Profiles of Renal Allograft Rejection in Mice. Front. Immunol. 2021, 12, 693608. [Google Scholar] [CrossRef]
- Shi, T.; Burg, A.R.; Caldwell, J.T.; Roskin, K.M.; Castro-Rojas, C.M.; Chukwuma, P.C.; Gray, G.I.; Foote, S.G.; Alonso, J.A.; Cuda, C.M.; et al. Single-cell transcriptomic analysis of renal allograft rejection reveals insights into intragraft TCR clonality. J. Clin. Investig. 2023, 133, e170191. [Google Scholar] [CrossRef]
- Malone, A.F.; Wu, H.; Fronick, C.; Fulton, R.; Gaut, J.P.; Humphreys, B.D. Harnessing Expressed Single Nucleotide Variation and Single Cell RNA Sequencing To Define Immune Cell Chimerism in the Rejecting Kidney Transplant. J. Am. Soc. Nephrol. 2020, 31, 1977–1986. [Google Scholar] [CrossRef] [PubMed]
- Liu, Y.; Hu, J.; Liu, D.; Zhou, S.; Liao, J.; Liao, G.; Yang, S.; Guo, Z.; Li, Y.; Li, S.; et al. Single-cell analysis reveals immune landscape in kidneys of patients with chronic transplant rejection. Theranostics 2020, 10, 8851–8862. [Google Scholar] [CrossRef] [PubMed]
- Zhuang, Q.; Li, H.; Peng, B.; Liu, Y.; Zhang, Y.; Cai, H.; Liu, S.; Ming, Y. Single-Cell Transcriptomic Analysis of Peripheral Blood Reveals a Novel B-Cell Subset in Renal Allograft Recipients with Accommodation. Front. Pharmacol. 2021, 12, 706580. [Google Scholar] [CrossRef] [PubMed]
- Asano, Y.; Daccache, J.; Jain, D.; Ko, K.; Kinloch, A.; Veselits, M.; Wolfgeher, D.; Chang, A.; Josephson, M.; Cunningham, P.; et al. Innate-like self-reactive B cells infiltrate human renal allografts during transplant rejection. Nat. Commun. 2021, 12, 4372. [Google Scholar] [CrossRef]
- Lamarthee, B.; Callemeyn, J.; Van Herck, Y.; Antoranz, A.; Anglicheau, D.; Boada, P.; Becker, J.U.; Debyser, T.; De Smet, F.; De Vusser, K.; et al. Transcriptional and spatial profiling of the kidney allograft unravels a central role for FcyRIII+ innate immune cells in rejection. Nat. Commun. 2023, 14, 4359. [Google Scholar] [CrossRef]
- van der List, A.C.J.; Litjens, N.H.R.; Brouwer, R.W.W.; Klepper, M.; den Dekker, A.T.; van Ijcken, W.F.J.; Betjes, M.G.H. Single-Cell RNA Sequencing of Donor-Reactive T Cells Reveals Role of Apoptosis in Donor-Specific Hyporesponsiveness of Kidney Transplant Recipients. Int. J. Mol. Sci. 2023, 24, 14463. [Google Scholar] [CrossRef] [PubMed]
- Dangi, A.; Natesh, N.R.; Husain, I.; Ji, Z.; Barisoni, L.; Kwun, J.; Shen, X.; Thorp, E.B.; Luo, X. Single cell transcriptomics of mouse kidney transplants reveals a myeloid cell pathway for transplant rejection. JCI Insight 2020, 5, e141321. [Google Scholar] [CrossRef]
- Wang, J.; Luo, P.; Zhao, J.; Tan, J.; Huang, F.; Ma, R.; Huang, P.; Huang, M.; Huang, Y.; Wei, Q.; et al. Profiling the Resident and Infiltrating Monocyte/Macrophages during Rejection following Kidney Transplantation. J. Immunol. Res. 2020, 2020, 5746832. [Google Scholar] [CrossRef] [PubMed]
- Subramanian, A.; Sidhom, E.H.; Emani, M.; Vernon, K.; Sahakian, N.; Zhou, Y.; Kost-Alimova, M.; Slyper, M.; Waldman, J.; Dionne, D.; et al. Single cell census of human kidney organoids shows reproducibility and diminished off-target cells after transplantation. Nat. Commun. 2019, 10, 5462. [Google Scholar] [CrossRef]
- Garreta, E.; Nauryzgaliyeva, Z.; Montserrat, N. Human induced pluripotent stem cell-derived kidney organoids toward clinical implementations. Curr. Opin. Biomed. Eng. 2021, 20, 100346. [Google Scholar] [CrossRef]
- Melo Ferreira, R.; Sabo, A.R.; Winfree, S.; Collins, K.S.; Janosevic, D.; Gulbronson, C.J.; Cheng, Y.H.; Casbon, L.; Barwinska, D.; Ferkowicz, M.J.; et al. Integration of spatial and single-cell transcriptomics localizes epithelial cell-immune cross-talk in kidney injury. JCI Insight 2021, 6, e147703. [Google Scholar] [CrossRef]
- Zheng, Y.; Lu, P.; Deng, Y.; Wen, L.; Wang, Y.; Ma, X.; Wang, Z.; Wu, L.; Hong, Q.; Duan, S.; et al. Single-Cell Transcriptomics Reveal Immune Mechanisms of the Onset and Progression of IgA Nephropathy. Cell Rep. 2020, 33, 108525. [Google Scholar] [CrossRef] [PubMed]
- Lubetzky, M.L.; Salinas, T.; Schwartz, J.E.; Suthanthiran, M. Urinary Cell mRNA Profiles Predictive of Human Kidney Allograft Status. Clin. J. Am. Soc. Nephrol. 2021, 16, 1565–1577. [Google Scholar] [CrossRef] [PubMed]
- Azim, S.; Zubair, H.; Rousselle, T.; McDaniels, J.M.; Shetty, A.C.; Kuscu, C.; Kuscu, C.; Talwar, M.; Eason, J.D.; Maluf, D.G.; et al. Single-cell RNA sequencing reveals peripheral blood mononuclear immune cell landscape associated with operational tolerance in a kidney transplant recipient. Am. J. Transplant. 2023, 23, 1434–1445. [Google Scholar] [CrossRef]
- Muthukumar, T.; Yang, H.; Belkadi, A.; Thareja, G.; Li, C.; Snopkowski, C.; Chen, K.; Salinas, T.; Lubetzky, M.; Lee, J.; et al. Single Cell Rna-Sequencing of Urinary Cells and Defining the Immune Landscape of Rejection in Human Kidney Allografts. Am. J. Transplant 2021, 21, 305. [Google Scholar]
- Kong, F.; Ye, S.; Zhong, Z.; Zhou, X.; Zhou, W.; Liu, Z.; Lan, J.; Xiong, Y.; Ye, Q. Single-Cell Transcriptome Analysis of Chronic Antibody-Mediated Rejection after Renal Transplantation. Front. Immunol. 2021, 12, 767618. [Google Scholar] [CrossRef]
- Wen, N.; Wu, J.; Li, H.; Liao, J.; Lan, L.; Yang, X.; Zhu, G.; Lei, Z.; Dong, J.; Sun, X. Immune landscape in rejection of renal transplantation revealed by high-throughput single-cell RNA sequencing. Front. Cell Dev. Biol. 2023, 11, 1208566. [Google Scholar] [CrossRef] [PubMed]
- Suryawanshi, H.; Yang, H.; Lubetzky, M.; Morozov, P.; Lagman, M.; Thareja, G.; Alonso, A.; Li, C.; Snopkowski, C.; Belkadi, A. Detection of infiltrating fibroblasts by single-cell transcriptomics in human kidney allografts. PLoS ONE 2022, 17, e0267704. [Google Scholar] [CrossRef]
- Pang, Q.; Chen, L.; An, C.; Zhou, J.; Xiao, H. Single-cell and bulk RNA sequencing highlights the role of M1-like infiltrating macrophages in antibody-mediated rejection after kidney transplantation. Heliyon 2024, 10, e27865. [Google Scholar] [CrossRef]
- Park, J.; Shrestha, R.; Qiu, C.; Kondo, A.; Huang, S.; Werth, M.; Li, M.; Barasch, J.; Suszták, K. Single-cell transcriptomics of the mouse kidney reveals potential cellular targets of kidney disease. Science 2018, 360, 758–763. [Google Scholar] [CrossRef]
- Dell’Orso, S.; Juan, A.H.; Ko, K.D.; Naz, F.; Perovanovic, J.; Gutierrez-Cruz, G.; Feng, X.; Sartorelli, V. Correction: Single cell analysis of adult mouse skeletal muscle stem cells in homeostatic and regenerative conditions. Development 2019, 146, dev181743. [Google Scholar] [CrossRef]
- Pellin, D.; Loperfido, M.; Baricordi, C.; Wolock, S.L.; Montepeloso, A.; Weinberg, O.K.; Biffi, A.; Klein, A.M.; Biasco, L. A comprehensive single cell transcriptional landscape of human hematopoietic progenitors. Nat. Commun. 2019, 10, 2395. [Google Scholar] [CrossRef]
- Rashmi, P.; Sur, S.; Sigdel, T.K.; Boada, P.; Schroeder, A.W.; Damm, I.; Kretzler, M.; Hodgin, J.; Hartoularos, G.; Ye, C.J. Multiplexed droplet single-cell sequencing (Mux-Seq) of normal and transplant kidney. Am. J. Transplant. 2022, 22, 876–885. [Google Scholar] [CrossRef] [PubMed]
- Wilson, G.W.; Moshkelgosha, S.; Duong, A.; Keshavjee, S.; Martinu, T.; Juvet, S.; Yeung, J.C. Deconvolution of Donor and Recipient Cells from Lung Transplant Single Cell RNA-seq Data. J. Heart Lung Transplant. 2021, 40, S149. [Google Scholar] [CrossRef]
- Smirnova, N.F.; Riemondy, K.; Bueno, M.; Collins, S.; Suresh, P.; Wang, X.; Patel, K.N.; Cool, C.; Königshoff, M.; Sharma, N.S. Single-cell transcriptome mapping identifies a local, innate B cell population driving chronic rejection after lung transplantation. JCI Insight 2022, 7, e156648. [Google Scholar] [CrossRef]
- Snyder, M.E.; Finlayson, M.O.; Connors, T.J.; Dogra, P.; Senda, T.; Bush, E.; Carpenter, D.; Marboe, C.; Benvenuto, L.; Shah, L.; et al. Generation and persistence of human tissue-resident memory T cells in lung transplantation. Sci. Immunol. 2019, 4, eaav5581. [Google Scholar] [CrossRef]
- Bharat, A.; Querrey, M.; Markov, N.S.; Kim, S.; Kurihara, C.; Garza-Castillon, R.; Manerikar, A.; Shilatifard, A.; Tomic, R.; Politanska, Y.; et al. Lung transplantation for patients with severe COVID-19. Sci. Transl. Med. 2020, 12, eabe4282. [Google Scholar] [CrossRef] [PubMed]
- Wanczyk, H.; Jensen, T.; Weiss, D.J.; Finck, C. Advanced single-cell technologies to guide the development of bioengineered lungs. Am. J. Physiol. Lung Cell. Mol. Physiol. 2021, 320, L1101–L1117. [Google Scholar] [CrossRef] [PubMed]
- Mahata, B.; Zhang, X.; Kolodziejczyk, A.A.; Proserpio, V.; Haim-Vilmovsky, L.; Taylor, A.E.; Hebenstreit, D.; Dingler, F.A.; Moignard, V.; Göttgens, B. Single-cell RNA sequencing reveals T helper cells synthesizing steroids de novo to contribute to immune homeostasis. Cell Rep. 2014, 7, 1130–1142. [Google Scholar] [CrossRef]
- Hurskainen, M.; Mižíková, I.; Cook, D.P.; Andersson, N.; Cyr-Depauw, C.; Lesage, F.; Helle, E.; Renesme, L.; Jankov, R.P.; Heikinheimo, M. Single cell transcriptomic analysis of murine lung development on hyperoxia-induced damage. Nat. Commun. 2021, 12, 1565. [Google Scholar] [CrossRef]
- Travaglini, K.J.; Nabhan, A.N.; Penland, L.; Sinha, R.; Gillich, A.; Sit, R.V.; Chang, S.; Conley, S.D.; Mori, Y.; Seita, J. A molecular cell atlas of the human lung from single-cell RNA sequencing. Nature 2020, 587, 619–625. [Google Scholar] [CrossRef] [PubMed]
- Silva, T.d.; Voisey, J.; Hopkins, P.; Apte, S.; Chambers, D.; O’Sullivan, B. Markers of rejection of a lung allograft: State of the art. Biomark. Med. 2022, 16, 483–498. [Google Scholar] [CrossRef] [PubMed]
- Misharin, A.V.; Morales-Nebreda, L.; Reyfman, P.A.; Cuda, C.M.; Walter, J.M.; McQuattie-Pimentel, A.C.; Chen, C.-I.; Anekalla, K.R.; Joshi, N.; Williams, K.J. Monocyte-derived alveolar macrophages drive lung fibrosis and persist in the lung over the life span. J. Exp. Med. 2017, 214, 2387–2404. [Google Scholar] [CrossRef] [PubMed]
- Lunardi, F.; Abbrescia, D.I.; Vedovelli, L.; Pezzuto, F.; Fortarezza, F.; Comacchio, G.M.; Guzzardo, V.; Ferrigno, P.; Loy, M.; Giraudo, C. Molecular Profiling of Tissue Samples with Chronic Rejection from Patients with Chronic Lung Allograft Dysfunction: A Pilot Study in Cystic Fibrosis Patients. Biomolecules 2023, 13, 97. [Google Scholar] [CrossRef] [PubMed]
- Malone, A.F. Monocytes and Macrophages in Kidney Transplantation and Insights from Single Cell RNA-Seq Studies. Kidney360 2021, 2, 1654–1659. [Google Scholar] [CrossRef] [PubMed]
- Lavin, Y.; Winter, D.; Blecher-Gonen, R.; David, E.; Keren-Shaul, H.; Merad, M.; Jung, S.; Amit, I. Tissue-resident macrophage enhancer landscapes are shaped by the local microenvironment. Cell 2014, 159, 1312–1326. [Google Scholar] [CrossRef]
- Reyfman, P.A.; Walter, J.M.; Joshi, N.; Anekalla, K.R.; McQuattie-Pimentel, A.C.; Chiu, S.; Fernandez, R.; Akbarpour, M.; Chen, C.-I.; Ren, Z.; et al. Single-Cell Transcriptomic Analysis of Human Lung Provides Insights into the Pathobiology of Pulmonary Fibrosis. Am. J. Respir. Crit. Care Med. 2018, 199, 1517–1536. [Google Scholar] [CrossRef] [PubMed]
- Snyder, M.E.; Moghbeli, K.; Bondonese, A.; Craig, A.; Popescu, I.; Fan, L.; Tabib, T.; Lafyatis, R.; Chen, K.; Trejo Bittar, H.E. Human lung tissue resident memory T cells are re-programmed but not eradicated with systemic glucocorticoids after acute cellular rejection. medRxiv 2021. [Google Scholar] [CrossRef]
- Lee, S.M.L.; Bertinetti-Lapatki, C.; Schiergens, T.S.; Jauch, K.W.; Roth, A.B.; Thasler, W.E. Concurrent isolation of hepatic stem cells and hepatocytes from the human liver. In Vitro Cell Dev. Biol. Anim. 2020, 56, 253–260. [Google Scholar] [CrossRef]
- Shi, W.; Wang, Y.; Zhang, C.; Jin, H.; Zeng, Z.; Wei, L.; Tian, Y.; Zhang, D.; Sun, G. Isolation and purification of immune cells from the liver. Int. Immunopharmacol. 2020, 85, 106632. [Google Scholar] [CrossRef]
- MacParland, S.A.; Liu, J.C.; Ma, X.Z.; Innes, B.T.; Bartczak, A.M.; Gage, B.K.; Manuel, J.; Khuu, N.; Echeverri, J.; Linares, I.; et al. Single cell RNA sequencing of human liver reveals distinct intrahepatic macrophage populations. Nat. Commun. 2018, 9, 4383. [Google Scholar] [CrossRef] [PubMed]
- Wang, L.; Li, J.; He, S.; Liu, Y.; Chen, H.; Yin, M.; Zou, D.; Chen, S.; Luo, T.; Yu, X.; et al. Resolving the graft ischemia-reperfusion injury during liver transplantation at the single cell resolution. Cell Death Dis. 2021, 12, 589. [Google Scholar] [CrossRef] [PubMed]
- Yang, X.; Lu, D.; Wang, R.; Lian, Z.; Lin, Z.; Zhuo, J.; Chen, H.; Yang, M.; Tan, W.; Wei, X.; et al. Single-cell profiling reveals distinct immune phenotypes that contribute to ischaemia-reperfusion injury after steatotic liver transplantation. Cell Prolif. 2021, 54, e13116. [Google Scholar] [CrossRef] [PubMed]
- Wang, Z.; Shao, X.; Wang, K.; Lu, X.; Zhuang, L.; Yang, X.; Zhang, P.; Yang, P.; Zheng, S.; Xu, X.; et al. Single-cell analysis reveals a pathogenic cellular module associated with early allograft dysfunction after liver transplantation. bioRxiv 2022. [Google Scholar] [CrossRef]
- Huang, H.; Chen, R.; Lin, Y.; Jiang, J.; Feng, S.; Zhang, X.; Zhang, C.; Ji, Q.; Chen, H.; Xie, H.; et al. Decoding Single-cell Landscape and Intercellular Crosstalk in the Transplanted Liver. Transplantation 2023, 107, 890–902. [Google Scholar] [CrossRef]
- Morrison, J.K.; DeRossi, C.; Alter, I.L.; Nayar, S.; Giri, M.; Zhang, C.; Cho, J.H.; Chu, J. Single-cell transcriptomics reveals conserved cell identities and fibrogenic phenotypes in zebrafish and human liver. Hepatol. Commun. 2022, 6, 1711–1724. [Google Scholar] [CrossRef] [PubMed]
- Li, X.; Li, S.; Wu, B.; Xu, Q.; Teng, D.; Yang, T.; Sun, Y.; Zhao, Y.; Li, T.; Liu, D. Landscape of immune cells heterogeneity in liver transplantation by single-cell RNA sequencing analysis. Front. Immunol. 2022, 13, 890019. [Google Scholar] [CrossRef] [PubMed]
- Shan, Y.; Qi, D.; Zhang, L.; Wu, L.; Li, W.; Liu, H.; Li, T.; Fu, Z.; Bao, H.; Song, S. Single-cell RNA-seq revealing the immune features of donor liver during liver transplantation. Front. Immunol. 2023, 14, 1096733. [Google Scholar] [CrossRef] [PubMed]
- Tang, H.; Yuan, J.; Gong, Y.-F.; Zhang, C.-Y.; Liu, M.; Luo, S.-X. Single-cell transcriptome sequencing reveals potential novel combination of biomarkers for antibody-based cancer therapeutics in hepatocellular carcinoma. Front. Genet. 2022, 13, 928256. [Google Scholar] [CrossRef]
- Hautz, T.; Salcher, S.; Fodor, M.; Sturm, G.; Ebner, S.; Mair, A.; Trebo, M.; Untergasser, G.; Sopper, S.; Cardini, B. Immune cell dynamics deconvoluted by single-cell RNA sequencing in normothermic machine perfusion of the liver. Nat. Commun. 2023, 14, 2285. [Google Scholar] [CrossRef]
- Zhao, J.; Zhang, S.; Liu, Y.; He, X.; Qu, M.; Xu, G.; Wang, H.; Huang, M.; Pan, J.; Liu, Z. Single-cell RNA sequencing reveals the heterogeneity of liver-resident immune cells in human. Cell Discov. 2020, 6, 22. [Google Scholar] [CrossRef]
- Ramachandran, P.; Dobie, R.; Wilson-Kanamori, J.; Dora, E.; Henderson, B.; Luu, N.; Portman, J.; Matchett, K.; Brice, M.; Marwick, J. Resolving the fibrotic niche of human liver cirrhosis at single-cell level. Nature 2019, 575, 512–518. [Google Scholar] [CrossRef]
- Aizarani, N.; Saviano, A.; Mailly, L.; Durand, S.; Herman, J.S.; Pessaux, P.; Baumert, T.F.; Grün, D. A human liver cell atlas reveals heterogeneity and epithelial progenitors. Nature 2019, 572, 199–204. [Google Scholar] [CrossRef]
- Zhang, Q.; He, Y.; Luo, N.; Patel, S.J.; Han, Y.; Gao, R.; Modak, M.; Carotta, S.; Haslinger, C.; Kind, D. Landscape and dynamics of single immune cells in hepatocellular carcinoma. Cell 2019, 179, 829–845.e20. [Google Scholar] [CrossRef]
- Barbetta, A.; Rocque, B.; Sarode, D.; Bartlett, J.A.; Emamaullee, J. Revisiting transplant immunology through the lens of single-cell technologies. Semin. Immunopathol. 2023, 45, 91–109. [Google Scholar] [CrossRef]
- Roushansarai, N.S.; Pascher, A.; Becker, F. Innate Immune Cells during Machine Perfusion of Liver Grafts—The Janus Face of Hepatic Macrophages. J. Clin. Med. 2022, 11, 6669. [Google Scholar] [CrossRef]
- Tamburini, B.A.J.; Finlon, J.M.; Gillen, A.E.; Kriss, M.S.; Riemondy, K.A.; Fu, R.; Schuyler, R.P.; Hesselberth, J.R.; Rosen, H.R.; Burchill, M.A. Chronic liver disease in humans causes expansion and differentiation of liver lymphatic endothelial cells. Front. Immunol. 2019, 10, 1036. [Google Scholar] [CrossRef]
- Dobie, R.; Wilson-Kanamori, J.R.; Henderson, B.E.; Smith, J.R.; Matchett, K.P.; Portman, J.R.; Wallenborg, K.; Picelli, S.; Zagorska, A.; Pendem, S.V. Single-cell transcriptomics uncovers zonation of function in the mesenchyme during liver fibrosis. Cell Rep. 2019, 29, 1832–1847.e8. [Google Scholar] [CrossRef]
- Loeuillard, E.; Yang, J.; Buckarma, E.; Wang, J.; Liu, Y.; Conboy, C.; Pavelko, K.D.; Li, Y.; O’Brien, D.; Wang, C. Targeting tumor-associated macrophages and granulocytic myeloid-derived suppressor cells augments PD-1 blockade in cholangiocarcinoma. J. Clin. Investig. 2020, 130, 5380–5396. [Google Scholar] [CrossRef] [PubMed]
- Shiode, Y.; Kodama, T.; Shigeno, S.; Murai, K.; Tanaka, S.; Newberg, J.Y.; Kondo, J.; Kobayashi, S.; Yamada, R.; Hikita, H. TNF receptor–related factor 3 inactivation promotes the development of intrahepatic cholangiocarcinoma through NF-κB-inducing kinase–mediated hepatocyte transdifferentiation. Hepatology 2022, 77, 395–410. [Google Scholar] [CrossRef] [PubMed]
- Frazzette, N.; Khodadadi-Jamayran, A.; Doudican, N.; Santana, A.; Felsen, D.; Pavlick, A.C.; Tsirigos, A.; Carucci, J.A. Decreased cytotoxic T cells and TCR clonality in organ transplant recipients with squamous cell carcinoma. NPJ Precis. Oncol. 2020, 4, 13. [Google Scholar] [CrossRef]
- Blau, H.M.; Daley, G.Q. Stem Cells in the Treatment of Disease. N. Engl. J. Med. 2019, 380, 1748–1760. [Google Scholar] [CrossRef]
- Karam, D.; Gertz, M.; Lacy, M.; Dispenzieri, A.; Hayman, S.; Dingli, D.; Buadi, F.; Kapoor, P.; Kourelis, T.; Warsame, R.; et al. Impact of maintenance therapy post autologous stem cell transplantation for multiple myeloma in early and delayed transplant. Bone Marrow Transplant. 2022, 57, 803–809. [Google Scholar] [CrossRef]
- Fast, E.M.; Sporrij, A.; Manning, M.; Rocha, E.L.; Yang, S.; Zhou, Y.; Guo, J.; Baryawno, N.; Barkas, N.; Scadden, D.; et al. External signals regulate continuous transcriptional states in hematopoietic stem cells. Elife 2021, 10, e66512. [Google Scholar] [CrossRef] [PubMed]
- Rahman, M.; Wang, Z.Y.; Li, J.X.; Xu, H.W.; Wang, R.; Wu, Q. Single-Cell RNA Sequencing Reveals the Interaction of Injected ADSCs with Lung-Originated Cells in Mouse Pulmonary Fibrosis. Stem Cells Int. 2022, 2022, 9483166. [Google Scholar] [CrossRef]
- Zhao, Y.; Li, X.; Zhao, W.; Wang, J.; Yu, J.; Wan, Z.; Gao, K.; Yi, G.; Wang, X.; Fan, B.; et al. Single-cell transcriptomic landscape of nucleated cells in umbilical cord blood. Gigascience 2019, 8, giz047. [Google Scholar] [CrossRef]
- Wang, F.; Tan, P.; Zhang, P.; Ren, Y.; Zhou, J.; Li, Y.; Hou, S.; Li, S.; Zhang, L.; Ma, Y.; et al. Single-cell architecture and functional requirement of alternative splicing during hematopoietic stem cell formation. Sci. Adv. 2022, 8, eabg5369. [Google Scholar] [CrossRef]
- Wittenbecher, F.; Keilholz, L.; Obermayer, B.; Conrad, T.; Frentsch, M.; Blau, I.W.; Vuong, L.G.; Borchert, F.; Lesch, S.; Movasshagi, K.; et al. Single-Cell Clonal Tracking in Allogeneic Hematopoietic Stem Cell Transplantation Reveals Time Dependent and Distinct Functional Patterns in Traceable Donor T Cell Clones. Blood 2021, 138, 335. [Google Scholar] [CrossRef]
- Augsornworawat, P.; Maxwell, K.G.; Velazco-Cruz, L.; Millman, J.R. Single-cell transcriptome profiling reveals β cell maturation in stem cell-derived islets after transplantation. Cell Rep. 2020, 32, 108067. [Google Scholar] [CrossRef]
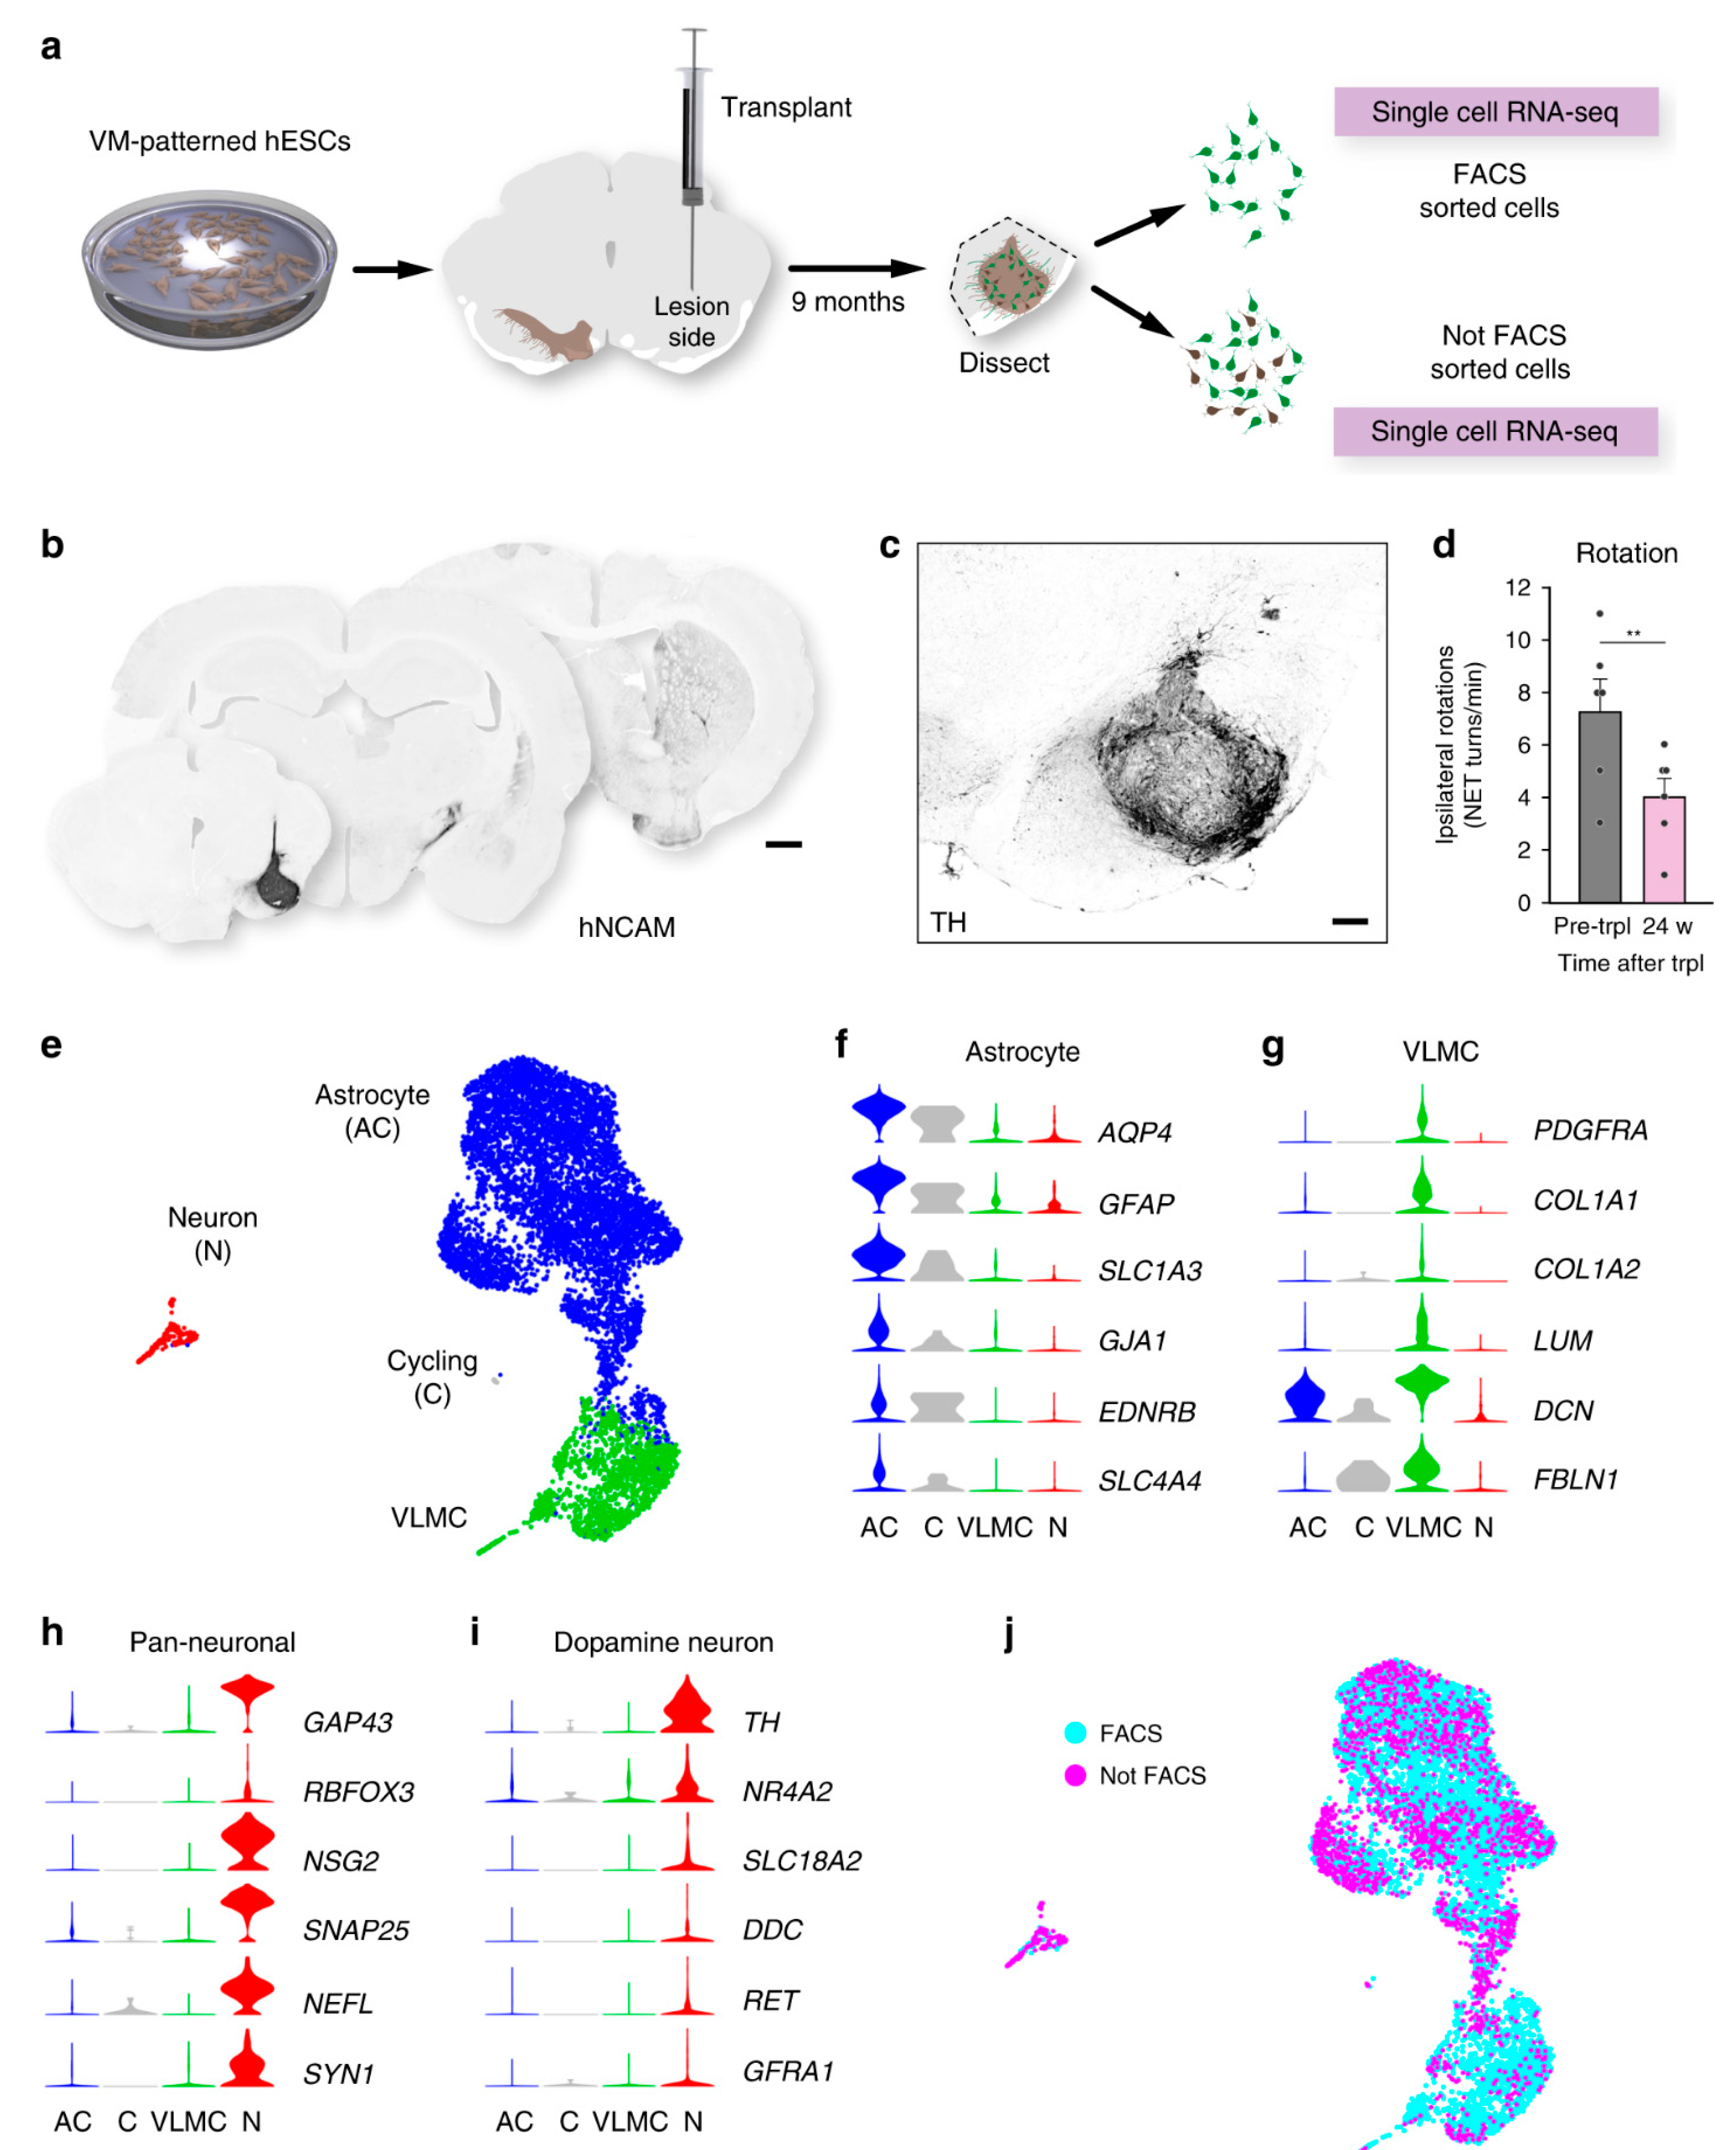
- Tiklová, K.; Nolbrant, S.; Fiorenzano, A.; Björklund, Å.; Sharma, Y.; Heuer, A.; Gillberg, L.; Hoban, D.B.; Cardoso, T.; Adler, A.F.; et al. Single cell transcriptomics identifies stem cell-derived graft composition in a model of Parkinson’s disease. Nat. Commun. 2020, 11, 2434. [Google Scholar] [CrossRef]
- Arjona, M.; Goshayeshi, A.; Rodriguez-Mateo, C.; Brett, J.O.; Both, P.; Ishak, H.; Rando, T.A. Tubastatin A maintains adult skeletal muscle stem cells in a quiescent state ex vivo and improves their engraftment ability in vivo. Stem Cell Rep. 2022, 17, 82–95. [Google Scholar] [CrossRef] [PubMed]
- Montarras, D.; Morgan, J.; Collins, C.; Relaix, F.; Zaffran, S.; Cumano, A.; Partridge, T.; Buckingham, M. Direct isolation of satellite cells for skeletal muscle regeneration. Science 2005, 309, 2064–2067. [Google Scholar] [CrossRef] [PubMed]
- Dong, F.; Hao, S.; Zhang, S.; Zhu, C.; Cheng, H.; Yang, Z.; Hamey, F.K.; Wang, X.; Gao, A.; Wang, F.; et al. Differentiation of transplanted haematopoietic stem cells tracked by single-cell transcriptomic analysis. Nat. Cell Biol. 2020, 22, 630–639. [Google Scholar] [CrossRef] [PubMed]
- de Almeida, G.P.; Lichtner, P.; Eckstein, G.; Brinkschmidt, T.; Chu, C.-F.; Sun, S.; Reinhard, J.; Mädler, S.C.; Kloeppel, M.; Verbeek, M.; et al. Human skin-resident host T cells can persist long term after allogeneic stem cell transplantation and maintain recirculation potential. Sci. Immunol. 2022, 7, eabe2634. [Google Scholar] [CrossRef] [PubMed]
- Sun, C.; Wang, H.; Ma, Q.; Chen, C.; Yue, J.; Li, B.; Zhang, X. Time-course single-cell RNA sequencing reveals transcriptional dynamics and heterogeneity of limbal stem cells derived from human pluripotent stem cells. Cell Biosci. 2021, 11, 24. [Google Scholar] [CrossRef] [PubMed]
- Grover, A.; Sanjuan-Pla, A.; Thongjuea, S.; Carrelha, J.; Giustacchini, A.; Gambardella, A.; Macaulay, I.; Mancini, E.; Luis, T.C.; Mead, A. Single-cell RNA sequencing reveals molecular and functional platelet bias of aged haematopoietic stem cells. Nat. Commun. 2016, 7, 11075. [Google Scholar] [CrossRef] [PubMed]
- Zheng, G.X.; Terry, J.M.; Belgrader, P.; Ryvkin, P.; Bent, Z.W.; Wilson, R.; Ziraldo, S.B.; Wheeler, T.D.; McDermott, G.P.; Zhu, J. Massively parallel digital transcriptional profiling of single cells. Nat. Commun. 2017, 8, 14049. [Google Scholar] [CrossRef] [PubMed]
- Maxwell, K.G.; Augsornworawat, P.; Velazco-Cruz, L.; Kim, M.H.; Asada, R.; Hogrebe, N.J.; Morikawa, S.; Urano, F.; Millman, J.R. Gene-edited human stem cell–derived β cells from a patient with monogenic diabetes reverse preexisting diabetes in mice. Sci. Transl. Med. 2020, 12, eaax9106. [Google Scholar] [CrossRef] [PubMed]
- Oguma, Y.; Kuroda, Y.; Wakao, S.; Kushida, Y.; Dezawa, M. Single-cell RNA sequencing reveals different signatures of mesenchymal stromal cell pluripotent-like and multipotent populations. iScience 2022, 25, 105395. [Google Scholar] [CrossRef]
- Cesaro, A.; Defrene, J.; Lachhab, A.; Page, N.; Tardif, M.R.; Al-Shami, A.; Oravecz, T.; Fortin, P.R.; Daudelin, J.F.; Labrecque, N.; et al. Enhanced myelopoiesis and aggravated arthritis in S100a8-deficient mice. PLoS ONE 2019, 14, e0221528. [Google Scholar] [CrossRef]
- Bode, D.; Cull, A.H.; Rubio-Lara, J.A.; Kent, D.G. Exploiting Single-Cell Tools in Gene and Cell Therapy. Front. Immunol. 2021, 12, 702636. [Google Scholar] [CrossRef]
- You, G.; Zhang, M.; Bian, Z.; Guo, H.; Xu, Z.; Ni, Y.; Lan, Y.; Yue, W.; Gong, Y.; Chang, Y. Decoding lymphomyeloid divergence and immune hyporesponsiveness in G-CSF-primed human bone marrow by single-cell RNA-seq. Cell Discov. 2022, 8, 59. [Google Scholar] [CrossRef]
- Wisdom, A.J.; Mowery, Y.M.; Hong, C.S.; Himes, J.E.; Nabet, B.Y.; Qin, X.; Zhang, D.; Chen, L.; Fradin, H.; Patel, R.; et al. Single cell analysis reveals distinct immune landscapes in transplant and primary sarcomas that determine response or resistance to immunotherapy. Nat. Commun. 2020, 11, 6410. [Google Scholar] [CrossRef]
- Sinha, V.C.; Rinkenbaugh, A.L.; Xu, M.; Zhou, X.; Zhang, X.; Jeter-Jones, S.; Shao, J.; Qi, Y.; Zebala, J.A.; Maeda, D.Y.; et al. Single-cell evaluation reveals shifts in the tumor-immune niches that shape and maintain aggressive lesions in the breast. Nat. Commun. 2021, 12, 5024. [Google Scholar] [CrossRef]
- Tirosh, I.; Izar, B.; Prakadan, S.M.; Wadsworth, M.H.; Treacy, D.; Trombetta, J.J.; Rotem, A.; Rodman, C.; Lian, C.; Murphy, G. Dissecting the multicellular ecosystem of metastatic melanoma by single-cell RNA-seq. Science 2016, 352, 189–196. [Google Scholar] [CrossRef]
- Lambrechts, D.; Wauters, E.; Boeckx, B.; Aibar, S.; Nittner, D.; Burton, O.; Bassez, A.; Decaluwé, H.; Pircher, A.; Van den Eynde, K. Phenotype molding of stromal cells in the lung tumor microenvironment. Nat. Med. 2018, 24, 1277–1289. [Google Scholar] [CrossRef]
- Slyper, M.; Porter, C.B.; Ashenberg, O.; Waldman, J.; Drokhlyansky, E.; Wakiro, I.; Smillie, C.; Smith-Rosario, G.; Wu, J.; Dionne, D. A single-cell and single-nucleus RNA-Seq toolbox for fresh and frozen human tumors. Nat. Med. 2020, 26, 792–802. [Google Scholar] [CrossRef]
- Paillet, J.; Plantureux, C.; Lévesque, S.; Le Naour, J.; Stoll, G.; Sauvat, A.; Caudana, P.; Tosello Boari, J.; Bloy, N.; Lachkar, S. Autoimmunity affecting the biliary tract fuels the immunosurveillance of cholangiocarcinoma. J. Exp. Med. 2021, 218, e20200853. [Google Scholar] [CrossRef] [PubMed]
- Noé, A.; Cargill, T.N.; Nielsen, C.M.; Russell, A.J.C.; Barnes, E. The Application of Single-Cell RNA Sequencing in Vaccinology. J. Immunol. Res. 2020, 2020, 8624963. [Google Scholar] [CrossRef] [PubMed]


| Methods | Advantages | Disadvantages | References |
|---|---|---|---|
| Smart-seq Smart-seq 2 Smart-seq 3 | Full-length transcript coverage, high sensitivity, low technical noise | Low throughput, requires manual cell isolation, high cost per cell | [75,78,79] |
| Drop-seq | High throughput, low cost per cell, large-scale parallel processing, droplet-based microfluidics | Limited coverage of full-length transcripts, low sensitivity, high technical noise | [60] |
| In-Drop | High throughput, low cost per cell, large-scale parallel processing, droplet-based microfluidics, efficient for analyzing limited cell numbers compared with Drop-seq | Limited coverage of full-length transcripts, low sensitivity, high technical noise | [72] |
| 10× Genomics Chromium | High throughput, easy to use, compatible with a wide range of samples, droplet-based microfluidics | Limited coverage of full-length transcripts (if paired with long reads technologies such as nanopore sequencing [87,88]), lower sensitivity compared with Smart-seq3 | [89] |
| Seq-well | High throughput, low cost, easy scalability, ability to multiplex samples, based on microfluidics | Limited coverage of full-length transcripts, lower sensitivity compared with Smart-seq3, Needs manual pipetting. | [74] |
| sci-RNA-seq | High throughput, high sensitivity, full-length transcript coverage | More technically challenging than some other methods, requires specialized equipment | [80] |
| MATQ-seq | High throughput, low technical noise, high sensitivity, full-length transcript coverage | More technically challenging than some other methods. Needs manual pipetting. | [81] |
| Nanopore Sequencing | Long reads, portable | Relatively higher error rates | [87,90] |
| Key Findings | Methods/Technologies | Donor/Recipient Species | References |
|---|---|---|---|
| Cellular diversity: The scRNA-seq technique has been used to reveal the cellular heterogeneity in the heart, including immune cells, fibroblasts, endothelial cells, macrophages, and cardiomyocytes. | 10× Genomics Chromium | Mice, human, pig | [91,96,97] |
| Immune cell populations in rejection: The scRNA-seq technique has identified various immune cell subsets involved in graft rejection, such as T cells, B cells, natural killer cells, and macrophages. Transcriptional profiles and functional states of these cells during rejection are considered key findings. | inDrop Microfluidics, 10× Genomics Chromium | Mice, human | [7,98,99] |
| Gene expression profile variations during rejection: Specific gene expression changes during rejection in various cell types (e.g., interferon-stimulated genes upregulation in T cells, proinflammatory pathways activation in macrophages, and upregulation of extracellular matrix genes in fibroblasts) are identified. | 10× Genomics Chromium | Mice, human | [7,100,101,102] |
| Potential therapeutic target recognition: The scRNA-seq technique has been used to identify novel potential targets for therapeutic purposes in heart transplantation (e.g., IL-18 signaling and Hif1a inhibiting in T cells and CXCR6 in natural killer cells and T cells). | 10× Genomics Chromium | Mice, human | [91,103,104] |
| Biomarker discovery: The scRNA-seq has been used to find gene expression signatures that can be considered biomarkers for predicting organ rejection or checking the responses to immunosuppressive therapy. | 10× Genomics Chromium | Mice, human | [91,105] |
| Key Findings | Methods/Technologies | Donor/Recipient Species | References |
|---|---|---|---|
| Cellular diversity: The scRNA-seq technique has been used to reveal the cellular heterogeneity in the kidney, including immune cells, macrophages, IFNg, myeloid, and T cell subclusters. These heterogeneities represent distinct signatures that have different roles in allograft loss. | 10× Genomics | Mice, human | [5,112,113,118,129,130] |
| Immune cell populations in rejection: The scRNA-seq technique has identified various immune cell subsets involved in graft rejection, such as T cells, B cells, neutrophils, myeloid cells, dendritic cells, stromal cells, and macrophages. Transcriptional profiles and functional states of these cells during rejection are considered key findings. | 10× Genomics | Mice, human | [113,115,116,129] |
| Gene expression profile variations during rejection: Altering myeloid cell differentiation and their behavior based on upregulating expressions of ribosomal protein genes may affect the implant. | 10× Genomics | Mice, human | [112,116,118,127] |
| Potential therapeutic target recognition: The scRNA-seq technique has been used to identify novel potential targets for therapeutic purposes in kidney transplantation. | 10× Genomics | Mice, human | [5,111,116,127,131] |
| Biomarker discovery: The scRNA-seq technique has been used to find gene expression signatures that can be considered biomarkers for predicting organ rejection or checking the responses to immunosuppressive therapy. | 10× Genomics, | Mice | [17,132,133] |
| Uncover novel cell types: The scRNA-seq technique assists in finding novel cell types and statuses without any bias or RNA degradation. | 10× Genomics, | Human, mice | [113,129,131,134] |
| Cells (e.g., some glomerular endothelial cells) from the recipient or donor (e.g., the renal architecture) may represent endothelial chimerism. | 10× Genomics | Human | [116] |
| The scRNA-seq technique shows that leukocyte populations mostly express sex-linked genes from recipients, which may be linked to immune cell infiltration. For example, natural killer cells and monocytes are involved in kidney rejection, | 10× Genomics | Human | [116] |
| Gene Biomarkers | Methods/Technologies | Donor/Receptor | References |
|---|---|---|---|
| IFNg, GSVA, and DEGs | 10× Genomics | Mice | [110] |
| RTK and Axl | 10× Genomics | Mice | [118] |
| PDGF, ECM, and TGF-β | 10× Genomics | Human | [113] |
| Nphs2CremT/mG, SclCremT/mG, Cdh16CremT/mG, AQP3, and HSD11B2 | Droplet-based | Mice | [131] |
| CXCL10 | 10× Genomics | Human | [116] |
| TRDC, CD4, CD8A, KLRK1, ITGAX, CD19, and CD14 | 10× Genomics | Human | [111] |
| PGs, GGT5, and EMILIN1 | 10× Genomics, Drop-seq | Human | [129] |
| CD3E, MS4A1, SDC1 (CD138), and TPSAB1 | Droplet Microfluidics | Human | [112] |
| ALDOB, GATM, GPX35, JUN, VIM, HSP, ALDOB, GPX3, GATM, CTGF, CXCL12. CAV1, COL4A1/A2, VIM, COL4A2, and VWF | Droplet Microfluidics | Human | [134] |
| TFAIP3, CXCR4, ZFP36, S100A8, S100A9, CXCL8, FOS, MTND6, HLA-DQA2, MT-ND6, CXCL8, NFKBIA, CD69, CD83, and HLA-DQA2 | [127] | ||
| CD19 and CCR6 | Human, mice | [115] | |
| CD16+, CD162, ABCA1, APOE, PDE3A, IGKC, LGMN, iCD83, FCGR3A, CD16, and FCN1 | Droplet Microfluidics | Human | [5] |
| Key Findings | Methods/Technologies | Donor/Recipient Species | References |
|---|---|---|---|
| Cellular diversity: The scRNA-seq technique is reported to identify cell populations associated with bronchiolitis obliterans syndrome. | 10× Genomics | Mice, human | [136,139,140,141,142,143,144] |
| Immune cell populations in rejection: In acute cellular rejection, a clonal population of cytotoxic and effector CD8+ T cells exist in the transplanted lung and remain after treatment. | 10× Genomics | Mice, human | [136,139,140,145] |
| Potential therapeutic target recognition: A subgroup of innate B-1 cells may contribute to autoimmunity in bronchiolitis obliterans syndrome, which represents a potential therapeutic method. | 10× Genomics | Mice, human | [136,139,140] |
| Biomarker discovery: The scRNA-seq technique has been used to find gene expression signatures that can be considered biomarkers for predicting organ rejection or checking the responses to immunosuppressive therapy. | 10× Genomics | Mice, human | [136,143] |
| Macrophage polarization: Macrophages are found to be heterogeneous cell populations, which upon activation, polarize into various phenotypes. After transplantation, tissue-resident macrophages quickly change their gene expression profile into that of the host organ markers. | 10× Genomics | Mice, human | [146,147] |
| Uncovering novel cell types: For example, additional endothelial and lymphatic cell populations, megakaryocytes, innate lymphoid cells, and mesothelial cells have been identified in mice. | 10× Genomics | Mice | [148] |
| References | Methods/Technologies | Cells | Donor/Receptor | Gene Biomarkers |
|---|---|---|---|---|
| [149] | 10× Genomics | Emphysema, cystic fibrosis, sarcoidosis | Human | CD6914, CD103, CD69+, CD137+, CD69+ and/or OX40+ |
| [136] | 10× Genomics | COPD, CTD-ILD | Human, mouse | Bhlhe41, Zbtb20, Cxcr3, Itgb1, CD19, CD43, CD5, Xbp1, Sdc1, Mzb1, Irf4, Ighm, |
| [141] | 10× Genomics | Bronchopulmonary dysplasia | Mouse, human | Epcam, Pecam1, Ptprc, Col1a1, Msln, |
| [142] | 10× Genomics | Adenocarcinoma, endobronchial carcinoid, LLL endobronchial typical carcinoid, | Mouse, human | EPCAM, CLDN5, COL1A2, PTPRC, CD31, CD45, KRT5, MKI67, SERPINB3, C20orf85, CLDN5, MYC, ACKR1, ACKR1, GJA5, CCL21, CLDN5 with DAPI, COL1A2, GPC3, Slc7a10, SERPINF1, Pi16, ASPN, COX4I2, COL1A2, APOE, GPR183, Slc7a10, |
| [144] | RNeasy Plus Mini kit (QIA GEN) | Fibrotic lung disease, idiopathic pulmonary fibrosis, systemic sclerosis-associated interstitial lung disease, interstitial pneumonitis, pneumoconiosis | Mouse, human | CD206, CD169 |
| Key Findings | Methods/Technologies | Donor/Recipient Species | References |
|---|---|---|---|
| Cellular diversity: The scRNA-seq technique has been used to uncover the cellular heterogeneity in the liver, including immune cells, macrophages, IFNg, myeloid, and T cell subclusters. These heterogeneities highlight signatures with different roles in allograft complications. | 10× Genomics | Human, rat | [155,158,159,160,161,162,163,164,165] |
| Immune cell populations in rejection: The scRNA-seq technique has identified various immune cell subsets involved in graft rejection, such as T cells, B cells, neutrophils, myeloid cells, dendritic cells, stromal cells, macrophages, and their transcriptional profiles and functional states during organ rejection. Some cell populations, including IL-7R+CD4+ T cell, and CRTAM+CD8+ T cell, are shown to be reduced in the transplanted liver. | 10× Genomics | Human, mouse | |
| Gene expression profile variations during rejection: Gene expression variation of B cells in bronchiolitis obliterans syndrome is uncovered. | 10× Genomics | Mice | [136] |
| Potential therapeutic target recognition: The scRNA-seq technique has been used to identify novel potential targets for therapeutic purposes in liver transplantation. For example, it helps to understand the heterogeneity of LDLR+MDSC and CTLA4+CD8+ T, especially CD4+CD8+FOXP3 T cells, which may result in finding innovative therapeutic methods. | 10× Genomics | Human | [158] |
| Biomarker discovery: Machine learning and scRNA-seq have helped in identifying novel biomarkers. | 10× Genomics | Human | [166] |
| Macrophage polarization | 10× Genomics | Human | [152,167] |
| Uncovering novel cell types | 10× Genomics | Human, rat | [155,158,162,163,165] |
| References | Sequencing Method | Cells | Donor/Receptor | Gene Biomarkers |
|---|---|---|---|---|
| [158] | 10× Genomics | Liver cirrhosis, hepatocellular carcinoma | human | LDLR, GZMB, GZMA, GZMB, GZMH, NKG7, GZMK, DUSP4, and COTL1 |
| [159] | 10× Genomics Chromium | Hepatocellular carcinoma, cirrhosis of the liver | human | TCRs, BCRs, CD3D, KLRF1, CD79A, IGHG1, CD177, CD68, PECAM1, KRT7. CD4+ T cell lineages, CD4+, (Tem, GZMK), CD4+ (CCR7, LEF1), CD4+, (MAIT, SLC4A10), (MKI67) |
| [155] | 10× Genomics | Hepatocellular carcinoma and primary sclerosing cholangitis disease | Human, rat | S100A12, LTF, PRTN3 |
| [152] | 10× Genomics | Liver cancer | Human, mouse | KRT19 (CK19), EPCAM, FXDY2, CLDN4, CLDN10, SOX9, MMP7, CXCL1, CFTR, TFF2, KRT7 (CK7), CD24 |
| [160] | 10× Genomics | Para-tumor liver tissue, cirrhotic | human | EPCAM, SOX9, AFP, KRT7, S100A6, S100A11, ALB, PCK1, FGG, FGA, TTR, EBPB, APOB, CYP2E1, APOE |
| [161] | Seven Bridges Genomics | Cholangiosepsis | human | CD15, CD68, CD3, CD8, CD20, FCGR3B, CD68, CD3E, CD4, CD8A, Tregs, FOXP3, NKG7, FLT3, CD24, CD79A, JCHAIN, ALB, FLT1, KRT19, IFITM2, CSF3R, FPR1, FCGR3B, VNN2, G0S2, CXCR2, SOD2. CXCR2, CXCR4, CD83, CCRL2, CCL3, CCL4, ICAM1, VEGFA, CST3, CTSB, MS4A7, MARCH1, CD68, MAFB, CD163, VCAN, CSF1R, LYZ, VCAN, S100A8, S100A9, S100A12, MNDA |
| [162] | 10× Genomics | Chronic hepatitis B (CHB), HBV-associated liver cirrhosis (LC) patients | human | CD3D, KLRF1, CD19, SDC1, CD14, FCGR3A |
| [155] | 10× Genomics | Chronic liver disease | Mice | S100A6, Ccl2, Cxcl1, Cxcl12, Col1a2, Col3a1, Col5a2 |
| [163] | 10× Genomics | Human liver cirrhosis | Human, mice | MNDA, CD9, TIMD4 |
| [164] | CEL-seq2 | Colorectal cancer metastasis or cholangiocarcinoma | Human, mouse | AKR1B10, MKI67, PCNA, ALB, HP, HNF4A, ASGR1, PROX1, KRT19, CFTR, ASGR1 plus ALB, CXCL8 plus MMP7, PECAM1, CLEC4G, CD34, CLEC4M and FLT1 |
| [165] | 10× Chromium Smart- seq2 | Hepatocellular carcinoma (HCC) | Human | CD14, CD2, CD3D, CD4, CD68, LYZ, MS4A1 |
| [168] | 10× Chromium | Nonalcoholic steatohepatitis (NASH), HCV | Human | CD45, CD31, CD68, CD146, SSC-A, PDPN, CCL21, LYVE1, FLT4, PROX1 |
| [169] | 10× Chromium Smart- seq2 | Solitary colorectal metastasis | Mouse | Mki67, Col1a1+, NGFR, Adamtsl2 |
| [170] | Droplet-based sequencing and data analysis, 1× Genomics | Cholangiocarcinoma | Mouse | CD68, CK-19, MHCII, MHCI, CD45, CD11b, Ly6G, Ly6C, CD19, CD115, B220, TER-119, Tim4, NK1.1, MERTK, CD8a, CD3e, TCRb, CD206, Lgals3, CD11c, CX3CR1, CCR2, F4/80, CD14, CD64 |
| [171] | DNBSEQ-G400RS (MGI Tech) | Cholangiocarcinoma | Mouse | Alb, Apoa1, Ass1, Spp1, Sox9 |
| Key Findings | Methods/Technologies | Donor/Recipient Species | References |
|---|---|---|---|
| Cellular diversity | Illumina Hiseq platform (Novogene), 10× Genomics | mouse | [184,187,188] |
| Cell populations: A neutrophil progenitor population that highly expresses S100A gene family members is detected in transplanted hematopoietic stem cells. Combined with FACS, scRNA-seq can ensure cellular purity in samples. Evaluating the ability of the bone marrow-mesenchymal to differentiate into subpopulations is possible. | 10× Genomics Chromium | mouse, human | [189,190] |
| Gene expression profile variations | Illumina Hiseq platform (Novogene), 10× Genomics Chromium | mouse | [180,184,187] |
| Potential therapeutic target recognition: The scRNA-seq technique identifies therapeutic targets for osteosarcoma. | 10× Genomics | mouse, human | [191] |
| Uncover novel cell types: The scRNA-seq technique assists in uncovering novel cell types. | 10× Genomics | mouse, human | [188] |
| References | Methods/Technologies | Notes | Donor/Receptor | Gene Biomarkers |
|---|---|---|---|---|
| [187] | 10× Genomics | two iliac cristae, two tibiae and two femora | mice | CD41, CD150 |
| [184] | Illumina Hiseq platform (Novogene) | hematopoietic system | mouse, rat | Lin-Sca1+Kit+CD34-Flk2- Lin-Sca1+Kit+CD34-CD150+CD41- Lin-Sca1+Kit+CD34-CD150-CD41- CD201+CD150+CD48-CD45+ CD201+CD150+CD48-CD45+Sca1+Kit+ |
| [180] | 10× Genomics Chromium | Diabetes | mouse | MAFA, FAM159B, NAA20 |
| [188] | 10× Genomics | acute myeloid leukemia (AML) patients | mouse, human | CCR10, TNFRSF18, GZMK, CD8A, TNFRSF18, SIGLEC7, GNLY, LGALS3, CCR10, CD4, CLEC4C, PF4, PTCRA, CD8B, ID3, CD79A |
| [192] | 10× Genomics | hematological malignancies, | human | CD3D, CD4, IL7R, CCR7, CCR6, CCL5, TBX21, FOXP3, CD8A, CD8B, CXCR6, RORC, CD69, IFIT3, GZMH, TRGC1, XCL1, XCL2, IL1R1, KIT, IFNG, FCGR3A |
| [193] | 10× Genomics | Wolfram syndrome (WS) | mouse, human | SPINK1, ID3, NKX2-2, MAFB, NKX6-1, NKX2-2, GCK, ISL1, PDX1 |
| Key Findings | Methods/Technologies | Donor/Recipient Species | References |
|---|---|---|---|
| Cellular diversity: The intra-individual, interindividual, spatial, functional, and genomic heterogeneity in melanoma cells, as well as tumor factors affecting the microenvironment (e.g., tumor-infiltrating immune cells, tumor-associated fibroblasts, and endothelial cells), are identified. | 10× Genomics | human | [196,197,198] |
| Key factors: TNF receptor-related factor 3 (Traf3) is found to be significantly mutated in murine intrahepatic cholangiocarcinoma. In human intrahepatic cholangiocarcinoma, an inverse correlation between Traf3 and NF-κB-inducing kinase expression is reported. NF-κB-inducing kinase inhibition damps the growth of intrahepatic cholangiocarcinoma. | DNBSEQ-G400RS (MGI Tech), 10× Genomics | mouse | [171,196,197] |
| Gene expression profile variations: The scRNA-seq on the liver had identified mostly convergent gene expression alterations when primary biliary cholangitis and primary sclerosing cholangitis were compared to normal controls. Genes expressed by one cell type (e.g., CAFs) may affect the proportion of other cell types (e.g., T cells). | 10× Genomics, DNBSEQ-G400RS (MGI Tech) | mouse | [171,196,199] |
| Potential therapeutic target recognition: The E2 subunit of mitochondrial pyruvate dehydrogenase complex (PDC-E2) is potentially considered for validating potential immunotherapeutic candidate strategies against cholangiocarcinoma. | 10× Genomics, DNBSEQ-G400RS (MGI Tech) | mouse | [171,196,199] |
| Uncovering novel cell types: The scRNA-seq technique reveals novel cell types and states without biased results. It identifies novel cell subtypes that undergo immune rejection. Primary biliary cholangitis liver and underlying developed cholangiocarcinoma contain several clonotypes, often shared between two tissues. | 10× Genomics | mouse, human | [113,200] |
| Tracking T-cell polarization: scRNA-seq detects genes associated with Th1 and Tc1 lymphocyte subsets in primary biliary cholangitis compared with primary sclerosing cholangitis livers. These T cells were detected within cholangiocarcinoma tumors and draining lymph nodes of mice with primary biliary cholangitis but not primary sclerosing cholangitis. Th1- and Tc1-polarized subsets play a key role in rejecting cholangiocarcinoma tumors. | 10× Genomics | mouse | [199] |
| References | Methods/Technologies | Tumor Types | Donor/Receptor | Gene Biomarkers |
|---|---|---|---|---|
| [199] | 10× Genomics | cholangiocarcinoma | mouse | FoxP3, IFNγ, IL4, IL17a, Cd3g, Cd4, Cd8a, Id2, Tcf7, Eomes Il7r, Prdm1, Il2, Tbx21, Gata3, Il4, Rorc, Bcl6, Foxp3, Gzma, Gzmb, Gzmk, Ifng, Icos, Cd28, Cd27, Tnfrsf4, Tnfrsf9, Tnfrsf18, Cd40lg, Pdcd1, Ctla4, Lag3, Havcr2, Tigit, Btla, Lta, Adora2a, Klrg1, Cd38, Nt5e, |
| [171] | DNBSEQ-G400RS (MGI Tech) | cholangiocarcinoma | mouse | Alb, Apoa1, Ass1, Spp1, Sox9 |
| [196] | 10× Genomics | melanoma tumors | human | CD2, CD3D, CD3E, CD3G, CD19, CD79A, CD79B, BLK, CD163, CD14, CSF1R, PECAM1, VWF, CDH5, FAP, THY1, DCN, COL1A1, COL1A2, COL6A1, COL6A2, COL6A3 |
| [198] | 10× Genomics | Non-small cell lung carcinoma (NSCLC), neuroblastoma (NB), MBC, glioblastoma; high-grade glioma, CLL, ovarian, melanoma, sarcoma | human | KRT8, MRC1, TRAC, JCHAIN, TPSAB1, PTPRC, APOE, MAG, THY1, MITF, CA8, CFH, PAX3, CD99, KRT5, SFTPB, FOXJ1, MUC1, CGRP, SFTPC, AGER, FSP1 PECAM1, TH, MYCN, SOX2, STMN2, FDX1, PROM1, PDGFRA, UCHL1, LGALS3, HOPX, VIM |
| [197] | 10× Genomics | Non-small-cell lung cancer (NSCLC), lung squamous carcinoma (LUSC), lung adenocarcinoma (LUAD) | human | TPSAB1, TPSB2, CPA3, HPGDS, CLU, AREG, MS4A2, RGS13, VWA5A, LAPTM4A, C1orf186, SLC18A2, LTC4S, KIT, HDC, MAOB, RGS1, RP11- 354E11.2, SAMSN1, RGS2, SLC26A2, PTGS1, NSMCE1 |
Disclaimer/Publisher’s Note: The statements, opinions and data contained in all publications are solely those of the individual author(s) and contributor(s) and not of MDPI and/or the editor(s). MDPI and/or the editor(s) disclaim responsibility for any injury to people or property resulting from any ideas, methods, instructions or products referred to in the content. |
© 2024 by the authors. Licensee MDPI, Basel, Switzerland. This article is an open access article distributed under the terms and conditions of the Creative Commons Attribution (CC BY) license (https://creativecommons.org/licenses/by/4.0/).
Share and Cite
Abedini-Nassab, R.; Taheri, F.; Emamgholizadeh, A.; Naderi-Manesh, H. Single-Cell RNA Sequencing in Organ and Cell Transplantation. Biosensors 2024, 14, 189. https://doi.org/10.3390/bios14040189
Abedini-Nassab R, Taheri F, Emamgholizadeh A, Naderi-Manesh H. Single-Cell RNA Sequencing in Organ and Cell Transplantation. Biosensors. 2024; 14(4):189. https://doi.org/10.3390/bios14040189
Chicago/Turabian StyleAbedini-Nassab, Roozbeh, Fatemeh Taheri, Ali Emamgholizadeh, and Hossein Naderi-Manesh. 2024. "Single-Cell RNA Sequencing in Organ and Cell Transplantation" Biosensors 14, no. 4: 189. https://doi.org/10.3390/bios14040189
APA StyleAbedini-Nassab, R., Taheri, F., Emamgholizadeh, A., & Naderi-Manesh, H. (2024). Single-Cell RNA Sequencing in Organ and Cell Transplantation. Biosensors, 14(4), 189. https://doi.org/10.3390/bios14040189