An Efficient Bio-Receptor Layer Combined with a Plasmonic Plastic Optical Fiber Probe for Cortisol Detection in Saliva

 ,
,  , , ,
, , ,  and
and 
Abstract
:1. Introduction
2. Materials and Methods
2.1. Chemicals
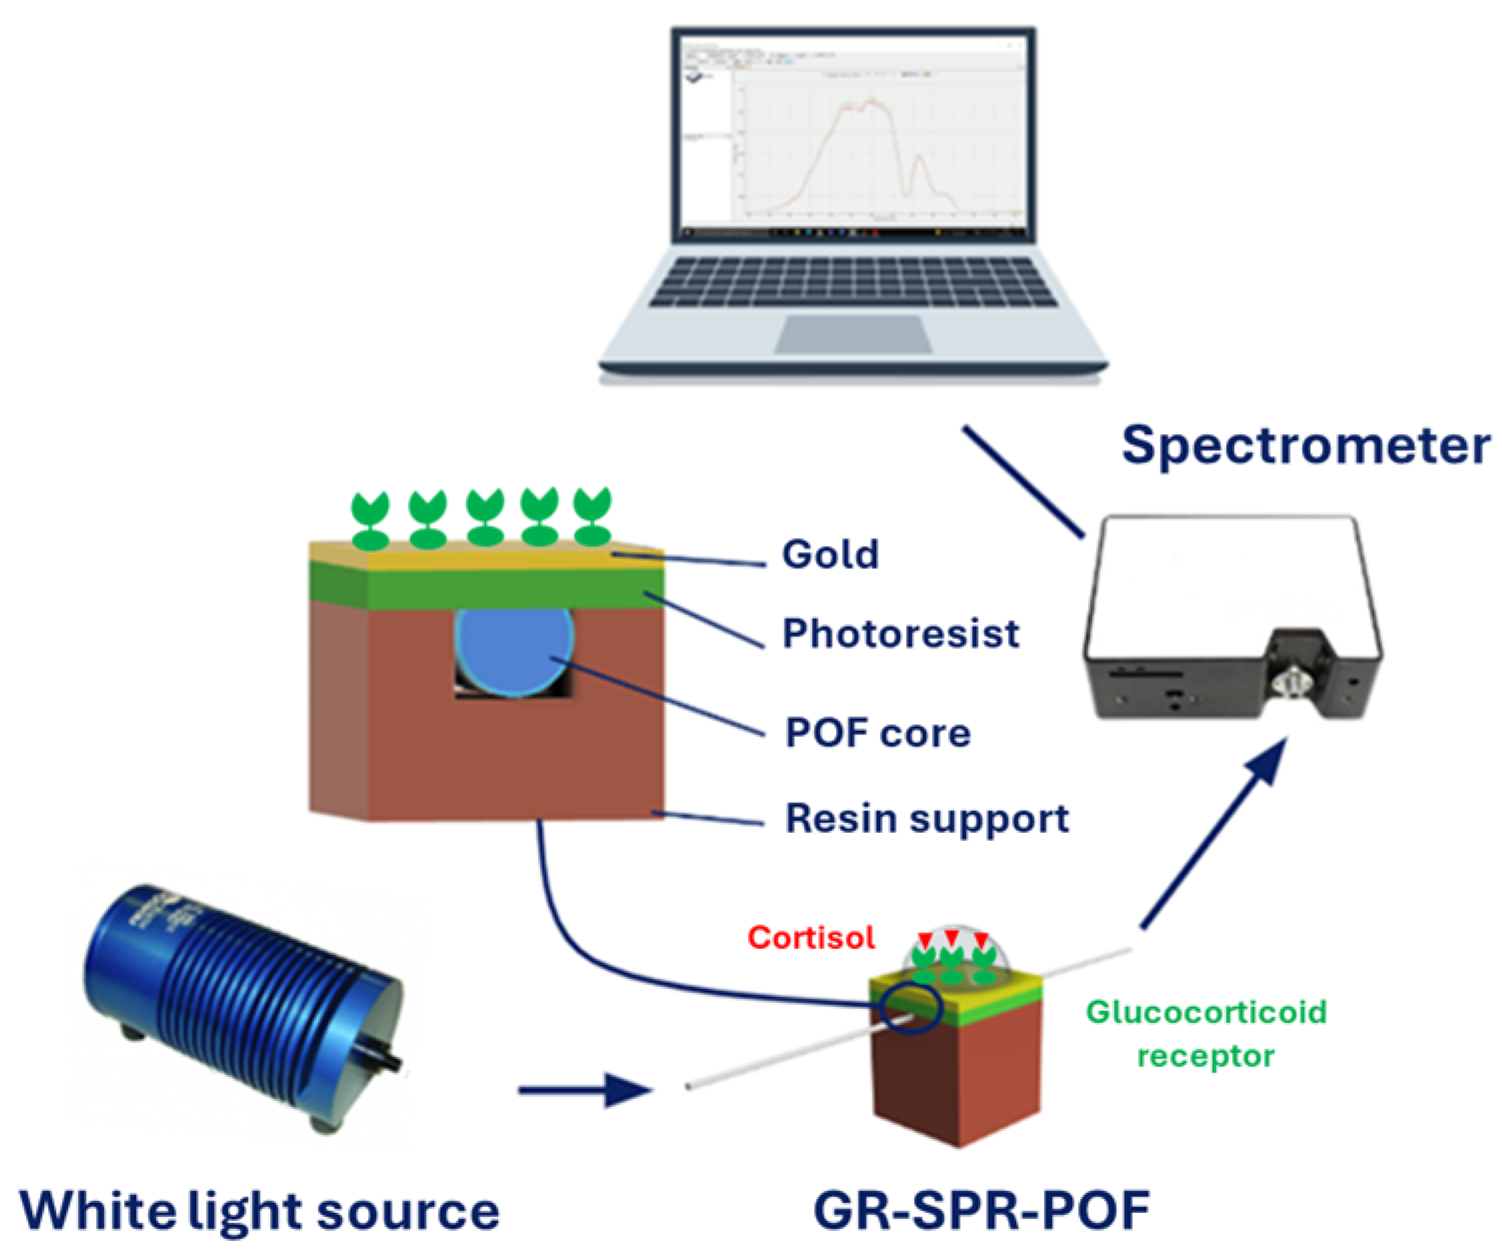
2.2. SPR-POF Probe
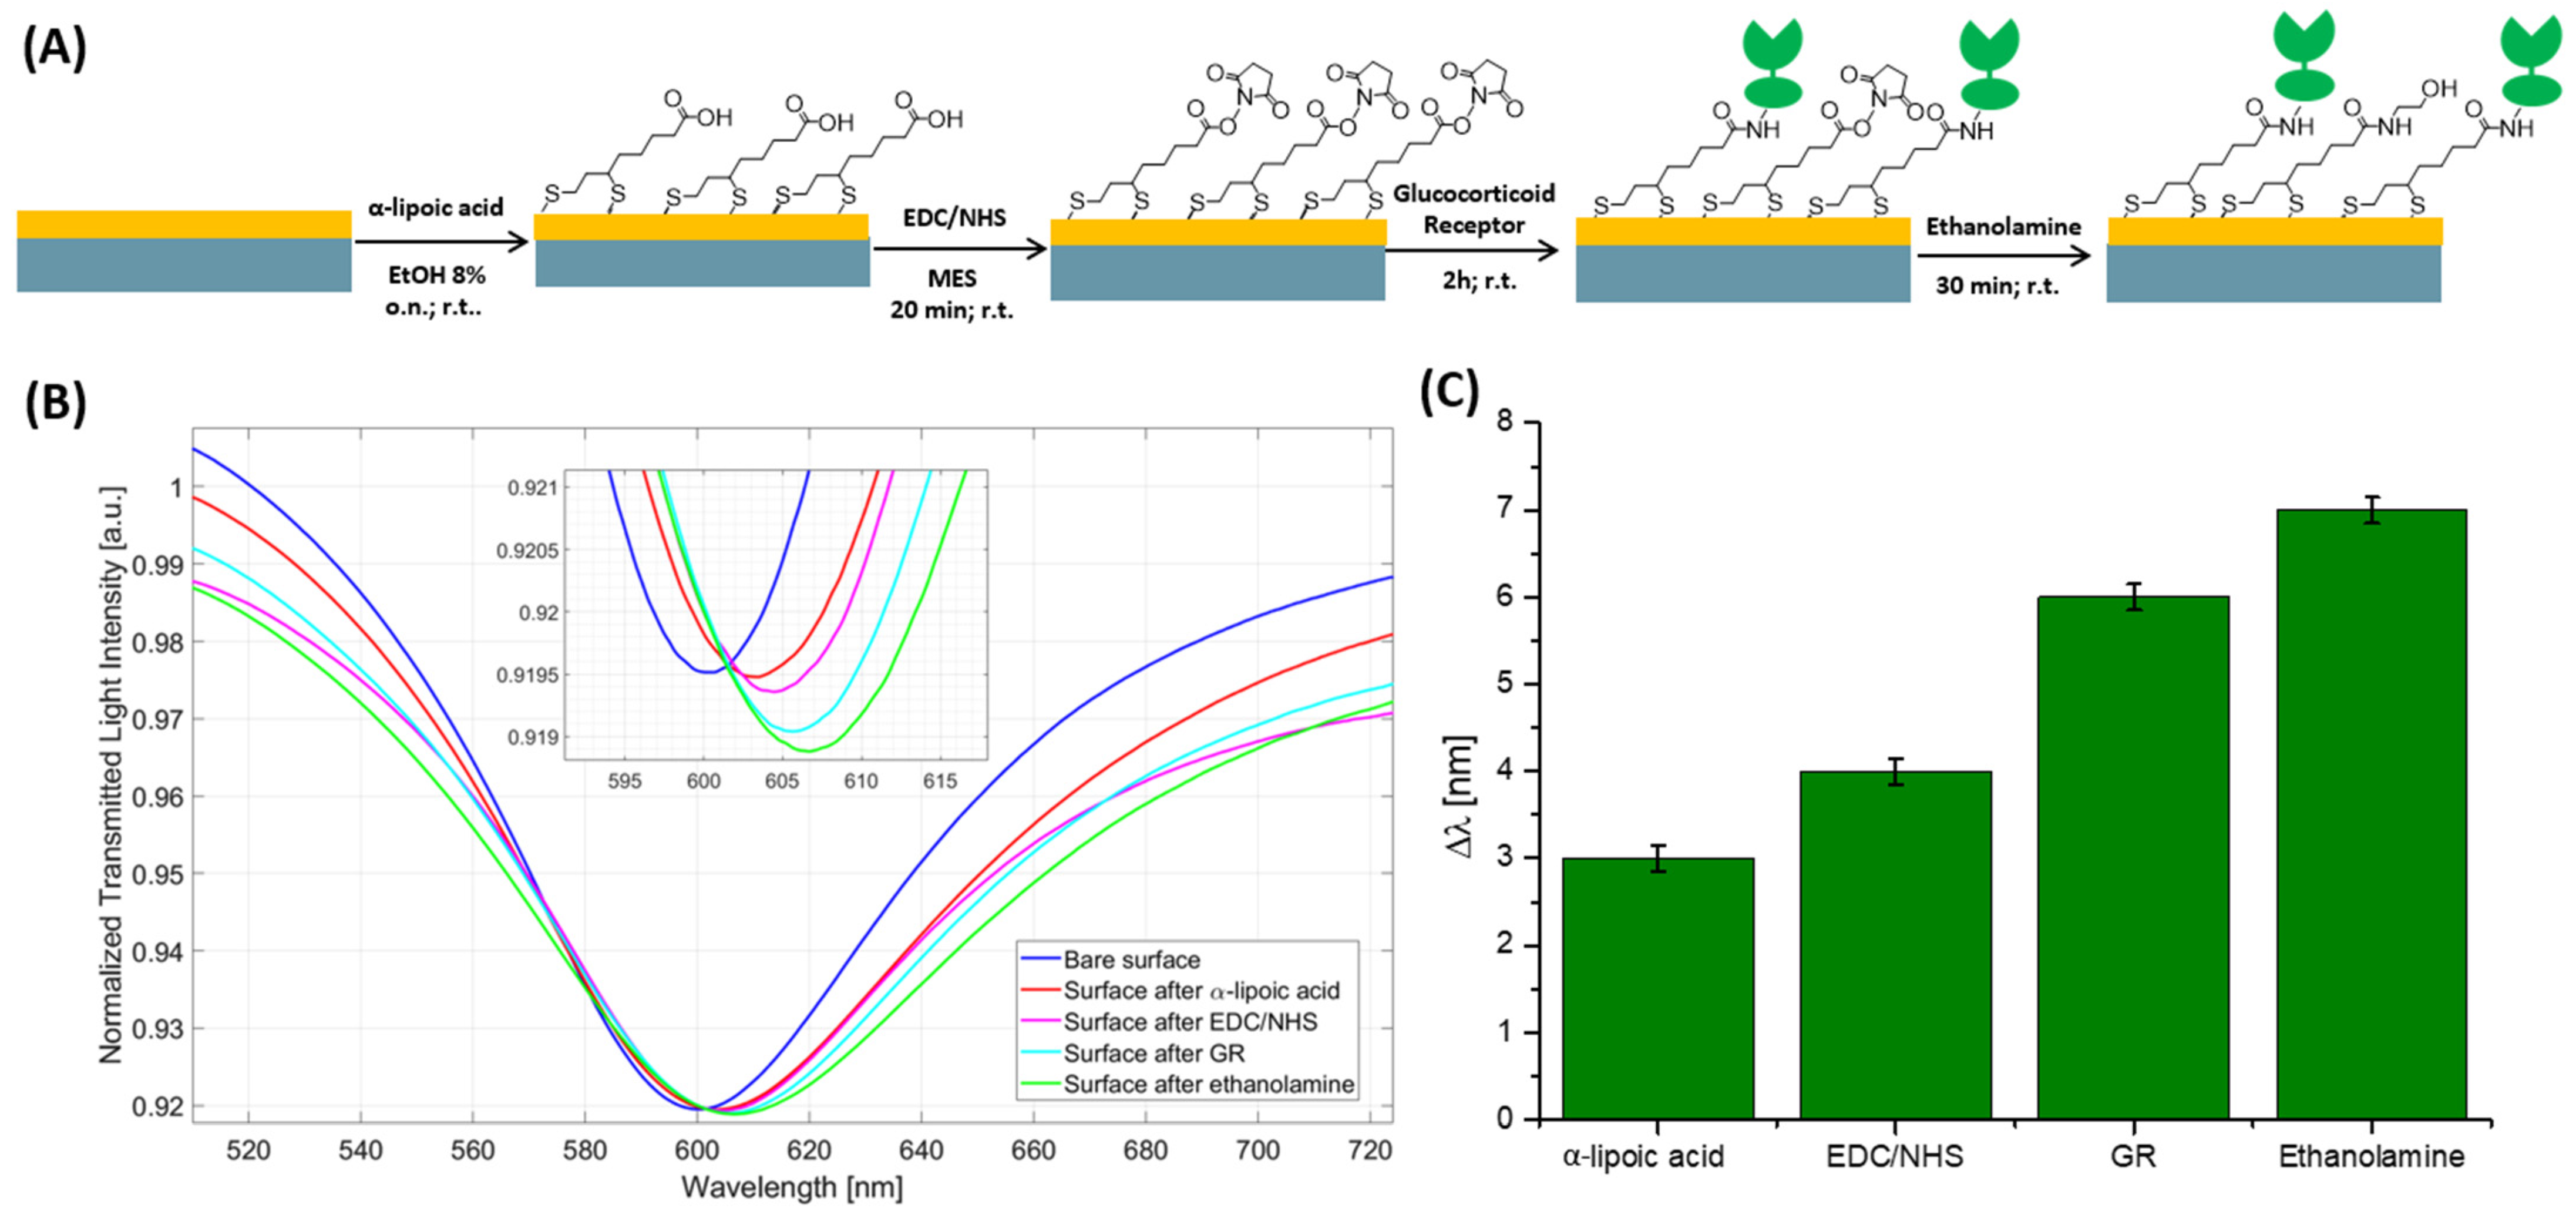
2.3. GR Functionalization Protocol of SPR-POF Chip
2.4. Experimental Setup
2.5. Measuring Protocol
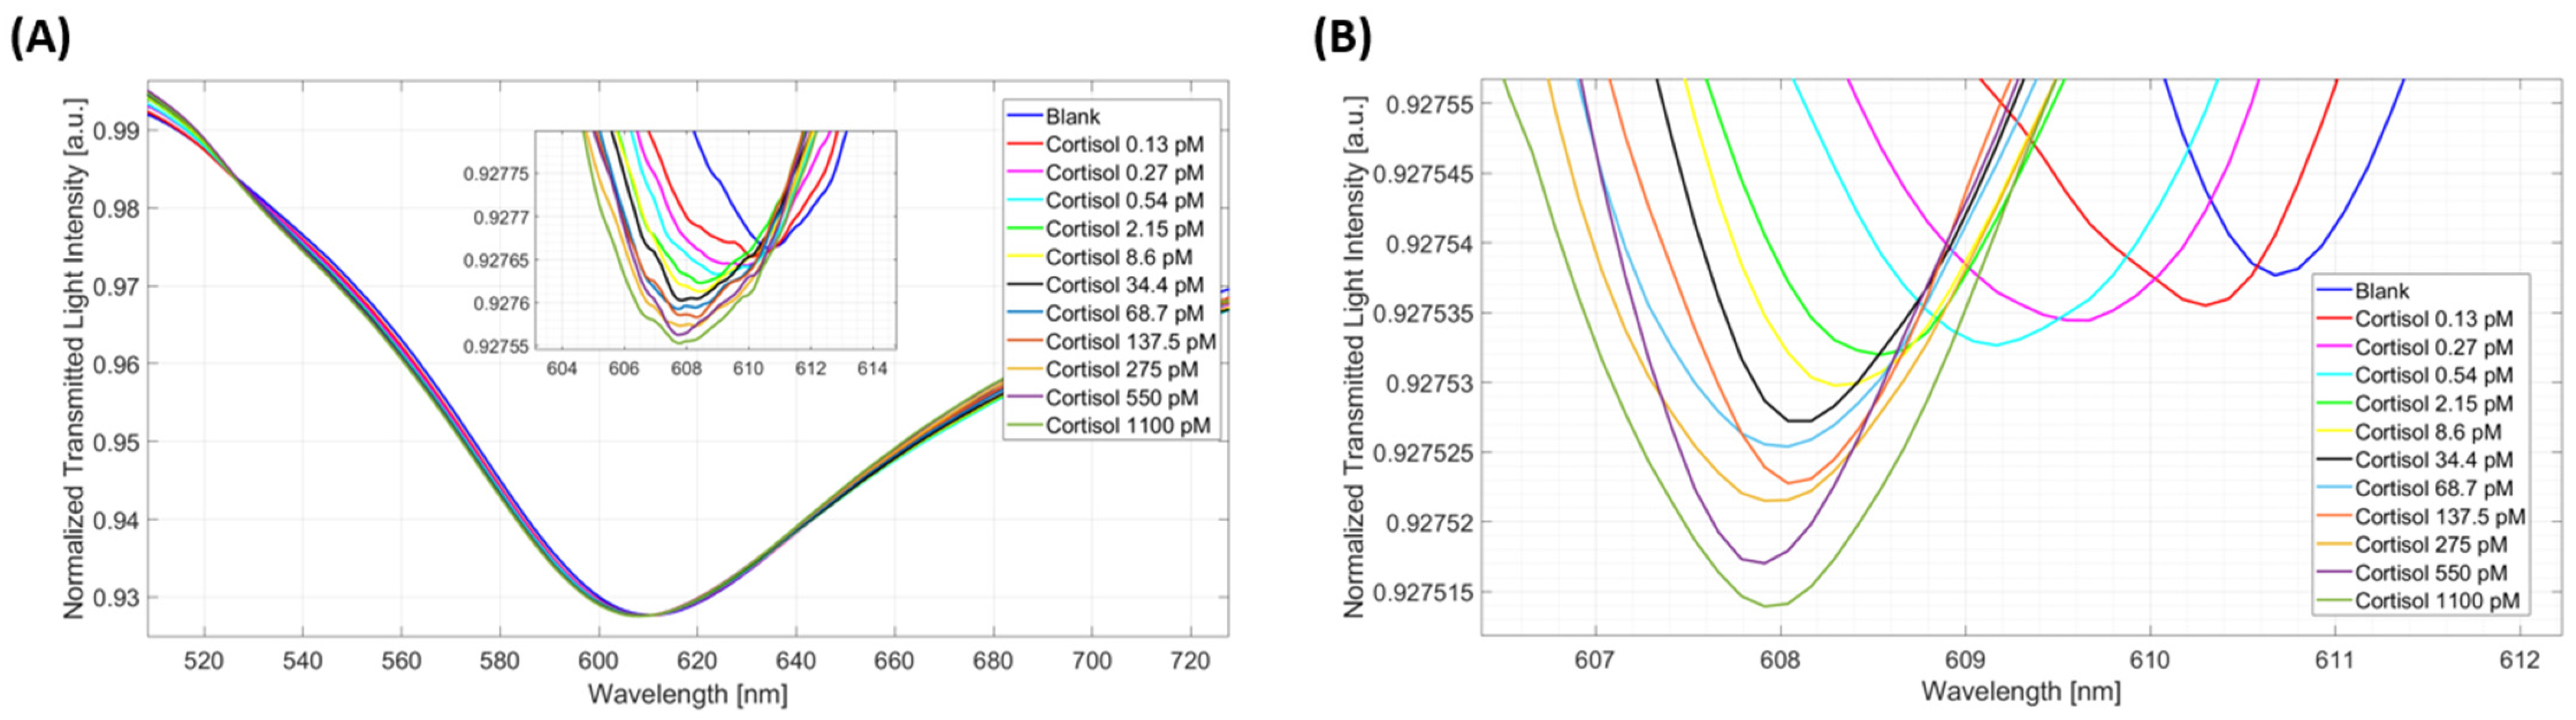
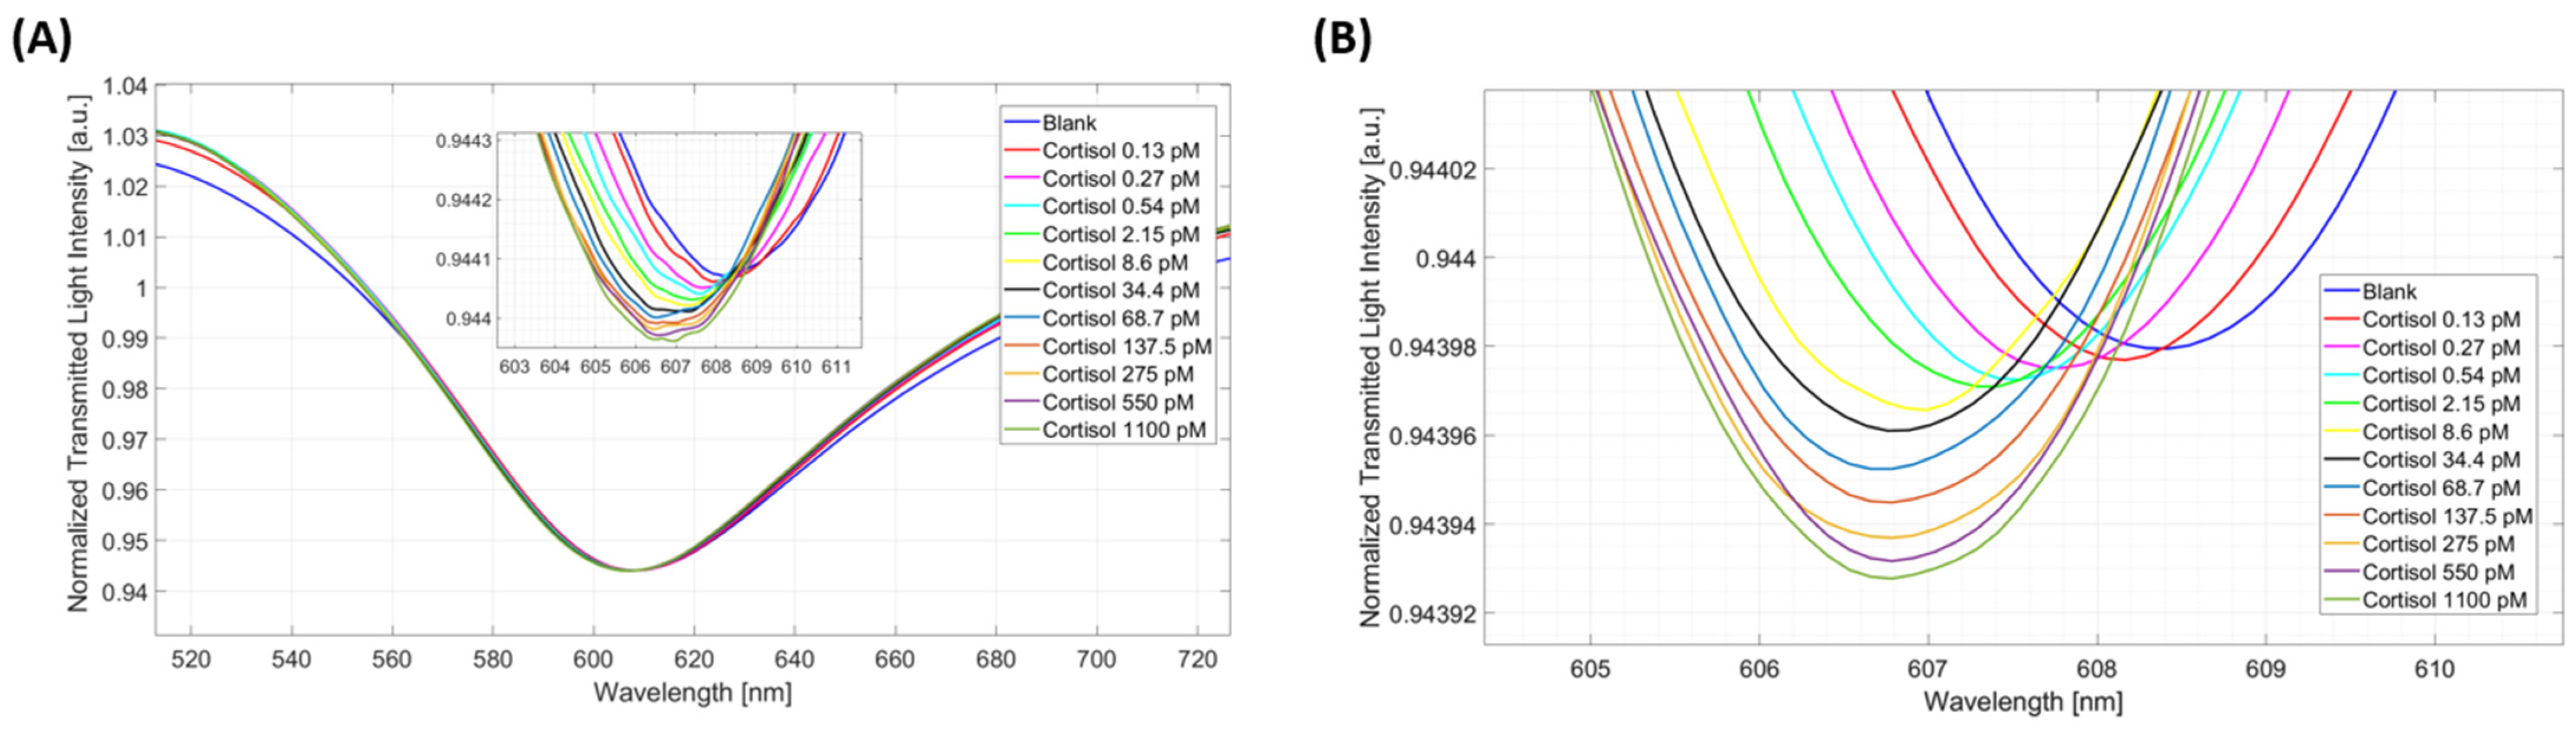
3. Results and Discussion
4. Conclusions
Author Contributions
Funding
Institutional Review Board Statement
Informed Consent Statement
Data Availability Statement
Acknowledgments
Conflicts of Interest
References
- Steptoe, A.; Hamer, M.; Chida, Y. The effects of acute psychological stress on circulating inflammatory factors in humans: A review and meta-analysis. Brain Behav. Immun. 2007, 21, 901–912. [Google Scholar] [CrossRef]
- Corbalán-Tutau, D.; Madrid, J.A.; Nicolás, F.; Garaulet, M. Daily profile in two circadian markers “melatonin and cortisol” and associations with metabolic syndrome components. Physiol. Behav. 2014, 123, 231–235. [Google Scholar] [CrossRef] [PubMed]
- Perogamvros, I.; Ray, D.W.; Trainer, P.J. Regulation of Cortisol Bioavailability—Effects on Hormone Measurement and Action. Nat. Rev. Endocrinol. 2012, 8, 717–727. [Google Scholar] [CrossRef] [PubMed]
- Chan, S.; Debono, M. Replication of cortisol circadian rhythm: New advances in hydrocortisone replacement therapy. Ther. Adv. Endocrinol. Metabol. 2010, 1, 129–138. [Google Scholar] [CrossRef] [PubMed]
- Ljubijankić, N.; Popović-Javorić, R.; Šćeta, S. Daily fluctuation of cortisol in the saliva and serum of healthy persons. Bosn. J. Basic Med. Sci. 2008, 8, 110–115. [Google Scholar] [CrossRef] [PubMed]
- Ray, P.; Steckl, A.J. Label-Free Optical Detection of Multiple Biomarkers in Sweat, Plasma, Urine, and Saliva. ACS Sens. 2019, 4, 1346–1357. [Google Scholar] [CrossRef] [PubMed]
- Zea, M.; Bellagambi, F.G.; Halima, H.B.; Zine, N.; Jaffrezi-Renault, N.; Villa, R.; Gabriela, G.; Errachid, A. Electrochemical sensors for cortisol detections: Almost there. Trends Anal. Chem. 2020, 132, 116058. [Google Scholar] [CrossRef]
- Hellhammer, D.H.; Wüst, S.; Kudielka, B.M. Salivary Cortisol as a Biomarker in Stress Research. Psychoneuroendocrinology 2009, 34, 163–171. [Google Scholar] [CrossRef] [PubMed]
- Kuo, T.; McQueen, A.; Chen, T.-C.; Wang, J.-C. Regulation of Glucose Homeostasis by Glucocorticoids. Adv. Exp. Med. Biol. 2015, 99–126. [Google Scholar]
- Dong, T.; Zhi, L.; Bhayana, B.; Wu, M.X. Cortisol-Induced Immune Suppression by a Blockade of Lymphocyte Egress in Traumatic Brain Injury. J. Neuroinflammation 2016, 13, 197. [Google Scholar] [CrossRef]
- Steckl, A.J.; Ray, P. Stress Biomarkers in Biological Fluids and Their Point-of-Use Detection. ACS Sens. 2018, 3, 2025–2044. [Google Scholar] [CrossRef] [PubMed]
- Karachaliou, C.-E.; Koukouvinos, G.; Goustouridis, D.; Raptis, I.; Kakabakos, S.; Petrou, P.; Livaniou, E. Cortisol Immunosensors: A Literature Review. Biosensors 2023, 13, 285. [Google Scholar] [CrossRef] [PubMed]
- Kaushik, A.; Vasudev, A.; Arya, S.K.; Pasha, S.K.; Bhansali, S. Recent advances in cortisol sensing technologies for point-of-care application. Biosens. Bioelectron. 2014, 53, 499–512. [Google Scholar] [CrossRef]
- Iqbal, T.; Elahi, A.; Wijns, W.; Shahzad, A. Cortisol Detection Methods for Stress Monitoring in Connected Health. Health Sci. Rev. 2023, 6, 100079. [Google Scholar] [CrossRef]
- Santonocito, R.; Puglisi, R.; Cavallaro, A.; Pappalardo, A.; Trusso Sfrazzetto, G. Cortisol Sensing by Optical Sensors. Analyst 2024, 149, 989–1001. [Google Scholar] [CrossRef]
- Gupta, B.D.; Verma, R.K. Surface Plasmon Resonance-Based Fiber Optic Sensors: Principle, Probe Designs, and Some Applications. J. Sens. 2009, 2009, 979761. [Google Scholar] [CrossRef]
- Chen, X.; Zhang, L.; Cui, D. Surface Plasmon Resonance Immunoassay for Cortisol Determination with a Self-assembling Denaturalised Bovine Serum Albumin Layer on Surface Plasmon Resonance Chip. Micro Nano Lett. 2016, 11, 20–23. [Google Scholar] [CrossRef]
- Pandey, A.K.; Sharma, A.K.; Marques, C. On The Application of SiO2/SiC Grating on Ag for High-Performance Fiber Optic Plasmonic Sensing of Cortisol Concentration. Materials 2020, 13, 1623. [Google Scholar] [CrossRef]
- Cennamo, N.; Pesavento, M.; Arcadio, F.; Marzano, C.; Zeni, L. Review Manuscript Trends in Analytical Chemistry Advances in Plastic Optical Fiber Bio/Chemical Sensors to Realize Point-Of-Care-Tests. TrAC Trends Anal. Chem. 2024, 177, 117797. [Google Scholar] [CrossRef]
- Seggio, M.; Arcadio, F.; Radicchi, E.; Cennamo, N.; Zeni, L.; Bossi, A.M. Toward Nano- and Microplastic Sensors: Identification of Nano- and Microplastic Particles via Artificial Intelligence Combined with a Plasmonic Probe Functionalized with an Estrogen Receptor. ACS Omega 2024, 9, 18984–18994. [Google Scholar] [CrossRef]
- Arcadio, F.; Noël, L.; Del Prete, D.; Maniglio, D.; Seggio, M.; Soppera, O.; Cennamo, N.; Bossi, A.M.; Zeni, L. Soft Molecularly Imprinted Nanoparticles with Simultaneous Lossy Mode and Surface Plasmon Multi-Resonances for Femtomolar Sensing of Serum Transferrin Protein. Sci. Rep. 2023, 13, 11210. [Google Scholar] [CrossRef]
- Arcadio, F.; Seggio, M.; Zeni, L.; Bossi, A.M.; Cennamo, N. Estradiol Detection for Aquaculture Exploiting Plasmonic Spoon-Shaped Biosensors. Biosensors 2023, 13, 432. [Google Scholar] [CrossRef]
- Arcadio, F.; Soares, S.; Nedoma, J.; Aguiar, D.; Pereira, A.C.; Zeni, L.; Cennamo, N.; Marques, C. POF-Based Biosensors for Cortisol Detection in Seawater as a Tool for Aquaculture Systems. Sci. Rep. 2024, 14, 13117. [Google Scholar] [CrossRef]
- Soares, M.S.; Silva, L.C.B.; Vidal, M.; Loyez, M.; Facão, M.; Caucheteur, C.; Segatto, M.E.V.; Costa, F.M.; Leitão, C.; Pereira, S.O.; et al. Label-Free Plasmonic Immunosensor for Cortisol Detection in a D-Shaped Optical Fiber. Biomed. Opt. Exp. 2022, 13, 3259. [Google Scholar] [CrossRef] [PubMed]
- Leitão, C.; Leal-Junior, A.; Almeida, A.R.; Pereira, S.O.; Costa, F.M.; Pinto, J.L.; Marques, C. Cortisol AuPd Plasmonic Unclad POF Biosensor. Biotechnol. Rep. 2021, 29, e00587. [Google Scholar] [CrossRef] [PubMed]
- Cennamo, N.; Massarotti, D.; Conte, L.; Zeni, L. Low Cost Sensors Based on SPR in a Plastic Optical Fiber for Biosensor Implementation. Sensors 2011, 11, 11752–11760. [Google Scholar] [CrossRef]
- Homola, J. Present and Future of Surface Plasmon Resonance Biosensors. Anal. Bioanal. Chem. 2003, 377, 528–539. [Google Scholar] [CrossRef] [PubMed]
- Roux, S.; Térouanne, B.; Couette, B.; Rafestin-Oblin, M.-E.; Nicolas, J.-C. Conformational Change in the Human Glucocorticoid Receptor Induced by Ligand Binding Is Altered by Mutation of Isoleucine 747 by a Threonine. JBC 1999, 274, 10059–10065. [Google Scholar] [CrossRef] [PubMed]
- Kurganov, B.I.; Lobanov, A.V.; Borisov, I.A.; Reshetilov, A.N. Criterion for Hill Equation Validity for Description of Biosensor Calibration Curves. Anal. Chim. Acta 2001, 427, 11–19. [Google Scholar] [CrossRef]
- Cennamo, N.; Bencivenga, D.; Annunziata, M.; Arcadio, F.; Stampone, E.; Piccirillo, A.; Della Ragione, F.; Zeni, L.; Guida, L.; Borriello, A. Plasmon Resonance Biosensor for Interleukin-1β Point-of-Care Determination: A Tool for Early Periodontitis Diagnosis. iScience 2024, 27, 108741. [Google Scholar] [CrossRef]
- Annunziata, M.; Arcadio, F.; Borriello, A.; Bencivenga, D.; Piccirillo, A.; Stampone, E.; Zeni, L.; Cennamo, N.; Della Ragione, F.; Guida, L. A Novel Plasmonic Optical-Fiber-Based Point-of-Care Test for Periodontal MIP-1α Detection. iScience 2023, 26, 108539. [Google Scholar] [CrossRef] [PubMed]
- Thompson, M.; Ellison, S.L.R.; Wood, R. Harmonized Guidelines for Single-Laboratory Validation of Methods of Analysis (IUPAC Technical Report). Pure Appl. Chem. 2002, 74, 835–855. [Google Scholar] [CrossRef]
- Cennamo, N.; Bossi, A.M.; Arcadio, F.; Maniglio, D.; Zeni, L. On the Effect of Soft Molecularly Imprinted Nanoparticles Receptors Combined to Nanoplasmonic Probes for Biomedical Applications. Front. Bioeng. Biotechnol. 2021, 9, 801489. [Google Scholar] [CrossRef] [PubMed]
- Baryshev, A.V.; Merzlikin, A.M.; Inoue, M. Efficiency of Optical Sensing by a Plasmonic Photonic-Crystal Slab. J. Phys. D Appl. Phys. 2013, 46, 125107. [Google Scholar] [CrossRef]
- Cennamo, N.; Maniglio, D.; Tatti, R.; Zeni, L.; Bossi, A.M. Deformable Molecularly Imprinted Nanogels Permit Sensitivity-Gain in Plasmonic Sensing. Biosens. Bioelectron. 2020, 156, 112126. [Google Scholar] [CrossRef]
- Stevens, R.C.; Soelberg, S.D.; Near, S.; Furlong, C.E. Detection of Cortisol in Saliva with a Flow-Filtered, Portable Surface Plasmon Resonance Biosensor System. Anal. Chem. 2008, 80, 6747–6751. [Google Scholar] [CrossRef] [PubMed]
- Frasconi, M.; Mazzarino, M.; Botrè, F.; Mazzei, F. Surface Plasmon Resonance Immunosensor for Cortisol and Cortisone Determination. Anal. Bioanal. Chem. 2009, 394, 2151–2159. [Google Scholar] [CrossRef] [PubMed]
- Mitchell, J.S.; Lowe, T.E.; Ingram, J.R. Rapid Ultrasensitive Measurement of Salivary Cortisol Using Nano-Linker Chemistry Coupled with Surface Plasmon Resonance Detection. Analyst 2009, 134, 380–386. [Google Scholar] [CrossRef]
- Kumbhat, S.; Gehlot, R.; Sharma, K.; Singh, U.; Joshi, V. Surface Plasmon Resonance Based Indirect Immunoassay for Detection of 17β -Estradiol. J. Pharm. Biomed. Anal. 2019, 163, 211–216. [Google Scholar] [CrossRef]
- Celik, L.; Lund, J.D.; Schiøtt, B. Conformational dynamics of the estrogen receptor: Molecular dynamics simulations of the influence of binding site structure on protein dynamics. Biochemistry 2007, 46, 1743–1758. [Google Scholar] [CrossRef]


| Matrix | λ0 [nm] | Δλmax [nm] | K [pM] | Statistics | |
|---|---|---|---|---|---|
| χ2 | R2 | ||||
| PBS | −0.35 ± 0.16 | 2.67 ± 0.02 | 0.33 ± 0.04 | 0.067 | 0.995 |
| Artificial saliva (diluted 1:50) | −0.15 ± 0.15 | 1.69 ± 0.02 | 0.36 ± 0.08 | 0.140 | 0.987 |
| Matrix | Slowc (|Δλmax|/K) | LOD/Slowc) [32] | Kaff (1/K) |
|---|---|---|---|
| PBS | 8.09 nm/pM | 59 fM | 3.03 pM−1 |
| Artificial saliva (diluted 1:50) | 4.69 nm/pM | 96 fM | 2.78 pM−1 |
| Sensor Configuration | Matrix | Working Range | LOD | Ref. |
|---|---|---|---|---|
| D-shaped silica optical fiber coupled with antibody | PBS | 0.01–100 ng/mL | 1.46 ng/mL | [24] |
| AuPd unclad POF coupled with antibody | PBS | 0.005−10 ng/mL | 1 pg/mL | [25] |
| Commercial chip coupled with antibody | PBS | 1.5–10 ng/mL | 0.36 ng/mL | [36] |
| Commercial chip coupled with antibody | Saliva | 1.5 ng/mL | 1 ng/mL | [36] |
| Commercial chip coupled with antibody | Saliva | 9–132 ng/mL | 4 ng/mL | [37] |
| Commercial chip coupled with antibody | Saliva | 91–934 pg/mL | 49 pg/mL | [38] |
| SPR-POF chip coupled with antibody | PBS | 0.1–10 pg/mL | 0.2 pg/mL | [23] |
| SPR-POF chip coupled with antibody | Seawater | 0.1–10 pg/mL | 0.8 pg/mL | [23] |
| SPR-POF chip coupled with GR | PBS | 0.13–36 pM (0.047–13 pg/mL) | 59 fM (0.021 pg/mL) | This work |
| SPR-POF chip coupled with GR | Artificial saliva | 0.13–36 pM (0.047–13 pg/mL), | 96 fM (0.034 pg/mL) | This work |
| Transducer | Receptor | Analyte | LOD | Ref. |
|---|---|---|---|---|
| Commercial chip | Antibody | Estradiol | 1 pg/mL | [39] |
| Spoon-shaped waveguides | ER | Estradiol | 0.027 pg/mL | [22] |
| AuPd-coated POF | Antibody | Cortisol | 1 pg/mL | [25] |
| SPR-POF | GR | Cortisol | 0.021 pg/mL | This work |
Disclaimer/Publisher’s Note: The statements, opinions and data contained in all publications are solely those of the individual author(s) and contributor(s) and not of MDPI and/or the editor(s). MDPI and/or the editor(s) disclaim responsibility for any injury to people or property resulting from any ideas, methods, instructions or products referred to in the content. |
© 2024 by the authors. Licensee MDPI, Basel, Switzerland. This article is an open access article distributed under the terms and conditions of the Creative Commons Attribution (CC BY) license (https://creativecommons.org/licenses/by/4.0/).
Share and Cite
Arcadio, F.; Seggio, M.; Pitruzzella, R.; Zeni, L.; Bossi, A.M.; Cennamo, N. An Efficient Bio-Receptor Layer Combined with a Plasmonic Plastic Optical Fiber Probe for Cortisol Detection in Saliva. Biosensors 2024, 14, 351. https://doi.org/10.3390/bios14070351
Arcadio F, Seggio M, Pitruzzella R, Zeni L, Bossi AM, Cennamo N. An Efficient Bio-Receptor Layer Combined with a Plasmonic Plastic Optical Fiber Probe for Cortisol Detection in Saliva. Biosensors. 2024; 14(7):351. https://doi.org/10.3390/bios14070351
Chicago/Turabian StyleArcadio, Francesco, Mimimorena Seggio, Rosalba Pitruzzella, Luigi Zeni, Alessandra Maria Bossi, and Nunzio Cennamo. 2024. "An Efficient Bio-Receptor Layer Combined with a Plasmonic Plastic Optical Fiber Probe for Cortisol Detection in Saliva" Biosensors 14, no. 7: 351. https://doi.org/10.3390/bios14070351