Abstract
G6PD deficiency is a genetic disease that weakens the immune system and renders affected individuals susceptible to infections. In the Sultanate of Oman resides a high number of recorded G6PD cases due to widespread consanguineous marriage, which may reach 25% of the population. We studied the infection patterns and risk factors for mortality to provide antimicrobial stewardship recommendations for these patients. After obtaining ethical approval, a registry of recorded cases was consulted retrospectively to include G6PD-deficient adult patients admitted to Suhar hospital over 5 years with microbiologically confirmed infections. Patient demographics, health-related information, infection causes, treatment, and clinical outcomes were studied. Data were analyzed to describe infection patterns and risk factors. Several variables, including underlying comorbidities and hospitalization details, such as length of stay, admission to critical care unit, blood transfusion, or exposure to an invasive procedure, were statistically associated with the acquisition of multidrug-resistant and hospital-acquired infections. Meanwhile, these infections were associated with a high mortality rate (28%), significantly associated with the patient’s health status and earlier exposure to antimicrobial treatment due to previous bacterial infection. The high prevalence of G6PD deficiency among the Omani population should alert practitioners to take early action when dealing with such cases during infection that requires hospitalization. Strict infection control measures, Gram-negative empiric coverage, hospital discharge as early as possible, and potent targeted antimicrobial therapy in this patient population can ameliorate the treatment outcomes and should be emphasized by the antimicrobial stewardship team.
1. Introduction
Glucose-6-phosphate dehydrogenase (G6PD) is a crucial enzyme for the proper functioning of red blood cells (RBCs). Genes encoding G6PD enzyme production are found on the long distal arm of the X chromosome [1]. The G6PD enzyme stimulates the reduction of nicotinamide adenine dinucleotide phosphate (NADP) in the pentose phosphate pathway (PPP) to generate NADPH; the latter is a substrate for NADPH oxidase responsible for regenerating the antioxidant glutathione that protects red blood cells (RBCs) against oxidative stress [2].
Genetic abnormalities causing deficiency of the G6PD enzyme lead to uncontrolled premature hemolysis of RBCs triggered by viral or bacterial infections, sulpha-containing drugs, and certain types of food, manifested mainly as fatigue, pallidness, jaundice, shortness of breath, tachycardia, dark urine, and splenomegaly [3]. Clinical symptom severity in G6PD-deficient patients corresponds to the level of G6PD activity in the affected cells. In the absence of oxidative stress, even with substantially reduced enzyme activity, there may be few or no clinical symptoms.
A reduced NADPH pool causes reduced NADPH oxidase activity, leading to the defective production of reactive oxygen species (ROS)-related neutrophil extracellular traps (NETs) required for the antimicrobial activity of phagocytes and leukocytes, leading to recurrent bacterial and fungal infections [4,5,6]. As one of the forefront immune cells recruited during infections, neutrophils exhibit a wide range of mechanisms to counteract bacterial invasion via phagocytosis and the production of ROS, proteases, and NETs. As a result, any failure to recruit neutrophils to an infection site fosters the propagation of systemic infection [7,8].
Clinically, G6PD deficiency was found to be more prevalent in infected males than in the matched groups and suggested to be a predictor of hospitalization and severe infections [9].
A plethora of bacterial and fungal infections was identified in several studies that described the infections in G6PD-deficient patients, among which pneumonia, gastrointestinal, osteomyelitis, cerebrospinal, and septicemia were more common. Most of these infections were caused by Chromobacterium violaceum [10], Staphylococcus aureus [11], Escherichia coli [12], Serratia marcescens [13], Acinetobacter baumannii [14], Klebsiella pneumoniae [15], Pseudomonas aeruginosa [16], Salmonella species, Staphylococcus epidermidis, Clostridium difficile [17], and Aspergillus species [6].
G6PD deficiency is the most prevalent genetic enzyme deficiency affecting approximately 400 million individuals worldwide [18,19], with the highest prevalence in sub-Saharan Africa and the Middle East’s second-highest estimates [19]. Sultanate of Oman harbors one of the highest recorded cases of G6PD worldwide, almost 25% in males and 10% in females, due to the high rate of consanguinity marriage [20]. This opportunity may not exist in other communities due to the scarcity of G6PD deficiency cases to study and document the pattern of infectious diseases in patients suffering from this rare genetic blood disease. Landscaping the infection patterns and identifying patients at high risk of mortality may aid in developing clinical care algorithms that optimize treatment outcomes for this patient cohort.
2. Methods
2.1. Study Population
Genetically tested adult G6PD-deficient patients (>18 years) with infections confirmed by microbiological laboratory who were admitted over the period (1 January 2017, to 31 December 2021) to our tertiary care facility were included in this investigation. After the study was approved by the Ministry of Health’s Research and Ethical Review Committee, patient-relevant data was collected from the hospital’s electronic medical records.
We examined the patients’ age, gender, clinical symptoms of infection (to exclude patients with colonization), existing comorbid conditions, diabetes mellitus (DM), chronic renal failure (CRF), active malignancy, immuno-suppressed, chronic cardiac diseases (CCD), chronic respiratory disease (CRD), exposure to invasive procedures (endotracheal tube insertion, urinary catheterization, wound debridement, venous catheterization, lumbar puncture or similar procedures) during admission, 90-day prior exposure to surgery, and 90-day history of infections. Hospitalization details included diagnosis at admission, discharge status, length of stay (LOS), and admission ward. Microbiological details included laboratory-confirmed microbiological cultures, infection sites, specimen type, susceptibility pattern, resistance phenotype, prior infections, and concurrent infections. Only the first episode was selected for patients with several admissions with identical cultures. Patients with no Suhar hospital ID, patients with positive cultures who were not admitted, died before receiving a single dose of antibiotics, and pediatric patients (>18 years) were excluded.
2.2. Definitions
Hospital-acquired infections occurred ≥72 h of the admission date; all other episodes were considered community-acquired infections (CAI) [21]. Admission to an intensive care unit (ICU), cardiac care unit (CCU), or burn unit (BU) for more than 24 h is considered a critical care stay. A complete or partial resolution of infection signs, normalization of laboratory values of white blood cell count (WBC) and C-reactive protein (CRP), or negative culture of the exact source of the original infection was used to determine the clinical prognosis at the end of treatment. On days 14 and 28 of hospitalization, mortality was considered if the symptomatic patient had a positive culture and died before resolving infection signs.
The treatment of infection using a single antibiotic is considered monotherapy, while combined therapy is using 2 or more antibiotics with antimicrobial action against the causative organism during the infection episode.
Multidrug-resistant (MDR) infection was defined following CLSI 2010 M100-S20 guidance [22], as the isolate resistant to one antibiotic of three or more different antimicrobial classes. Carbapenem-resistant Enterobacterales (CREs) were phenotypically detected—according to CLSI—as the isolates that showed inhibition zones <23 mm with (ertapenem 10 μg or meropenem 10 μg) and tested resistant to one or more antibiotics in cephalosporin subclass III (e.g., cefotaxime, ceftazidime, and ceftriaxone). Confirmed CRE was reported as resistant for all penicillins, cephalosporins, carbapenems, and aztreonam.
2.3. Statistical Analysis
The data were analyzed using R software statistical programming language, version 3.6.2 (2019-12-12) (R Foundation for Statistical Computing platform). Median and interquartile ranges (IQRs) were used to describe numerical data and analyzed using linear regression analysis after the normality was tested using Shapiro–Wilk normality test. Categorical data are analyzed using binary logistic regression and expressed using p-values, odds ratios (ORs), and confidence intervals (CIs). All tests were two-sided; p-values < 0.05 are considered significant, at a 95% confidence level.
3. Results
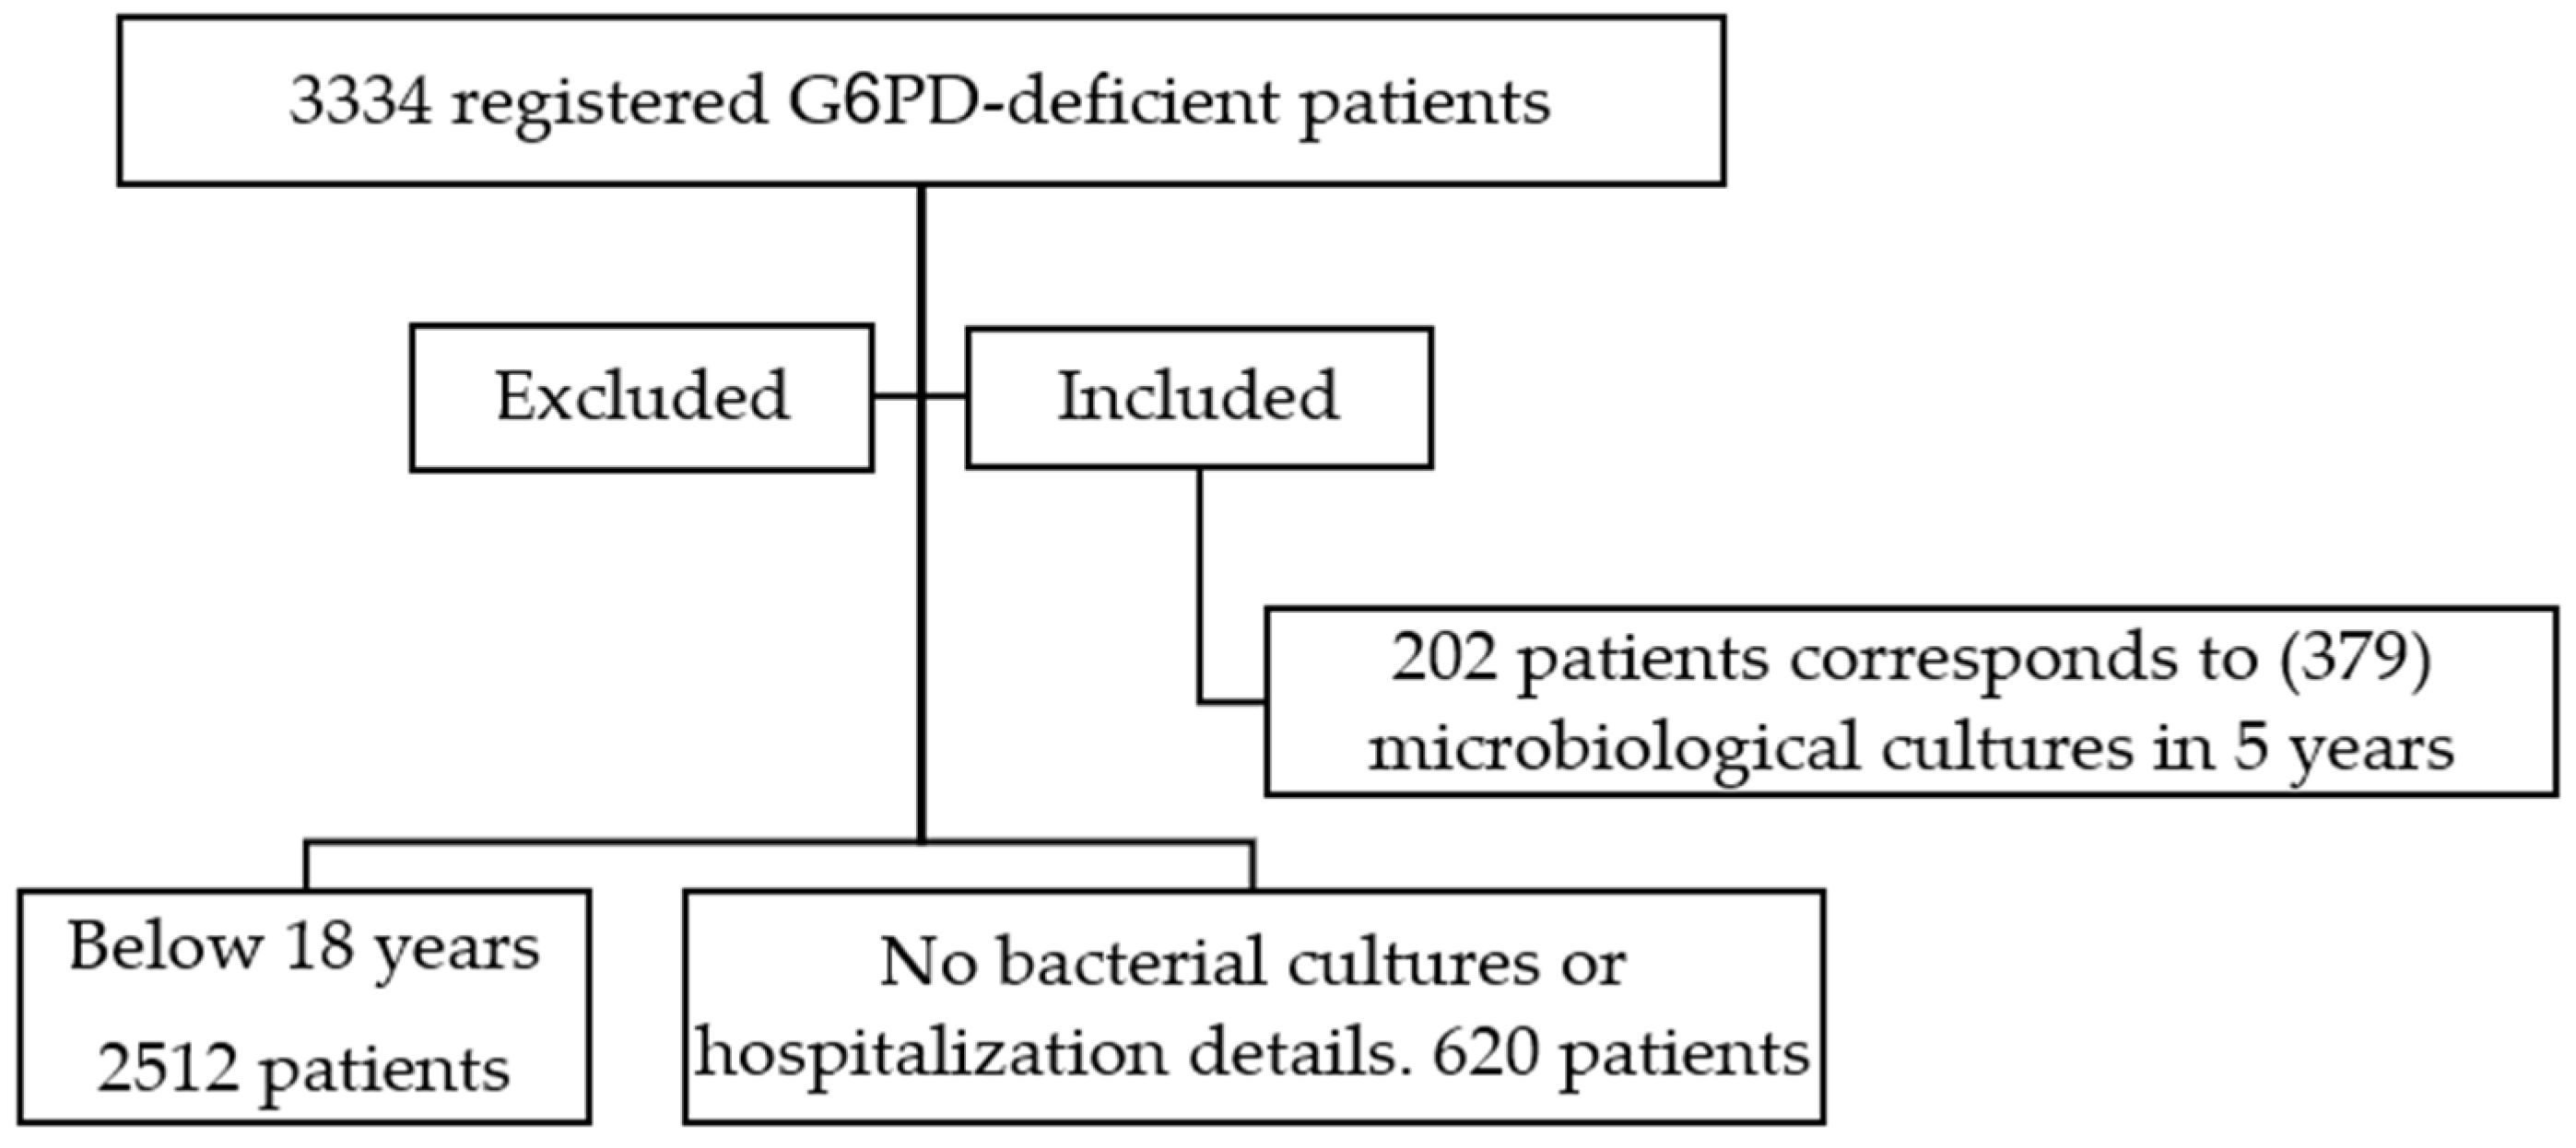
Medical records of 3334 registered G6PD-deficient patients between 1 January 2017 and 31 December 2021 were reviewed; 2512 patients were excluded because they were <18 years when they had a laboratory-documented bacterial infection during the study period (2017–2021), while 620 other adult patients were excluded as they did not have any microbiological cultures or hospitalization details. The remaining 202 patients’ records were examined over the 5-year period, and (379) microbiological cultures corresponding to hospital admissions were recorded and studied. See Figure 1

Figure 1.
A chart of the patients screened for inclusion inn ther study.
3.1. Patients’ Demographics
The majority of the microbiological cultures belonged to male patients (69.9%). The study cohort’s median (IQR) age at admission was 59.9 (41–77), with patients’ ages evenly distributed around the age of 60 years (≤60 years, 50.1%, and >60 years, 49.9%). In total, 72% of the patients were diagnosed with an infectious disease upon admission to the hospital, and the vast majority of the patients were admitted to medical wards (38.5%) with a median (IQR) LOS 12 (5–31). The hospital stay ended in death in 27.7% of cases, with a high incidence of short-term deaths (14-day mortality of 52% of total mortality).
The vast majority of these patients (89%) were suffering from underlying chronic diseases, with a median (IQR) of 3 (2–4) chronic diseases; CCD (84%), DM (75%), and CRF (67%) were the most prevalent of these conditions. A total of 10.3% of the patients possessed a 90-day surgical history, 75.2% underwent invasive procedures during admission sessions, and 55.9% needed a blood transfusion of packed RBCs. Heparin/LMWH was prescribed for prophylaxis/treatment in 63.6% of the cases, inotropes in 32.5%, and vasodilators in 27.4%. Table 1 describes patient demographics.

Table 1.
Patient demographics and relevant clinical details.
3.2. Infection Patterns
The microbiological samples originated in almost an equal proportion from soft tissues (27%), urinary tract (25%), respiratory system (24%), and blood (23%). Gram-negative bacteria dominated the majority of infections (60%), with Klebsiella sp. (27%), Pseudomonas sp. (26%), E. coli (19%), Acinetobacter sp. (14%), and others (15%). Meanwhile, Gram-positive bacteria accounted for (28%) of the cases as follows: Staphylococcus coagulase-negative (CoNS) (37%), Methicillin-sensitive Staphylococcus aureus (MSSA) (21%), Enterococcus sp. (16%), Methicillin-resistant Staphylococcus aureus (MRSA) (11%), and Streptococcus sp. (14%). Fungal infections were detected in 8% of the samples, with Candida albicans accounting for 84% of the infections and other fungi accounting for the remainder. We also tracked severe acute respiratory syndrome coronavirus SARS-CoV-2 infections and found only 14 cases that required hospitalization. Polymicrobial infections occurred in 59% of the cases, among which concurrent infections with Gram-negative was 75%, with Gram-positive was 47%, with Fungi was 26%, and 3% with SARS-CoV-2.
Infections were caused by susceptible bacterial phenotypes in 54% of cases, with the remaining cases caused by resistant isolates, which were distributed as follows: MDR (20%), extended-spectrum β-lactamase bacteria ESBL (15%), CRE (7%), and MRSA (4%). While 56% of the infections were community-acquired (CAIs), hospital-acquired infections (HAIs) accounted for more than one-third of all cases, 44%. Within 90 days, a new infection with a different organism occurred in 36% of the cases. See Figure 2.

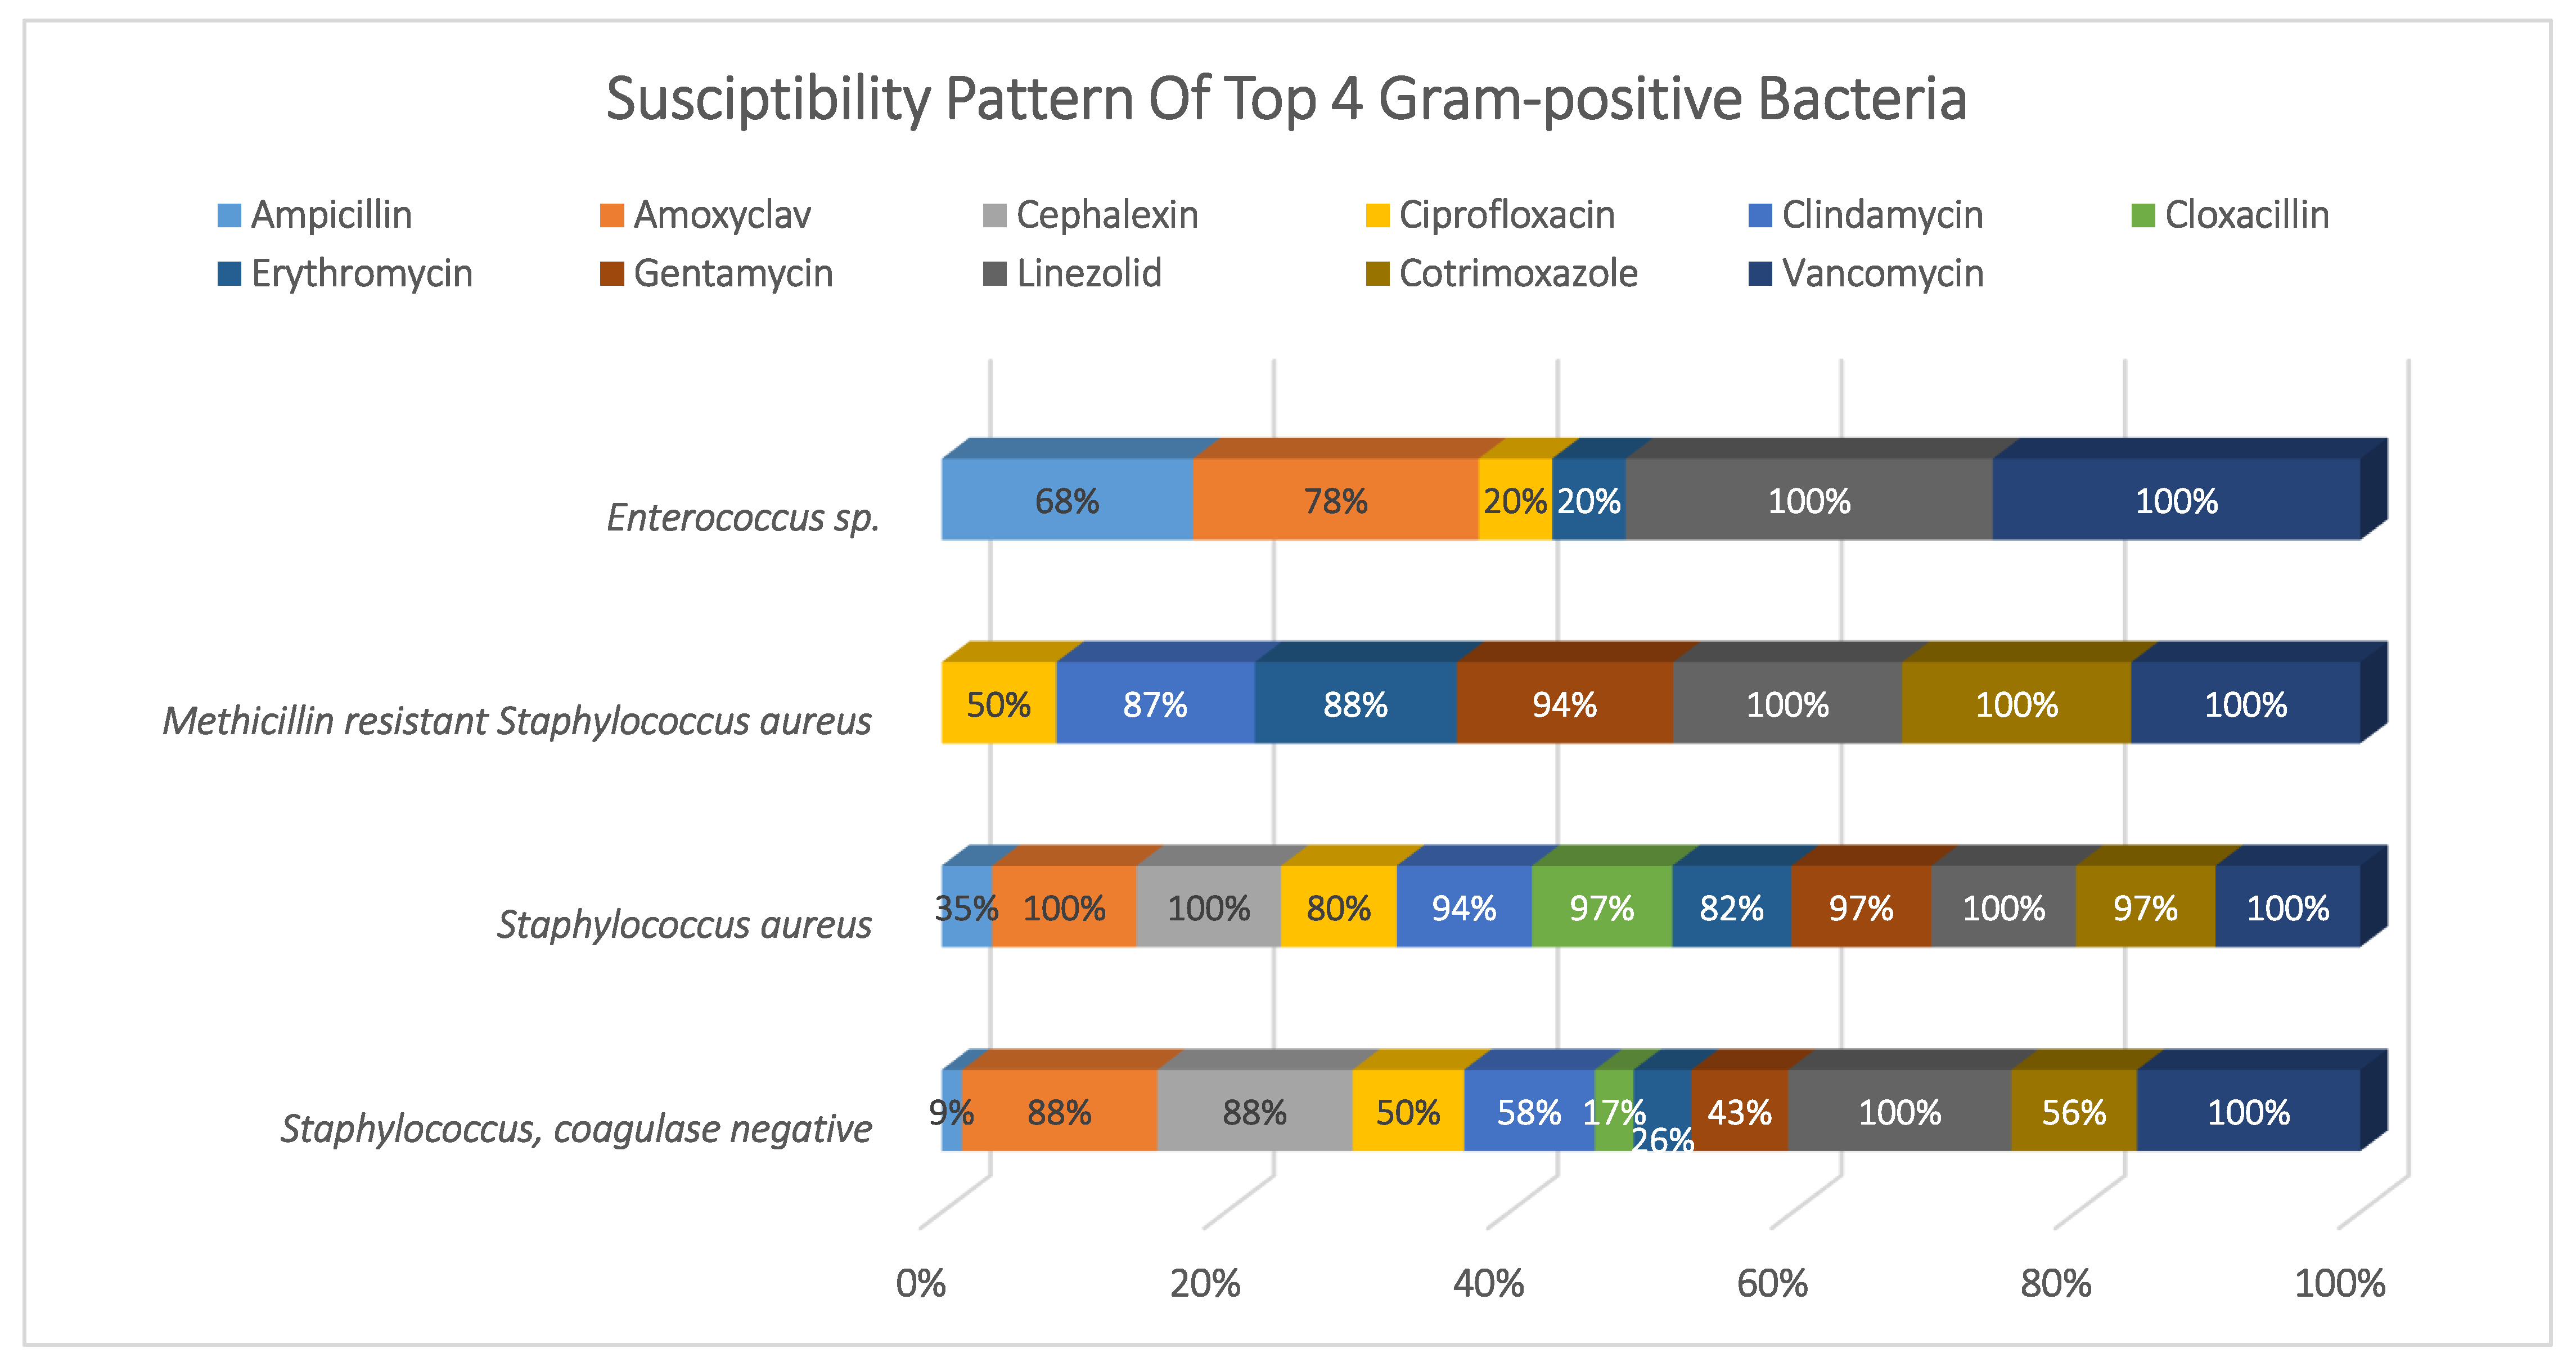
Figure 2.
Susceptibility pattern of top 4 Gram-positive bacteria.
90-day infections prior to index admission occurred in 23% of cases, of which 55% were Gram-negative, 39% were Gram-positive, 23% were SARS-CoV-2, and 5% were fungal.
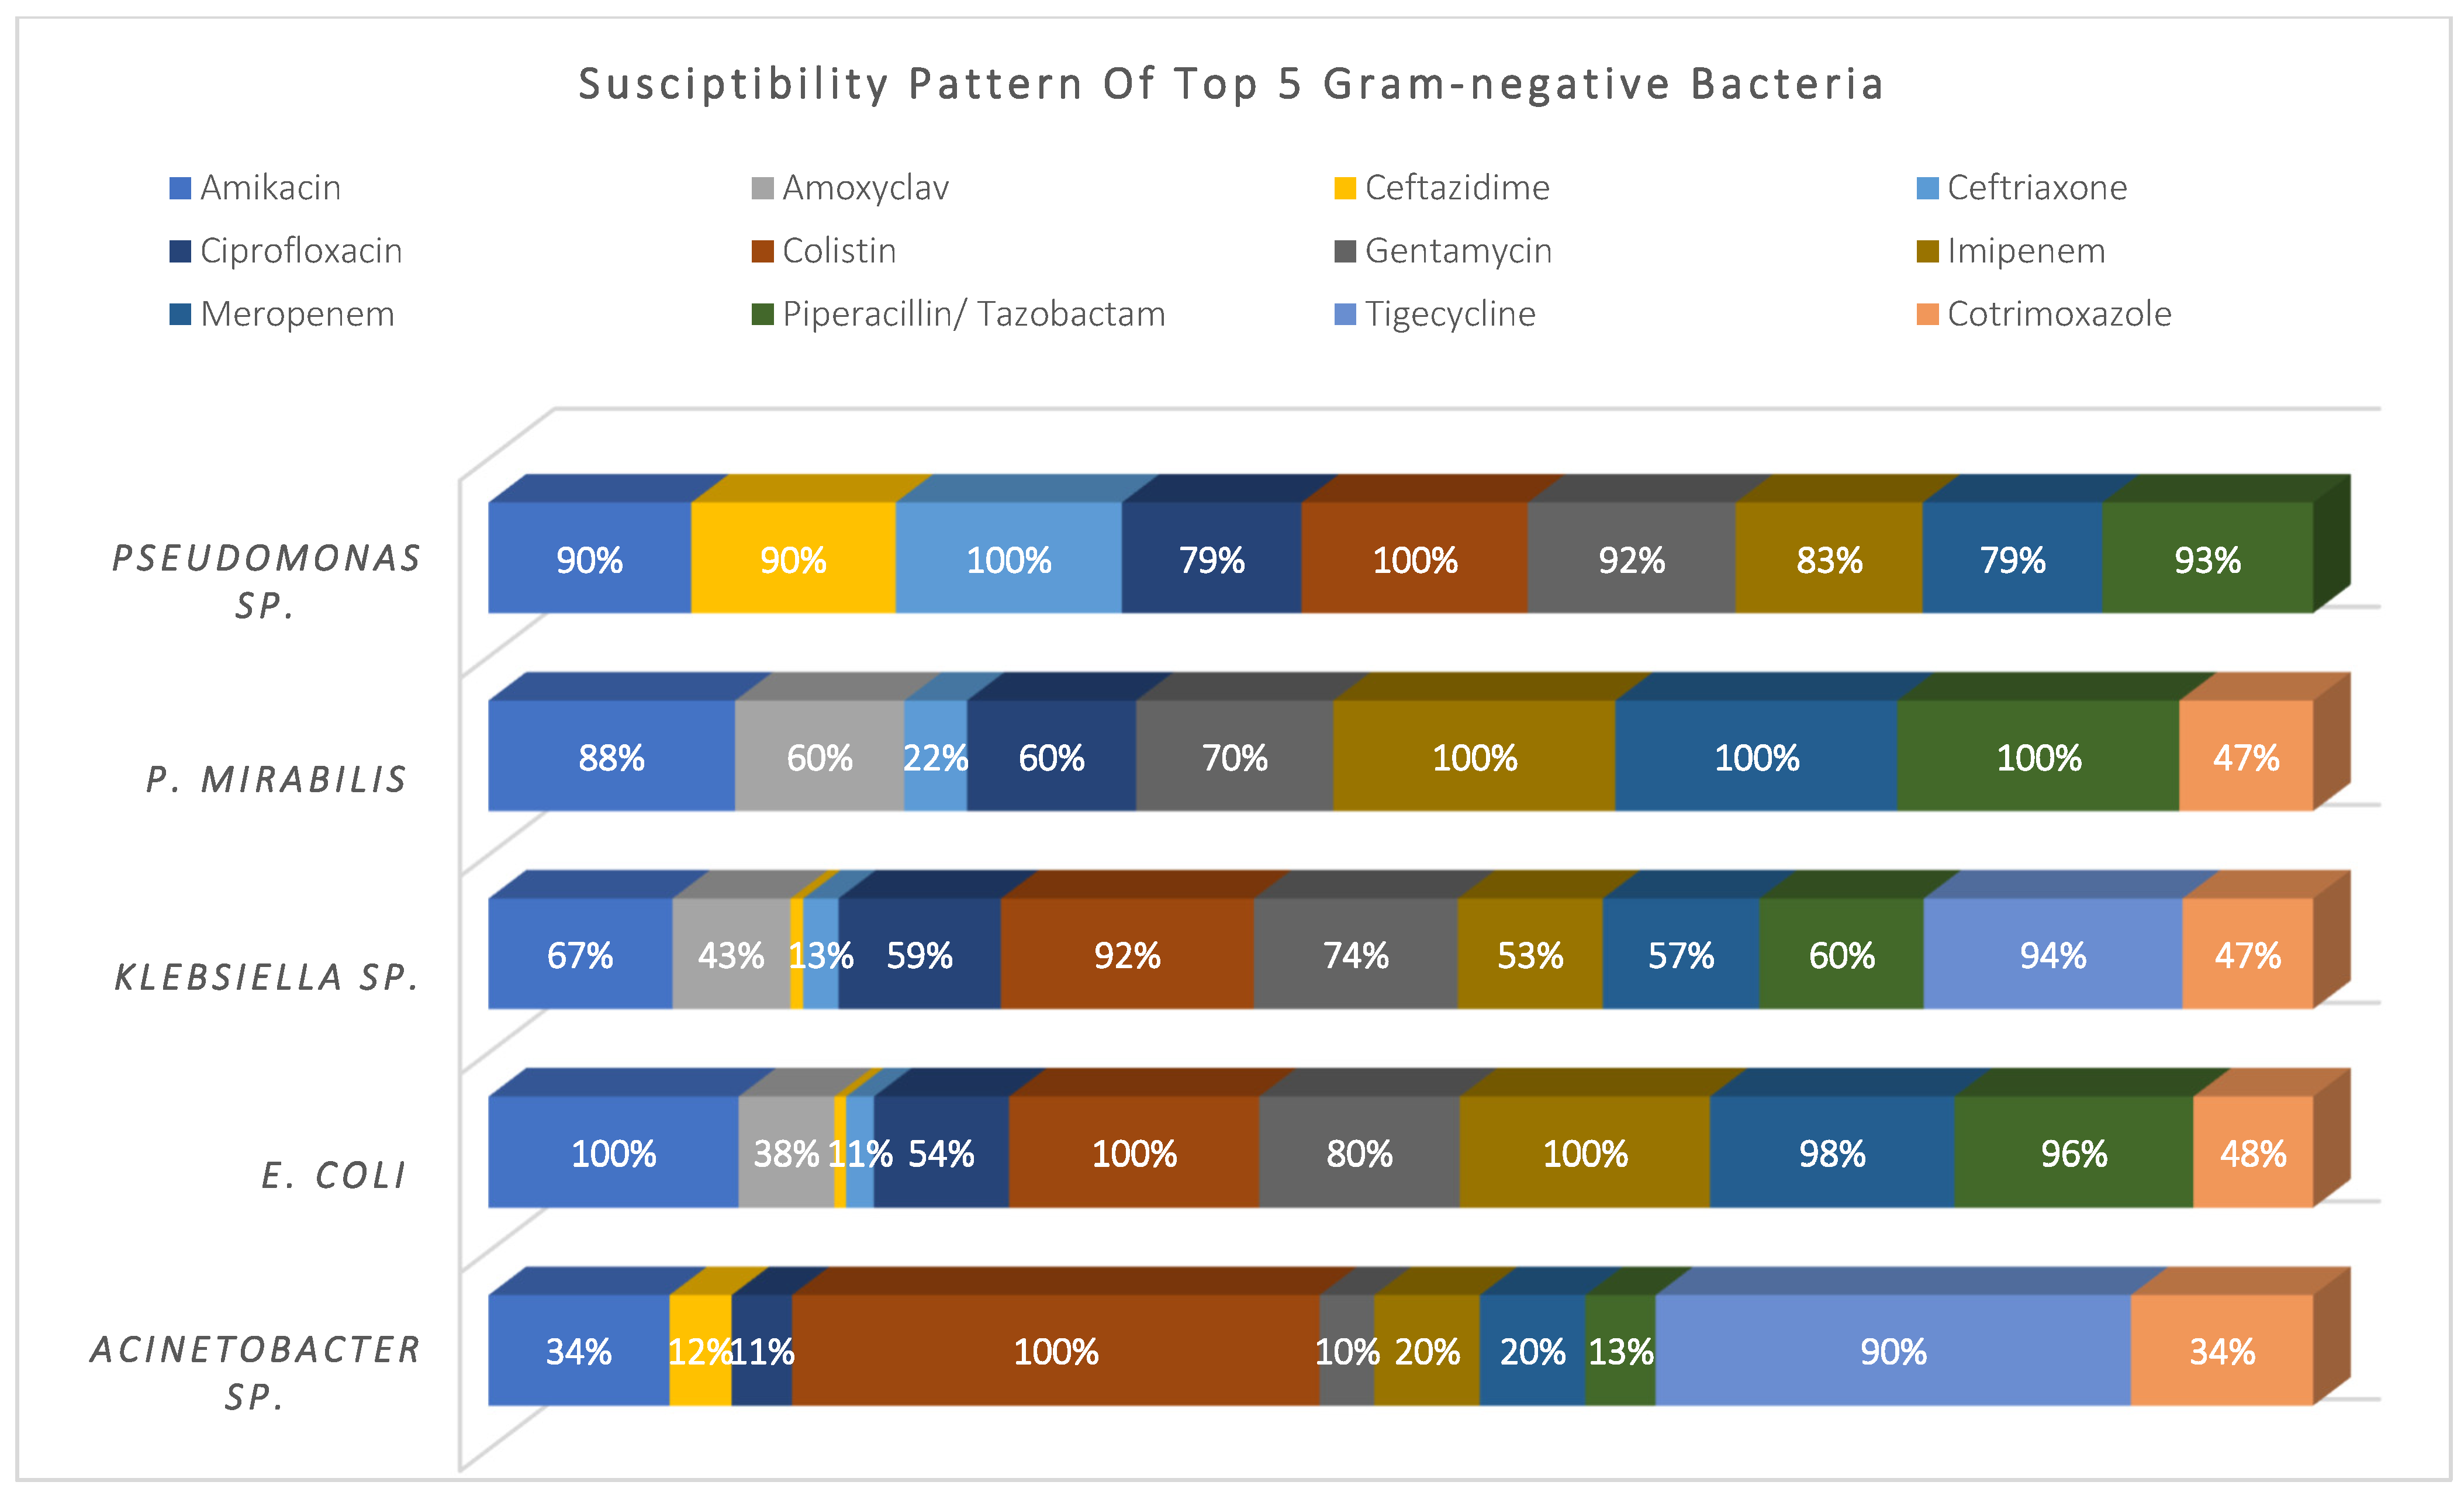
3.3. Susceptibility Pattern
Acinetobacter sp. (14%), E. coli (19%), Klebsiella sp. (27%), P. mirabilis (7%), and Pseudomonas sp. (26%) represented 93% of the total Gram-negative pathogens; they showed high susceptibility to colistin and tigecycline (98% and 92%, respectively), and moderate susceptibility to amikacin, meropenem, and piperacillin/tazobactam (~75%). Meanwhile, they showed higher resistance to cephalosporins, ciprofloxacin, and cotrimoxazole. See Figure 3.
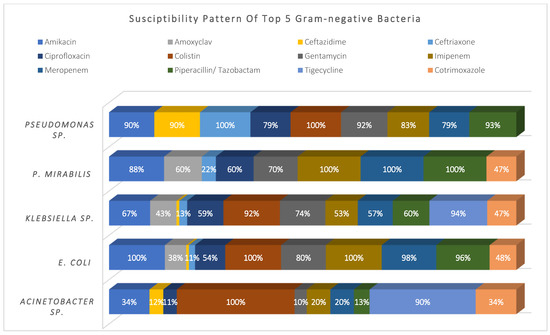
Figure 3.
Susceptibility pattern of top 5 Gram-negative bacteria.
3.4. Antimicrobial Treatment
A total of 42% had been exposed to antimicrobials 90 days prior to index admission, primarily cephalosporins (66%), β-lactams (44%), quinolones (41%), β-lactam/β-lactamase (37%), and other antimicrobials. A total of 66% of the study cohort received antimicrobial monotherapy, while 34% received combined therapy, mainly cephalosporin-based (41%), B-lactam/B-lactamase inhibitor-based (35%), piperacillin/tazobactam-based (26%), quinolones-based (12%), and vancomycin-based therapy (10%). Table 1 details the antimicrobial treatment received.
3.5. MDR-Related Infections
MDR-related infection was significantly associated to >28-day mortality [p < 0.026, OR: 2.44], prolonged LOS >14 days [p < 0.000, OR: 2.41], more than 2 comorbidities [p < 0.032, OR: 1.17], mainly CCD [p < 0.016, OR: 1.84], blood transfusion during admission [p < 0.001, OR: 2.01], infection with Gram-negative bacteria [p < 0.000, OR: 3.08], prior infection with SARS-CoV-2 [p < 0.009, OR: 3.69], concurrent infections with Gram-negative and fungal infections [p < 0.040, OR: 1.54] and [p < 0.000, OR: 2.96], respectively, and HAIs [p < 0.000, OR: 2.90]. MDR-related infections required combined therapy [p < 0.049, OR: 1.54], mainly piperacillin/tazobactam-based [p < 0.000, OR: 2.75], Meropenem-based [p < 0.000, OR: 6.16], Colistin-based [p < 0.000, OR: 8.35], and Tigecycline-based therapy [p < 0.022, OR: 6.18]. See Table 2.
Table 2.
Variables related to hospital-acquired infections/acquisition of MDR infections (Binary logistic regression). Check Appendix A for comprehensive statistical values.
3.6. Hospital-Acquired Infections (HAIs)
HAIs were significantly associated with bacteraemia [p < 0.033, OR: 0.58] and thus more related to 14-day mortality [p < 0.011, OR: 2.13], prolonged LOS > 14 days [p < 0.000, OR: 18.42], admission to critical care [p < 0.000, OR: 10.58], cumulative number of comorbidities [p < 0.010, OR: 1.21], especially CCD p < 0.003, OR: 2.11] and CRD [p < 0.001, OR: 2.38], infection with Gram-negative bacteria [p < 0.000, OR: 2.90], infection with MDR phenotypes [p < 0.000, OR: 4.10], and 90-day prior exposure to metronidazole [p < 0.046, OR: 2.21].
Monotherapies [p < 0.054, OR: 1.53] were more likely prescribed for HAIs. Mainly, the prescribed regimens were meropenem-based [p < 0.029, OR: 2.44], colistin-based [p < 0.000, OR: 7.07], and tigecycline-based therapy [p < 0.037, OR: 5.28]. Polymicrobial infections significantly occurred during HAI [p < 0.000, OR: 9.00], most likely Gram-negative [p < 0.000, OR: 7.60], Gram-positive [p < 0.000, OR: 2.97], and Fungal infections [p < 0.000, OR: 3.85]. See Table 2.
3.7. Fourteen-Day Mortality Risk Factors
Fourteen-day mortality was significantly related to males [p < 0.000, OR: 6.55], patient age >60 years [p < 0.000, OR: 5.63], admission to critical care areas [p < 0.005, OR: 2.30], bacteraemia [p < 0.005, OR: 2.37], HAIs [p < 0.011, OR: 2.13], invasive procedures during admission [p < 0.001, OR: 10.51], cumulative number of comorbidities [p < 0.000, OR: 1.54], especially CCD [p < 0.010, OR: 3.19] and CRF [p < 0.004, OR: 2.69], and immunosuppressed patients or those with active malignancy ([p < 0.042, OR: 2.63] and [p < 0.005, OR: 4.84], respectively). See Table 3.
Table 3.
Risk factors for 14 and 28-day mortalities (Binary logistic regression). Check Appendix A for comprehensive statistical values.
3.8. Twenty-Eight-Day Mortality Risk Factors
Twenty-eight-day mortality occurred more frequently in the following: patients >60 years [p < 0.002, OR: 6.97], prolonged LOS [p < 0.021, OR: 1.01], cumulative number of comorbidities [p < 0.003, OR: 1.72], especially CRD [p < 0.000, OR: 5.05], concurrent infection with either Gram-negative [p < 0.001, OR: 6.14] or Gram-positive bacteria [p < 0.000, OR: 6.26], 90-day history of exposure to antimicrobials [p < 0.037, OR: 2.59], especially cephalosporins [p < 0.020, OR: 2.80], β-lactams [p < 0.008, OR: 3.36], and macrolides [p < 0.004, OR: 4.41]. See Table 3.
4. Discussion
In our practice, identifying patients with this genetic blood disease that may affect their immune response to infections is an integral part of infection control plans and offering optimal therapeutic options pursuant to antibiotic stewardship efforts.
In the Arabian Peninsula, consanguineous marriage widespread within the same tribe resulted in a large spread of G6PD deficiency. Oman is one of the region’s countries with a high number of such cases [23]. Since our tertiary care hospital serves more than a third of the nation’s population and has a considerable number of registered cases of G6PD, we had an excellent opportunity to landscape infectious diseases in a decent number of hospitalized G6PD patients and identify the factors that may cause HAIs, infection with MDR bacteria, and the mortality rates associated with these infections.
Over five years, all adult G6PD-deficient patients admitted to the hospital with microbiological proof of infection at admission or during hospitalization were studied. The vast majority of microbiological cultures were isolated from male patients; a study by Rostami and colleagues corroborated this finding, perhaps due to linkage to the sex chromosome [24]. Gram-negative bacteria dominated the majority of infections (60%), mainly Klebsiella sp., Pseudomonas sp., E. coli, and Acinetobacter sp. Meanwhile, Gram-positive bacteria accounted for (28%) of the cases, mainly CoNS, S. aureus, Enterococcus sp., MRSA, and Streptococcus sp., while fungal infections were detected in 8% of the samples, with C. albicans accounting for 84% of the infections. Although we could not find any previous research that comprehensively identified bacterial infections in G6PD patients prior to writing this article, numerous reports for individual cases described the infectious pathogens observed in this study [6,11,12,13,14,15].
4.1. Risk Factors for MDR-Related Infections
Prolonged LOS contributed significantly to the acquisition of MDR-related infections; both have been linked together in several studies [25,26,27], leading us to believe that attempting early discharge, especially for this type of patient, may reduce the risk of acquiring MDR-related infections while also lowering the cost of hospitalization and treatment.
Patients admitted to critical care areas were almost 2-fold liable for acquiring MDR infection compared to other wards, which is consistent with the finding of Tosi and colleagues [28]. This may be explained by the extensive antibiotic pressure in these areas and other factors such as older age, chronic comorbidities, and suppressed immunity.
Patients with more than two comorbidities were more likely to acquire MDR-related infections; thus, the early medical stabilization of such cases may significantly impact clinical outcomes. Meanwhile, multiple studies statistically correlated the acquisition of MDR-related infections with blood transfusion during admission [29,30], which could be an opportunity to reduce the acquisition of MDR-related infections when adopting robust infection control measures, and commitment to clearly indicated rather than routine blood transfusion, especially since the hospital-acquisition of MDR bacteria in our cohort was very significant.
MDR Gram-negative bacteria were the primary causative organisms; this can be explained by a large proportion of patients having previously been exposed to Gram-negative infection, which may have resulted in the transfer of resistance determinants to current strains of bacteria. Patients with prior SARS-CoV-2 infection were more likely to acquire MDR-related infection; multiple retrospective studies duplicated the same finding [31,32,33]. A total of 65% of MDR infections were polymicrobial, mainly with Gram-negative and fungal infections.
4.2. Risk Factors for HAI
MDR pathogens were the leading cause of HAIs; patients with HAIs were suffering from chronic comorbidities and required admission to critical care, which explains the high rates of 14-day mortality related to HAIs. Increased antimicrobial treatment exposure increases the prevalence of virulent nosocomial bacterial phenotypes. Adopting better multidisciplinary infection control practices, regular disinfection of patient care equipment, reducing unnecessary admissions through updated outpatient practices, and increasing outpatient care resources contribute to a reduction in HAIs [34].
4.3. Risk Factors for Mortality
Age was consistently a risk factor for 14-day and 28-day mortality; patients >60 years had 6-fold higher mortality rates compared to those below 60 years; this is probably due to deteriorated health status and organ dysfunction, as well as immune deficiency caused by immune cell inefficiency in these patients due to G6PD.
The cumulative number of comorbidities significantly contributed to early and late-onset mortalities, mainly in patients with CCD, CRF, CRD, and immunocompromised patients (see Table 3 for details). Chang and colleagues identified illness severity, duration of mechanical ventilation, prior hospitalization, and underlying conditions as predictors of mortality [35], implying that concurrent comorbidities to infections must be clinically stabilized as soon as possible to improve outcomes.
Fourteen-day mortality was significantly related to bacteremia, primarily due to HAI; most of those patients needed to be admitted to critical care areas and required invasive procedures during admission; intuitively, patients admitted to critical care areas usually suffer a diminished health status, weakened immunity, and are more vulnerable to invasive maneuvers and highly virulent pathogens, which necessitate regular disinfection of the ICU environment and patient equipment, as well as optimal intubation practice and avoidance of unnecessary catheterization [34].
As for 28-day mortality, patients with polymicrobial infections were 6-fold liable to death compared to those with monomicrobial; isolates able to disseminate resistance determinants via horizontal gene transfer (HGT) may trigger the high acquisition of MDR infections, which eventually leads to death in immunocompromised patients, given that most of our study cohort suffered severe hemolytic anemia that required blood transfusion during hospitalization.
5. Conclusions
The high prevalence of G6PD deficiency among the Omani population should alert practitioners to consider the possible reduced immune status of this patient population. Evidence-based protocolization of hospital admissions, blood transfusion, and intubation is a crucial clinical step to reduce HAIs and MDR pathogen acquisition in this unique patient group.
Parallel to the early stabilization of underlying comorbid conditions, strict infections, control measures, Gram-negative empiric coverage, the early starting of potent targeted antimicrobial therapy, and hospital discharge at the earliest time possible, in general, and particularly in this patient population, can ameliorate the treatment outcomes and should be emphasized by the antimicrobial stewardship team.
Author Contributions
Data collection, D.A., A.F.O., S.R.S.A.-M. and G.H.; manuscript writing, D.A., G.H. and I.M.G.; statistical analsis, D.A., I.M.G., S.R.S.A.-M. and G.H.; conception, D.A., A.F.O. and I.M.G.; execution, D.A. and I.M.G. All authors have read and agreed to the published version of the manuscript.
Funding
This research received no external funding.
Institutional Review Board Statement
The study was conducted in accordance with the Declaration of Helsinki, and approved by Research, Ethical Review and Approve Committee—North Batinah Governorate, ethical approval number: MH/DHGS/NBG/1/2018, dated: 4 January 2018. for studies involving humans.
Informed Consent Statement
Informed consent was waived due to retrospective nature of the study.
Data Availability Statement
Raw data are available at Suhar Hospital database, upon written request and approval.
Conflicts of Interest
The authors declare no conflict of interest.
Abbreviations
| BU | Burn unit |
| CAIs | Community-acquired infections |
| CCD | Chronic cardiac diseases |
| CCU | Cardiac care unit |
| CI | Confidence intervals |
| CLSI | Clinical And Laboratory Standards Institute |
| CoNS | Staphylococcus, coagulase-negative |
| CRD | Chronic respiratory disease |
| CRE | Carbapenem-resistant Enterobacterales |
| CRF | Chronic renal failure |
| CRP | C-reactive protein |
| DM | Diabetes mellitus |
| ESBL | Extended-spectrum β-lactamase bacteria |
| G6PD | Glucose-6-phosphate dehydrogenase |
| HAIs | Hospital-acquired infections |
| ICU | Intensive care unit |
| IQR | Interquartile ranges |
| LMWH | Low molecular weight heparin |
| LOS | Length of stay |
| MDR | Multidrug-resistant |
| MRSA | Methicillin-resistant Staphylococcus aureus |
| NADP | Nicotinamide adenine dinucleotide phosphate |
| NETs | Neutrophil extracellular traps |
| OR | Odds ratio |
| p | Probability value |
| RBCs | Red blood cells |
| ROS | Reactive oxygen species |
| SARS-CoV-2 | Severe acute respiratory syndrome coronavirus 2019 |
| WBC | White blood cell count |
Appendix A
Table A1.
Variables related to acquisition of MDR and Hospital-acquired infections. (Binary logistic regression).
Table A1.
Variables related to acquisition of MDR and Hospital-acquired infections. (Binary logistic regression).
| Included (n = 379) | N (%) | Hospital-Acquired Infections (n = 167) | MDR Infection (n = 153) | ||||
|---|---|---|---|---|---|---|---|
| N (%) | p OR | CI | N % | p Value OR | CI | ||
| Gender | |||||||
| Male | 265 69.9% | 109 65.3% | 0.67 | (0.43, 1.05) | 101 66.0% | 0.173 0.73 | (0.47, 1.14) |
| Female | 114 30.1% | 58 34.7% | 0.080 1.48 | (0.95, 2.30) | 52 34.0% | 1.36 | (0.87, 2.12) |
| Age on admission-Median (IQR) | 59.9 (41–77) | 59 (36.5–77) | 0.399 1.00 | (0.99, 1.01) | 63 (41–77) | 0.848 1.00 | (0.99, 1.01) |
| ≤ 60 Years | 190 50.1% | 86 51.5% | 0.637 1.10 | (0.74, 1.65) | 73 47.7% | 0.438 0.85 | (0.56, 1.28) |
| > 60 years | 189 49.9% | 81 48.5% | 0.91 | (0.60, 1.36) | 80 52.3% | 1.18 | (0.78, 1.77) |
| Length of stay (LOS) Median (IQR) | 12 (5–31) | 34 (17–60) | 0.000 1.10 | (1.08, 1.13) | 22 (8–41.5) | 0.000 1.01 | (1.01, 1.02) |
| ≤ 14 days | 184 48.5% | 28 16.8% | 0.05 | (0.03, 0.09) | 59 38.6% | 0.42 | (0.27, 0.63) |
| > 14 days | 195 51.5% | 139 83.2% | 0.000 18.42 | (10.92, 31.07) | 94 61.4% | 0.000 2.41 | (1.58, 3.67) |
| Admission Diagnosis | |||||||
| Infectious disease diagnosis | 273 72.0% | 115 68.9% | 0.223 0.76 | (0.48, 1.19) | 113 73.9% | 0.515 1.17 | (0.74, 1.85) |
| Non-infectious diagnosis | 106 28.0% | 52 31.1% | 1.32 | (0.84, 2.08) | 40 26.1% | 0.86 | (0.54, 1.36) |
| Discharge outcome | |||||||
| Death | 105 27.7% | 73 43.7% | 0.000 4.37 | (2.69, 7.09) | 47 30.7% | 0.281 1.28 | (0.81, 2.02) |
| Recovery | 274 72.3% | 94 56.3% | 0.23 | (0.14, 0.37) | 106 69.3% | 0.78 | (0.49, 1.23) |
| Time to death | |||||||
| 14-day mortality | 55 52.4% | 33 19.8% | 0.011 2.13 | (1.19, 3.81) | 21 13.7% | 0.721 0.90 | (0.50, 1.62) |
| 28-day mortality | 22 21.0% | 14 8.4% | 0.063 2.33 | (0.95, 5.70) | 9 5.9% | 0.952 1.02 | (0.43, 2.46) |
| >28-day mortality | 28 26.7% | 26 15.6% | 0.000 19.36 | (4.52, 82.87) | 17 11.1% | 0.026 2.44 | (1.11, 5.37) |
| Admission ward | |||||||
| Critical care area | 117 30.9% | 94 56.3% | 0.000 10.58 | (6.23, 17.98) | 64 41.8% | 0.000 2.35 | (1.50, 3.66) |
| Medical ward | 146 38.5% | 42 25.1% | 0.000 0.35 | (0.22, 0.54) | 50 32.7% | 0.055 0.66 | (0.43, 1.01) |
| Surgical ward | 116 30.6% | 31 18.6% | 0.000 0.34 | (0.21, 0.55) | 39 25.5% | 0.076 0.66 | (0.42, 1.04) |
| Underlying Comorbid conditions | |||||||
| Number of comorbid conditions Median (IQR) | 3 (2–4) | 3 (2–4) | 0.010 1.21 | (1.05, 1.40) | 2 (0–3) | 0.032 1.17 | (1.01, 1.36) |
| Any comorbidity | 338 89.2% | 149 89.2% | 0.982 1.01 | (0.52, 1.94) | 139 90.8% | 0.391 1.35 | (0.68, 2.66) |
| Chronic Cardiac Diseases | 282 83.4% | 137 82.0% | 0.003 2.11 | (1.29, 3.44) | 124 81.0% | 0.016 1.84 | (1.12, 3.02) |
| Diabetes | 254 75.1% | 104 62.3% | 0.082 0.68 | (0.44, 1.05) | 99 64.7% | 0.431 0.84 | (0.54, 1.29) |
| Chronic renal failure | 228 67.5% | 108 64.7% | 0.112 1.40 | (0.92, 2.13) | 100 65.4% | 0.089 1.44 | (0.95, 2.21) |
| Others | 179 53.0% | 87 52.1% | 0.093 1.42 | (0.94, 2.13) | 79 51.6% | 0.158 1.35 | (0.89, 2.03) |
| Chronic Resp. Disease | 70 20.7% | 43 25.7% | 0.001 2.38 | (1.39, 4.05) | 34 22.2% | 0.123 1.51 | (0.89, 2.54) |
| Immuno-suppressed | 24 7.1% | 15 9.0% | 0.066 2.23 | (0.95, 5.22) | 9 5.9% | 0.767 0.88 | (0.37, 2.06) |
| Sickle Cell | 19 5.6% | 3 1.8% | 0.019 0.22 | (0.06, 0.78) | 7 4.6% | 0.748 0.86 | (0.33, 2.22) |
| Active malignancy | 14 4.1% | 9 5.4% | 0.131 2.36 | (0.78, 7.17) | 5 3.3% | 0.718 0.81 | (0.27, 2.48) |
| HIV follow-up | 1 0.3% | 0 0.0% | 0.970 ** | ** | 0 0.0% | 0.970 ** | ** |
| Other Risk Factors | |||||||
| Invasive procedure during admission | 285 75.2% | 137 82.0% | 0.000 8.15 | (4.26, 15.59) | 101 66.0% | 0.150 1.43 | (0.88, 2.33) |
| Need for blood transfusion | 212 55.9% | 155 92.8% | 0.000 8.34 | (5.14, 13.55) | 121 79.1% | 0.001 2.01 | (1.37, 3.08) |
| Surgery 90-day history | 39 10.3% | 15 9.0% | 0.458 0.77 | (0.39, 1.53) | 15 9.8% | 0.798 0.91 | (0.46, 1.81) |
| Medication | |||||||
| Analgesics | 283 74.7% | 131 78.4% | 0.135 1.44 | (0.89, 2.31) | 115 75% | 0.856 1.04 | (0.65, 1.68) |
| Proton pump inhibitor | 269 71.0% | 143 85.6% | 0.000 4.07 | (2.44, 6.79) | 116 76% | 0.088 1.50 | (0.94, 2.38) |
| Heparin/LMWH | 241 63.6% | 138 82.6% | 0.000 5.04 | (3.12, 8.16) | 114 75% | 0.000 2.28 | (1.45, 3.57) |
| Diuretics | 206 54.4% | 108 64.7% | 0.000 2.13 | (1.40, 3.23) | 94 61% | 0.023 1.62 | (1.07, 2.467) |
| Cortico-steroids | 124 32.7% | 79 47.3% | 0.000 3.33 | (2.13, 5.21) | 52 34% | 0.665 1.10 | (0.71, 1.70) |
| Inotropes | 123 32.5% | 78 46.7% | 0.000 1.40 | (0.92, 2.13) | 54 35% | 0.332 1.24 | (0.80, 1.92) |
| Vasodilators | 104 27.4% | 59 35.3% | 0.002 2.03 | (1.28, 3.20) | 37 24% | 0.243 0.76 | (0.47, 1.21) |
| Albumin | 66 17.4% | 45 26.9% | 0.000 3.25 | (2.08, 5.09) | 24 16% | 0.466 0.8151 | (0.47, 1.41) |
| Culture sample type | |||||||
| Skin and soft tissue | 103 27.2% | 30 18.0% | 0.747 0.93 | (0.59, 1.46) | 35 22.9% | 0.122 0.69 | (0.43, 1.11) |
| Urine | 96 25.3% | 0 0.0% | 0.264 1.30 | (0.82, 2.07) | 47 30.7% | 0.048 1.60 | (1.00, 2.55) |
| Respiratory | 91 24.0% | 46 27.5% | 0.154 1.41 | (0.88, 2.26) | 33 21.6% | 0.360 0.80 | (0.49, 1.29) |
| Blood | 88 23.2% | 44 26.3% | 0.033 0.58 | (0.35, 0.96) | 38 24.8% | 0.540 1.16 | (0.72, 1.89) |
| Body fluids | 1 0.3% | 47 28.1% | ** ** | ** | 0 0.0% | ** ** | ** |
| Organism causing infections | |||||||
| Gram-positive bacteria | 107 28.2% | 28 16.8% | 0.000 0.34 | (0.21, 0.55) | 38 24.8% | 0.195 0.74 | (0.46, 1.17) |
| Gram-negative bacteria | 227 59.9% | 123 73.7% | 0.000 2.90 | (1.88, 4.49) | 115 75.2% | 0.000 3.08 | (1.96, 4.83) |
| Fungal | 31 8.2% | 15 9.0% | 0.613 1.21 | (0.58, 2.52) | ** ** | ** ** | ** |
| SARS-CoV-19 | 14 3.7% | 1 0.6% | 0.022 0.09 | (0.01, 0.71) | ** ** | ** ** | ** |
| Resistant Phenotype for bacterial infections (n-334) | |||||||
| Sens | 181 54.2% | 76 45.5% | 0.000 0.35 | (0.23, 0.53) | ** ** | ** ** | ** |
| MDR | 67 20.1% | 48 28.7% | 0.000 4.10 | (2.29, 7.31) | 67 43.8% | ** ** | ** |
| ESBL | 50 15.0% | 25 15.0% | 0.365 1.32 | (0.73, 2.39) | 50 32.7% | ** ** | ** |
| CRE | 24 7.2% | 17 10.2% | 0.008 3.32 | (1.34, 8.20) | 24 15.7% | ** ** | ** |
| MRSA | 12 3.6% | 1 0.6% | 0.035 0.11 | (0.01, 0.86) | 12 7.8% | ** ** | ** |
| Place of Acquisition | |||||||
| Community | 212 55.9% | ** ** | ** ** | ** | 62 40.5% | 0.35 | (0.23, 0.53) |
| Hospital | 167 44.1% | ** ** | ** ** | ** | 91 59.5% | 0.000 2.90 | (1.89, 4.43) |
| 90 days ocurrence of any infection | 136 35.9% | 61 36.5% | 0.817 1.05 | (0.69, 1.60) | 59 38.6% | 0.371 1.21 | (0.79, 1.86) |
| Prior exposure to antimicrobials | 158 41.7% | 60 35.9% | 0.044 0.65 | (0.43, 0.99) | 69 45.1% | 0.268 1.26 | (0.83, 1.92) |
| 90-day exposure to Cephalosporins | 105 66.5% | 32 19.2% | 0.001 0.45 | (0.28, 0.73) | 46 30.1% | 0.398 1.22 | (0.77, 1.92) |
| 90-day exposure to B-lactams | 70 44.3% | 34 20.4% | 0.203 1.44 | (0.82, 2.52) | 32 20.9% | 0.314 1.31 | (0.78, 2.21) |
| 90-day exposure to Quinolones | 64 40.5% | 25 15.0% | 0.377 0.78 | (0.45, 1.35) | 32 20.9% | 0.087 1.60 | (0.93, 2.75) |
| 90-day exposure to B-lactam/B-lactamase | 58 36.7% | 30 18.0% | 0.203 1.44 | (0.82, 2.52) | 27 17.6% | 0.298 1.35 | (0.77, 2.37) |
| 90-day exposure to Macrolides | 34 21.5% | 15 9.0% | 0.995 1.00 | (0.49, 2.04) | 19 12.4% | 0.057 1.99 | (0.98, 4.06) |
| 90-day exposure to Glycopeptides | 33 20.9% | 7 4.2% | 0.008 0.31 | (0.13, 0.74) | 17 11.1% | 0.175 1.64 | (0.80, 3.36) |
| 90-day exposure to Nitroimidazole | 29 18.4% | 18 10.8% | 0.046 2.21 | (1.01, 4.81) | 16 10.5% | 0.095 1.91 | (0.89, 4.10) |
| 90-day exposure to Aminoglycosides | 25 15.8% | 4 2.4% | 0.007 0.22 | (0.08, 0.66) | 8 5.2% | 0.380 0.68 | (0.29, 1.61) |
| 90-day exposure to Tetracyclines | 19 12.0% | 2 1.2% | 0.009 0.14 | (0.03, 0.61) | 8 5.2% | 0.874 1.08 | (0.42, 2.75) |
| 90-day exposure to Glycylcycline | 3 1.9% | 1 0.6% | 0.709 0.63 | (0.06, 7.04) | 2 1.3% | 0.374 2.98 | (0.27, 33.16) |
| 90-day exposure to Oxazolidinones | 2 1.3% | 0 0.0% | ** ** | ** | 1 0.7% | 0.782 1.48 | (0.09, 23.85) |
| 90-day exposure to Colistin | 1 0.6% | 0 0.0% | ** ** | ** | 0 ** | ** ** | ** |
| Antimicrobial treatment | |||||||
| Monotherapy | 250 66.0% | 119 71.3% | 0.054 1.53 | (0.99, 2.37) | 92 60.1% | 0.65 | (0.42, 0.99) |
| Combined therapy | 129 34.0% | 48 28.7% | 0.65 | (0.42, 1.01) | 61 39.9% | 0.049 1.54 | (1.00, 2.37) |
| Cephalosporin-based therapy | 157 41.4% | 34 20.4% | 0.003 0.53 | (0.35, 0.81) | 46 30.1% | 0.000 0.45 | (0.29, 0.69) |
| B-lactam/B-lactamase inhibitor-based therapy | 131 34.6% | 35 21.0% | 0.781 1.06 | (0.69, 1.63) | 65 42.5% | 0.008 1.79 | (1.16, 2.75) |
| Pip/Taz based therapy | 99 26.1% | 31 18.6% | 0.206 1.35 | (0.85, 2.13) | 58 37.9% | 0.000 2.75 | (1.72, 4.41) |
| Quinolones-based therapy | 45 11.9% | 10 6.0% | 0.708 1.13 | (0.60, 2.10) | 17 11.1% | 0.706 0.88 | (0.47, 1.68) |
| Vancomycin-based therapy | 38 10.0% | 5 3.0% | 0.010 0.36 | (0.17, 0.78) | 16 10.5% | 0.818 1.08 | (0.55, 2.14) |
| B-lactam-based treatment | 37 9.8% | 10 6.0% | 0.105 1.76 | (0.89, 3.499) | 24 15.7% | 0.002 3.05 | (1.49, 6.19) |
| Tetracycline-based treatment | 30 7.9% | 7 4.2% | 0.111 0.52 | (0.23, 1.16) | 12 7.8% | 0.966 0.98 | (0.46, 2.11) |
| Macrolide-based treatment | 28 7.4% | 1 0.6% | 0.040 0.40 | (0.16, 0.96) | 7 4.6% | 0.091 0.47 | (0.19, 1.13) |
| Meropenem based therapy | 28 7.4% | 8 4.8% | 0.029 2.44 | (1.09, 5.44) | 22 14.4% | 0.000 6.16 | (2.43, 15.58) |
| Colistin-based therapy | 24 6.3% | 8 4.8% | 0.000 7.07 | (2.37, 21.13) | 20 13.1% | 0.000 8.35 | (2.79, 24.94) |
| Aminoglycosides-based therapy | 22 5.8% | 1 0.6% | 0.759 0.87 | (0.36, 2.09) | 9 5.9% | 0.958 1.02 | (0.43, 2.46) |
| Tigecycline-based therapy | 10 2.6% | 7 4.2% | 0.037 5.28 | (1.11, 25.22) | 8 5.2% | 0.022 6.18 | (1.29, 29.51) |
| Linezolid based therapy | 2 0.5% | 2 1.2% | ** ** | ** | 2 1.3% | ** ** | ** |
| 90-day previous infections | 87 23.0% | 30 18.0% | 0.934 0.98 | (0.60, 1.59) | 39 25.5% | 0.335 1.27 | (0.78, 2.06) |
| Gram-negative | 48 55.2% | 16 18.4% | 0.328 0.73 | (0.39, 1.37) | 21 13.7% | 0.610 1.17 | (0.64, 2.16) |
| Gram-positive | 34 39.1% | 10 11.5% | 0.474 0.77 | (0.37, 1.58) | 14 9.2% | 0.920 1.04 | (0.51, 2.12) |
| SARS-CoV-19 | 20 23.0% | 15 17.2% | 0.001 27.09 | (3.59, 204.55) | 14 9.2% | 0.009 3.69 | (1.39, 9.84) |
| Fungal | 4 4.6% | 2 2.3% | 0.810 1.27 | (0.18, 9.13) | 2 1.3% | 0.695 1.48 | (0.21, 10.65) |
| Concomitant infections | |||||||
| Polymicrobial infections (Yes) | 224 59.1% | 101 60.5% | 0.000 9.00 | (5.42, 14.95) | 99 64.7% | 0.068 1.48 | (0.97, 2.26) |
| Gram-negative | 169 75.4% | 90 53.9% | 0.000 7.60 | (4.81, 12.02) | 78 51.0% | 0.040 1.54 | (1.02, 2.33) |
| Gram-positive | 106 47.3% | 51 30.5% | 0.000 2.97 | (1.87, 4.73) | 50 32.7% | 0.094 1.47 | (0.94, 2.32) |
| Fungal | 59 26.3% | 24 14.4% | 0.000 3.85 | (2.10, 7.07) | 37 24.2% | 0.000 2.96 | (1.66, 5.26) |
| SARS-CoV-19 | 7 3.1% | 3 1.8% | 0.163 3.24 | (0.62, 16.92) | 3 2.0% | 0.892 1.11 | (0.24, 5.03) |
| Time between admission and sampling Median (IQR) | 2 (0–15) | 17 (10–29) | 0.000 52.51 | (14.02, 196.66) | 7 (1–25.5) | 0.000 1.03 | (1.01, 1.03) |
** Value can’t be produced by software.
Table A2.
Risk factors for 14 and 28-day mortalities (Binary logistic regression).
Table A2.
Risk factors for 14 and 28-day mortalities (Binary logistic regression).
| Included (n = 379) | 14-Day Mortality (n = 55) | 28-Day Mortality (n = 22) | |||||
|---|---|---|---|---|---|---|---|
| N (%) | N (%) | p OR | CI | N (%) | p OR | CI | |
| Gender | |||||||
| Male | 265 69.9% | 51 92.7% | 0.000 6.55 | (2.31, 18.60) | 16 73% | 0.768 1.16 | (0.44, 3.04) |
| Female | 114 30.1% | 4 7.3% | 0.15 | (0.05, 0.43) | 6 27% | 0.86 | (0.33, 2.27) |
| Age on admission-Median (IQR) | 59.9 (41–77) | 74 (65.81.5) | 0.000 1.04 | (1.02, 1.06) | 78 (69.4–84.2) | 0.000 1.05 | (1.02, 1.09) |
| ≤60 Years | 190 50.1% | 10 18.2% | 0.18 | (0.09, 0.37) | 3 14% | 0.14 | (0.04, 0.49) |
| >60 years | 189 49.9% | 45 81.8% | 0.000 5.63 | (2.74, 11.55) | 19 86% | 0.002 6.97 | (2.03, 23.95) |
| Length of stay (LOS) Median (IQR) | 12 (5–31) | 15 (4–22) | 0.043 0.99 | (0.97, 0.99) | 33 (26–39.3) | 0.021 1.01 | (1.00, 1.02) |
| ≤14 days | 184 48.5% | 27 49.1% | 0.90 | (0.51, 1.59) | 0 0% | ** ** | ** |
| >14 days | 195 51.5% | 28 50.9% | 0.705 1.12 | (0.63, 1.99) | 22 100% | ** ** | ** |
| Admission Diagnosis | |||||||
| Infectious disease diagnosis | 273 72.0% | 43 78.2% | 0.274 1.46 | (0.74, 2.90) | 19 86% | 0.136 2.57 | (0.74, 8.87) |
| Non-infectious diagnosis | 106 28.0% | 12 21.8% | 0.68 | (0.35, 1.35) | 3 14% | 0.39 | (0.11, 1.34) |
| Admission ward | |||||||
| Critical care area | 117 30.9% | 26 47.3% | 0.005 2.30 | (1.28, 4.11) | 8 36% | 0.566 1.30 | (0.53, 3.19) |
| Medical ward | 146 38.5% | 27 49.1% | 0.084 1.66 | (0.93, 2.95) | 14 64% | 0.017 2.98 | (1.22, 7.29) |
| Surgical ward | 116 30.6% | 2 3.6% | 0.000 0.07 | (0.02, 0.29) | 0 0% | ** ** | ** |
| Underlying Comorbid conditions | |||||||
| Number of comorbid conditions Median (IQR) | 3 (2–4) | 3 (2–4) | 0.000 1.54 | (1.22, 1.95) | 2 (2.8–4) | 0.003 1.72 | (1.19, 2.48) |
| Any comorbidity | 338 89.2% | 54 98.2% | 0.000 1.54 | (1.22, 1.95) | 22 100% | ** ** | ** |
| Chronic Cardiac Diseases | 282 83.4% | 49 89.1% | 0.010 3.19 | (1.32, 7.7025) | 20 91% | 0.086 3.63 | (0.83, 15.81) |
| Diabetes | 254 75.1% | 38 69.1% | 0.724 1.12 | (0.60, 2.07) | 19 86% | 0.059 3.29 | (0.95, 11.33) |
| Chronic renal failure | 228 67.5% | 43 78.2% | 0.004 2.69 | (1.37, 5.30) | 17 77% | 0.100 2.35 | (0.85, 6.52) |
| Others | 179 53.0% | 35 63.6% | 0.009 2.19 | (1.21, 3.95) | 13 59% | 0.255 1.66 | (0.69, 3.99) |
| Chronic Resp. Disease | 70 20.7% | 12 21.8% | 0.490 1.28 | (0.64, 2.58) | 11 50% | 0.000 5.05 | (2.09, 12.19) |
| Immuno-suppressed | 24 7.1% | 7 12.7% | 0.042 2.63 | (1.04, 6.68) | 1 5% | 0.724 0.69 | (0.09, 5.37) |
| Sickle Cell | 19 5.6% | 1 1.8% | 0.265 0.31 | (0.04, 2.41) | 0 0% | ** ** | ** |
| Active malignancy | 14 4.1% | 6 10.9% | 0.005 4.84 | (1.61, 14.54) | 1 5% | 0.828 1.26 | (0.16, 10.10) |
| HIV follow-up | 1 0.3% | 1 1.8% | ** ** | ** | 0 0% | ** ** | ** |
| Other Risk Factors | |||||||
| Invasive procedure during admission | 285 75.2% | 53 96.4% | 0.001 10.51 | (2.51, 44.01) | 22 100% | ** ** | ** |
| Need for blood transfusion | 212 55.9% | 36 65.5% | 0.126 1.59 | (0.88, 2.89) | 20 91% | 0.004 8.59 | (1.98, 37.32) |
| Surgery 90-day history | 39 10.3% | 4 7.3% | 0.429 0.65 | (0.22, 1.90) | 0 0% | ** ** | ** |
| Medication | |||||||
| Analgesics | 283 74.7% | 39 70.9% | 0.489 0.80 | (0.42, 1.51) | 13 59% | 0.090 0.47 | (0.19, 1.13) |
| Proton pump inhibitor | 269 71.0% | 47 85.5% | 0.013 2.70 | (1.23, 5.92) | 22 100% | ** ** | ** |
| Heparin/LMWH | 241 63.6% | 48 87.3% | 0.000 4.65 | (2.04, 10.60) | 22 100% | ** ** | ** |
| Diuretics | 206 54.4% | 37 67.3% | 0.040 1.89 | (1.03, 3.45) | 19 86% | 0.005 5.76 | (1.67, 19.80) |
| Cortico-steroids | 124 32.7% | 23 41.8% | 0.122 1.59 | (0.88, 2.85) | 8 36% | 0.708 1.19 | (0.48, 2.91) |
| Inotropes | 123 32.5% | 49 89.1% | 0.000 27.59 | (11.37, 66.95) | 20 91% | 0.000 24.66 | (5.66, 107.4) |
| Vasodilators | 104 27.4% | 19 34.5% | 0.204 1.48 | (0.81, 2.73) | 5 23% | 0.611 0.77 | (0.28, 2.13) |
| Albumin | 66 17.4% | 24 43.6% | 0.000 5.20 | (2.79, 9.70) | 7 32% | 0.074 2.36 | (0.92, 6.03) |
| Culture sample type | |||||||
| Skin and soft tissue | 103 27.2% | 6 10.9% | 0.005 0.29 | (0.12, 0.69) | 8 36% | 0.322 1.58 | (0.64, 3.88) |
| Urine | 96 25.3% | 13 23.6% | 0.755 0.90 | (0.46, 1.76) | 2 9% | 0.090 0.2798 | (0.06, 1.22) |
| Respiratory | 91 24.0% | 15 27.3% | 0.541 1.22 | (0.64, 2.34) | 7 32% | 0.380 1.52 | (0.60, 3.84) |
| Blood | 88 23.2% | 21 38.2% | 0.005 2.37 | (1.29, 4.35) | 5 23% | 0.955 0.97 | (0.35, 2.71) |
| Body fluids | 1 0.3% | 0 0.0% | ** ** | ** | 0 0% | ** ** | ** |
| Organism causing infections | |||||||
| Gram-positive bacteria | 107 28.2% | 17 30.9% | 0.634 1.16 | (0.62, 2.17) | 12 55% | 0.556 0.74 | (0.26, 2.05) |
| Gram-negative bacteria | 227 59.9% | 30 54.5% | 0.382 0.77 | (0.44, 1.38) | 5 23% | 0.599 0.79 | (0.33, 1.88) |
| Fungal | 31 8.2% | 5 9.1% | 0.790 1.15 | (0.42, 3.12) | 3 14% | 0.343 1.86 | (0.52, 6.65) |
| SARS-CoV-19 | 14 3.7% | 3 5.5% | 0.458 1.64 | (0.44, 6.08) | 2 9% | 0.186 2.88 | (0.60, 13.73) |
| Resistant Phenotype for bacterial infections (n-334) | |||||||
| Sens | 181 54.2% | 34 61.8% | 0.721 1.11 | (0.62, 2.00) | 13 59% | 0.958 0.98 | (0.41, 2.34) |
| MDR | 67 20.1% | 14 25.5% | 0.105 1.75 | (0.89, 3.43) | 5 23% | 0.524 1.40 | (0.50, 3.94) |
| ESBL | 50 15.0% | 3 5.5% | 0.079 0.34 | (0.10, 1.13) | 4 18% | 0.479 1.50 | (0.49, 4.64) |
| CRE | 24 7.2% | 3 5.5% | 0.773 0.83 | (0.24, 2.89) | 0 0% | ** ** | ** |
| MRSA | 12 3.6% | 1 1.8% | 0.543 0.53 | (0.07, 4.16) | 0 0% | ** ** | ** |
| Place of Acquisition | |||||||
| Community | 212 55.9% | 22 40.0% | 0.47 | (0.26, 0.84) | 8 36% | 0.43 | (0.18, 1.05) |
| Hospital | 167 44.1% | 33 60.0% | 0.011 2.13 | (1.19, 3.81) | 14 64% | 0.063 2.33 | (0.96, 5.70) |
| 90 days occurrence of any infection | 136 35.9% | ** ** | ** ** | ** | ** ** | ** ** | ** |
| Prior exposure to antimicrobials | 158 41.7% | 20 36.4% | 0.387 0.77 | (0.43, 1.39) | 14 64% | 0.037 2.59 | (1.06, 6.33) |
| 90 days exposure to Cephalosporins | 105 66.5% | 16 80.0% | 0.804 1.08 | (0.58, 2.04) | 11 79% | 0.020 2.80 | (1.17, 6.67) |
| 90 days exposure to B-lactams | 70 44.3% | 5 25.0% | 0.060 0.40 | (0.15, 1.04) | 9 64% | 0.008 3.36 | (1.37, 8.21) |
| 90 days exposure to quinolones | 64 40.5% | 8 40.0% | 0.617 0.81 | (0.36, 1.82) | 5 36% | 0.454 1.49 | (0.53, 4.18) |
| 90 days exposure to B-lactam/B-lactamase | 58 36.7% | 12 60.0% | 0.150 1.69 | (0.83, 3.47) | 8 57% | 0.007 3.51 | (1.40, 8.79) |
| 90 days exposure to Macrolides | 34 21.5% | 2 10.0% | 0.152 0.34 | (0.08, 1.48) | 6 43% | 0.004 4.41 | (1.60, 12.15) |
| 90 days exposure to Glycopeptides | 33 20.9% | 4 20.0% | 0.684 0.80 | (0.27, 2.37) | 0 0% | ** ** | ** |
| 90 days exposure to Nitroimidazole | 29 18.4% | 7 35.0% | 0.132 2.00 | (0.81, 4.94) | 3 21% | 0.286 2.01 | (0.56, 7.24) |
| 90 days exposure to Aminoglycosides | 25 15.8% | 4 20.0% | 0.827 1.13 | (0.37, 3.43) | 0 0% | ** ** | ** |
| 90 days exposure to Tetracyclines | 19 12.0% | 3 15.0% | 0.871 1.11 | (0.31, 3.95) | 0 0% | ** ** | ** |
| 90 days exposure to glycylcycline | 3 1.9% | 0 0.0% | ** ** | ** | 0 0% | ** ** | ** |
| 90 days exposure to Oxazolidinones | 2 1.3% | 0 0.0% | ** ** | ** | 0 0% | ** ** | ** |
| 90 days exposure to Colistin | 1 0.6% | 0 0.0% | ** ** | ** | 0 0% | ** ** | ** |
| Antimicrobial treatment | |||||||
| Monotherapy | 250 66.0% | 33 60.0% | 0.74 | (0.41, 1.33) | 16 73% | 0.492 1.40 | (0.54, 3.67) |
| Combined therapy | 129 34.0% | 22 40.0% | 0.314 1.35 | (0.75, 2.43) | 6 27% | 0.71 | (0.27, 1.87) |
| Cephalosporin-based therapy | 157 41.4% | 28 50.9% | 0.124 1.57 | (0.88, 2.78) | 8 36% | 0.620 0.80 | (0.33, 1.95) |
| B-lactam/B-lactamase inhibitor-based therapy | 131 34.6% | 23 41.8% | 0.223 1.44 | (0.80, 2.58) | 10 45% | 0.272 1.63 | (0.685, 3.87) |
| Pip/Taz based therapy | 99 26.1% | 16 29.1% | 0.588 1.19 | (0.63, 2.24) | 7 32% | 0.532 1.34 | (0.53, 3.40) |
| Quinolones-based therapy | 45 11.9% | 1 1.8% | 0.036 0.12 | (0.02, 0.87) | 1 5% | 0.296 0.34 | (0.04, 2.58) |
| Vancomycin-based therapy | 38 10.0% | 5 9.1% | 0.803 0.88 | (0.33, 2.37) | 4 18% | 0.199 2.11 | (0.68, 6.59) |
| B-lactam-based treatment | 37 9.8% | 4 7.3% | 0.503 0.69 | (0.24, 2.04) | 0 0% | ** ** | ** |
| Antifungal treatment | 31 8.2% | 5 9.1% | 0.790 1.15 | (0.42, 3.12) | 3 14% | 0.343 1.86 | (0.52, 6.65) |
| Tetracycline-based treatment | 30 7.9% | 2 3.6% | 0.219 0.40 | (0.09, 1.72) | 0 0% | ** ** | ** |
| Macrolide-based treatment | 28 7.4% | 8 14.5% | 0.033 2.59 | (1.08, 6.21) | 2 9% | 0.754 1.27 | (0.28, 5.75) |
| Meropenem based therapy | 28 7.4% | 3 5.5% | 0.555 0.69 | (0.20, 2.37) | 0 0% | ** ** | ** |
| Colistin-based therapy | 24 6.3% | 3 5.5% | 0.773 0.83 | (0.24, 2.89) | 2 9% | 0.587 1.52 | (0.33, 6.94) |
| Aminoglycosides-based therapy | 22 5.8% | 5 9.1% | 0.266 1.81 | (0.64, 5.11) | 1 5% | 0.795 0.76 | (0.09, 5.94) |
| Tigecycline-based therapy | 10 2.6% | 0 0.0% | ** ** | ** | 0 0% | ** ** | ** |
| Linezolid based therapy | 2 0.5% | 0 0.0% | ** ** | ** | 0 0% | ** ** | ** |
| 90-day previous infections | 87 23.0% | 5 9.1% | 0.012 0.30 | (0.11, 0.77) | 5 23% | 0.979 0.99 | (0.35, 2.76) |
| Gram-negative | 48 55.2% | 5 100.0% | 0.392 0.65 | (0.25, 1.73) | 2 40% | 0.606 0.68 | (0.15, 2.99) |
| Gram-positive | 34 39.1% | 2 40.0% | 0.152 0.34 | (0.08, 1.48) | 0 0% | ** ** | ** |
| SARS-CoV-19 | 20 23.0% | 0 0.0% | ** ** | ** | 3 60% | 0.086 3.16 | (0.85, 11.72) |
| Fungal | 4 4.6% | 0 0.0% | ** ** | ** | 0 0% | ** ** | ** |
| Concomitant infections | |||||||
| Polymicrobial infections (Yes) | 224 59.1% | 38 69.1% | 0.106 1.66 | (0.89, 3.06) | 22 100% | ** ** | ** |
| Gram-negative | 169 75.4% | 27 71.1% | 0.468 1.24 | (0.69, 2.19) | 18 82% | 0.001 6.14 | (2.04, 18.51) |
| Gram-positive | 106 47.3% | 10 26.3% | 0.084 0.53 | (0.26, 1.09) | 15 68% | 0.000 6.26 | (2.48, 15.85) |
| Fungal | 59 26.3% | 6 15.8% | 0.306 0.63 | (0.26, 1.54) | 10 45% | 0.000 5.24 | (2.15, 12.78) |
| SARS-CoV-19 | 7 3.1% | 7 18.4% | 0.961 ** | ** | 0 0% | ** ** | ** |
| Time between admission and sampling Median (IQR) | 2 (0–15) | 8 (0–17) | 0.799 1.00 | (0.99, 1.02) | 12 (1–23.5) | 0.009 1.02 | (1.01, 1.03) |
** Value can’t be produced by software.
References
- Beutler, E. G6PD: Population genetics and clinical manifestations. Blood Rev. 1996, 10, 45–52. [Google Scholar] [CrossRef]
- Wood, T. Physiological functions of the pentose phosphate pathway. Cell Biochem. Funct. 1986, 4, 241–247. [Google Scholar] [CrossRef]
- Cappellini, M.D.; Fiorelli, G. Glucose-6-phosphate dehydrogenase deficiency. Lancet 2008, 371, 64–74. [Google Scholar] [CrossRef]
- Meissner, F.; Seger, R.A.; Moshous, D.; Fischer, A.; Reichenbach, J.; Zychlinsky, A. Inflammasome activation in NADPH oxidase defective mononuclear phagocytes from patients with chronic granulomatous disease. Blood 2010, 116, 1570–1573. [Google Scholar] [CrossRef] [PubMed] [Green Version]
- Rada, B.K.; Geiszt, M.; Káldi, K.; Timar, C.; Ligeti, E. Dual role of phagocytic NADPH oxidase in bacterial killing. Blood 2004, 104, 2947–2953. [Google Scholar] [CrossRef] [PubMed]
- Bianchi, M.; Niemiec, M.J.; Siler, U.; Urban, C.F.; Reichenbach, J. Restoration of anti-Aspergillus defense by neutrophil extracellular traps in human chronic granulomatous disease after gene therapy is calprotectin-dependent. J. Allergy Clin. Immunol. 2011, 127, 1243–1252. [Google Scholar] [CrossRef]
- Gonzalez, A.; Hung, C.-Y.; Cole, G.T. Absence of phagocyte NADPH oxidase 2 leads to severe inflammatory response in lungs of mice infected with Coccidioides. Microb. Pathog. 2011, 51, 432–441. [Google Scholar] [CrossRef] [Green Version]
- Nathan, C. Neutrophils and immunity: Challenges and opportunities. Nat. Rev. Immunol. 2006, 6, 173–182. [Google Scholar] [CrossRef]
- Clark, M.; Root, R.K. Glucose-6-phosphate dehydrogenase deficiency and infection: A study of hospitalized patients in Iran. Yale J. Biol. Med. 1979, 52, 169–179. [Google Scholar]
- Thwe, P.M.; Ortiz, D.A.; Wankewicz, A.L.; Hornak, J.P.; Williams-Bouyer, N.; Ren, P. The Brief Case: Recurrent Chromobacterium violaceum Bloodstream Infection in a Glucose-6-Phosphate Dehydrogenase (G6PD)-Deficient Patient with a Severe Neutrophil Defect. J. Clin. Microbiol. 2020, 58, 2. [Google Scholar] [CrossRef] [Green Version]
- Hsieh, Y.-T.; Lin, M.-H.; Ho, H.-Y.; Chen, L.-C.; Chen, C.-C.; Shu, J.-C. Glucose-6-Phosphate Dehydrogenase (G6PD)-Deficient Epithelial Cells Are Less Tolerant to Infection by Staphylococcus aureus. PLoS ONE 2013, 8, e79566. [Google Scholar] [CrossRef] [PubMed]
- Abu-Osba, Y.K.; Mallouh, A.A.; Hann, R.W. Incidence and causes of sepsis in glucose-6-phosphate dehydrogenase-deficient newborn infants. J. Pediatr. 1989, 114, 748–752. [Google Scholar] [CrossRef]
- Cooper, M.R.; DeChatelet, L.R.; McCall, C.E.; La Via, M.F.; Spurr, C.L.; Baehner, R.L. Complete Deficiency of Leukocyte Glucose-6-Phosphate Dehydrogenase with Defective Bactericidal Activity. J. Clin. Investig. 1972, 51, 769–778. [Google Scholar] [CrossRef] [PubMed] [Green Version]
- Yang, C.-H.; Chen, K.-J.; Wang, C.-K. Community-acquired Acinetobacter pneumonia: A case report. J. Infect. 1997, 35, 316–318. [Google Scholar] [CrossRef]
- Mallouh, A.A.; Abu-Osba, Y.K. Bacterial infections in children with glucose-6-phosphate dehydrogenase deficiency. J. Pediatr. 1987, 111 Pt 1, 850–852. [Google Scholar] [CrossRef]
- Harthan, A.A.; Heger, M.L. Stenotrophomonas Infection in a Patient with Glucose-6-Phosphate Dehydrogenase Deficiency. J. Pediatr. Pharmacol. Ther. 2013, 18, 137–141. [Google Scholar] [CrossRef] [Green Version]
- Lodha, A.; Kamaluddeen, M.S.; Kelly, E.; Amin, H. Clostridium difficile infection precipitating hemolysis in glucose-6-phosphate dehydrogenase-deficient preterm twins causing severe neonatal jaundice. J. Perinatol. 2008, 28, 77–78. [Google Scholar] [CrossRef] [Green Version]
- WHO Working Group. Glucose-6-phosphate dehydrogenase deficiency. Bull World Health Organ. 1989, 67, 601–611. [Google Scholar]
- Nkhoma, E.T.; Poole, C.; Vannappagari, V.; Hall, S.A.; Beutler, E. The global prevalence of glucose-6-phosphate dehydrogenase deficiency: A systematic review and meta-analysis. Blood Cells Mol. Dis. 2009, 42, 267–278. [Google Scholar] [CrossRef]
- Al Riyami, A.A.; Suleiman, A.J.; Afifi, M.; Al Lamki, Z.M.; Daar, S. A community-based study of common hereditary blood disorders in Oman. EMHJ East. Mediterr. Health J. 2001, 7, 1004–1011. [Google Scholar] [CrossRef]
- Falagas, M.E.; Koletsi, P.K.; Bliziotis, I.A. The diversity of definitions of multidrug-resistant (MDR) and pandrug-resistant (PDR) Acinetobacter baumannii and Pseudomonas aeruginosa. J. Med Microbiol. 2006, 55 Pt 12, 1619–1629. [Google Scholar] [CrossRef] [Green Version]
- Clinical and Laboratory Standards Institute, Standards Development Policies and Process October 2013. Available online: https://www.cdc.gov/labtraining/trainingcourses/master/antimicrobial-susceptibility-clsi-standards.html (accessed on 28 February 2022).
- Al-Riyami, A.; Ebrahim, G.J. Genetic Blood Disorders Survey in the Sultanate of Oman. J. Trop. Pediatr. 2003, 49 (Suppl. S1), i1–i20. [Google Scholar] [PubMed]
- Rostami-Far, Z.; Ghadiri, K.; Rostami-Far, M.; Shaveisi-Zadeh, F.; Amiri, A.; Zarif, B.R. Glucose-6-phosphate dehydrogenase deficiency (G6PD) as a risk factor of male neonatal sepsis. J. Med. Life 2016, 9, 34–38. [Google Scholar]
- Blot, S.; Vandijck, D.; Lizy, C.; Annemans, L.; Vogelaers, D. Estimating the Length of Hospitalization Attributable to Multidrug Antibiotic Resistance. Antimicrob. Agents Chemother. 2010, 54, 4046–4047. [Google Scholar] [CrossRef] [PubMed] [Green Version]
- Madrazo, M.; Esparcia, A.; López-Cruz, I.; Alberola, J.; Piles, L.; Viana, A.; Eiros, J.M.; Artero, A. Clinical impact of multidrug-resistant bacteria in older hospitalized patients with community-acquired urinary tract infection. BMC Infect. Dis. 2021, 21, 1232. [Google Scholar] [CrossRef] [PubMed]
- Nelson, R.E.; Hyun, D.; Jezek, A.; Samore, M.H. Mortality, Length of Stay, and Healthcare Costs Associated with Multidrug-Resistant Bacterial Infections Among Elderly Hospitalized Patients in the United States. Clin. Infect. Dis. 2022, 74, 1070–1080. [Google Scholar] [CrossRef]
- Tosi, M.; Roat, E.; De Biasi, S.; Munari, E.; Venturelli, S.; Coloretti, I.; Biagioni, E.; Cossarizza, A.; Girardis, M. Multidrug resistant bacteria in critically ill patients: A step further antibiotic therapy. J. Emerg. Crit. Care Med. 2018, 2, 103. [Google Scholar] [CrossRef]
- Khoharo, H.K.; Almani, S.A.; Naseer, A.; Maheshwari, S.K.; Maroof, P.; Naseer, R. Current trends of drug resistance patterns of Acinetobacter baumannii infection in blood transfusion-dependent thalassemia patients. J. Glob. Infect. Dis. 2017, 9, 135–138. [Google Scholar] [CrossRef]
- Muzaheed; Alzahrani, F.M.; Sattar Shaikh, S. Acinetobacter baumannii Infection in Transfusion Dependent Thalassemia Patients with Sepsis. BioMed Res. Int. 2017, 2017, 2351037. [Google Scholar]
- Gasperini, B.; Cherubini, A.; Lucarelli, M.; Espinosa, E.; Prospero, E. Multidrug-Resistant Bacterial Infections in Geriatric Hospitalized Patients before and after the COVID-19 Outbreak: Results from a Retrospective Observational Study in Two Geriatric Wards. Antibiotics 2021, 10, 95. [Google Scholar] [CrossRef]
- Tarazona-Castro, Y.; Troyes, L.; Martins-Luna, J.; Cabellos-Altamirano, F.; Aguilar-Luis, M.A.; Carrillo-Ng, H.; Valle, L.J.D.; Kiem, S.M.; Miranda, S.; Silva-Caso, W.; et al. Detection of SARS-CoV-2 IgM Antibodies in Febrile Patients from an Endemic Region of Dengue and Chikungunya. Int. J. Infect. Dis. 2022, 116, S53–S54. [Google Scholar] [CrossRef]
- Marino, A.; Pampaloni, A.; Scuderi, D.; Cosentino, F.; Moscatt, V.; Ceccarelli, M.; Gussio, M.; Celesia, B.M.; Bruno, R.; Borraccin, S.; et al. High-fow nasal cannula oxygenation and tocilizumab administration in patients critically ill with COVID-19: A report of three cases and a literature review. World Acad. Sci. J. 2020, 2, 23. [Google Scholar] [CrossRef]
- Mehta, Y.; Gupta, A.; Todi, S.; Myatra, S.; Samaddar, D.P.; Patil, V.; Bhattacharya, P.K.; Ramasubban, S. Guidelines for prevention of hospital acquired infections. Indian journal of critical care medicine: Peer-reviewed, official publication of. Indian Soc. Crit. Care Med. 2014, 18, 149–163. [Google Scholar]
- Liu, C.-P.; Shih, S.-C.; Wang, N.-Y.; Wu, A.Y.; Sun, F.-J.; Chow, S.-F.; Chen, T.-L.; Yan, T.-R. Risk factors of mortality in patients with carbapenem-resistant Acinetobacter baumannii bacteremia. J. Microbiol. Immunol. Infect. 2016, 49, 934–940. [Google Scholar] [CrossRef] [Green Version]
Publisher’s Note: MDPI stays neutral with regard to jurisdictional claims in published maps and institutional affiliations. |
© 2022 by the authors. Licensee MDPI, Basel, Switzerland. This article is an open access article distributed under the terms and conditions of the Creative Commons Attribution (CC BY) license (https://creativecommons.org/licenses/by/4.0/).