Article

Standardization of the Agar Plate Method for Bacteriophage Production

1
Laboratory of Aquatic Biomedicine, College of Veterinary Medicine and Research Institute for Veterinary Science, Seoul National University, Seoul 08826, Republic of Korea
2
Division of Animal and Dairy Sciences, College of Agriculture and Life Science, Chungnam National University, Daejeon 34134, Republic of Korea
3
Department of Microbiology and Molecular Biology, College of Bioscience and Biotechnology, Chungnam National University, Daejeon 34134, Republic of Korea
4
College of Veterinary Medicine & Institute of Veterinary Science, Kangwon National University, Chuncheon 24341, Republic of Korea
5
Department of Aquaculture, Korea National College of Agriculture and Fisheries, Jeonju 54874, Republic of Korea
6
Laboratory of Phage and Microbial Resistance, Department of Biological Sciences, Kyonggi University, Suwon 16227, Republic of Korea
7
Department of Food Science and Biotechnology, College of Bionano Technology, Gachon University, Seongnam 13120, Republic of Korea
*
Authors to whom correspondence should be addressed.
Antibiotics 2025, 14(1), 2; https://doi.org/10.3390/antibiotics14010002
Submission received: 21 November 2024 / Revised: 16 December 2024 / Accepted: 21 December 2024 / Published: 24 December 2024

Abstract

:
The growing threat of antimicrobial resistance (AMR), exacerbated by the COVID-19 pandemic, highlights the urgent need for alternative treatments such as bacteriophage (phage) therapy. Phage therapy offers a targeted approach to combat bacterial infections, particularly those resistant to conventional antibiotics. This study aimed to standardize an agar plate method for high-mix, low-volume phage production, suitable for personalized phage therapy. Plaque assays were conducted with the double-layer agar method, and plaque sizes were precisely measured using image analysis tools. Regression models developed with Minitab software established correlations between plaque size and phage production, optimizing production while minimizing resistance development. The resulting Plaque Size Calculation (PSC) model accurately correlated plaque size with inoculum concentration and phage yield, establishing specific plaque-forming unit (PFU) thresholds for optimal production. Using phages targeting pathogens such as Escherichia, Salmonella, Staphylococcus, Pseudomonas, Chryseobacterium, Vibrio, Erwinia, and Aeromonas confirmed the model’s accuracy across various conditions. The model’s validation showed a strong inverse correlation between plaque size and minimum-lawn cell clearing PFUs (MCPs; R² = 98.91%) and identified an optimal inoculum density that maximizes yield while minimizing the evolution of resistant mutants. These results highlight that the PSC model offers a standardized and scalable method for efficient phage production, which is crucial for personalized therapy and AMR management. Furthermore, its adaptability across different conditions and phages positions it as a potential standard tool for rapid and precise phage screening and propagation in both clinical and industrial settings.

Graphical Abstract

1. Introduction

The growing threat of antimicrobial resistance (AMR) presents a significant global health challenge, with recent estimates indicating that AMR-related infections could lead to millions of deaths annually by 2050 if left unaddressed [1,2,3,4]. The rise of AMR is largely driven by the overuse of antibiotics and the slow pace of new antimicrobial agent development, creating an urgent need for innovative therapeutic approaches [5,6]. In addition to its health impacts, AMR poses a substantial economic burden, increasing healthcare costs and leading to productivity losses worldwide [7,8]. A key challenge in addressing AMR lies in its ability to render conventional antibiotics ineffective, significantly limiting treatment options for life-threatening infections [9,10].
Bacteriophages (phages) are emerging as promising alternatives to antibiotics, largely due to their unique ability to specifically target and replicate within bacterial cells [11,12]. Unlike antibiotics, phage therapy introduces virulent phages that selectively infect and lyse clinically relevant bacterial pathogens without disrupting the normal microbiome [13,14,15]. Phages multiply at infection sites through a dynamic lytic cycle, ensuring localized bacterial elimination [16,17]. These unique characteristics make phage therapy particularly suited to combat antibiotic-resistant bacterial strains, which are increasingly difficult to treat using conventional approaches [18,19]. Efforts to broaden phage therapy’s accessibility include clinical trials across Europe and the United States, demonstrating phages’ potential to combat antimicrobial-resistant bacteria [20,21]. These efforts have also extended to the food and agriculture sectors, where phages are being marketed for preventing foodborne infections and managing plant bacterial diseases [22,23,24,25].
As demand for phages in industries like agriculture and aquaculture grows, large-scale production methods, particularly broth cultures, have become golden standard [26,27]. Production systems such as batch and continuous cultures are commonly optimized to increase yields, adjusting factors like host cell density, multiplicity of infection (MOI), and growth conditions [28,29]. Conventional amplification in industrial fermenters (scaling to over 1 ton) typically requires phage seed stocks of 1012–1013 PFU with MOI values between 0.01 and 1.0, relying on bacterial cells in the exponential growth phase [30,31]. However, achieving and maintaining these quantities is challenging, especially for phages with low propagative strength or stability. For personalized phage therapy, “cognate phages”—phages specifically targeted to a patient’s infection—are particularly valuable [32,33]. Such applications typically require timely production of diverse phages in smaller quantities, with a single dose generally requiring around 109 PFU [34,35,36], shifting the focus from bulk production to the rapid preparation of diverse, specific phages.
The agar plate method offers a practical alternative for phage propagation, harvesting phages from soft (top) agar overlays [37]. This method is widely used in phage laboratories due to its simplicity and is especially useful for phages that yield low quantities in liquid cultures or face propagation challenges due to host cell constraints [38,39]. Additionally, it provides clearer visualization of plaque formation, facilitating the assessment of phage activity and detecting contaminations. The yield from a single agar plate varies depending on the phage and bacterial strain but often provides enough material for multiple doses or seed stocks for larger-scale production [40,41]. Despite its advantages, the lack of standardized protocols for the agar plate method often results in inefficient use of resources, including inoculum and time. As demand for customized phage preparations grows, there is a need for standardized protocols enabling efficient high-mix, low-volume production to complement existing large-scale broth-based methods.
This study aims to standardize the agar plate method for the simultaneous production of various phages in basic microbiological facilities. Normalization between plaque size and PFU count was performed to ensure full coverage of standard petri dishes, employing a range of phages and bacterial species relevant to industrial sectors, including Escherichia, Salmonella, Staphylococcus, Vibrio, Pseudomonas, Chryseobacterium, Erwinia, and Aeromonas. Optimal production parameters were estimated based on relative inoculum volumes.

2. Results

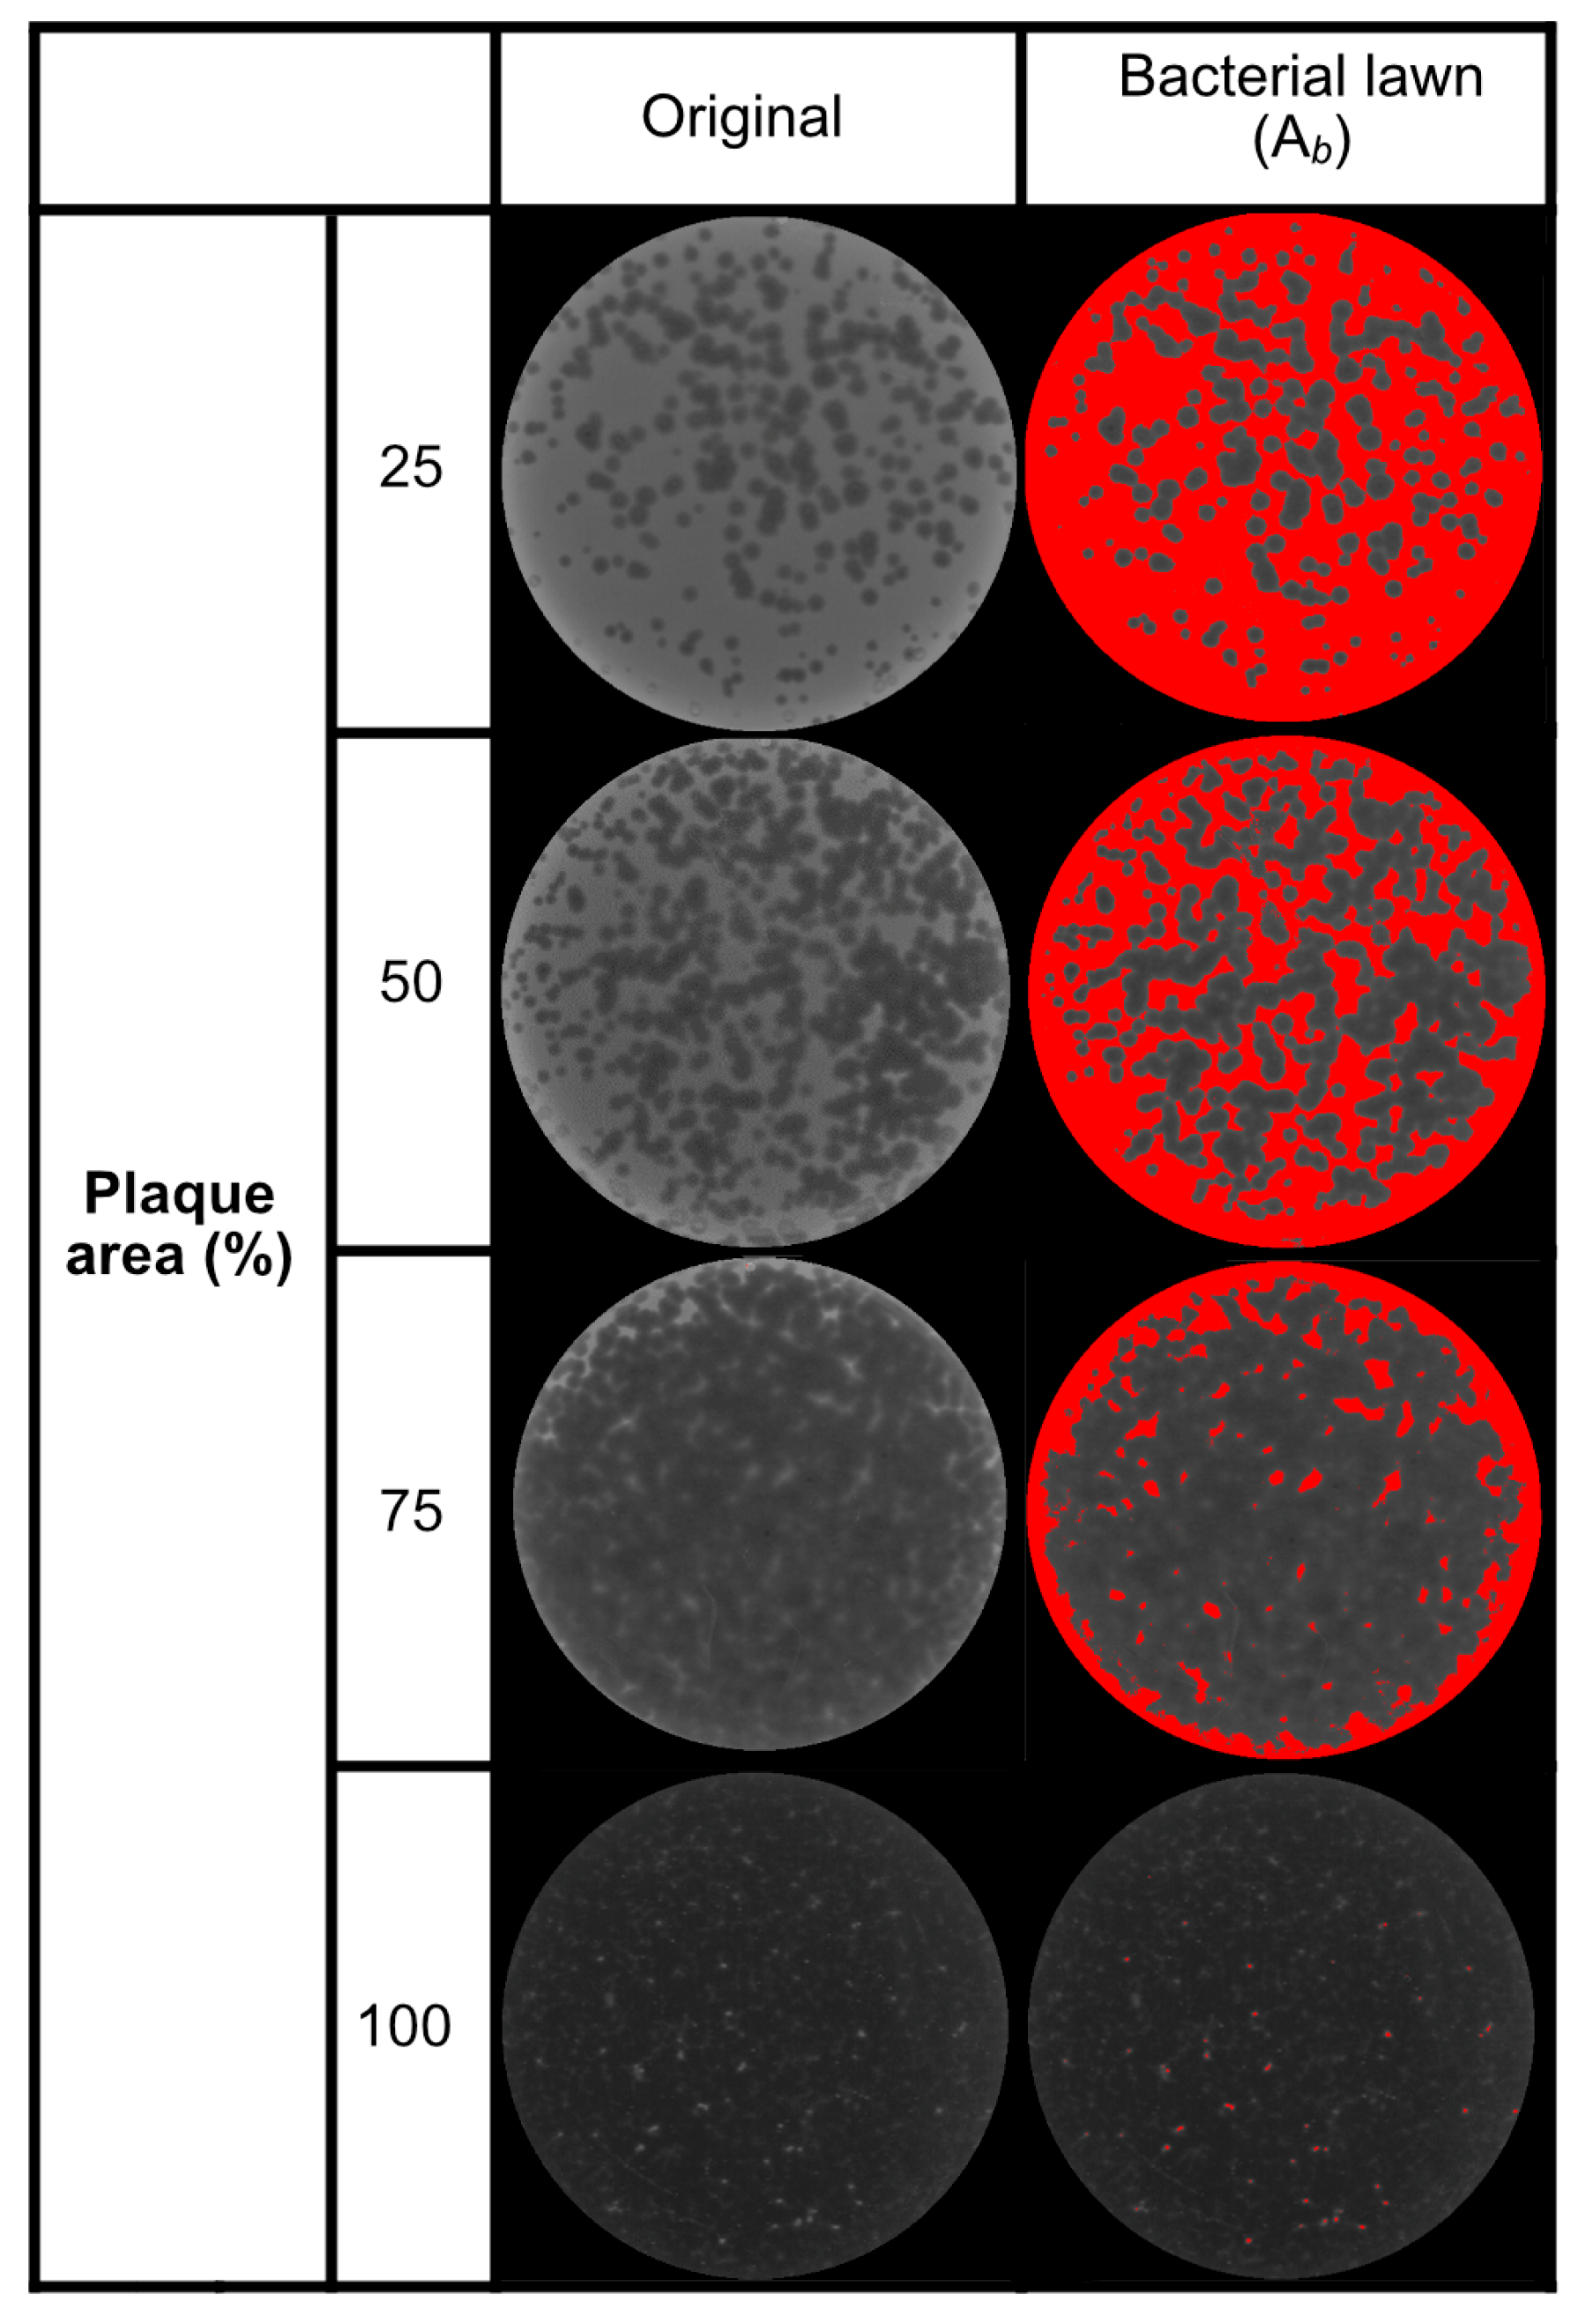
2.1. Plaque Morphology

We used previously isolated phages and the plaque sizes were observed on 0.4% soft agar, and the following observations were made: Aeromonas phage pAh6-C [42] formed plaques measuring 1.83 ± 0.24 mm in diameter; Erwinia phage pEa_SNUABM_27 [43] (hereafter, pEa_27), 11.93 ± 0.41 mm; Escherichia phage vB_EcoM-pEE20 (hereafter, pEE20), 0.80 ± 0.01 mm; Salmonella phage pSe_SNUABM_01 (hereafter, pSe_01), 2.46 ± 0.16 mm; Staphylococcus phage pSa-3 [44,45], 1.50 ± 0.14 mm; and Vibrio phage pVco-5 [46], 1.56 ± 0.28 mm (Figure 1). For the validation of the model, we isolated new phages: Chryseobacterium phage CC1, 0.90 ± 0.01 mm; Pseudomonas phage pPa_PMR_01 (hereafter, pPa_01), 4.30 ± 0.25 mm. Additionally, phage pEa_27 exhibited a smaller plaque size of 1.62 ± 0.08 mm when using 0.8% soft agar, which was specifically employed for validating the model.

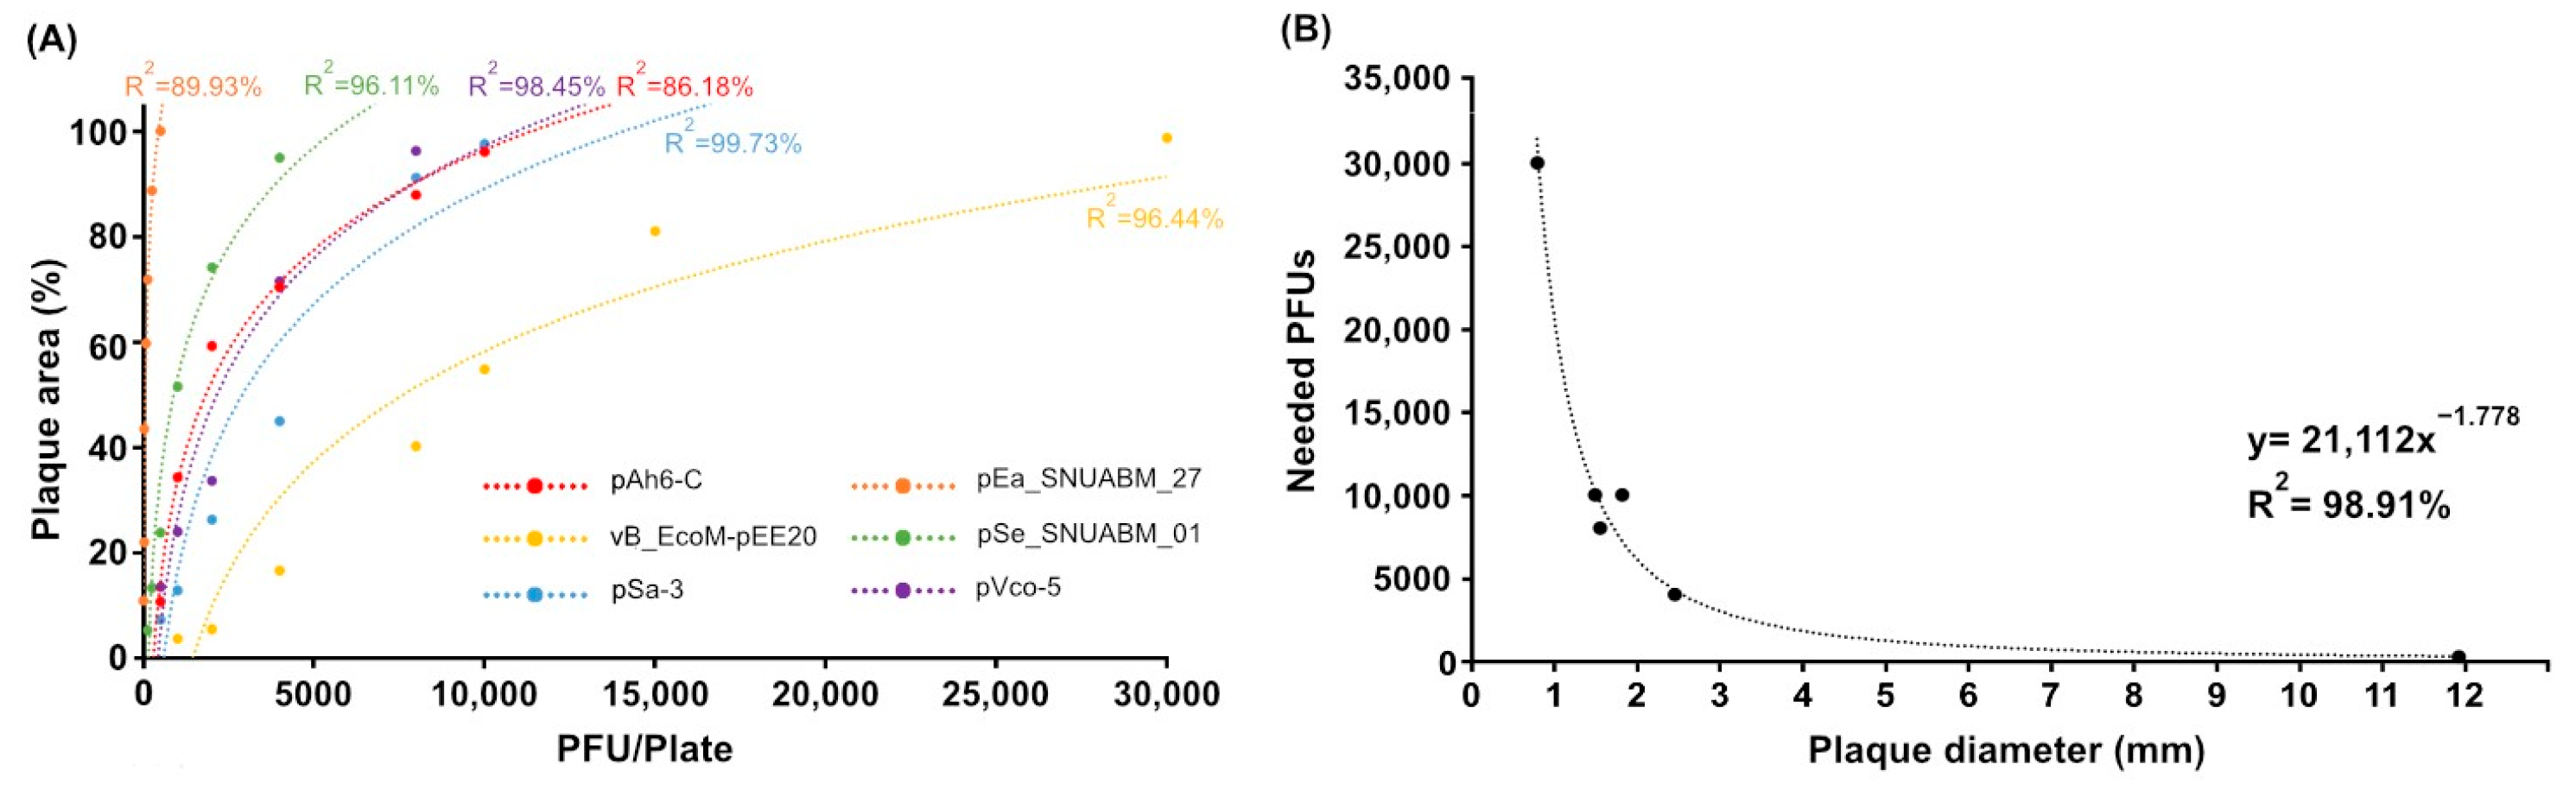
2.2. Analysis of Inoculum and Plaque Area and Regression Model

A comprehensive analysis was conducted using six previously isolated phages to elucidate the relationship between plaque formation and phage concentrations (Figure 2). For pAh6-C, the plaque coverage increased from 10.63% at 500 PFU to 34.22% at 1000 PFU, 59.21% at 2000 PFU, 70.34% at 4000 PFU, 87.90% at 8000 PFU, and finally 96.14% at 10,000 PFU. pEa_27 showed an increase in coverage from 10.78% at just 7.81 PFU to 22.05% at 15.62 PFU, 43.39% at 31.25 PFU, 59.64% at 62.5 PFU, 71.84% at 125 PFU, 88.79% at 250 PFU, and achieving complete coverage of 100% at 500 PFU. For vB_EcoM-pEE20, the coverage was 3.65% at 1000 PFU, 5.39% at 2000 PFU, 16.51% at 4000 PFU, 40.16% at 8000 PFU, 54.81% at 10,000 PFU, 81.02% at 15,000 PFU, and 98.72% at 30,000 PFU. The pSe_01’s plaque area expanded from 5.22% at 125 PFU to 13.32% at 250 PFU, 23.81% at 500 PFU, 51.46% at 1000 PFU, 74.06% at 2000 PFU, and 95.03% at 4000 PFU. pSa-3 demonstrated an increase in coverage from 7.30% at 500 PFU to 12.77% at 1000 PFU, 26.31% at 2000 PFU, 44.93% at 4000 PFU, 91.14% at 8000 PFU, and 97.57% at 10,000 PFU. Finally, pVco-5 displayed a coverage increase from 13.41% at 500 PFU to 23.94% at 1000 PFU, 33.57% at 2000 PFU, 71.47% at 4000 PFU, and 96.22% at 8000 PFU (Figure 2A). The R2 values were 86.18% for pAh6-C, 89.93% for pEa_27, 96.44% for vB_EcoM-pEE20, 96.11% for pSe_01, 99.73% for pSa-3, and 98.45% for pVco-5 (Figure 2A). The significance of the model was confirmed by F-values of 24.95 for pAh6-C, 44.67 for pEa_27, 135.47 for vB_EcoM-pEE20, 98.80 for pSe_01, 1485.46 for pSa-3, and 190.52 for pVco-5, supported by significant p-values (p < 0.05 for pAh6-C, p < 0.001 for pEa_27, vB_EcoM-pEE20, pSe_01, pSa-3, and pVco-5).
Figure 1. Microorganisms (bacteriophages and bacterial hosts) used in the study. Plaque assay was performed in 0.4% soft agar. Bar represents 10 mm.
Antibiotics 14 00002 g001
Figure 2. Regression model of phage plaque size and their relationship with plaque-forming units (PFUs). (A) The plot depicting the correlation between plaque area and the number of plated plaques for Aeromonas phage pAh6, Erwinia phage pEa_27, Escherichia phage vB_EcoM-pEE20, Salmonella phage pSe_01, Vibrio phage pVco-5, and Staphylococcus phage pSa-3. (B) Regression model demonstrating the relationship between plaque size and plaque number needed to achieve 100% coverage of plate. Equation = 21,112x−1.778 (R2 = 0.9891).
Antibiotics 14 00002 g002
Based on the analysis derived from Figure 2B, the correlation between plaque size and the minimum-lawn cell clearing PFUs (MCPs) was examined. For instance, phage pAh6-C, which produces plaques with a diameter of 1.83 mm, required 10,000 PFUs to fully cover the plate, as evidenced in Figure 2A. pEa_27, which forms larger plaques of 11.93 mm, needed only 500 PFU for complete coverage. Phage vB_EcoM-pEE20, which produced the smallest plaques (0.80 mm), required 30,000 PFU for full coverage. Furthermore, phage pSe_01, with plaques of 2.46 mm, needed 4000 PFU; pSa-3, with 1.50 mm plaques, also required 10,000 PFU; and pVco-5, with plaques at 1.56 mm, required 8000 PFU. After determining these values, a regression model was developed using the collected data. The following equation describes the model:
y = 21,112 x 1.778
The Plaque Size Calculation (PSC) demonstrates a significant inverse correlation between plaque diameter (x) and the MCP (y) (Figure 2B). This relationship is evidenced by a robust R2 value of 98.91%. Furthermore, the regression model demonstrated exceptional statistical strength, with an F-value of 363.32 and a p < 0.001.

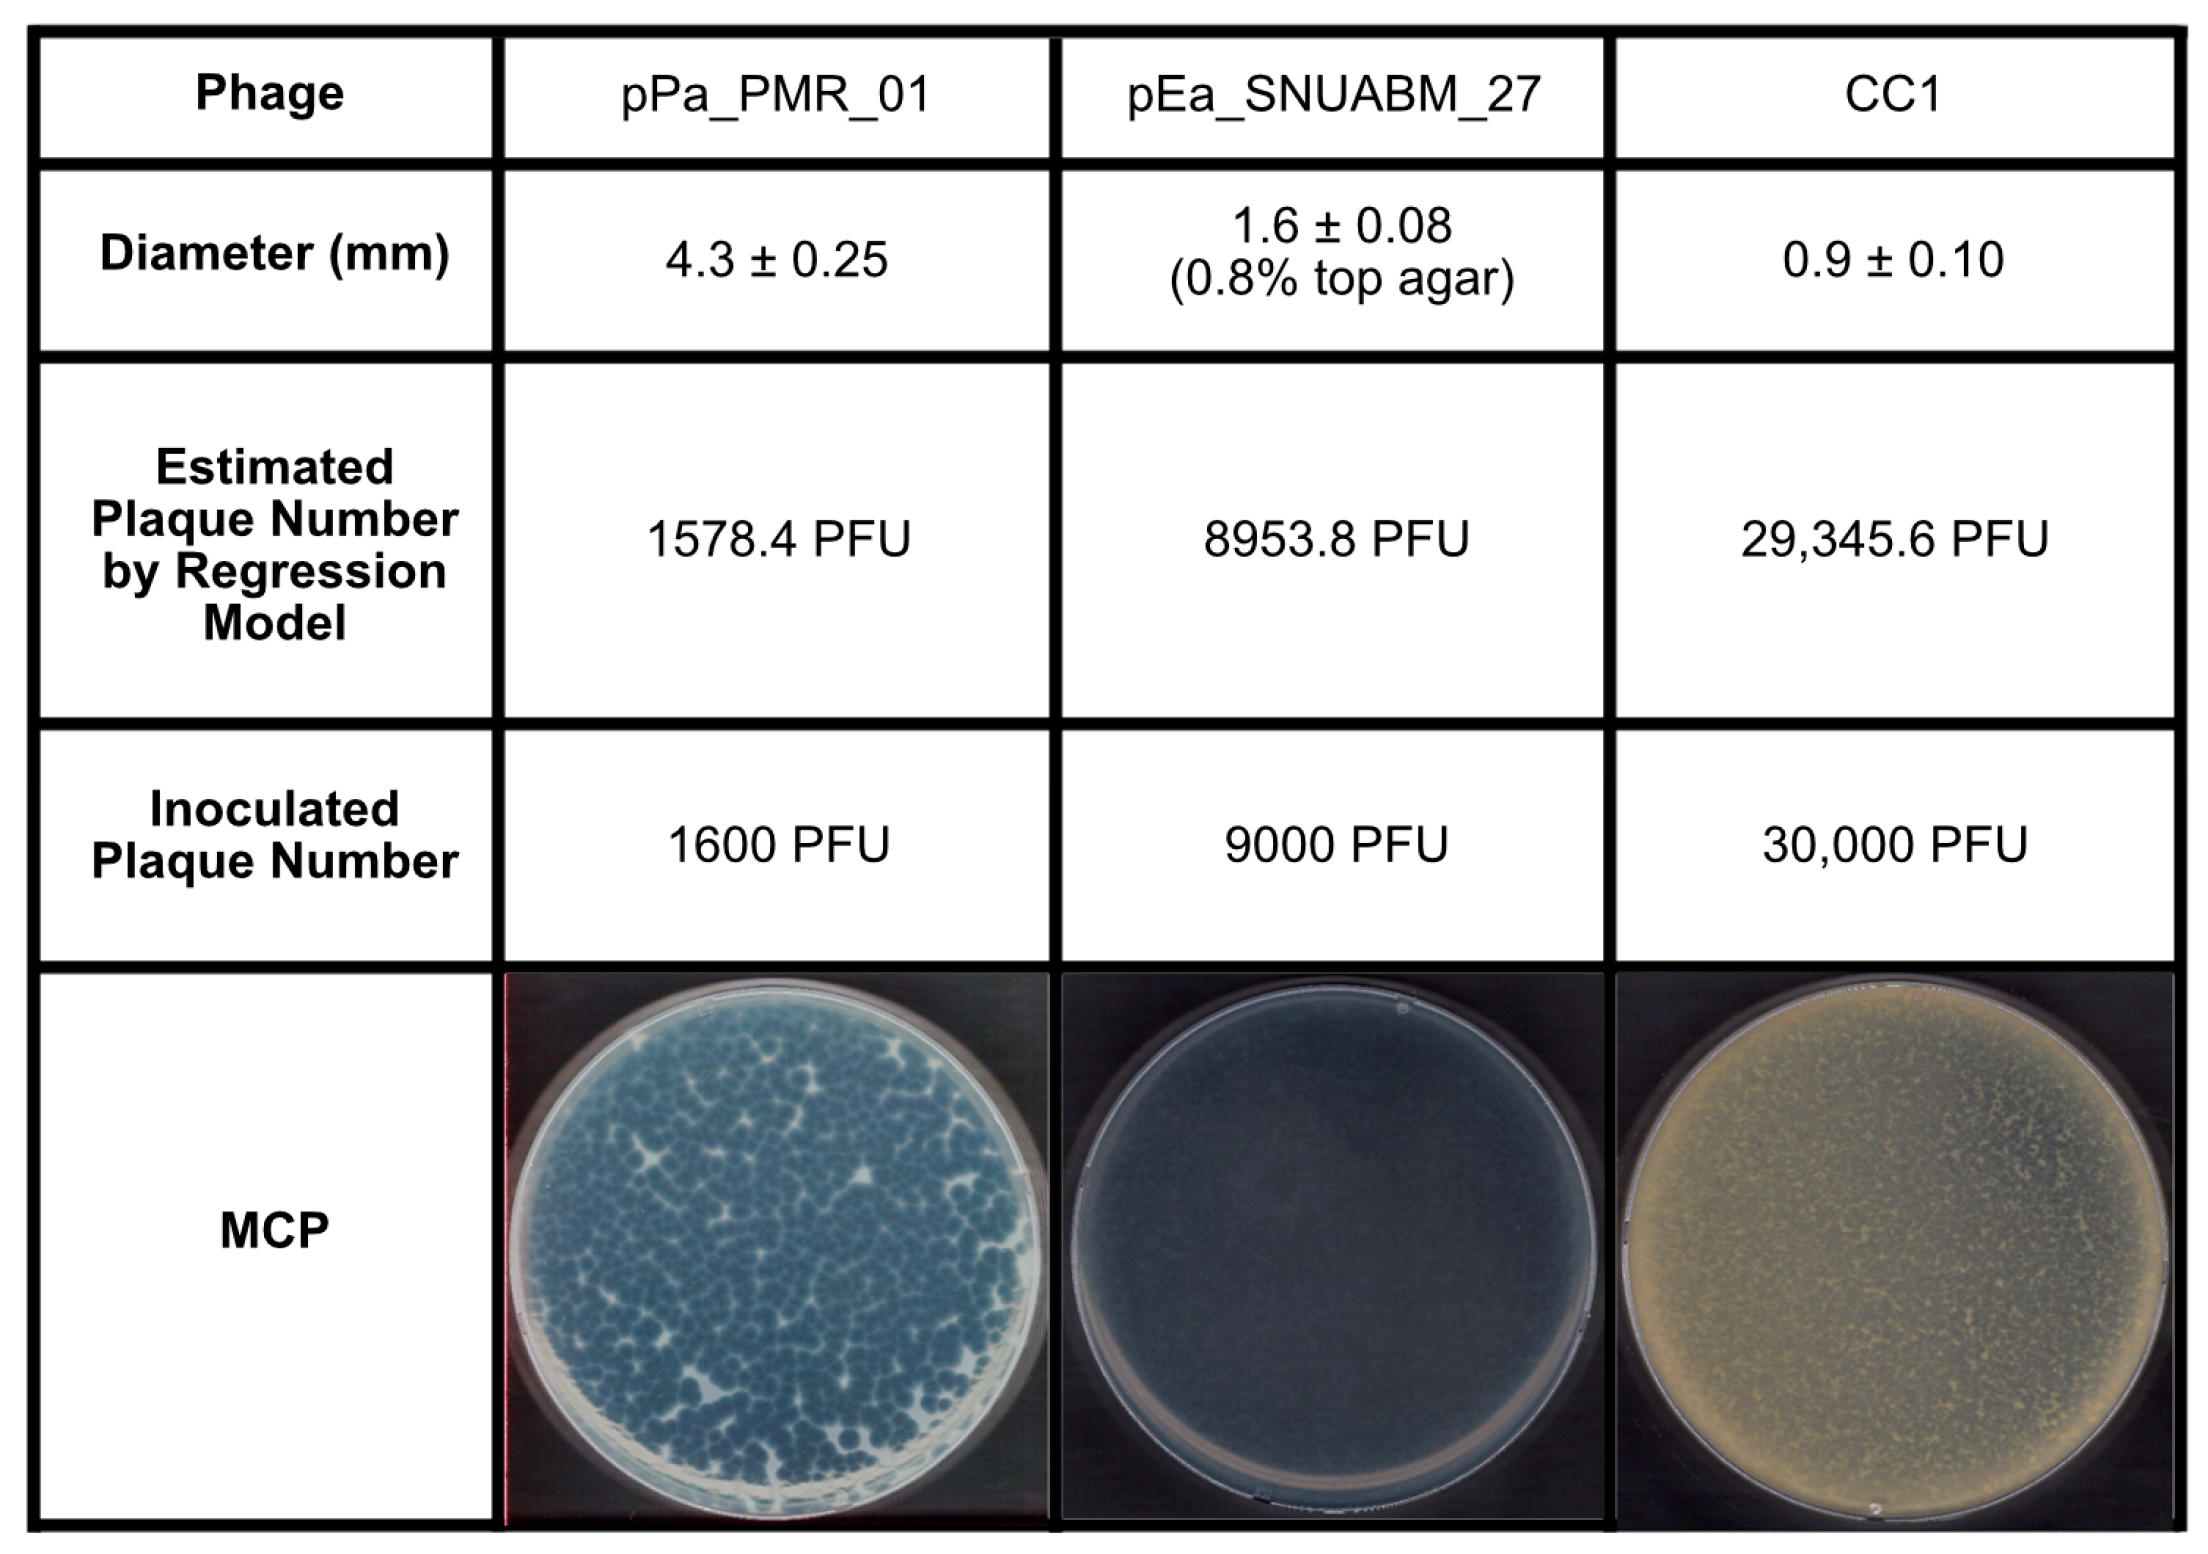
2.3. Validation of the Inoculum by PSC

Validation of the PSC involved a range of plaque sizes using both newly isolated phages, such as pPa_01 (4.30 mm) and CC1 (0.90 mm), as well as previously characterized phages, such as pEa_27 (Figure 3). For pEa_27, increasing the soft agar concentration from 0.4% to 0.8% reduced the plaque size from 11.93 ± 0.41 mm to 1.62 ± 0.08 mm, which was used for validation in this test. According to the PSC, the predicted MCPs were 1578.4 PFU for pPa_01, 8953.8 PFU for pEa_27 (at 0.8% soft agar), and 29,345.6 PFU for CC1. These values were validated by plating 1600 PFU, 9000 PFU, and 30,000 PFU, each achieving ~100% coverage and confirming the model’s accuracy.

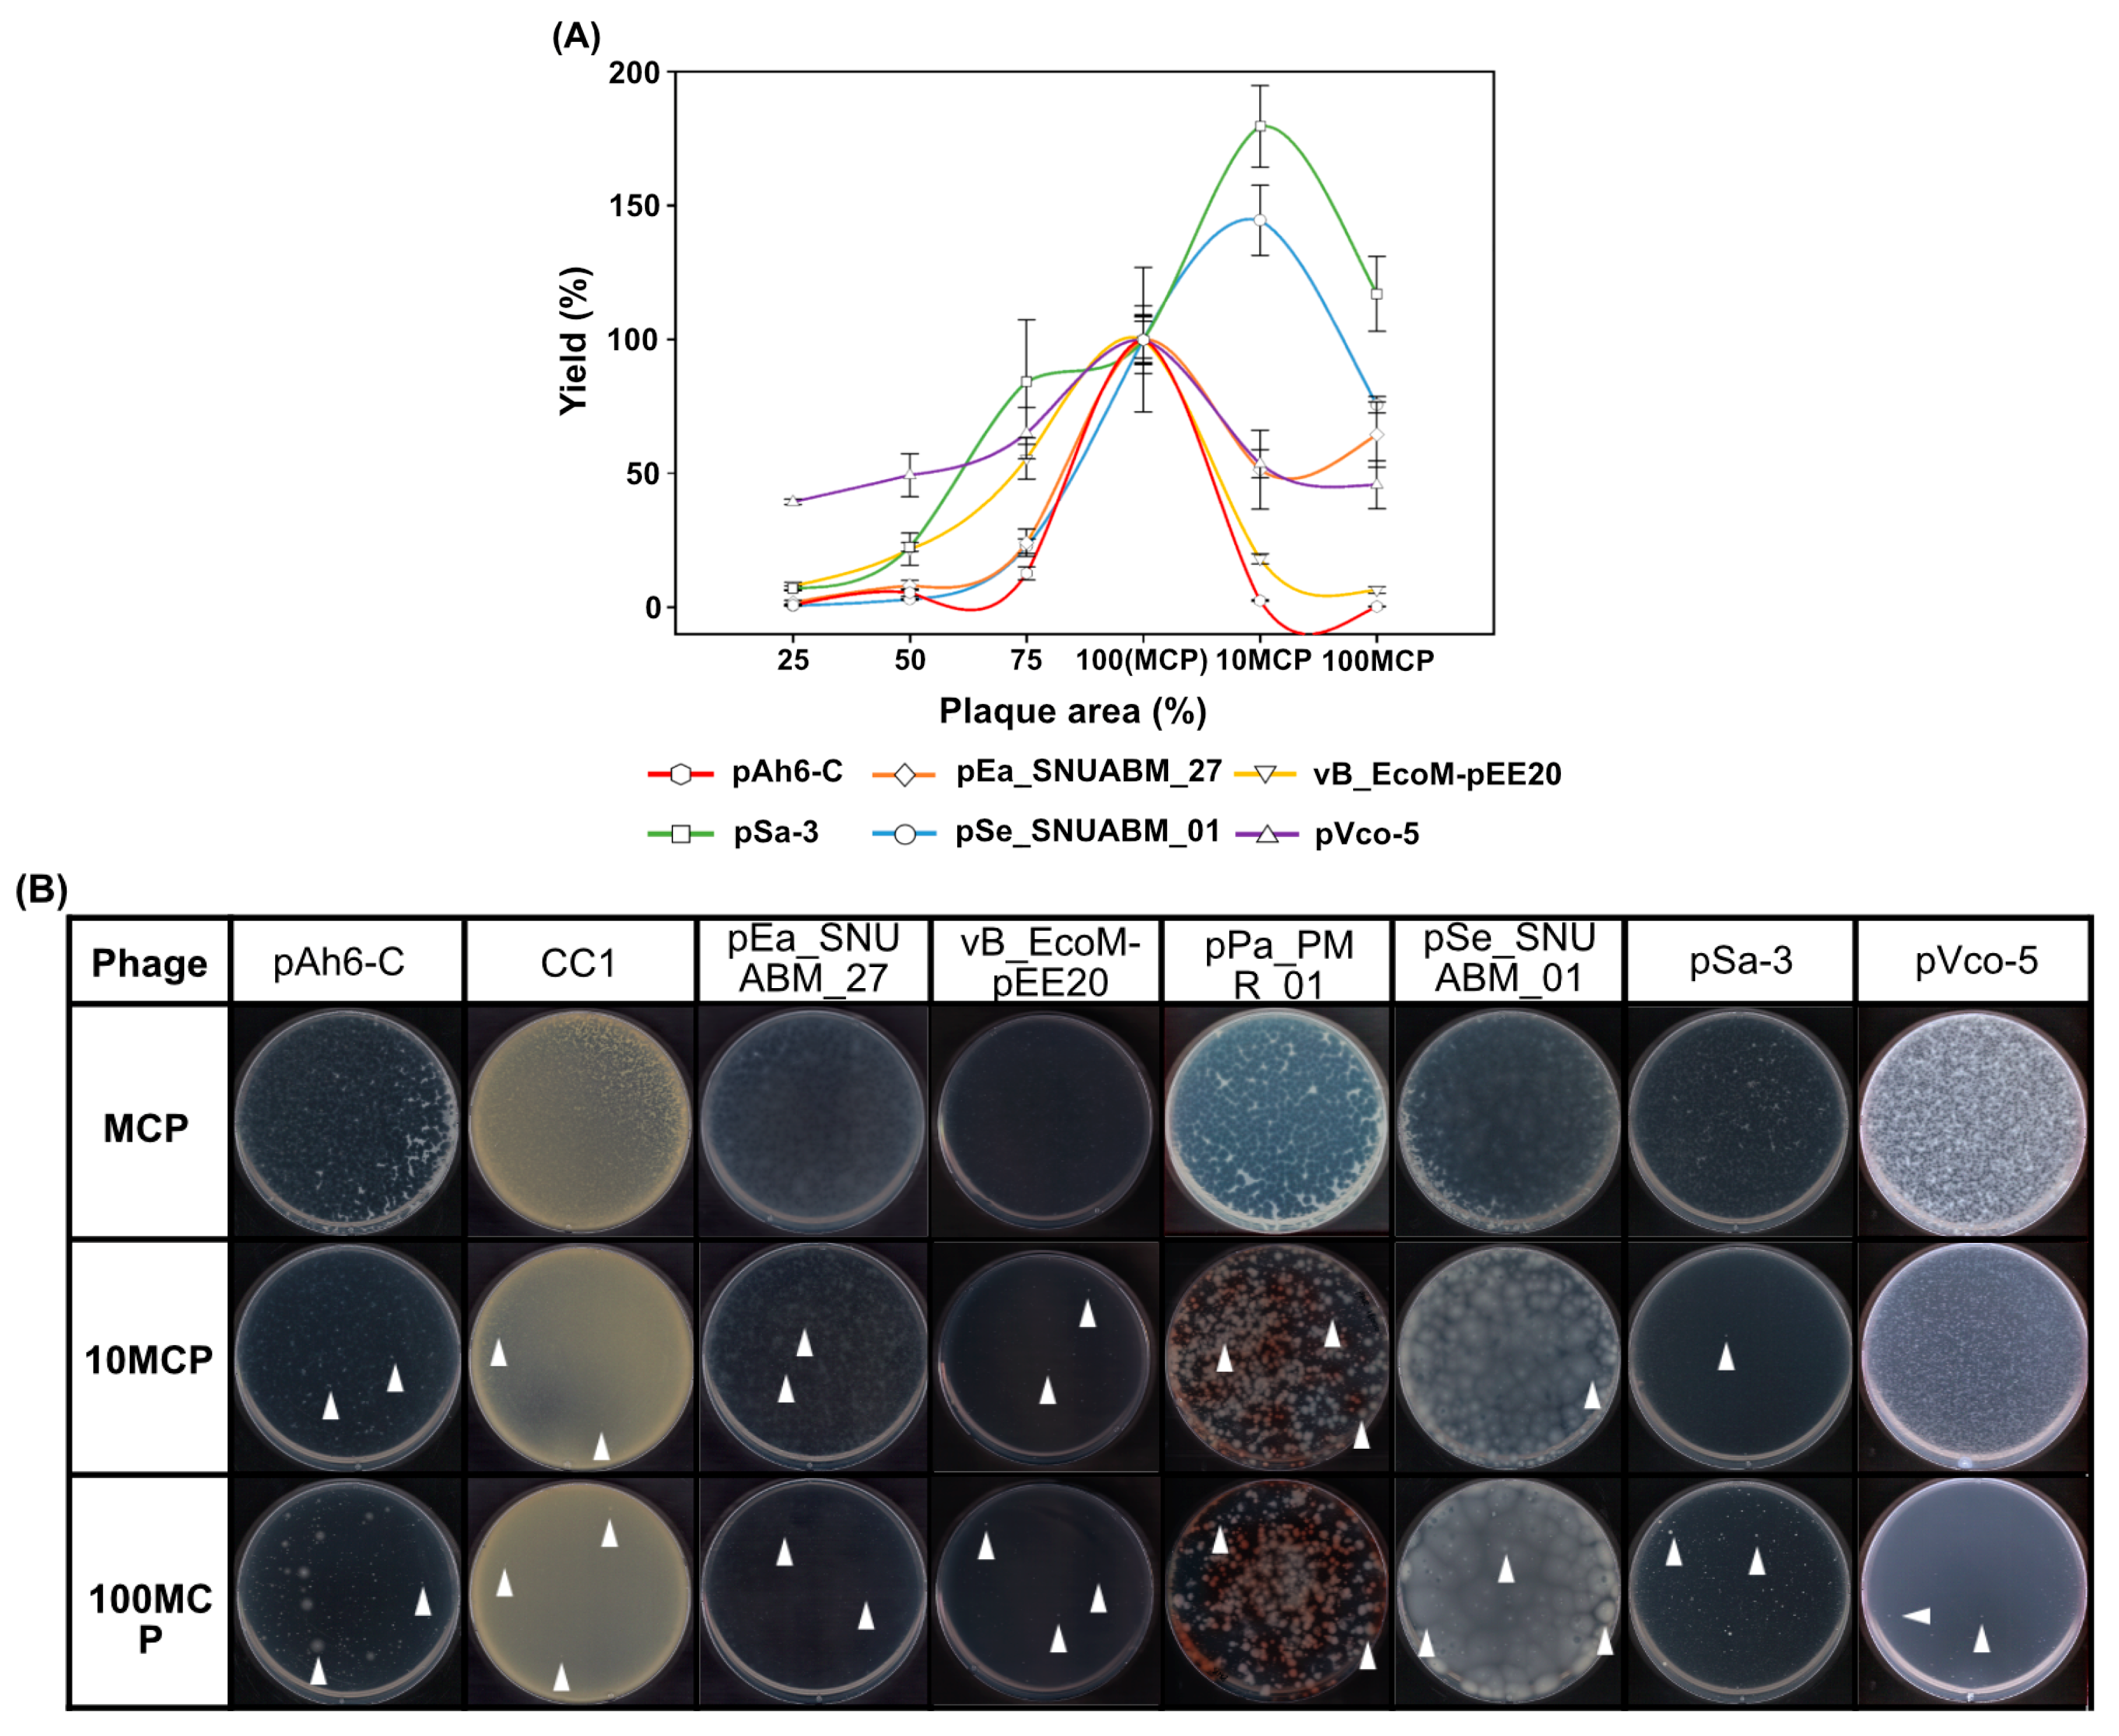
2.4. Optimization of the Phage Inoculum

Harvest yields were assessed for phages pAh6-C, pEa_27, vB_EcoM-pEE20, pSe_01, pSa-3, and pVco-5 after plating at varying plaque area coverages, including 25%, 50%, 75%, 100% (MCP), 1000% (10× MCP), and 10,000% (100× MCP) (Figure 4A). All the phages reached their maximum productions when the inoculum reached optimal saturation levels between MCP and 10 MCP, ranging from 109 to 1011 PFUs, followed by a decrease in production after saturation (Table 1). Interestingly, compared with MCP, a higher occurrence of bacteriophage-resistant strains was observed in most phages when the plaque area was seeded more than MCP (Figure 4B).

3. Discussion

With the rise of antimicrobial resistance (AMR), clinical trials using phages underscore the growing need for scalable phage production to treat resistant infections [47,48,49]. As phage therapy gains traction, improving production techniques becomes crucial. Most strategies follow a “pret-a-porter” model—broad-spectrum, standardized preparations of pre-prepared phage solutions aligning with regulatory requirements [50]. However, tailored protocols remain essential, as yields depend on each host and phage’s characteristics, such as the growth rate of the host bacteria, adsorption kinetics, and the burst size of phages [51,52,53]. In this study, we standardized the conventional agar plate method for phage propagation based on plaque diameter.
The therapeutic effect of phages is maximized through a “sur-mesure” approach, a precision medicine strategy that uses phages specifically infective to pathogenic bacteria [50]. This implies that in certain cases, such as when treating multidrug-resistant infections in hospital settings, on-site selection and propagation of tailor-made phage solutions may be required [54]. For hospitals dealing with untreatable infections, phage therapy can be most effectively implemented via this personalized approach, especially when pathogenic bacteria exhibit diverse types [55,56,57,58]. Moreover, since 109 PFU of phages is often proposed as a single dose for treatment, large volumes of phage solution may not be necessary [34,59]. Our study demonstrated that the production of several doses could be easily achievable using the PSC model on agar plates (Table 1).
Numerous studies have described methods for phage propagation on agar plates, yet many lack a precise inoculation strategy [38,39,40,60,61]. Current methods vary, with two main approaches—wash-off and disruption—differing in the phage harvest step. In the wash-off method, plates with plaques are submerged in a buffer, and the supernatant containing diffused phages is collected [41]. The disruption method involves harvesting the overlaid soft agar, followed by mechanical shearing to release phages [39]. Both methods have limitations in determining inoculum doses, often relying on arbitrary rules of thumb, leading to inefficiencies. For example, small inoculum doses, such as 103 PFU, may be insufficient for complete lysis in phages with small plaques, while high doses can result in lysis from without, diminishing proper phage propagation (Figure 2) [62]. However, when using a low-dose inoculum, as in the case of Vibrio phage pVa-21 with plaques smaller than 1 mm, this minimal inoculum was insufficient for complete bacterial lysis [63]. Conversely, using a high-dose inoculum with larger plaques, such as pEa_27 (11.9 mm), led to ineffective infection due to lysis from without (Figure 2). These challenges highlight the importance of precise inoculum selection.
To address this complexity, we focused on the common, essential feature of plaques rather than the distinct traits of individual phages. Complete lysis of the bacterial lawn on the agar plate is a reliable indicator of maximum virion production (Figure 2, 6) [39]. We then developed the PSC model to analyze the relationship between plaque size, initial PFU, and total phage production. While this study demonstrates the reliability and versatility of the PSC model, it is essential to note that the model was validated within the plaque size range of 3–12 mm. Plaque sizes were measured in conditions with 20–50 plaques per 90 mm Petri dish, and for phages with depolymerase activity, such as pEa_27, only the central plaques were measured, excluding the halo (Figure 1). Our model accurately predicted (R² = 98.91%) the number of PFUs required to cover a Petri dish (Figure 2B), verified with newly isolated phages, including Pseudomonas phage pPa_PMR_01 and Chryseobacterium phage CC1, which formed plaques of 4.3 mm and 0.9 mm, respectively, in 0.4% top agar. Additionally, phage pEa_27, which typically forms large plaques (11.9 mm), generated smaller plaques (1.6 mm) in 0.8% top agar, and an approximate MCP of 9000 PFU (model prediction: 8953 PFU) was sufficient to clear the bacterial lawn (Figure 3). Complete or near-complete clearing (lysis) of the bacterial lawn has been considered to peak phage production [41,64]. However, increasing the inoculum to 100 MCP led to reduced production and the evolution of phage-resistant bacterial mutants, as observed in previous study that indicated higher concentrations of phage led to a greater emergence of phage-insensitive mutants (Figure 4) [65]. This outcome, often referred to as “go farther and fare worse”, might occur when high phage populations induce lysis from without, reducing the actual phage infection and propagation [60,66]. Therefore, selecting an appropriate inoculum dose is crucial in optimizing phage production and minimizing resistance development [67].
The PSC model, designed using standard 90 mm Petri dishes (63.6 cm² surface area), is easily scalable to larger formats, such as 150 mm plates, by adjusting the inoculum in proportion to the surface area (Figure 5). The utility of the agar plate method in amplifying phages has been validated across different phages and their bacterial hosts, which are major pathogens for industries [42,68,69,70]. The PSC model proposed here fills a gap in conventional methods, achieving significant improvements in production, with increases up to 2.2 Log PFU/mL in case of pAh6-C (Table 1). This would be particularly useful when working with bacteria such as Mycobacterium and Nocardia that grow in clumps [40,71]. The aggregation presents challenges for phage infection in liquid culture, resulting in compromised phage infection [45,53,72]. In these cases, liquid culture is not an ideal method; however, the agar plate method offers an efficient alternative for phage propagation, whether for laboratory experiments, industrial seed production, or rapid clinical application. Indeed, several phages have shown higher production when propagated in agar plate rather than broth culture [39,41].
It is also important to recognize that the bacterial infection by phages and plaque formation is a dynamic process and involves complex factors, such as superinfection exclusion and bacterial immunity [73,74,75,76,77,78,79]. These biological mechanisms can influence the size and number of plaques, potentially limiting the efficiency of phage propagation. Superinfection exclusion may restrict secondary phage infections, reducing plaque formation even at higher inoculum doses [74,75,76]. Additionally, bacterial immunity can lead to the emergence of phage-resistant strains during production, significantly decreasing overall population. [77,78,79]. A key limitation of this study is that the PSC model does not account for these host defense mechanisms, as it primarily focuses on plaque size and PFU. The model assumes uniform bacterial susceptibility, which may not always be the case in clinical or industrial settings, where bacterial populations are diverse.
Future studies should explore the effects of factors, such as superinfection exclusion, bacterial immunity, and propagation strain selection on phage production, and incorporate them into the PSC model to improve its accuracy. Selecting an optimal bacterial host is vital, as it greatly influences phage production. Overcoming both scientific and regulatory challenges will be essential to ensuring a reliable supply of phages for clinical use. Looking ahead, the PSC model holds promise for advancing small-scale phage production platforms, potentially integrating with bio-foundry systems to efficiently scale and streamline production.

4. Materials and Methods

4.1. Microorganisms and Culture Conditions

Bacterial strains and their corresponding phages were cultured according to protocols outlined in their respective reference reports, with temperature conditions specified in Figure 1. The host–phage pairs used in this study included Aeromonas hydrophila (JUNAH) and phage pAh6-C [42]; Erwinia amylovora (TS3128) and phage pEa_SNUABM_27 [43,68]; Escherichia coli (ATCC43895) and phage vB_EcoM-pEE20; Salmonella enterica (KCTC2054) and phage pSe_SNUABM_01; Staphylococcus aureus (ATCC25923) and phage pSa-3 [44,45]; Vibrio coralliilyticus (58) and phage pVco-5 [46,69]; Chryseobacterium cucumeris (SKNUCL01) [70] and phage CC1; Pseudomonas aeruginosa (PAO1) and phage pPa_PMR_01. All bacterial strains were cultured in tryptic soy broth (TSB; Becton, Dickinson and Company, Franklin Lakes, NJ, USA) and on tryptic soy agar (TSA; Becton, Dickinson and Company, Franklin Lakes, NJ, USA) and soft agar (TSB with 0.4% bacteriological agar, unless otherwise specified) for 18–24 h. For the culture of Vibrio species and its phage, the media were supplemented with 2% sodium chloride to accommodate the halophilic nature of the organism. The cultures were subsequently prepared for further analyses by inoculating 1% into TSB and cultivating the bacteria to the exponential phase (108 CFU/mL).

4.2. Preparation of Bacteriophages

Propagation and the purification of the bacteriophages was performed as described in our previous study [80]. The lysate was precipitated using 10% (w/v) PEG and 0.5 M NaCl solution. A cesium chloride density gradient was utilized with ultracentrifugation (182,000× g for 3 h). The bacteriophage bands were isolated and dialyzed in a 10,000 MWCO membrane (Thermo Fisher Scientific Inc., Waltham, MA, USA) and the purified phage suspension (>1010 PFU/mL) was stored at 4 °C for further use. Phage titers in the sample were evaluated in triplicate using the plaque assay used as an indicator host strain.

4.3. Bacteriophage Plating, Plaque Area Analysis, and Harvest

All plating was performed using the conventional double-layer agar method [38]. Specifically, to establish the bottom agar layer, 10 mL of TSA was evenly poured into standard Petri dishes (90 mm in diameter). Plaque assays were performed using 0.4% or 0.8% soft agar. The soft agar mixtures were made by mixing 3 mL of 0.4% or 0.8% agar with 100 μL of a phage solution and 100 μL of bacterial host culture. The mixture was vigorously vortexed to ensure a thorough mixing of the bacteria and phages before being poured evenly over the bottom agar layer. Unless otherwise specified, assays were conducted with 0.4% soft agar and incubated for 18 h.
The plaque areas and bacterial lawns were quantified using ImageJ (ImageJ, Version 1.5, National Institutes of Health, Bethesda, MD, USA), and the ratio between them was calculated as follows:
R a t i o   o f   p l a q u e ( s )   a r e a = ( A t A b ) / A t × 100
where At is defined as the total area of the assay plate and Ab refers to the area occupied by the bacterial lawn. The area of the plaque was determined by deducting the area covered by the bacterial lawn (illustrated in red in Figure 5) from the total area of the plate.
To harvest the phages, 1 mL of SM buffer (50 mM Tris [pH 7.5], 100 mM NaCl, and 10 mM MgSO4) was added to scrape off the soft agar. The collected soft agar was then disrupted by repetitive pipetting to break down the soft agar matrix. The mixture was subjected to centrifugation at 12,000× g, followed by filtration through a 0.45 µm Millipore filter prior to titration. Previously isolated phages, including pAh6-C, pEa_27, pSe_01, vB_EcoM-pEE20, pSa-3, and pVco-5, were used to construct a regression model that establishes a correlation between plaque size and the number of PFUs for full plates. To assess the model’s validity, newly isolated phages CC1 and pPa_01 were used. Furthermore, to assess the model’s versatility, the soft agar concentration was varied from 0.4% to 0.8%, which altered the plaque sizes of the phage pEa_27 from 11.93 mm to 1.62 mm.

4.4. Statistical Analysis

Statistical analysis was performed using Minitab(Version 22, Minitab, LLC, State College, PA, USA). The analysis of plaque area and inoculum, and the regression model, was conducted using the Fitted Line Plot. A p-value < 0.05 was considered significant.

5. Conclusions

This study developed the PSC model, linking plaque size, inoculum concentration, and harvest yield. Precise inoculum density control was crucial for optimizing phage propagation, with specific PFU requirements for full plaque coverage. This study identified an inoculum density threshold that maximizes production and minimizes resistant bacteria. Validation across various bacteriophages confirmed the model’s effectiveness and adaptability, highlighting its potential as a standard tool in clinical phage production, especially for handling diverse phages in small quantities and selecting suitable ones through screening.

Author Contributions

Conceptualization, S.G.K.; methodology, S.G.K., Y.M.L., K.C. and S.J.J.; software, S.G.K. and S.J.J.; validation, S.G.K. and S.J.J.; formal analysis, S.J.J., Y.M.L., K.C. and S.G.K.; investigation, S.J.J., Y.M.L., K.C., S.Y.P., H.K. and S.G.K.; resources, S.J.J., Y.M.L., S.B.L., W.J.J., J.H.P., M.H.H., D.S.P., E.J.P., S.W.K., J.W.J., S.G.K., J.H.K. and S.C.P.; data curation, S.J.J., S.S.G. and S.G.K.; writing—original draft preparation, S.J.J. and S.G.K.; writing—review and editing, S.J.J., W.J.J., J.H.P., M.H.H., D.S.P., E.J.P., S.W.K., J.W.J., S.G.K. and S.C.P.; visualization, S.J.J., Y.M.L., K.C., S.Y.P., H.K., S.G.K. and J.H.K.; supervision, S.G.K. and S.C.P.; project administration, S.G.K. and S.C.P.; funding acquisition, S.G.K. and S.C.P. All authors have read and agreed to the published version of the manuscript.

Funding

This research was funded by Rural Development Administration, grant number “RS-2020-RD008879” and Basic Science Research Program through the National Research Foundation of Korea, grant number “2022R1I1A1A01069698”.

Informed Consent Statement

Not applicable.

Data Availability Statement

Data are contained within the article.

Conflicts of Interest

The authors declare no conflicts of interest.

References

  1. Ho, C.S.; Wong, C.T.H.; Aung, T.T.; Lakshminarayanan, R.; Mehta, J.S.; Rauz, S.; McNally, A.; Kintses, B.; Peacock, S.J.; de la Fuente-Nunez, C.; et al. Antimicrobial Resistance: A Concise Update. Lancet Microbe 2024, 5, 7–10. [Google Scholar] [CrossRef] [PubMed]
  2. Bloom, D.E.; Cadarette, D. Infectious Disease Threats in the Twenty-First Century: Strengthening the Global Response. Front. Immunol. 2019, 10, 549. [Google Scholar] [CrossRef] [PubMed]
  3. Ferri, M.; Ranucci, E.; Romagnoli, P.; Giaccone, V. Antimicrobial resistance: A global emerging threat to public health systems. Crit. Rev. Food Sci. Nutr. 2017, 57, 2857–2876. [Google Scholar] [CrossRef] [PubMed]
  4. Salam, M.A.; Al-Amin, M.Y.; Salam, M.T.; Pawar, J.S.; Akhter, N.; Rabaan, A.A.; Alqumber, M.A.A. Antimicrobial Resistance: A Growing Serious Threat for Global Public Health. Healthcare 2023, 11, 1946. [Google Scholar] [CrossRef] [PubMed]
  5. Ferrara, F.; Castagna, T.; Pantolini, B.; Campanardi, M.C.; Roperti, M.; Grotto, A.; Fattori, M.; Maso, L.D.; Carrara, F.; Zambarbieri, G.; et al. The challenge of antimicrobial resistance (AMR): Current status and future prospects. Naunyn-Schmiedeberg’s Arch. Pharmacol. 2024, 397, 9603–9615. [Google Scholar] [CrossRef]
  6. Mantravadi, P.K.; Kalesh, K.A.; Dobson, R.C.J.; Hudson, A.O.; Parthasarathy, A. The Quest for Novel Antimicrobial Compounds: Emerging Trends in Research, Development, and Technologies. Antibiotics 2019, 8, 8. [Google Scholar] [CrossRef]
  7. Ahmad, M.; Khan, A.U. Global economic impact of antibiotic resistance: A review. J. Glob. Antimicrob. Resist. 2019, 19, 313–316. [Google Scholar] [CrossRef] [PubMed]
  8. Aslam, B.; Asghar, R.; Muzammil, S.; Shafique, M.; Siddique, A.B.; Khurshid, M.; Ijaz, M.; Rasool, M.H.; Chaudhry, T.H.; Aamir, A.; et al. AMR and Sustainable Development Goals: At a crossroads. Glob. Health 2024, 20, 73. [Google Scholar] [CrossRef] [PubMed]
  9. Spellberg, B.; Bartlett, J.; Wunderink, R.; Gilbert, D.N. Novel approaches are needed to develop tomorrow’s antibacterial therapies. Am. J. Respir. Crit. Care Med. 2015, 191, 135–140. [Google Scholar] [CrossRef] [PubMed]
  10. Murugaiyan, J.; Kumar, P.A.; Rao, G.S.; Iskandar, K.; Hawser, S.; Hays, J.P.; Mohsen, Y.; Adukkadukkam, S.; Awuah, W.A.; Jose, R.A.M.; et al. Progress in Alternative Strategies to Combat Antimicrobial Resistance: Focus on Antibiotics. Antibiotics 2022, 11, 200. [Google Scholar] [CrossRef]
  11. O’neill, J. Antimicrobial Resistance: Tackling a Crisis for the Health and Wealth of Nations. Review on Antimicrobial Resistance. 2014. Available online: https://amr-review.org/Publications.html (accessed on 12 August 2024).
  12. Ghosh, S.; Bornman, C.; Zafer, M.M. Antimicrobial Resistance Threats in the emerging COVID-19 pandemic: Where do we stand? J. Infect. Public. Health. 2021, 14, 555–560. [Google Scholar] [CrossRef] [PubMed]
  13. Domingo-Calap, P.; Delgado-Martínez, J. Bacteriophages: Protagonists of a Post-Antibiotic Era. Antibiotics 2018, 7, 66. [Google Scholar] [CrossRef] [PubMed]
  14. Pal, N.; Sharma, P.; Kumawat, M.; Singh, S.; Verma, V.; Tiwari, R.R.; Sarma, D.K.; Nagpal, R.; Kumar, M. Phage therapy: An alternative treatment modality for MDR bacterial infections. Infect. Dis. 2024, 56, 785–817. [Google Scholar] [CrossRef] [PubMed]
  15. Jo, S.J.; Kwon, J.; Kim, S.G.; Lee, S.-J. The Biotechnological Application of Bacteriophages: What to Do and Where to Go in the Middle of the Post-Antibiotic Era. Microorganisms 2023, 11, 2311. [Google Scholar] [CrossRef]
  16. Abedon, S.T. Phage Therapy: Various Perspectives on How to Improve the Art. In Host-Pathogen Interactions; Medina, C., López-Baena, F.J., Eds.; Springer: New York, NY, USA, 2018; pp. 113–127. [Google Scholar]
  17. Zhang, M.; Zhang, T.; Yu, M.; Chen, Y.-L.; Jin, M. The Life Cycle Transitions of Temperate Phages: Regulating Factors and Potential Ecological Implications. Viruses 2022, 14, 1904. [Google Scholar] [CrossRef]
  18. Kortright, K.E.; Chan, B.K.; Koff, J.L.; Turner, P.E. Phage therapy: A renewed approach to combat antibiotic-resistant bacteria. Cell Host Microbe 2019, 25, 219–232. [Google Scholar] [CrossRef] [PubMed]
  19. Hatfull, G.F.; Dedrick, R.M.; Schooley, R.T. Phage therapy for antibiotic-resistant bacterial infections. Annu. Rev. Med. 2022, 73, 197–211. [Google Scholar] [CrossRef] [PubMed]
  20. Pirnay, J.P.; De Vos, D.; Verbeken, G. Clinical application of bacteriophages in Europe. Microbiol. Aust. 2019, 40, 8–15. [Google Scholar] [CrossRef]
  21. Aslam, S.; Lampley, E.; Wooten, D.; Karris, M.; Benson, C.; Strathdee, S.; Schooley, R.T. Lessons learned from the first 10 consecutive cases of intravenous bacteriophage therapy to treat multidrug-resistant bacterial infections at a single center in the United States. Open Forum Infect. Dis. 2020, 7, ofaa389. [Google Scholar] [CrossRef] [PubMed]
  22. Vikram, A.; Callahan, M.T.L.; Woolston, J.W.; Sharma, M.; Sulakvelidze, A. Phage biocontrol for reducing bacterial foodborne pathogens in produce and other foods. Curr. Opin. Biotechnol. 2022, 78, 102805. [Google Scholar] [CrossRef] [PubMed]
  23. Kuek, M.; McLean, S.K.; Palombo, E.A. Application of bacteriophages in food production and their potential as biocontrol agents in the organic farming industry. Biol. Control 2022, 165, 104817. [Google Scholar] [CrossRef]
  24. Kakasis, A.; Panitsa, G. Bacteriophage therapy as an alternative treatment for human infections. A comprehensive review. Int. J. Antimicrob. Agents 2019, 53, 16–21. [Google Scholar] [CrossRef] [PubMed]
  25. Fernández, L.; Gutiérrez, D.; Rodríguez, A.; García, P. Application of bacteriophages in the agro-food sector: A long way toward approval. Front. Cell. Infect. Microbiol. 2018, 8, 296. [Google Scholar] [CrossRef]
  26. Schmidt, F.R. Optimization and scale up of industrial fermentation processes. Appl. Microbiol. Biotechnol. 2005, 68, 425–435. [Google Scholar] [CrossRef] [PubMed]
  27. García, R.; Latz, S.; Romero, J.; Higuera, G.; García, K.; Bastías, R. Bacteriophage production models: An overview. Front. Microbiol. 2019, 10, 1187. [Google Scholar] [CrossRef]
  28. Jurač, K.; Nabergoj, D.; Podgornik, A. Bacteriophage production processes. Appl. Microbiol. Biotechnol. 2019, 103, 685–694. [Google Scholar] [CrossRef] [PubMed]
  29. Hyman, P.; Abedon, S.T. Practical Methods for Determining Phage Growth Parameters. In Bacteriophages: Methods and Protocols; Clokie, M.R., Kropinski, A.M., Eds.; Humana Press: New York, NY, USA, 2009; Volume 1, pp. 175–202. [Google Scholar]
  30. João, J.; Lampreia, J.; Prazeres, D.M.F.; Azevedo, A.M. Manufacturing of bacteriophages for therapeutic applications. Biotechnol. Adv. 2021, 49, 107758. [Google Scholar] [CrossRef]
  31. González-Menéndez, E.; Arroyo-López, F.N.; Martínez, B.; García, P.; Garrido-Fernández, A.; Rodríguez, A. Optimizing propagation of Staphylococcus aureus infecting bacteriophage vB_sauM-phiIPLA-RODI on Staphylococcus xylosus using response surface methodology. Viruses 2018, 10, 153. [Google Scholar] [CrossRef]
  32. Kim, B.; Kim, E.S.; Yoo, Y.-J.; Bae, H.-W.; Chung, I.-Y.; Cho, Y.-H. Phage-derived antibacterials: Harnessing the simplicity, plasticity, and diversity of phages. Viruses 2019, 11, 268. [Google Scholar] [CrossRef] [PubMed]
  33. Górski, A.; Dąbrowska, K.; Hodyra-Stefaniak, K.; Borysowski, J.; Międzybrodzki, R.; Weber-Dąbrowska, B. Phages targeting infected tissues: Novel approach to phage therapy. Future Microbiol. 2015, 10, 199–204. [Google Scholar] [CrossRef]
  34. Luong, T.; Salabarria, A.C.; Roach, D.R. Phage therapy in the resistance era: Where do we stand and where are we going? Clin. Ther. 2020, 42, 1659–1680. [Google Scholar] [CrossRef] [PubMed]
  35. Tan, X.; Chen, K.; Jiang, Z.; Liu, Z.; Wang, S.; Ying, Y.; Zhang, J.; Yuan, S.; Huang, Z.; Gao, R.; et al. Evaluation of the impact of repeated intravenous phage doses on mammalian host–phage interactions. J. Virol. 2024, 98, e01359-23. [Google Scholar] [CrossRef] [PubMed]
  36. Dedrick, R.M.; Guerrero-Bustamante, C.A.; Garlena, R.A.; Russell, D.A.; Ford, K.; Harris, K.; Gilmour, K.C.; Soothill, J.; Jacobs-Sera, D.; Schooley, R.T.; et al. Engineered bacteriophages for treatment of a patient with a disseminated drug-resistant Mycobacterium abscessus. Nat. Med. 2019, 25, 730–733. [Google Scholar] [CrossRef] [PubMed]
  37. Bonilla, N.; Rojas, M.I.; Netto Flores Cruz, G.; Hung, S.H.; Rohwer, F.; Barr, J.J. Phage on tap-a quick and efficient protocol for the preparation of bacteriophage laboratory stocks. PeerJ 2016, 4, e2261. [Google Scholar] [CrossRef]
  38. Kim, J.H.; Gomez, D.K.; Nakai, T.; Park, S.C. Isolation and identification of bacteriophages infecting ayu Plecoglossus altivelis altivelis specific Flavobacterium psychrophilum. Vet. Microbiol. 2010, 140, 109–115. [Google Scholar] [CrossRef] [PubMed]
  39. Mesquita, M.M.F.; Stimson, J.; Chae, G.T.; Tufenkji, N.; Ptacek, C.J.; Blowes, D.W.; Emelko, M.B. Optimal preparation and purification of PRD1-like bacteriophages for use in environmental fate and transport studies. Water Res. 2010, 44, 1114–1125. [Google Scholar] [CrossRef]
  40. Payaslian, F.; Gradaschi, V.; Rondón Salazar, L.; Dieterle, M.E.; Urdániz, E.; Di Paola, M.; Cárcamo, J.P.; Zon, F.; Sosa, E.; Porto, D.F.D.; et al. Isolation and characterization of vB_MsmS_Celfi: A new Mycobacterium tuberculosis bacteriophage. PHAGE Ther. Appl. Res. 2021, 2, 43–49. [Google Scholar]
  41. Skaradzińska, A.; Ochocka, M.; Śliwka, P.; Kuźmińska-Bajor, M.; Skaradziński, G.; Friese, A.; Roschanski, N.; Murugaiyan, J.; Roesler, U. Bacteriophage amplification–A comparison of selected methods. J. Virol. Methods 2020, 282, 113856. [Google Scholar] [CrossRef] [PubMed]
  42. Jun, J.W.; Kim, H.J.; Yun, S.K.; Chai, J.Y.; Park, S.C. Genomic structure of the Aeromonas bacteriophage pAh6-C and its comparative genomic analysis. Arch. Virol. 2015, 160, 561–564. [Google Scholar] [CrossRef]
  43. Kim, S.G.; Lee, S.B.; Jo, S.J.; Cho, K.; Park, J.K.; Kwon, J.; Giri, S.S.; Kim, S.-W.; Kang, J.-W.; Jung, W.-J.; et al. Phage cocktail in combination with kasugamycin as a potential treatment for fire blight caused by Erwinia amylovora. Antibiotics 2022, 11, 1566. [Google Scholar] [CrossRef]
  44. Kim, S.G.; Jun, J.W.; Giri, S.S.; Yun, S.; Kim, H.J.; Chi, C.; Park, S.C. Complete genome sequence of Staphylococcus aureus bacteriophage pSa-3. Genome Announc. 2017, 5, e00182-17. [Google Scholar] [CrossRef] [PubMed]
  45. Kim, S.G.; Giri, S.S.; Yun, S.; Kim, H.J.; Kim, S.W.; Kang, J.W.; Oh, W.T.; Jun, J.W.; Park, S.C. Synergistic phage–surfactant combination clears IgE-promoted Staphylococcus aureus aggregation in vitro and enhances the effect in vivo. Int. J. Antimicrob. Agents 2020, 56, 105997. [Google Scholar] [CrossRef]
  46. Kim, H.J.; Giri, S.S.; Kim, S.G.; Kim, S.W.; Kwon, J.; Lee, S.B.; Park, S.C. Isolation and characterization of two bacteriophages and their preventive effects against pathogenic Vibrio coralliilyticus causing mortality of Pacific oyster (Crassostrea gigas) larvae. Microorganisms 2020, 8, 926. [Google Scholar] [CrossRef] [PubMed]
  47. Regulski, K.; Champion-Arnaud, P.; Gabard, J. Bacteriophage manufacturing: From early twentieth-century processes to current GMP. In Bacteriophages; Harper, D.R., Abedon, S.T., Burrowes, B.H., McConville, M.L., Eds.; Springer: New York, NY, USA, 2021; pp. 699–729. [Google Scholar]
  48. Wiebe, K.G.; Cook, B.W.; Lightly, T.J.; Court, D.A.; Theriault, S.S. Investigation into scalable and efficient enterotoxigenic Escherichia coli bacteriophage production. Sci. Rep. 2024, 14, 3618. [Google Scholar] [CrossRef]
  49. Rohde, C.; Resch, G.; Pirnay, J.-P.; Blasdel, B.G.; Debarbieux, L.; Gelman, D.; Górski, A.; Hazan, R.; Huys, I.; Kakabadze, E.; et al. Expert opinion on three phage therapy related topics: Bacterial phage resistance, phage training and prophages in bacterial production strains. Viruses 2018, 10, 178. [Google Scholar] [CrossRef] [PubMed]
  50. Pirnay, J.P.; De Vos, D.; Verbeken, G.; Merabishvili, M.; Chanishvili, N.; Vaneechoutte, M.; Zizi, M.; Laire, G.; Lavigne, R.; Huys, I.; et al. The phage therapy paradigm: Prêt-à-porter or sur-mesure? Pharm. Res. 2011, 28, 934–937. [Google Scholar] [CrossRef] [PubMed]
  51. Santos, S.B.; Carvalho, C.; Azeredo, J.; Ferreira, E.C. Correction: Population Dynamics of a Salmonella Lytic Phage and Its Host: Implications of the Host Bacterial Growth Rate in Modelling. PLoS ONE 2015, 10, e0136007. [Google Scholar] [CrossRef] [PubMed]
  52. Cairns, B.J.; Timms, A.R.; Jansen, V.A.; Connerton, I.F.; Payne, R.J. Quantitative models of in vitro bacteriophage–host dynamics and their application to phage therapy. PLoS Pathog. 2009, 5, e1000253. [Google Scholar] [CrossRef]
  53. Storms, Z.J.; Brown, T.; Cooper, D.G.; Sauvageau, D.; Leask, R.L. Impact of the cell life-cycle on bacteriophage T4 infection. FEMS Microbiol. Lett. 2014, 353, 63–68. [Google Scholar] [CrossRef] [PubMed]
  54. Pirnay, J.P. Phage therapy in the year 2035. Front. Microbiol. 2020, 11, 1171. [Google Scholar] [CrossRef]
  55. Pirnay, J.P.; Djebara, S.; Steurs, G.; Griselain, J.; Cochez, C.; De Soi, S.; Glonti, T.; Spiessens, A.; Berghe, E.V.; Green, S.; et al. Personalized bacteriophage therapy outcomes for 100 consecutive cases: A multicentre, multinational, retrospective observational study. Nat. Microbiol. 2024, 9, 1434–1453. [Google Scholar] [CrossRef]
  56. Romero-Calle, D.; Guimarães Benevides, R.; Góes-Neto, A.; Billington, C. Bacteriophages as Alternatives to Antibiotics in Clinical Care. Antibiotics 2019, 8, 138. [Google Scholar] [CrossRef] [PubMed]
  57. Mattila, S.; Ruotsalainen, P.; Jalasvuori, M. On-demand isolation of bacteriophages against drug-resistant bacteria for personalized phage therapy. Front. Microbiol. 2015, 6, 1271. [Google Scholar] [CrossRef] [PubMed]
  58. Tan, X.; Chen, H.; Zhang, M.; Zhao, Y.; Jiang, Y.; Liu, X.; Huang, W.; Ma, Y. Clinical experience of personalized phage therapy against carbapenem-resistant Acinetobacter baumannii lung infection in a patient with chronic obstructive pulmonary disease. Front. Cell. Infect. Microbiol. 2021, 11, 631585. [Google Scholar] [CrossRef] [PubMed]
  59. Melo, L.D.R.; Oliveira, H.; Pires, D.P.; Dabrowska, K.; Azeredo, J. Phage therapy efficacy: A review of the last 10 years of preclinical studies. Crit. Rev. Microbiol. 2020, 46, 78–99. [Google Scholar] [CrossRef] [PubMed]
  60. Gencay, Y.E.; Birk, T.; Sørensen, M.C.H.; Brøndsted, L. Methods for isolation, purification, and propagation of bacteriophages of Campylobacter jejuni. In Methods in Molecular Biology; Butcher, J., Stintzi, A., Eds.; Humana Press: New York, NY, USA, 2017; pp. 19–28. [Google Scholar]
  61. Lavigne, R.; Burkal’tseva, M.V.; Robben, J.; Sykilinda, N.N.; Kurochkina, L.P.; Grymonprez, B.; Jonckx, B.; Krylov, V.N.; Mesyanzhinov, V.V.; Volckaert, G. The genome of bacteriophage φKMV, a T7-like virus infecting Pseudomonas aeruginosa. Virology 2003, 312, 49–59. [Google Scholar] [CrossRef] [PubMed]
  62. Abedon, S.T. Lysis from without. Bacteriophage 2011, 1, 46–49. [Google Scholar] [CrossRef]
  63. Kim, S.G.; Jun, J.W.; Giri, S.S.; Yun, S.; Kim, H.J.; Kim, S.W.; Kang, J.W.; Han, S.J.; Jeong, D.; Park, S.C. Isolation and characterisation of pVa-21, a giant bacteriophage with anti-biofilm potential against Vibrio alginolyticus. Sci. Rep. 2019, 9, 6284. [Google Scholar] [CrossRef] [PubMed]
  64. Supply, Storage, Propagation and Purification of Pahges (DSMZ). Available online: https://www.dsmz.de/fileadmin/user_upload/Collection_allg/DSMZ_Cultivation_of_Phages.pdf (accessed on 20 November 2024).
  65. Kim, S.G.; Giri, S.S.; Yun, S.; Kim, S.W.; Han, S.J.; Kwon, J.; Oh, W.T.; Lee, S.B.; Park, Y.H.; Park, S.C. Two novel bacteriophages control multidrug-and methicillin-resistant Staphylococcus pseudintermedius biofilm. Front. Med. 2021, 8, 524059. [Google Scholar] [CrossRef]
  66. Dennehy, J.J.; Abedon, S.T. Phage infection and lysis. In Bacteriophages: Biology, Technology, Therapy; Harper, D.R., Abedon, S.T., Burrowes, B.H., McConville, M.L., Eds.; Springer: New York, NY, USA, 2021; pp. 341–383. [Google Scholar]
  67. Gordillo Altamirano, F.L.; Barr, J.J. Phage Therapy in the Postantibiotic Era. Clin. Microbiol. Rev. 2019, 32, e00066-18. [Google Scholar] [CrossRef] [PubMed]
  68. Kang, I.J.; Park, D.H.; Lee, Y.K.; Han, S.W.; Kwak, Y.S.; Oh, C.S. Complete genome sequence of Erwinia amylovora strain TS3128, a Korean strain isolated in an Asian pear orchard in 2015. Microbiol. Resour. Announc. 2021, 10, e0069421. [Google Scholar] [CrossRef] [PubMed]
  69. Kim, H.J.; Kim, J.H.; Jun, J.W.; Giri, S.S.; Chi, C.; Yun, S.; Kim, S.G.; Kim, S.W.; Kang, J.W.; Jeong, D.G.; et al. Complete genome sequence of Vibrio coralliilyticus 58, Isolated from Pacific oyster (Crassostrea gigas) larvae. Genome Announc. 2017, 5, e00437-17. [Google Scholar] [CrossRef] [PubMed]
  70. Kim, S.G.; Giri, S.S.; Kim, S.W.; Kwon, J.; Lee, S.B.; Park, S.C. First isolation and characterization of Chryseobacterium cucumeris SKNUCL01, isolated from diseased pond loach (Misgurnus anguillicaudatus) in Korea. Pathogens 2020, 9, 397. [Google Scholar] [CrossRef]
  71. Pulverer, G.; Schütt-Gerowitt, H.; Schaal, K.P. Bacteriophages of Nocardia asteroides. Med. Microbiol. Immunol. 1975, 161, 113–122. [Google Scholar] [CrossRef] [PubMed]
  72. Tanji, Y.; Tanaka, A.; Tani, K.; Kurimoto, M.; Miyanaga, K. IgG-dependent aggregation of Staphylococcus aureus inhibits bacteriophage attack. Biochem. Eng. J. 2015, 97, 17–24. [Google Scholar] [CrossRef]
  73. Tzipilevich, E.; Pollak-Fiyaksel, O.; Shraiteh, B.; Ben-Yehuda, S. Bacteria elicit a phage tolerance response subsequent to infection of their neighbors. EMBO J. 2022, 41, e109247. [Google Scholar] [CrossRef] [PubMed]
  74. Hunter, M.; Fusco, D. Superinfection exclusion: A viral strategy with short-term benefits and long-term drawbacks. PLoS Comput. Biol. 2022, 18, e1010125. [Google Scholar] [CrossRef] [PubMed]
  75. Abedon, S.T. Bacteriophage secondary infection. Virol. Sin. 2015, 30, 3–10. [Google Scholar] [CrossRef] [PubMed]
  76. Bucher, M.J.; Czyż, D.M. Phage against the machine: The SIE-ence of superinfection exclusion. Viruses 2024, 16, 1348. [Google Scholar] [CrossRef] [PubMed]
  77. Millman, A.; Melamed, S.; Leavitt, A.; Doron, S.; Bernheim, A.; Hör, J.; Garb, J.; Bechon, N.; Brandis, A.; Lopatina, A.; et al. An expanded arsenal of immune systems that protect bacteria from phages. Cell Host Microbe 2022, 30, 1556–1569. [Google Scholar] [CrossRef]
  78. Huiting, E.; Bondy-Denomy, J. Defining the expanding mechanisms of phage-mediated activation of bacterial immunity. Curr. Opin. Microbiol. 2023, 74, 102325. [Google Scholar] [CrossRef] [PubMed]
  79. Laub, M.T.; Typas, A. Principles of bacterial innate immunity against viruses. Curr. Opin. Immunol. 2024, 89, 102445. [Google Scholar] [CrossRef] [PubMed]
  80. Kim, S.G.; Kwon, J.; Giri, S.S.; Yun, S.; Kim, H.J.; Kin, S.W.; Kang, J.W.; Bin Lee, S.; Jung, W.J.; Park, S.C. Strategy for mass production of lytic Staphylococcus aureus bacteriophage pSa-3: Contribution of multiplicity of infection and response surface methodology. Microb. Cell Fact. 2021, 20, 56. [Google Scholar] [CrossRef] [PubMed]
Figure 3. Validation of the regression model, plaque size calculation (PSC). The PSC was applied to predict MCPs for various phages, which were then used in plaque assays to evaluate the model’s accuracy.
Antibiotics 14 00002 g003
Figure 4. Phage propagation inoculum and yield analysis using the agar plate method. (A) Comparison of propagation yield based on the inoculation of MCPs. The inoculum varies from 1/4 to 100 times the MCPs. (B) Comparison of the emergence of bacteriophage resistance based on the inoculation of MCPs. Phage-resistant colonies are indicated by arrows as examples. The inoculum varies from 1 to 100 times the MCPs.
Antibiotics 14 00002 g004
Figure 5. Schematic representation of plaque area measurement. The plaque area was calculated by subtracting the area occupied by the bacterial lawn (depicted in red) from the total area of the plate.
Antibiotics 14 00002 g005
Table 1. Total phage production in a Petri dish (90 mm) based on plaque area.
Plaque Area (%)
255075100 (=MCP)10 MCP100 MCP
pAh6-C5.17 ± 0.38
× 109 PFU/mL
4.50 ± 0.11
× 1010 PFU/mL
1.05 ± 0.20
× 1010 PFU/mL
8.33 ± 0.22
× 1011 PFU/mL
1.97 ± 0.26
× 1010 PFU/mL
1.43 ± 0.32
× 109 PFU/mL
pEa_274.33 ± 1.88
× 107 PFU/mL
2.03 ± 0.46
× 108 PFU/mL
6.10 ± 0.12
× 108 PFU/mL
2.53 ± 0.23
× 109 PFU/mL
1.30 ± 0.37
× 109 PFU/mL
1.63 ± 0.30
× 109 PFU/mL
vB_EcoM-pEE201.02 ± 0.17
× 109 PFU/mL
2.80 ± 0.77
× 109 PFU/mL
7.20 ± 0.98
× 109 PFU/mL
1.29 ± 0.16
× 1010 PFU/mL
2.33 ± 0.24
× 109 PFU/mL
8.23 ± 0.16
× 108 PFU/mL
pSe_015.30 ± 0.72
× 108 PFU/mL
1.72 ± 0.12
× 109 PFU/mL
6.40 ± 0.17
× 109 PFU/mL
7.60 ± 0.64
× 109 PFU/mL
1.37 ± 0.11
× 1010 PFU/mL
8.90 ± 0.10
× 109 PFU/mL
pSa-31.07 ± 0.23
× 108 PFU/mL
7.40 ± 0.73
× 108 PFU/mL
5.86 ± 0.67
× 109 PFU/mL
2.58 ± 0.17
× 1010 PFU/mL
3.73 ± 0.33
× 1010 PFU/mL
1.95 ± 0.77
× 1010 PFU/mL
pVco-51.83 ± 0.47
× 109 PFU/mL
2.30 ± 0.37
× 109 PFU/mL
3.03 ± 0.45
× 109 PFU/mL
4.67 ± 0.41
× 109 PFU/mL
2.50 ± 0.24
× 109 PFU/mL
2.13 ± 0.41
× 109 PFU/mL
Disclaimer/Publisher’s Note: The statements, opinions and data contained in all publications are solely those of the individual author(s) and contributor(s) and not of MDPI and/or the editor(s). MDPI and/or the editor(s) disclaim responsibility for any injury to people or property resulting from any ideas, methods, instructions or products referred to in the content.

