Article

Theoretical Uniformity Analysis and Improvement of Spray Deposition by Mixing Nozzles with Heating Conditions

School of Energy and Power Engineering, Huazhong University of Science & Technology, Wuhan 430074, China
*
Author to whom correspondence should be addressed.
Coatings 2020, 10(1), 81; https://doi.org/10.3390/coatings10010081
Submission received: 18 December 2019 / Revised: 10 January 2020 / Accepted: 14 January 2020 / Published: 19 January 2020

Abstract

:
Spray coating is widely used in the manufacture of deposited layers of electronic devices due to its unique advantages of high-speed deposition over a large area. To improve the spray deposition process for further low-cost and uniform production, the uniformity of the spray deposition should be systematically investigated. The current study, however, mainly focuses on the experimental trials with few numerical directions especially for the mixing nozzle sprayers with heating conditions. In the paper, we conduct a theoretical study on the uniformity of the internal and external mixing nozzles. The influencing factors include the initial angle, the total ink flow rate, the transporting gas velocity and the distance from the nozzle to the substrate. Then, the orthogonal test method is adopted to obtain the optimal combination of the parameters. Finally, the effects of different heating modes on the uniformity have been further studied. The results show that these factors influence the uniformity with the two types of nozzles to a different degree. The evaporation of the atomized droplets can effectively improve the uniformity in a certain temperature range. The heating temperature with the highest uniformity is various depending on the heating modes, which should be carefully addressed during the actual production.

1. Introduction

With the rapid development of modern technology, precision and miniaturization of the electronic devices have become the trends in electronic fabrication. Therefore, higher requirements of efficiency and precision have been raised for the manufacturing of organic electronic devices, including thin-film transistors, light-emitting diodes, photovoltaic devices and storage memories. These electronic components with similar structures are composed of various layers with distinct functions [1]. In addition, the thickness and uniformity of these deposited layers affect the electrical properties and the performance of devices greatly. Thus, it is important to produce deposited layers with high uniformity. In the last decade, the processing methods have made great progress that allows fast deposition of materials on a large area at low cost and high throughput, forming a systematic organic large-area electronics (OLAE) technology [2]. These methods mainly include soft lithography, inkjet printing, and spray coating. Among them, spray deposition has been studied by many scholars for it has a unique advantage of high-speed deposition over large areas at low cost.
The applications of the spray deposition technique include spray-deposited organic thin-film transistors, top electrodes, organic solar cells, etc. Ishikawa [3] et al. fabricated a thin layer of an organic bulk heterojunction photovoltaic cell (OPC) by the evaporative spray deposition from ultradilute solution (ESDUS) technique. The flatness or thickness of the resulted films can be controlled by the spraying rate, chamber temperature, and substrate temperature. Vak [4] et al. fabricated active layers of organic solar cells (OSCs) using conventional handheld airbrushes. Although the spray deposited film showed a relatively rougher surface than spin-coated ones, pinhole-free and constant thickness films could be obtained. Green [5] et al. used airbrush spray deposition to fabricate the active layer in ambient conditions, and improve homogeneity of the layer. Bernardin [6] et al. developed a universal method for spray-deposition of polymeric semiconductor blends, and adjustable experimental parameters are flow rate, solvent, material concentration, nozzle-substrate distance, and substrate temperature. Girotto [7] et al. used internal mixing airbrush Badger 200 NH to spray coating Ag nanoparticle solution, the fabricated cells show performances comparable to those of reference devices with evaporated top-contacts. Azarova [8] et al. used an Iwata Kustom THK9200 airbrush with a nozzle diameter of 0.50 mm, and the transistors show very good homogeneity. Chan [9] et al. fabricated high-performance organic thin-film transistors, and the spray-deposited film was estimated to be 100 nm thick on average. Owen [10] et al. demonstrated the performance of spray-deposited transistors is similar to spin-coated devices while utilizing a 20 times smaller amount of organic semiconductor than the wasteful spin-coating procedure. Rigas [11] et al. performed a spray printing experiment of organic semiconducting single crystals by using two types of spray coater, which have an external air-paint mix system and internal mixture system, respectively. By altering the angle, distance, and type of airbrush from which the solution was ejected, they controlled the shape and the size of single crystals.
Although these studies show that direct spray coating can effectively obtain a relatively uniform deposition layer, most of the current research is still in the stage of the laboratory with lots of experiments. The uniformity is influenced by various factors, and it is difficult to carry out many experimental trials completely. Therefore, it is very necessary to conduct simulation studies to guide practical applications with more complete data. For this purpose, the computational fluid dynamics (CFD) method is used to simulate the spray process. At first, the effects of four factors on the uniformity are studied separately, including the initial angle, the total ink flow rate, the transporting gas velocity and the distance from the nozzle to the substrate. These factors are hereinafter referred to as initial angle, flow rate, gas velocity and substrate distance for convenience in the following study. The mathematical evaluation indexes have also been proposed to evaluate the uniformity numerically. Then the orthogonal test analysis is performed to obtain the optimal combination. Finally, based on the optimal parameter combination, the spray deposition uniformity is further improved by evaporating the ink droplets by different heating surfaces with various temperatures.
2. Problem Description and Mathematical Models

2.1. Geometry Description

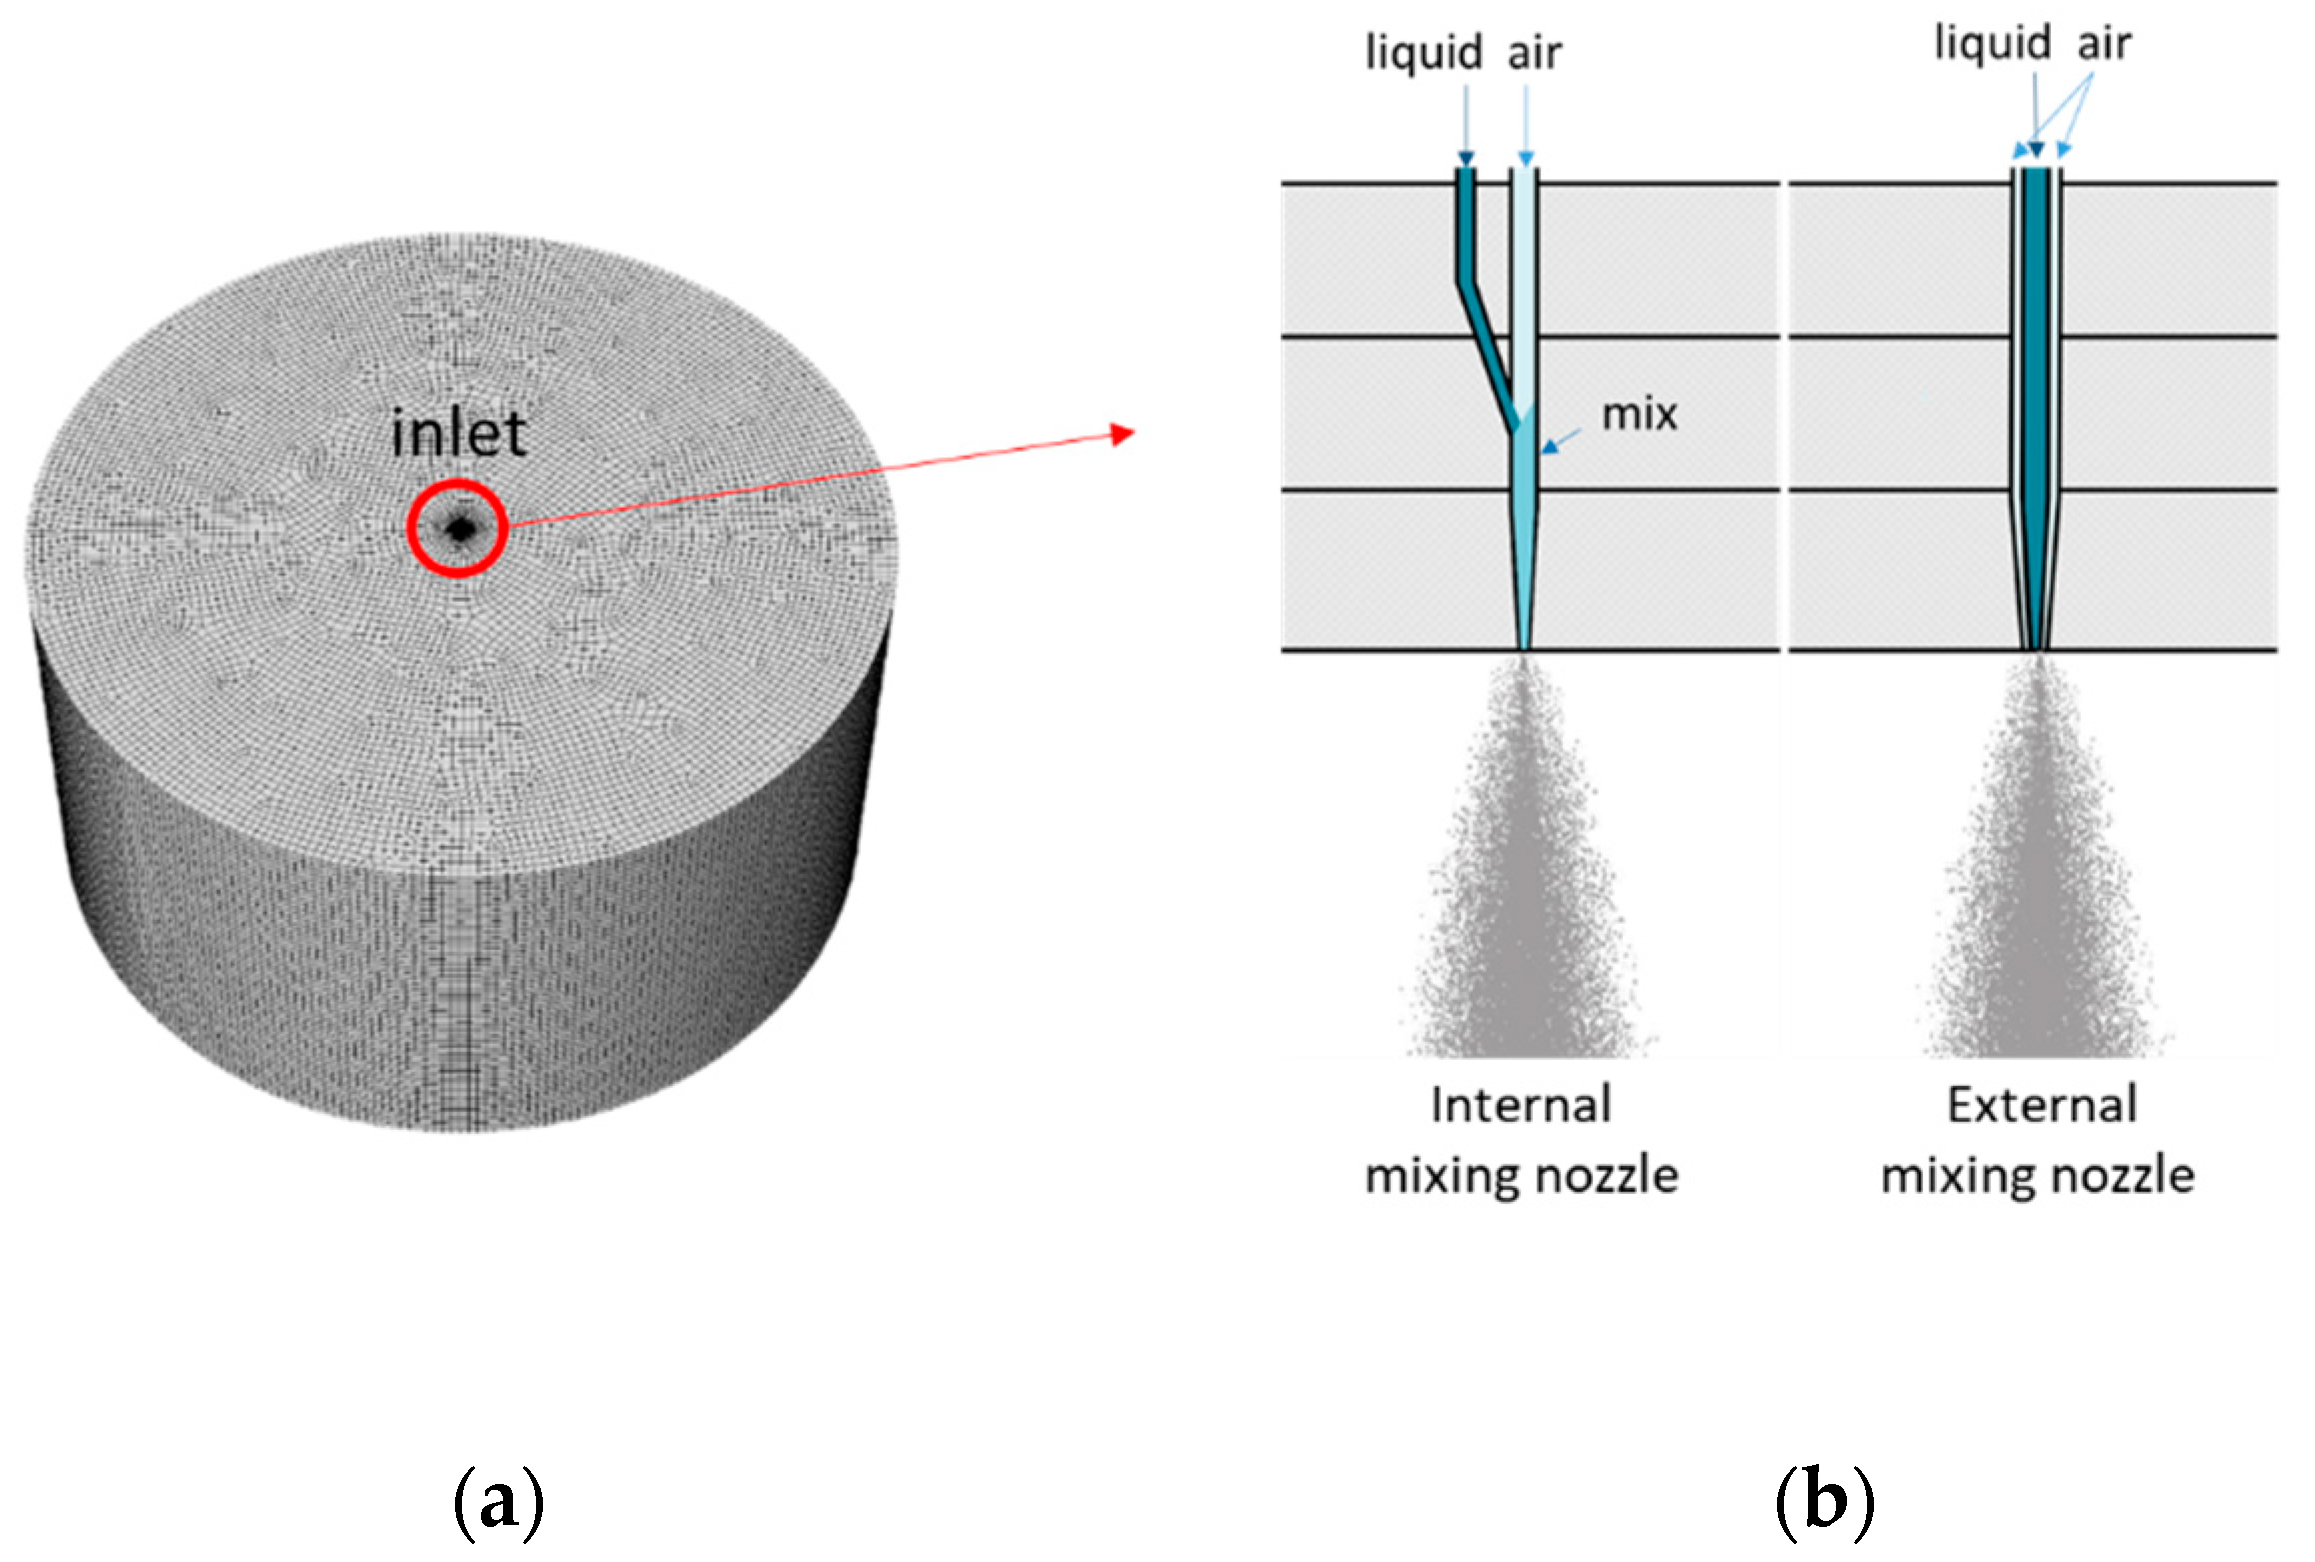
The liquid in the nozzle is commonly atomized by two methods in spray deposition/coating: one is by ultrasound and the other is by applying pressure to a transporting gas [2]. The latter method is more widely used in real production, including two types of air-assisted spray nozzles: the internal mixing nozzle and the external mixing nozzle. Figure 1 shows their basic structure that the gas is mixed with the liquid ink inside or outside the nozzle, respectively. The diameters of the liquid passage of the two nozzles are both set to 0.2 mm here. As is shown in Figure 1a, the size of the reactor chamber, i.e., the simulation zone after the spout, much larger than the diameter of the nozzle, is a cylinder with a diameter of 20 mm and a height of 10 mm in order to reduce the influence of the wall on the jetting process. Besides, the distance between the nozzle and the substrate is controllable during the actual spray process, so the height of the reactor chamber is divided every 0.1 mm in the post-processing to represent different control distances. In the simulation cases, the reactor chamber is in ambient conditions. The boundary conditions are set to the velocity inlet and the pressure outlet, and the selected liquid ink materials have similar properties to ethanol for convenient analysis.

2.2. Mathematical Models

Since the volume fraction of the droplets is less than 10% in the carrier gas, the Euler–Lagrange method is adopted, that is, the liquid phase is regarded as a discrete phase, and the gas phase is regarded as the continuous phase. For the gas phase, excessive speed will cause more uncertain effects on uniformity, which is not easy to control, so the velocity of the gas is lower, and the fluid is laminar flow. For the liquid phase, the air-blast atomizer model is adopted, and the focus is on the motion of the particles and the exchange of heat and mass. The governing equations are given as follows.

2.2.1. The Gas Phase

The equation for conservation of mass can be written as
ρ t + ( ρ v ) = S m .
The source S m is the mass added to the continuous phase from the dispersed second phase. In this study, it is due to vaporization of liquid droplets.
Conservation of momentum in an inertial reference frame is described by [12] as
t ( ρ v ) + ( ρ v v ) = p + ( τ ¯ ¯ ) + ρ g + F ,
where p is the static pressure, τ = is the stress tensor (described below), and ρ g and F are the gravitational body force and external body forces, respectively. F also contains other model-dependent source terms.
The stress tensor τ = is given by
τ ¯ ¯ = μ [ ( v + v T ) 2 3 v I ] ,
where μ is the molecular viscosity, I is the unit tensor, and the second term on the right hand side is the effect of volume dilation.

2.2.2. The Liquid Phase

As for the discrete phase of the droplets, which interacts with the gas phase, that is, it will exchange the energy or mass during the process, so it is necessary to solve their coupled flow. If the liquid particles are all spherical, for a single liquid particle, the equilibrium equation for the various forces acting on the droplet is computed as
d u p d t = F D ( u g u p ) + g x ( ρ p ρ ) ρ p + F x   ,
where u p is the velocity of the droplet, u g is the velocity of the gas fluid phase, g x is the acceleration of gravity, and ρ p is the skeletal density of the droplet. F x is the additional force term which refers to other forces, including thermophoretic force, Brownian force, Saffman’s lift force and so on F D ( u g u p ) is the drag force per unit particle mass [13], and
F D = 18 μ ρ p d p 2   C D R e d 24 ,
where d p is the diameter of the droplet particles, R e d is the relative Reynolds number, which is defined as
R e d = ρ d p | u g u p | μ .
C D is the drag coefficient which can be expressed as
C D = a 1 + a 2 R e d + a 3 R e d 2 .
For spherical droplets, a 1 , a 2 and a 3 are constant in a range of Reynolds number.
When the particle temperature T p is less than the vaporization temperature T v a p , that is, T p < T v a p , the particle satisfies the heat transfer equation is
m p c p d T p d t = h A p ( T T p ) + ε p A p σ ( θ R 4 T p 4 ) ,
where m p is the mass of the particle, c p is the heat capacity of the particle, A p is the surface area of the particle, T is the local temperature of continuous phase, h is the convective heat transfer coefficient, ε p is the particle emissivity, σ is the Stefan–Boltzmann constant, θ R is the radiation temperature.
The convective heat transfer coefficient h is evaluated using the correlation of Ranz [14] and Marshall
N u = h d p k = 2.0 + 0.6 R e d 1 / 2 P r 1 / 3 ,
where d p is the particle diameter, k is the thermal conductivity of the continuous phase, P r is the Prandtl number of the continuous phase.
When the temperature of the droplet reaches the vaporization temperature, T v a p , and continues until the droplet reaches the boiling point, T b p , that is, T v a p T p < T b p , the particle satisfies the mass and heat transfer equations is
m p c p d T p d t = h A p ( T T p ) d m p d t h f g + A p ε p σ ( θ R 4 T p 4 ) ,
where d m p / d t is the rate of evaporation, h f g is the latent heat.
When the droplet temperature reaches the boiling point, that is, T p T b p , the boiling heat transfer equation is applied [15] as
d ( d p ) d t = 4 k ρ p c p , d p ( 1 + 0.23 R e d ) ln [ 1 + c p , ( T T p ) h f g ] ,
where c p , is the heat capacity of the gas.

3. Results and Discussion

3.1. Uniformity Assessment

In the studies, the fluent software was used, and, specifically, the DPM discrete phase model is selected. In order to analyze the uniformity of the spray quantificationally, various indicators in the spray process need to be defined. Traditional uniformity evaluation indicators include atomized droplet size, droplet distribution and spray angle [16], but these indicators can only qualitatively denotes the obtained results with single factors. Therefore, some numerical indicators including average and standard deviation are adopted based on the particle mass concentration that is also called DPM (discrete phase model) concentration.
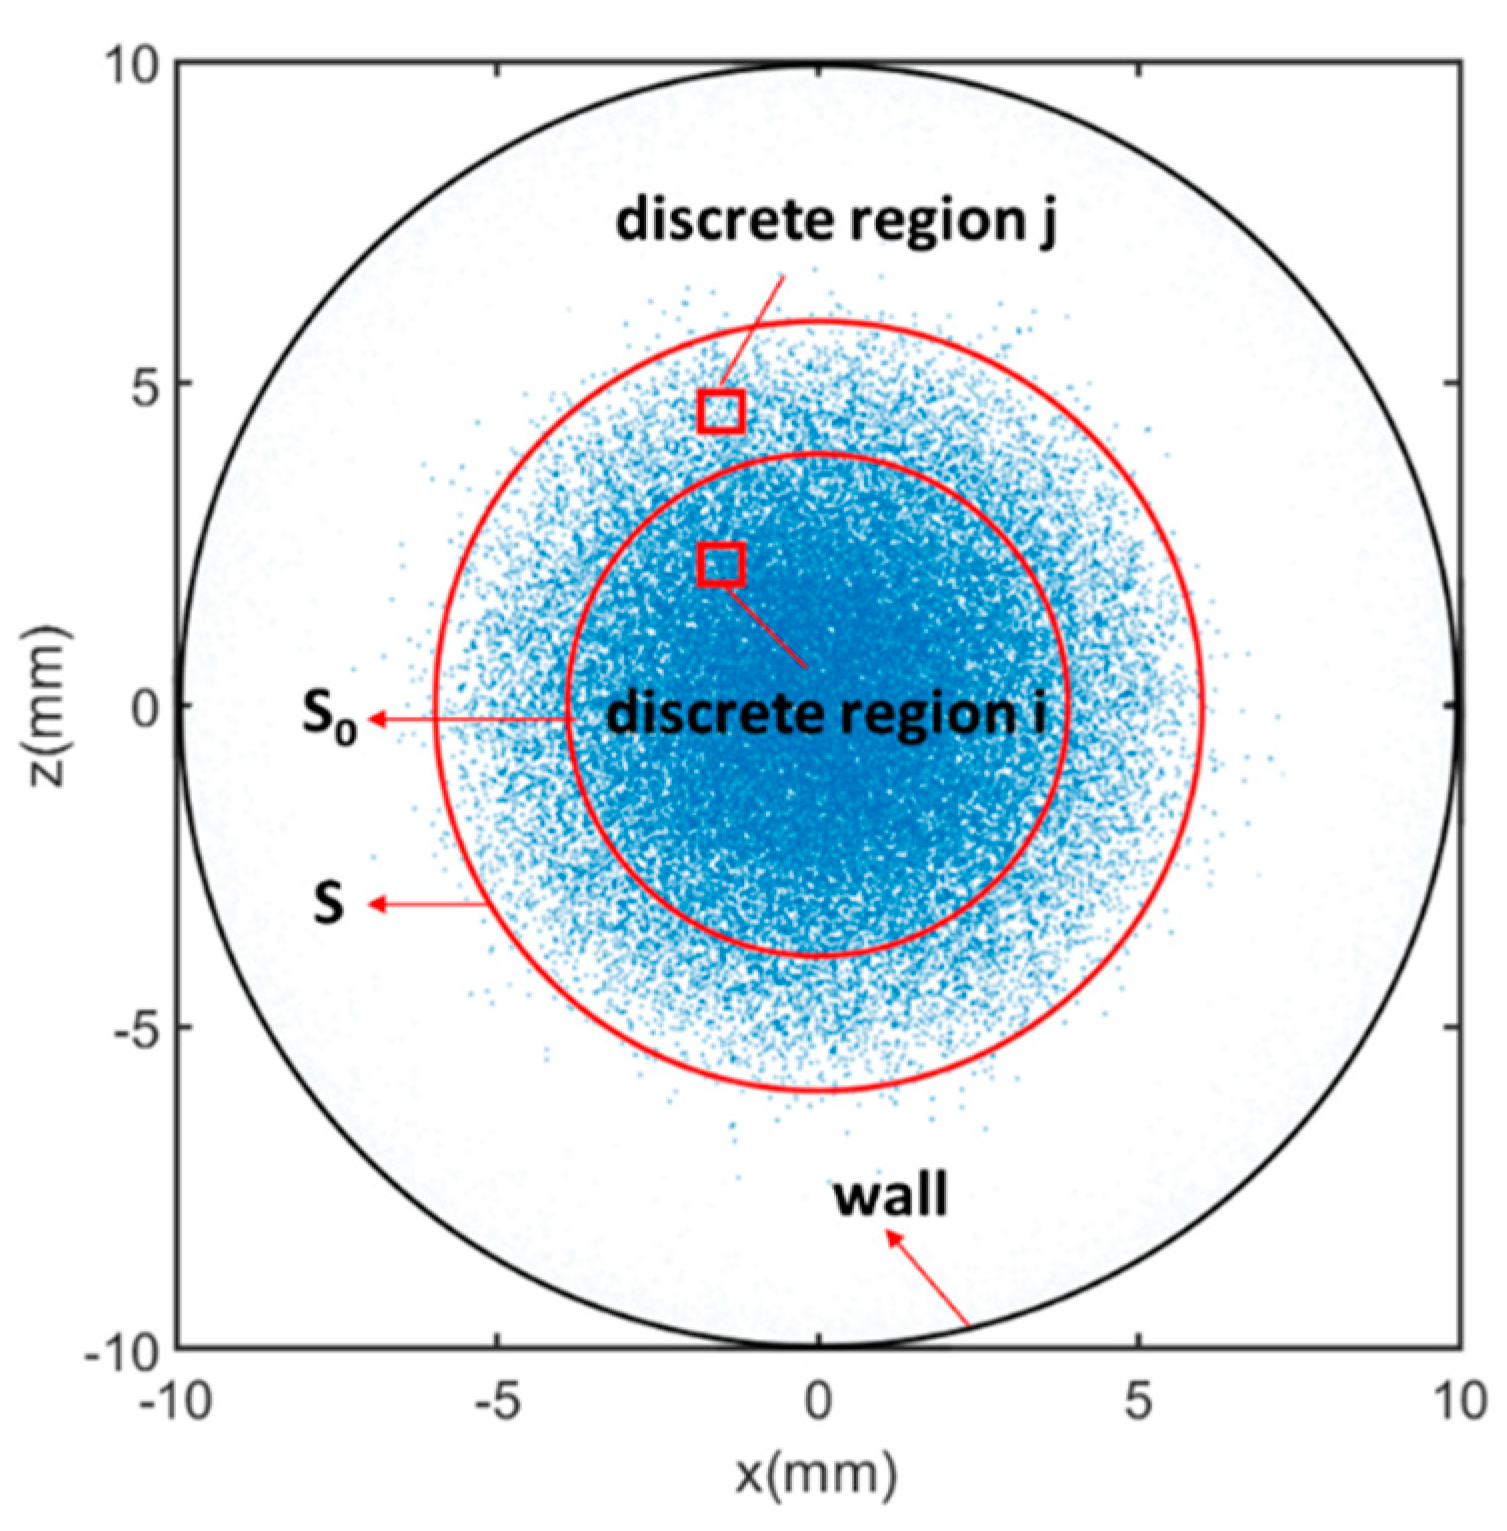
Figure 2 shows the droplet distribution on the substrate at a certain distance. S is the actual deposition area of the atomized droplets while s 0 is the area of the deposited substrate. These two zones are discretized by the grid. The symbols of s i and s j represent the area of the ith and jth location, respectively. In addition, the diameter of the selected circular substrate is 2 mm, so s 0 is a fixed value.
Therefore, the average of DPM concentration can be defined as
ϕ = i = 1 n φ i s i s 0 ,
where φ i is the DPM concentration of ith location. The uniformity is represented by the standard deviation of
S U P = i = 1 n ( φ i ϕ ) 2 s i s 0 ϕ × 100 % .
When the value of this parameter is smaller, the uniformity is higher. In addition, the utilization ratio is defined to indicate the proportion of droplets deposited on the substrate to the total droplets, which is defined as
γ = i = 1 n φ i s i j = 1 n φ j s j × 100 % .
The value is as large as better when ensuring high uniformity in production.

3.2. Effects of Single Factors

The uniformity is affected by various factors, and the degree of influence is different for the factors. In this paper, the initial angle, the flow rate, the gas velocity, and the substrate distance may be the dominant factors. When one of the factors is changed, the other factors remain the same in the following studies.
Figure 3 shows the uniformity and the utilization ratio of the two nozzles under the influence of the four single factors.
For the internal mixing nozzle, the solid curves in Figure 3a shows the uniformity and utilization ratio of different initial angles. With the increase of the angle, the SUP decreases more and more slowly, and reaches the minimum value at 60°, indicating that the uniformity is the highest there. By increasing the initial angle, the distribution of atomized droplets becomes more dispersed, and, hence, improves the uniformity. However, when the droplets are dispersed sufficiently, the effect of increasing the angle on uniformity is not as great as before, so the growth rate of uniformity becomes smaller. The utilization ratio decreases with the increase of the angle and varies approximately linearly. As can be seen from Figure 3b, with the increase of flow rate, the SUP is unchanged at first, then increased and finally decreased. This may be because the change of flow rate has little effect on the distribution of droplets in the current investigated range of the flow rate. The utilization rate decreases with the increase of flow rate and decreases slowly. The effect of different carrier gas velocities on uniformity is shown in Figure 3c. When the speed is 10 m/s and 15 m/s, the SUP is approximately equal. When the velocity increases to 20 m/s, the SUP is reduced without much difference from the value at 25 m/s. It indicates that there may be a certain velocity value in the range of 15~25 m/s to make the uniformity the highest. The utilization rates at different velocities are not much different, ranging from 60% to 70%. Figure 3d presents that the SUP of different substrate distances decreases first and then increases, suggesting that the uniformity is the highest when the distance is 4.0 mm. The utilization rate decreases sharply with increasing distance, so the substrate distance cannot be too large to ensure a certain utilization.
For the external mixing nozzle, Figure 3a shows that the SUP varies at different initial angles, and the uniformity is the highest when the angle is 30°. There is no obvious change law in the dotted curve of the SUP, only fluctuating within a certain range. The utilization rate remains almost unchanged at different initial angles. As the flow rate increases, the SUP decreases first and then increases in Figure 3b, and the uniformity is highest when the flow rate is 1 × 10⁻⁷ kg/s. The change of utilization ratio is opposite to the trend of the SUP dotted curve, first increasing and then decreasing. It is noted that the flow rate at the highest utilization is also 1 × 10⁻⁷ kg/s, which is the closest to the ideal situation for the requirement to guarantee both high uniformity and high utilization. Figure 3c presents that with the increase of velocity, the uniformity fluctuates significantly, while the utilization ratio increases evidently. Therefore, when the uniformity is the highest at a velocity of 20 m/s, the utilization rate is also high. The two dotted curves in Figure 3d have the same trend and are apparently reduced as the distance increases, revealing that the larger the distance, the higher the uniformity and the lower the utilization ratio.

3.3. Orthogonal Experimental Design

The above-mentioned factors, i.e., the initial angle, the flow rate, the gas velocity, and the substrate distance influence the uniformity together. The challenge is how to evaluate the extent of the impact of these factors efficiently. Therefore, the orthogonal test method is adopted, which is based on the orthogonality to select some representative points that are uniformly dispersed from the comprehensive test and is considered as a highly efficient, fast and economical experimental design method [17]. Orthogonal analysis of the influencing factors of the uniformity is given in Table 1. The four factors are denoted by the characters from A to D, while E represents error terms. Therefore, the orthogonal table is selected of L1645, including five factors and four levels, with a total of 16 arranged cases. Table 2 shows the simulation results of the uniformity of the internal mixing nozzle and the external mixing nozzle. Table 3 and Table 4 are the further results calculated from Table 2, in which R represents significance level of the factors, and k1 to k4 represent values of Levels 1 to 4. More specifically, K1 to K5 are the summaries of each level’s values, and k1 to k5 are the averages. According to the orthogonal test theory, the factor of a larger R is more important than other factors. Variations of uniformity for the internal and external mixing nozzle for different factors are presented in Figure 4. Inversely, a smaller SUP represents higher uniformity, and the level with a smaller k is superior to other levels.
For the internal mixing nozzle in Table 3, the order of the influences on the uniformity is A, D, E, C, and B, which means the most influential factor is the initial angle, followed by the substrate distance. Moreover, the optimal combination is A4D3E4C2B3, in which the specific values of each parameter can correspond in Table 1. Among them, the optimal initial angle is 60°, consistent with the result of the single factor analysis, indicating that the initial angle is as large as better within the allowable range. It is because the larger the initial angle, the more dispersed the atomized droplets are, the higher the uniformity is. The optimum substrate distance is 6.0 mm and, the gas velocity is 15 m/s, which are different from the results of the single factor analysis in Section 3.2. This may be caused by a combination of various factors. Besides, the flow rate within the range given in the paper has very little effect on uniformity, which also confirms the analysis in single-factor analysis. As for the external mixing nozzle in Table 4, the order is D, C, B, E, and A, that is, the substrate distance, the gas velocity, the flow rate, and the initial angle. The optimal combination for the highest uniformity is D4C1B1E3A1. From these results, the larger the substrate distance, the better, which is consistent with the single factor analysis result. This may be because, for the external mixing nozzle, the droplets have not completely dispersed within a short distance. Furthermore, if the distance continues to increase, the uniformity is likely to become higher. Besides, the initial angle has the least impact on uniformity, and its optimal value is 15°, which is slightly different from the single factor analysis.

3.4. Effects of Heating Conditions

From the orthogonal test results obtained above, the optimum combination of the internal mixing nozzle and the external mixing nozzle are A4D3E4C2B3 and D4C1B1E3A1, respectively. It is necessary to introduce another dominating factor, heating the droplets, to improve the deposition uniformity. Under the premise of optimal combination, the spray is heated respectively by the top, side and bottom heating wall of the reactor chamber, in order to improve the uniformity by evaporating the atomized droplets. The reactor chamber is at room temperature (293 K) when not heating, and when heating, the boundary conditions of the wall temperature remain 293 K except the heating wall.
During the simulation, the heating temperature is set from 323 K to 623 K with a temperature interval of 50 K. Since the entire reactor chamber is axisymmetric, the temperature distribution of the entire flow field can be characterized by the temperature distribution on the axial section. The temperature distribution of the flow field and the droplets of the two nozzles are given in the following chapters. The results of the SUP are compared with that of unheated conditions to obtain the optimum temperature for maximum uniformity.

3.4.1. Internal Mixing Nozzles

For the internal mixing nozzle, most of the flow field area remains 293 K except for the area near the axis when not heated as shown in Figure 5a. Closing to the center region of the axis, the temperature is lower due to the temperature boundary conditions at the inlet. The temperature distribution of the atomized droplets is similar, that is, the temperature of the droplets on the outside of the spray is 293 K, and the temperature of the droplets toward the center is lower to 276 K.
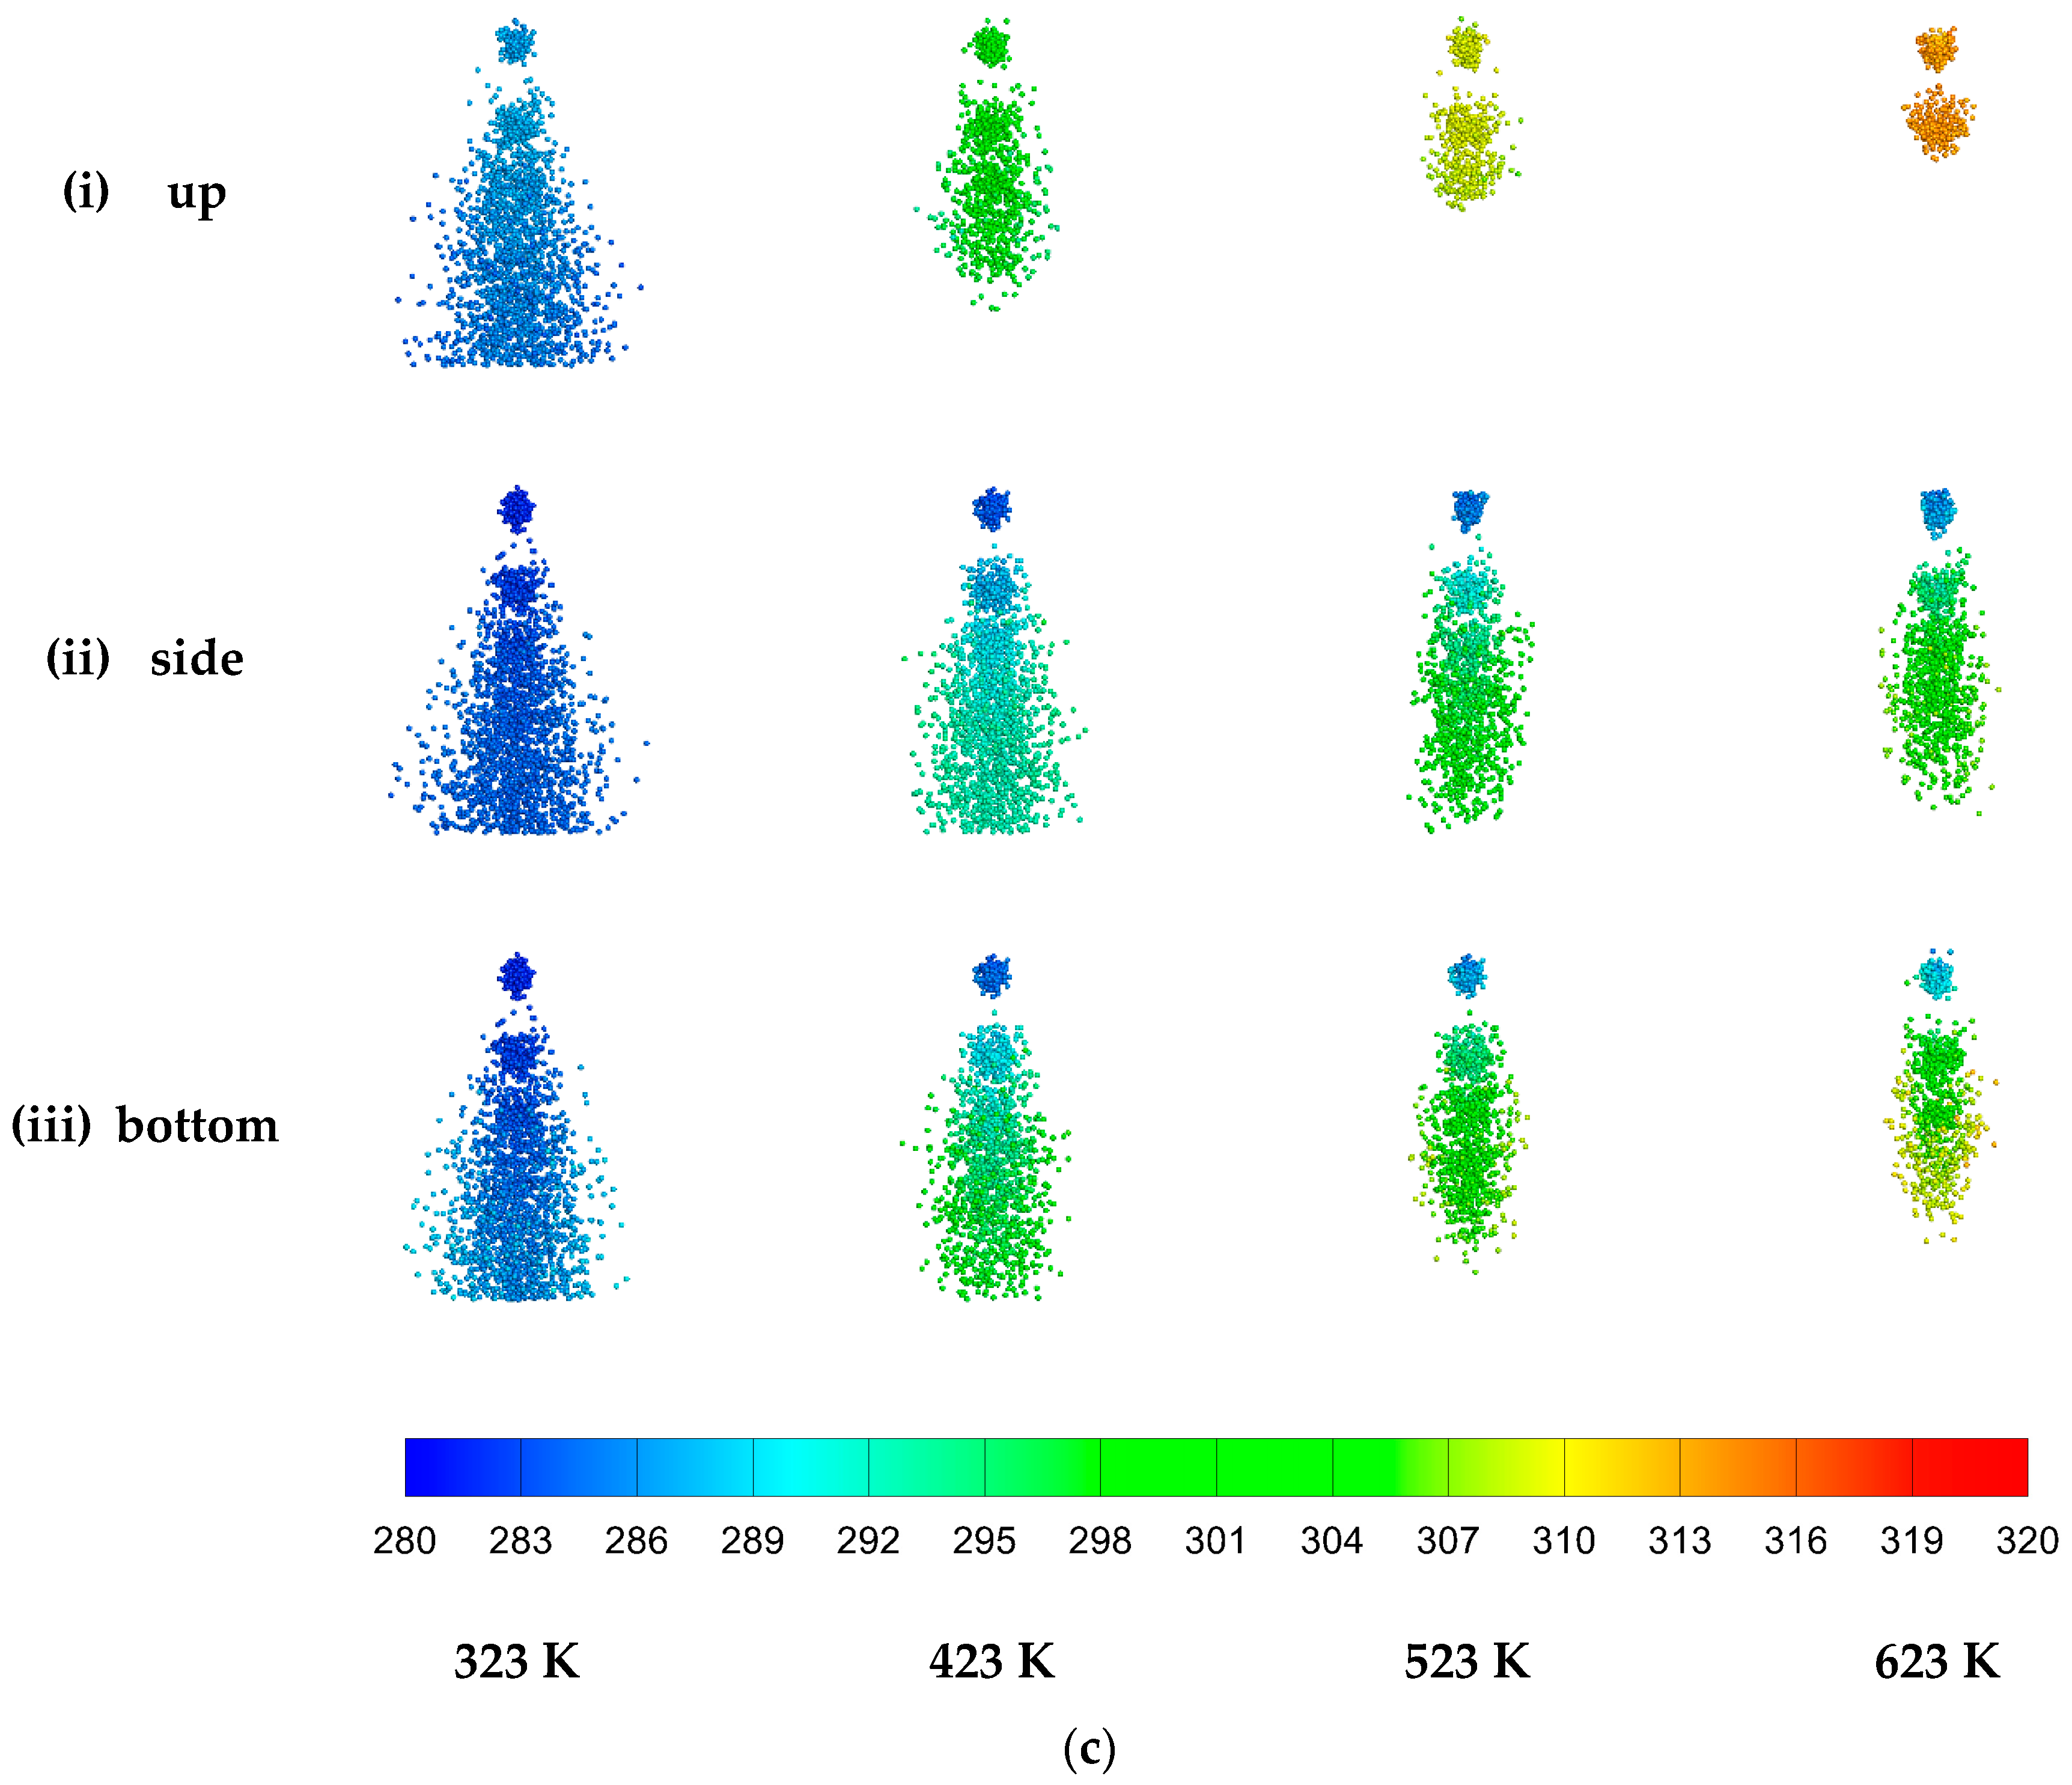
In Figure 5(I) and (i), the temperature of the flow field region decreases from top to bottom under the condition of top heating. The temperature gradient becomes smaller as the temperature goes down. After the middle of the flow field, the temperature hardly changes and reaches the minimum at the bottom wall. The corresponding droplet temperature distribution also exhibits a similar pattern, that is, the temperature of the atomized droplets near the top heating wall is the highest, and the temperature from the middle to the bottom of the reactor chamber is not much different. As the heating temperature increases, the temperature distribution in the upper part of the flow field changes little. The main change is that the temperature near the lower half of the axis gradually increases, and the area gradually expands. The temperature of droplets is higher around the top wall. As the heating temperature increases, the proportion of particles with higher temperatures is larger. This indicates that although the atomized droplets are thermally evaporated near the nozzle spout, as the carrier gas transporting, the temperature of droplets will rapidly decrease until it is close to the ambient temperature. Therefore, the effect of top heating on uniformity is primarily dependent on the initial state of the droplet at the inlet.
Figure 5(II) and (ii) show that when the spray is heated by the side heating wall. The temperature near the heating wall and of the upper half of the simulated zone is drastically increased due to the heating. The droplets evaporate along the spraying path, which causes the lower temperature along the axis of the simulated zone. As the temperature increases, the temperature of the flow field changes significantly, especially near the bottom surface. The patterns of the droplet temperature distributions are similar for the heating temperatures. The spray temperature is gradually reduced from the outside to the inside. In addition, the higher the temperature, the more the droplets evaporated, and the smaller the number of droplets in the flow field.
When the heating surface is the bottom wall as shown in Figure 5(III) and (iii), the bottom temperature is the highest, and the temperature at the top wall is the lowest. It is worth noting that since the central portion is the region where the droplets exist, the temperature near the axis is also lower due to droplet evaporation. The overall distribution of atomized droplets is different from that of the two heating conditions mentioned above. In the lower zone, the distribution of the droplets is close to the cylinder shape, rather than the circular table shape as above-mentioned cases. This is because some of the outer layer droplets in this region are evaporated completely, while the droplets concentrated near the axis cannot be evaporated entirely. It can be inferred that the bottom heating can significantly change the droplet distribution, thereby changing the uniformity of droplet distribution during the spray deposition.
In order to study the effects of different heating temperatures further, Table 5 shows the uniformity of SUP at the heating conditions from the top, side and bottom walls. The trend with temperature is shown in Figure 6. The conclusion can be made that the optimum temperature for heating at the top, side and bottom surface are 373 K, 473 K and 323 K, respectively.

3.4.2. External Mixing Nozzles

In Figure 7a, for the external mixing nozzle, since the speed and flow rate is small, the temperature variation of the entire flow field is only about 2 K, which can be considered substantially as constant. The temperature distributions of the droplets have not much difference either.
Figure 7(I) and (i) show the temperature distribution of the flow field and droplets at different heating temperatures of the top heating wall. The upper part of the flow field has a lower temperature from the top wall to the bottom wall, and the central area near the lower half of the axis is higher than that of the outer part with the lowest temperature. The temperature at the spout of the nozzle is the highest. The closer to the bottom wall, the lower the temperature. When the heating temperature increases, the evaporation rate becomes larger. Since the flow rate is small, the atomized droplets are completely evaporated before arriving at the bottom wall outlet.
When the spray is heated by the side heating wall, the temperature distribution in the flow field is similar to that of the internal mixing nozzle, given in Figure 7(II) and (ii). The temperature of the sidewall is the highest, while the temperature at the top wall, the spout, and the outer ring of the bottom wall are the lowest. Because it is heated all around, the droplets on the outside of the spray are first evaporated, and the range of spray has become shorter.
In Figure 7(III) and (iii), the temperature distribution in the flow field resembles that of the internal mixing nozzle for the different heating temperatures of the bottom wall. It is worth noting that if the droplets are completely evaporated before moving to the outlet at certain heating temperature, the different heating positions will cause the different farthest moving distance of the droplets. The distance is the largest under the condition of side heating, followed by the bottom heating and finally top heating.
Table 6 shows the uniformity of SUP at the heating conditions and Figure 8 shows the temperature trend. In Figure 8, the top heating curve is in a state of fluctuation, which refers that there is no obvious regularity between the uniformity and the temperature. The SUP in Table 5 is the smallest at 323 K with the highest uniformity. When the spray is heated around, with the increase of the temperature, the SUP decreases first and then increases, and the highest uniformity is at 423 K. After the temperature reaches 523 K, the SUP fluctuates within a small range. When the spray is heated by the bottom wall, the uniformity is lower than when it is not heated, and the curve rises sharply after the temperature reaches 423 K. It is worth noting that the SUP is null when the temperature is 623 K. This is because the liquid flow rate is too small under the optimal combination of the external mixing nozzle. If the temperature is too high, meaning the high evaporation rate, the droplets will be completely evaporated before reaching the outlet, resulting in the absence of SUP value at a certain substrate distance. Furthermore, the conclusion can be made that the optimum temperature for heating at the top, side, and bottom surfaces are 323 K, 423 K, and 323 K, respectively.
Therefore, no matter the internal mixing nozzle or the external mixing nozzle, the temperature with the highest uniformity is different for the three heating conditions. In most instances, the uniformity can be improved by increasing the temperature appropriately. However, when the temperature is too high, the uniformity may fluctuate or drop sharply due to the excessive temperature that causes the large evaporation rate, which should be avoided in practice. Besides, the temperature interval in the study is as large as 50 K.

4. Conclusions

In this paper, based on computational fluid dynamics (CFD) theory, the effects of different factors on the uniformity of two types of nozzles, the internal mixing nozzle, and the external mixing nozzle, have been well studied. The influencing factors include the initial angle, the total liquid flow rate, the transporting gas velocity and the distance from the spout to the substrate. Every single factor is studied before the orthogonal experiment is carried out to obtain the optimal combination with the highest uniformity. Additionally, the spray is heated at different modes based on the optimal combination to improve the uniformity further. The conclusions can be made as follows. Through the orthogonal test, for the internal mixing nozzle, the impact sequence of the influencing factors for the uniformity is A > D > E > C > B, and for the external mixing nozzle, the order is D > C > B > E > A. Furthermore, heating the spray based on the optimum combination can appropriately improve the uniformity, but the uniformity would be greatly reduced when the temperature is too high. For the two nozzles, the optimum temperature varies under different heating conditions. Specifically, the optimum temperature for heating at the top, side and bottom surface are 373 K, 473 K and 323 K for the internal nozzle, and those for the external nozzle are 323 K, 423 K, and 323 K. For the actual production, since uniformity is usually controversial, the strategy is to maintain uniformity at the required level with maximum utilization through the controlling factors. The study in this paper systematically evaluates the effects of parameters on the spray as a theoretical direction for this purpose.

Author Contributions

X.D. and H.F. conceived the idea. X.D. and X.P. performed numerical simulations. X.D. and X.G. analyzed the data. X.D. wrote the article. H.F. revised the paper. All authors have read and agreed to the published version of the manuscript.

Funding

This work is supported by the National Key Research and Development Program of China (2018YFA0703200) and the National Natural Science Foundation of China (No. 51876071).

Conflicts of Interest

The authors declare no conflict of interest.

Nomenclature

ρ density (kg/m3) T v a p vaporization temperature (K)
t time (s) m p mass of the particle (kg)
v overall velocity vector (m/s) c p heat capacity of the particle (J/kg·K)
S m mass source added to the continuous phase (kg/m3·s) A p surface area of the particle (m2)
p static pressure (Pa) T local temperature of continuous phase (K)
τ = stress tensor (Pa) h convective heat transfer coefficient (W/m2·K)
ρ g gravitational body force (N) ε p particle emissivity
F external body forces (N) σ Stefan-Boltzmann constant (5.67 × 10⁻⁸ W/m2·K4)
μ molecular viscosity (Pa·s) θ R radiation temperature (K)
I unit tensor k thermal conductivity of the continuous phase (W/m·K)
u p velocity of the droplet (m/s) P r Prandtl number of the continuous phase
u g velocity of the gas fluid phase (m/s) T b p boiling point (K)
g x acceleration of gravity (m/s2) h f g latent heat (J/kg)
ρ p skeletal density of the droplet (kg/m3) c p , heat capacity of the gas (J/kg/K)
F x additional force (N) ϕ average DPM concentration (kg/m2)
d p diameter of the droplet particles (m) φ i DPM concentration of ith location (kg/m2)
R e d relative Reynolds number S actual deposition area (m2)
C D drag coefficient s 0 area of the deposited substrate (m2)
T p the particle temperature (K) s i area of the ith location (m2)

References

  1. Klauk, H. Organic thin-film transistors. Chem. Soc. Rev. 2010, 39, 2643. [Google Scholar] [CrossRef] [PubMed]
  2. Jurchescu, O.D. Large-Area Organic Electronics: Inkjet Printing and Spray Coating Techniques. In Organic Electronics; Cicoira, F., Santato, C., Eds.; Wiley-VCH Verlag GmbH & Co. KGaA: Weinheim, Germany, 2013; pp. 319–339. ISBN 978-3-527-65096-5. [Google Scholar]
  3. Ishikawa, T.; Nakamura, M.; Fujita, K.; Tsutsui, T. Preparation of organic bulk heterojunction photovoltaic cells by evaporative spray deposition from ultradilute solution. Appl. Phys. Lett. 2004, 84, 2424–2426. [Google Scholar] [CrossRef]
  4. Vak, D.; Kim, S.-S.; Jo, J.; Oh, S.-H.; Na, S.-I.; Kim, J.; Kim, D.-Y. Fabrication of organic bulk heterojunction solar cells by a spray deposition method for low-cost power generation. Appl. Phys. Lett. 2007, 91, 081102. [Google Scholar] [CrossRef]
  5. Green, R.; Morfa, A.; Ferguson, A.J.; Kopidakis, N.; Rumbles, G.; Shaheen, S.E. Performance of bulk heterojunction photovoltaic devices prepared by airbrush spray deposition. Appl. Phys. Lett. 2008, 92, 033301. [Google Scholar] [CrossRef]
  6. Bernardin, G.A.; Davies, N.A.; Finlayson, C.E. Spray-coating deposition techniques for polymeric semiconductor blends. Mater. Sci. Semicond. Process. 2017, 71, 174–180. [Google Scholar] [CrossRef] [Green Version]
  7. Girotto, C.; Rand, B.P.; Steudel, S.; Genoe, J.; Heremans, P. Nanoparticle-based, spray-coated silver top contacts for efficient polymer solar cells. Organ. Electron. 2009, 10, 735–740. [Google Scholar] [CrossRef]
  8. Azarova, N.A.; Owen, J.W.; McLellan, C.A.; Grimminger, M.A.; Chapman, E.K.; Anthony, J.E.; Jurchescu, O.D. Fabrication of organic thin-film transistors by spray-deposition for low-cost, large-area electronics. Organ. Electron. 2010, 11, 1960–1965. [Google Scholar] [CrossRef]
  9. Chan, C.K.; Richter, L.J.; Dinardo, B.; Jaye, C.; Conrad, B.R.; Ro, H.W.; Germack, D.S.; Fischer, D.A.; DeLongchamp, D.M.; Gundlach, D.J. High performance airbrushed organic thin film transistors. Appl. Phys. Lett. 2010, 96, 133304. [Google Scholar] [CrossRef]
  10. Owen, J.W.; Azarova, N.A.; Loth, M.A.; Paradinas, M.; Coll, M.; Ocal, C.; Anthony, J.E.; Jurchescu, O.D. Effect of Processing Parameters on Performance of Spray-Deposited Organic Thin-Film Transistors. J. Nanotechnol. 2011, 1–6. [Google Scholar] [CrossRef] [Green Version]
  11. Rigas, G.-P.; Payne, M.M.; Anthony, J.E.; Horton, P.N.; Castro, F.A.; Shkunov, M. Spray printing of organic semiconducting single crystals. Nat. Commun. 2016, 7, 13531. [Google Scholar] [CrossRef] [PubMed] [Green Version]
  12. Batchelor, C.K.; Batchelor, G.K. An Introduction to Fluid Dynamics; Cambridge University Press: Cambridge, UK, 1967. [Google Scholar]
  13. Gosman, A.D.; Loannides, E. Aspects of Computer Simulation of Liquid-Fueled Combustors. J. Energy 1983, 7, 482–490. [Google Scholar] [CrossRef]
  14. Ranz, W.; Marshall, W.R. Evaporation from drops. Chem. Eng. Prog. 1952, 48, 141–146. [Google Scholar]
  15. Kuo, K.K. Principles of Combustion; Wiley-Interscience: New York, NY, USA, 1988. [Google Scholar]
  16. Nuyttens, D.; Baetens, K.; De Schampheleire, M.; Sonck, B. Effect of nozzle type, size and pressure on spray droplet characteristics. Biosyst. Eng. 2007, 97, 333–345. [Google Scholar] [CrossRef]
  17. Berger, P.D.; Maurer, R.E.; Celli, G.B. Orthogonality, Orthogonal Decomposition, and Their Role in Modern Experimental Design. In Experimental Design; Springer International Publishing: Cham, Switzerland, 2018; pp. 155–179. ISBN 978-3-319-64582-7. [Google Scholar]
Figure 1. (a) shows the cylindrical regional grids and (b) shows the structure of the two mixing nozzles.
Coatings 10 00081 g001
Figure 2. The particle distribution on one of the deposition surfaces at a certain substrate distance.
Coatings 10 00081 g002
Figure 3. The uniformity and the utilization ratio of the two nozzles under the influence of (a) initial angle, (b) flow rate, (c) gas velocity and (d) substrate distance. The solid line represents the variable of the internal mixing nozzle, while the dotted line represents the variable of the external mixing nozzle.
Coatings 10 00081 g003
Figure 4. Profiles of uniformity of two nozzles for different factors.
Coatings 10 00081 g004
Figure 5. The temperature distribution of the flow field and droplets at different heating temperatures of the internal mixing nozzle. (a) shows the temperature distribution of the flow field and droplets without heating. (b) shows the temperature distribution of the flow field under different heating surfaces and (c) represents the temperature distribution of the droplets under different heating surfaces.
Coatings 10 00081 g005aCoatings 10 00081 g005b
Figure 6. Uniformity of different heating temperatures of internal mixing nozzles at different heating modes.
Coatings 10 00081 g006
Figure 7. The temperature distribution of the flow field and droplets at different heating temperatures of the external mixing nozzle. (a) shows the temperature distribution of the flow field and droplets without heating. (b) shows the temperature distribution of the flow field under different heating surfaces and (c) represents the temperature distribution of the droplets under different heating surfaces.
Coatings 10 00081 g007aCoatings 10 00081 g007b
Figure 8. Uniformity of different heating temperatures of the external mixing nozzles at different heating modes.
Coatings 10 00081 g008
Table 1. Influencing factors of the uniformity for an orthogonal analysis.
FactorsLevelsUnit
1234
A, Initial angle15304560°
B, Flow rate 1 × 10−85 × 10−81 × 10−75 × 10−7kg/s
C, Gas velocity10152025m/s
D, Substrate distance2.04.06.08.0mm
Table 2. Orthogonal table of L1645, and the simulation results of two types of mixing nozzles.
CaseABCDESUP of Different Mixing Nozzles
InternalExternal
1111123.22763.7342
2122341.16101.6961
3133212.08142.7416
4144431.81271.9235
5213331.21851.8031
6224112.60914.8399
7231440.90091.5205
8242221.04242.8867
9312411.09241.3503
10321231.08071.9559
11334321.20412.2941
12343141.63516.2980
13414240.69753.0473
14423420.99101.6768
15432130.89184.5730
16441310.86691.7176
Table 3. Analysis of the results using range method for the uniformity of internal mixing nozzle.
ParametersABCDE
K18.28276.23596.07608.36366.6498
K25.77085.84184.18774.90196.4650
K35.01235.07815.92604.45055.0037
K43.44725.35716.32334.79704.3945
k12.07071.55901.51902.09091.6624
k21.44271.46041.04691.22551.6163
k31.25311.26951.48151.11261.2509
k40.86181.33931.58081.19921.0986
R1.20890.28940.53390.97830.5638
OrderA > D > E > C > B
Optimal combinationA4D3E4C2B3
Table 4. Analysis of the results using range method for the uniformity of external mixing nozzle.
ParametersABCDE
K110.09549.93508.928219.445010.6493
K211.050210.168710.506010.631610.5918
K311.898311.129112.51967.510910.2555
K411.014712.825812.10486.471112.5619
k12.52382.48372.23214.86132.6623
k22.76252.54222.62652.65792.6480
k32.97462.78233.12991.87772.5639
k42.75373.20653.02621.61783.1405
R0.45070.72270.89783.24350.5766
OrderD > C > B > E > A
Optimal combinationD4C1B1E3A1
Table 5. Uniformity of the three heating positions at the different heating temperatures.
SUPUnheatedHeating Temperature
Heating surface293 K323 K373 K423 K473 K523 K573 K623 K
Top0.83160.72040.67580.72750.75710.90490.88070.9970
Side0.72370.73370.71620.69090.87690.81370.9252
Bottom0.70310.80040.81480.81310.83890.97980.9376
Table 6. The uniformity of the three heating positions at the different heating temperature.
SUPUnheatedHeating Temperature
Heating surface293 K323 K373 K423 K473 K523 K573 K623 K
Top1.33621.26641.26911.61011.41521.65531.40091.8180
Side1.25491.19881.19701.42091.78731.64911.7776
Bottom1.32491.60061.40962.00653.247812.874null