Article

Flexible P(VDF-TrFE) Shared Bottom Electrode Sensor Array Assisted with Machine Learning for Motion Detection

1
National Key Laboratory of Science and Technology on Micro/Nano Fabrication, Department of Micro/Nano Electronics, Shanghai Jiao Tong University, Shanghai 200240, China
2
College of Computer, Hubei University of Education, Wuhan 430205, China
*
Author to whom correspondence should be addressed.
Coatings 2020, 10(11), 1094; https://doi.org/10.3390/coatings10111094
Submission received: 25 October 2020 / Revised: 13 November 2020 / Accepted: 13 November 2020 / Published: 15 November 2020
(This article belongs to the Section Functional Polymer Coatings and Films)

Abstract

:
Lightweight, flexible and distributed-pixel piezoelectric sensors are desired in activity monitoring and human–machine interaction (HMI). In this work, a flexible P(VDF-TrFE) piezoelectric sensor array using ITO-coated PET substrate as the shared bottom electrode is demonstrated. The traditional array fabrication, which connects an individual sensor unit into an array, could easily lead to the signal discrepancy due to fabrication and assembly errors. To this end, this work introduces the shared ITO-coated-PET substrate and proposes a synchronous-fabrication method for generating the same thickness of every P(VDF-TrFE) sensor unit through a single spin coating. The designed Au top electrodes were sputtered on the spin-coated P(VDF-TrFE) to form the sensor array at one time without additional assembly step, further ensuring unit consistency. The performance of the cross-shaped sensor array was tested under cyclic compressing–releasing agitation. The results of the positive compression test show that our sensor array has a high consistency. Then, the cross-shaped array design that covers the central position is put forward, which realizes tactile sensing ability with a small number of units. Moreover, the fabricated flexible multi-pixel sensor has the advantage of sensitive identification of different contact scenes, and a recognition accuracy of 95.5% can be obtained in different types of hand touch through the machine learning technology.

1. Introduction

Nowadays, with the Internet-of-Things (IoT) and human–machine interaction (HMI) occupying an increasingly important position in our lives, smart sensors are playing an increasingly essential role in the fields of medical care, sports training and home entertainment. Typically, a user inputs a signal through a tactile sensing device, and the device senses and provides feedback on specific tactile signals produced by the user. An electrogram, as a biological signal type, has been widely explored by researchers [1,2,3]. Electrogram electrodes can recognize users’ gestures and even detect users’ intentions by collecting electroencephalogram. However, human mechanical signals have a higher signal-to-noise ratio than their electronic biological signals, and pressure sensors have lower cost and higher dynamic detection range [4,5]. Therefore, the pressure sensor is a potential candidate for intelligent tactile sensing applications.
In terms of pressure sensors, there are usually three working mechanisms: piezoresistive, capacitive and piezoelectric [6,7,8,9]. Based on the piezoresistive effect, a resistive pressure sensor is more suitable for detecting static force. Capacitive and piezoelectric pressure sensors have faster response speed and are suitable for high-frequency dynamic response tests. Among them, capacitive and piezoresistive sensors usually require an external power supply during testing, which will undoubtedly increase the complexity of the test system. Piezoelectric sensors based on a piezoelectric effect can not only generate piezoelectric signals without additional power supply, but also have the advantages of wide dynamic response range, high sensitivity, and low signal crosstalk, etc. [10,11,12]
The piezoelectric materials used in piezoelectric sensors reported earlier are almost all brittle piezoelectric materials, such as PZT [13,14,15], PMN-PT [16,17], ZnO [18,19], etc., which exhibit excellent piezoelectric properties. However, tactile sensors need to be flexible enough to adapt to curved structures or soft objects, so as to avoid damage or contact blind spots when subjected to large deformation. In order to improve the flexibility of pressure sensors, some researchers combine piezoelectric bulks with high piezoelectric coefficient as an active layer with a flexible substrate [20,21], or incorporate piezoelectric ceramic particles into polymer materials [22,23,24]. However, due to the great difference in Young’s modulus between piezoelectric materials and matrix materials, the reliability of devices are reduced, and the above methods also have the disadvantage of complicated process. Among piezoelectric materials, polyvinylidene fluoride (PVDF) and its copolymers have good piezoelectricity and flexibility and are easy to be fabricated [25,26,27]. Therefore, they are regarded as candidate materials in the field of flexible tactile sensors. Since Dario et al. prepared the first PVDF piezoelectric sensor for tactile sensing [28], PVDF tactile sensor has performed well in the fields of robot hand [29,30], medical health [31,32] and bionics [33,34] in recent years.
Compared to the single piezoelectric sensor with low recognition rate, a multi-pixel array design is introduced to improve the recognition accuracy and obtain information such as the strength and distribution of contact force in different tactile scenes. Deng et al. fabricated a PVDF sensor array to collect pressure signals and display the pressure distribution of the sole in real-time during walking through a data acquisition and display system [35]. Chen et al. manufactured a flexible 12 × 12 array of P(VDF-TrFE) tactile sensors, which was connected to a signal processing circuit to monitor the magnitude and distribution of real-time dynamic force on the contact surface [36]. Although this kind of tactile sensor array can sensitively detect the piezoelectric signal of each pixel unit, the extra alignments of electrodes and wires increase the complexity of the fabrication process and system.
The analysis of sensing signals of most tactile sensors is usually based on the amplitude and frequency of signals [37,38]. This preliminary analysis method is suitable for detecting the distribution of real-time dynamic forces and signals with apparent distinctions, but it is not capable of differentiating tactile signals with ambiguous features with unobvious distinguishing features. For this, the introducing of machine learning assisting the sensor has been a research hotspot in recent years [39,40,41]. For complicated signals, machine learning can replace the intuition-based analysis for judgment and recognition. Based on the acquisition of triboelectric signals and combined with the convolution neural network (CNN) model, Shi et al. defined the electrode pattern by screen printing technology, and fabricated a flexible smart floor mat that can monitor stepping position and activity status [42]. However, there are few studies on combining piezoelectric polymer sensor arrays with machine learning, especially on the design of using a shared bottom electrode and a shared piezoelectric layer. Therefore, it is necessary to manufacture a tactile sensor with a simple process, yet retaining high reliability and high recognition accuracy.
The traditional array is fabricated to connect separate sensor units into an array [43,44,45], which could easily lead to unit inconsistency due to fabrication and assembly errors. Tian et al. fabricated a sensor array in which the sensitivity of the highest unit was 2.4 times that of the lowest one [20]. The inconsistency is a barrier to recognition due to the fact that accurate recognition is based on the pressure distribution, not the voltage distribution. The voltage distribution in the sensor array should be equally converted to the pressure distribution. Otherwise, different sensor units produce different voltages even when they are under the same force, which will lead to the recognition accuracy in real use being extremely low.
In this paper, we have solved the problems of complex wiring operation of top and bottom electrodes and the non-uniformities between devices and flexible substrates during sensor array fabrication by proposing a sensor array manufacturing method with simple process steps. ITO-coated PET is used as the substrate and bottom electrode shared by all sensor units. The top electrodes and wires directly connected to each sensor are patterned by gold sputtering with a hard mask, and the thin copper wires are led out through the gold wires sputtered on the edge of the device surface. This method can ensure the flatness and reliability of the device. The cross-shaped sensor distribution design enables the sensor array to realize sensitive tactile sensing. In addition, we have solved the problem that simple logical judgments are difficult to identify complex signals by introducing a machine learning model to identify more complex contact scenes, i.e., fingers, palm and wrist tapping, which proves the feasibility of tactile monitoring function of the cross-shaped sensor array.

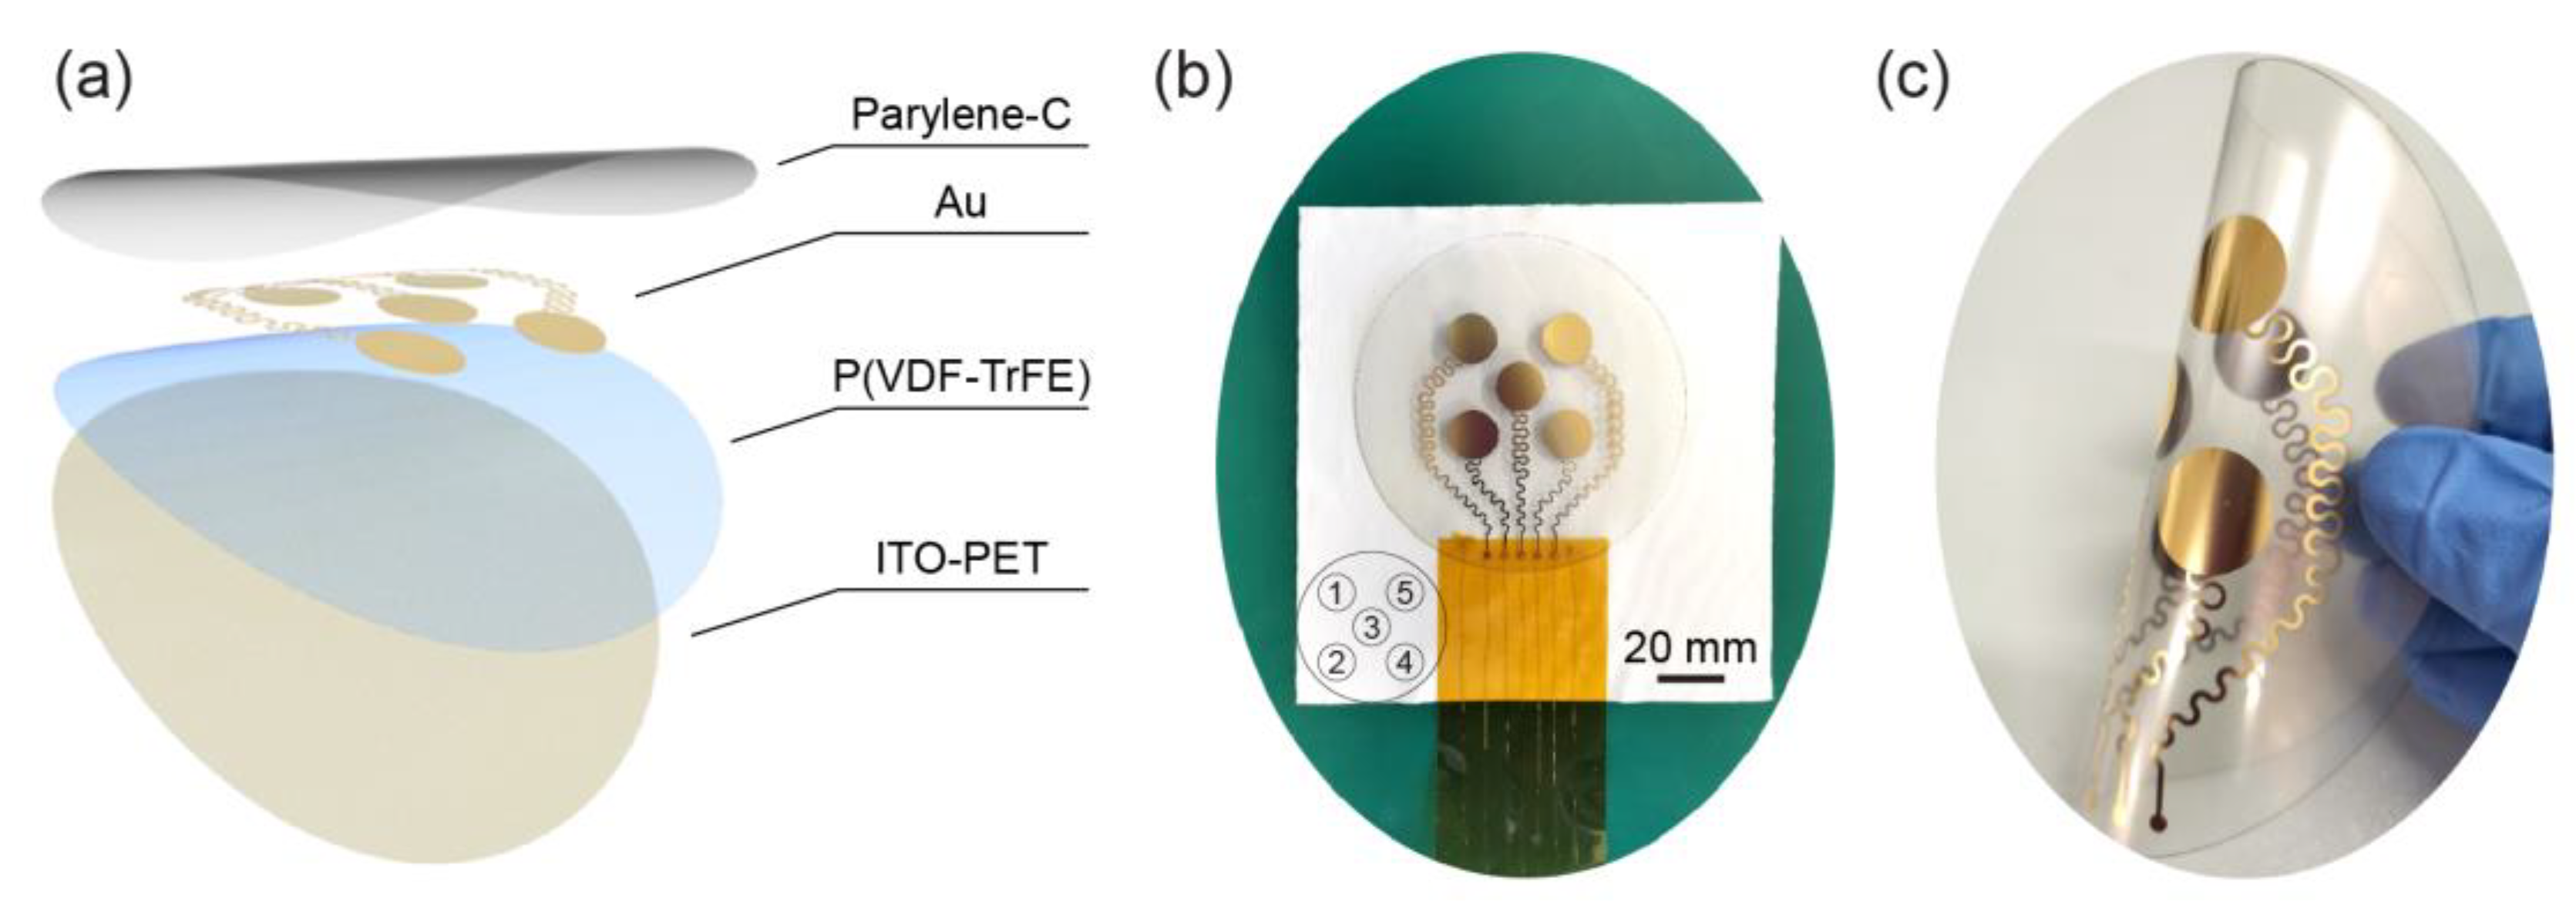
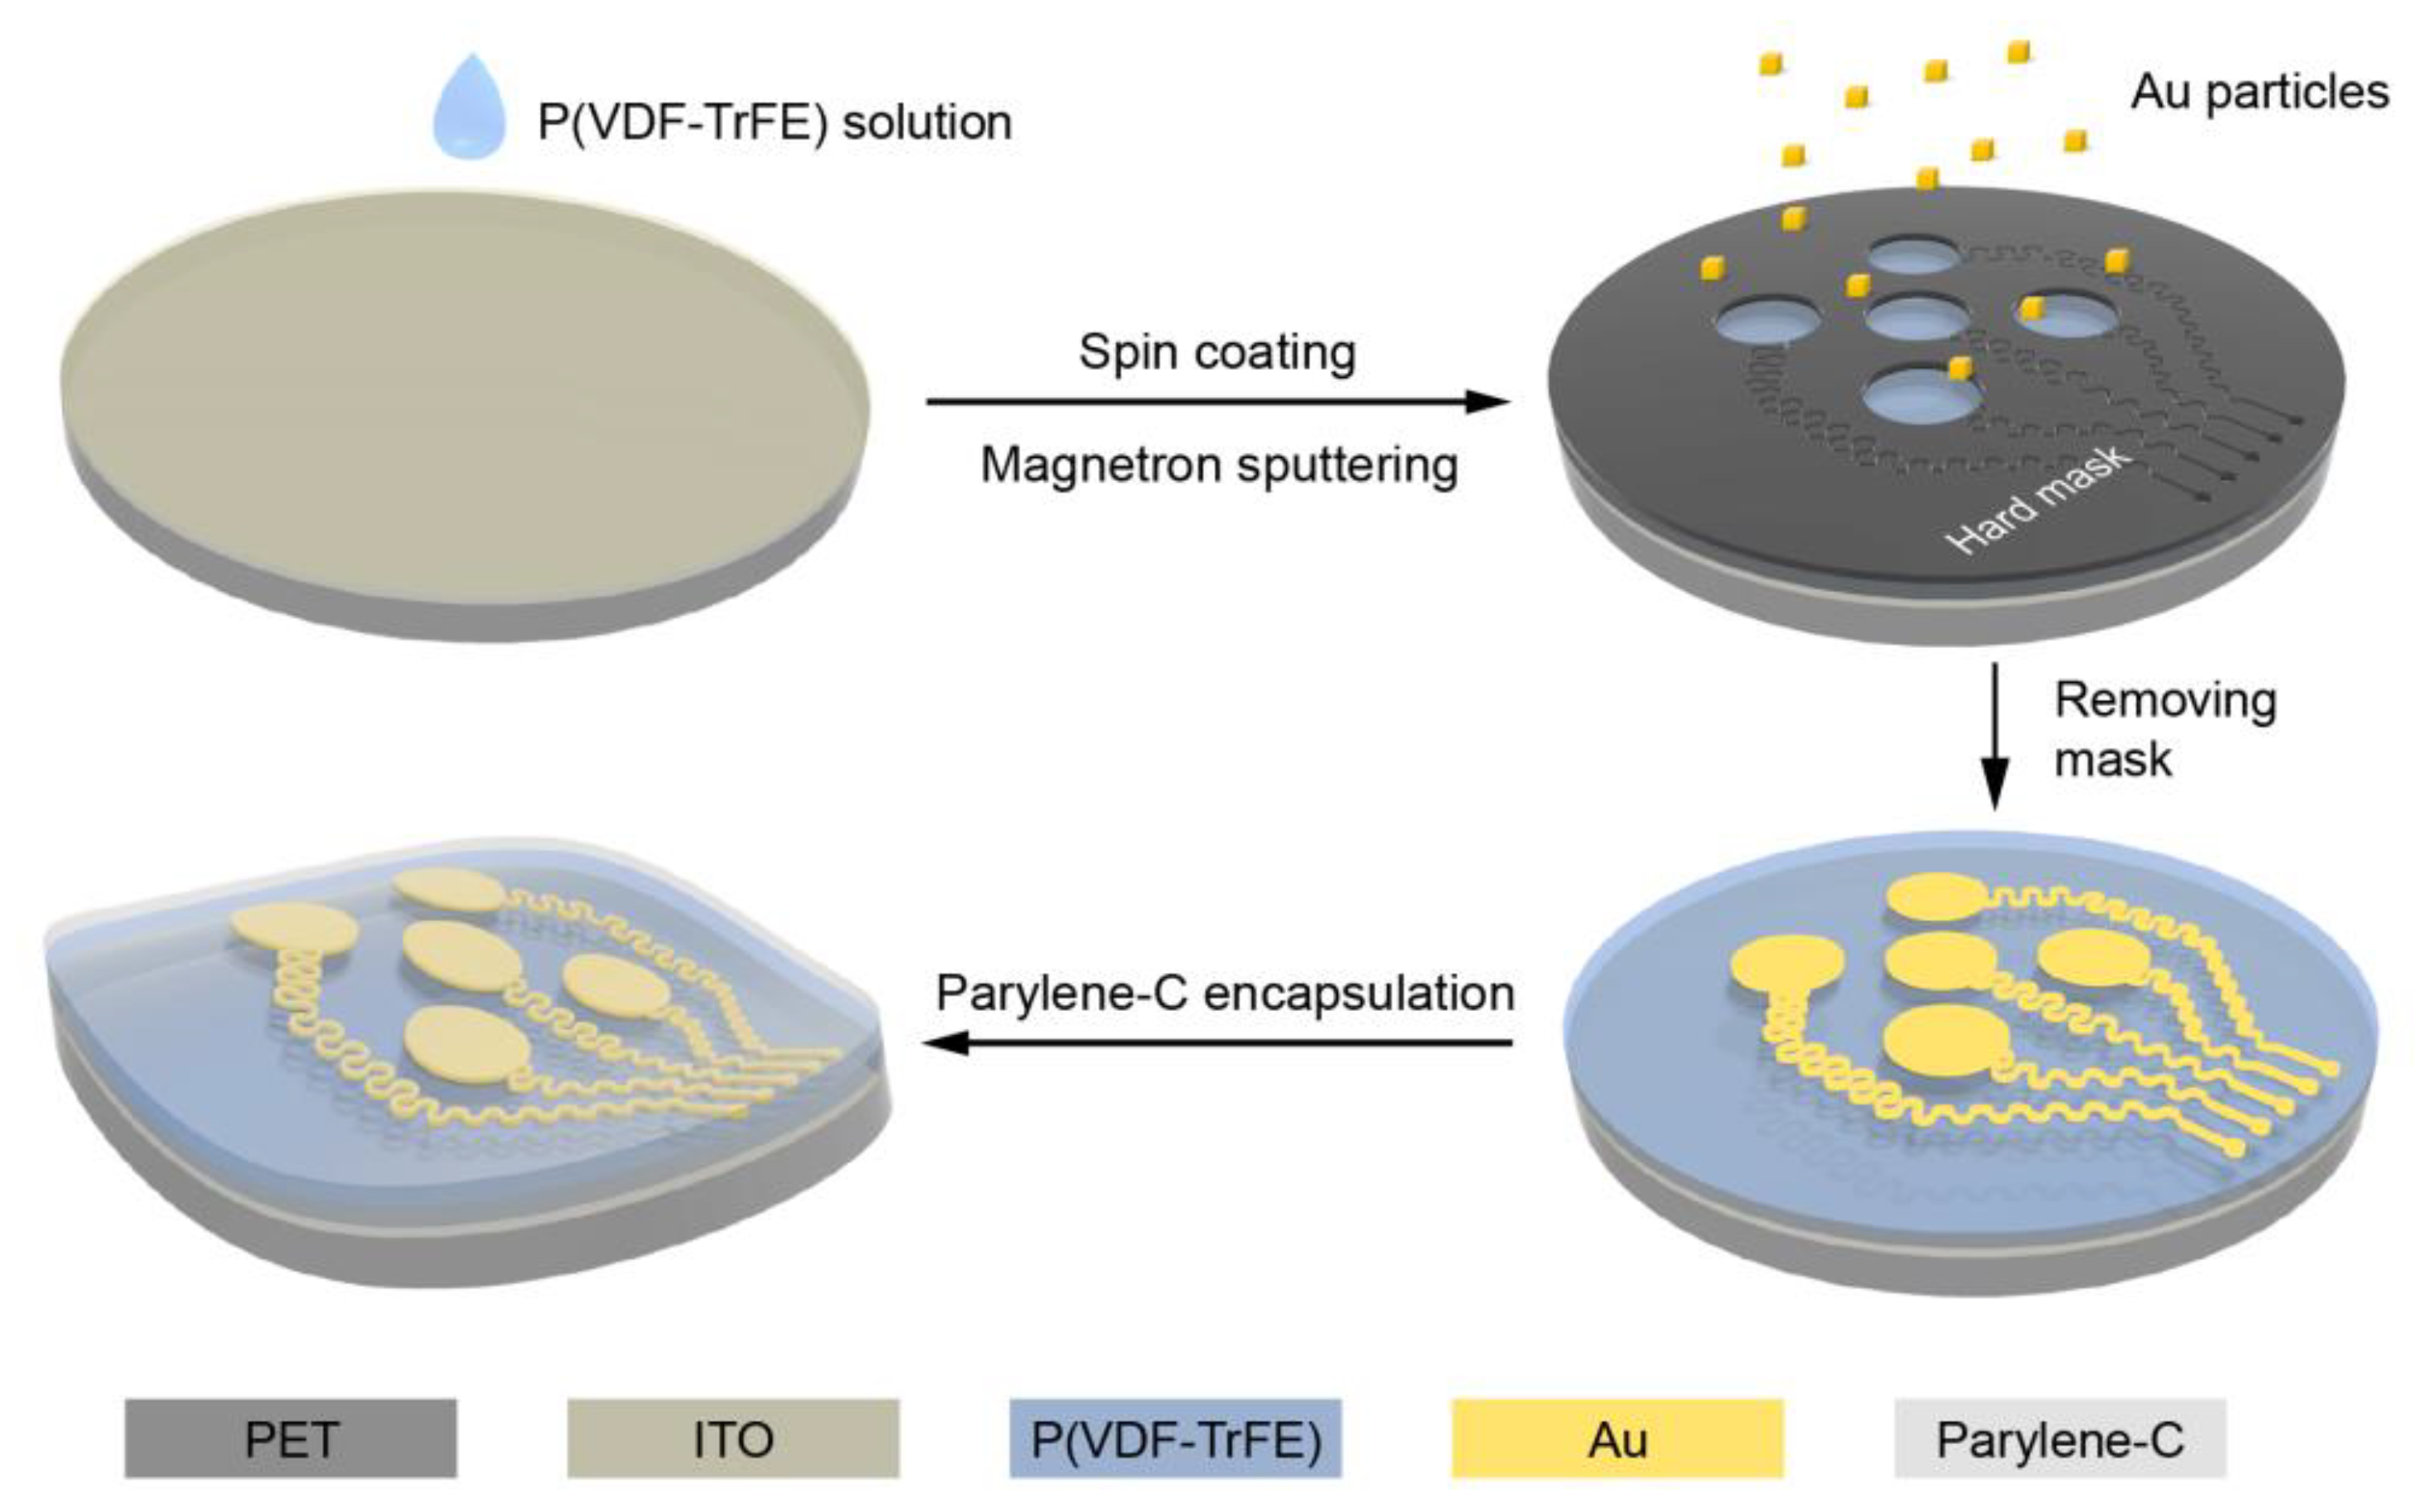
2. Fabrication of the Piezoelectric Sensor Array

The synchronous-fabrication method, which solves the sensor unit inconsistency problem, is put forward in this work. Figure 1a schematically illustrates the fabricated device structure, showing the materials of each layer of the piezoelectric sensor array. There are five sensors in the array, which is not limited to five. When faced with more complex conditions, more sensor units could be easily expanded. In this work, the hand tactile recognition scene is adopted. Considering the higher probability of touching the central area, a new array layout was proposed to replace the traditional square or nine-grid array layout, which is suitable for human–device interaction. The five sensors are designed in a cross shape to ensure the sensing range covers the central position and the periphery with a small number of sensor units. Figure 1b,c shows the top view photograph of the fabricated sensor array device and the photograph of device flexibility, respectively. It should be noted that the labels of each sensor unit described in the inset in Figure 1b will be used throughout the article.
The main fabrication process is shown in Figure 2. The device was obtained by the following process steps. First, 1.5 g P(VDF-TrFE) powder was dissolved in a glass vial containing 8 mL N, N-dimethylformamide (DMF) solvent, and the vial was placed on a roller mixer rotating at 75 rpm for 6 h to dissolve uniformly. ITO-coated-PET (125-mm-thick) was cut into a circle with a diameter of 100 mm by laser cutting. After spin coat the P(VDF-TrFE) solution on the ITO-coated-PET at the speed of 500 rpm for 40 s, it was cured in a vacuum oven at 55 °C for 0.5 h. Then, the sample was thermally annealed in a vacuum environment at 130 °C for 2 h to promote the further conversion of the P(VDF-TrFE) film crystalline phase into the β phase. The size, shape and placement of the sensor units and wires were designed and patterned on a carbon fiber plate as a hard mask for gold sputtering. The hard mask is closely attached to the annealed P(VDF-TrFE) film, and 200-nm-thick Au is magnetron sputtered as the top electrode and wire arrangement. After the thin copper wires connected to the top and bottom electrodes were fixed, a 3-μm-thick Parylene-C film was deposited as an encapsulation layer.

3. Results and Discussions

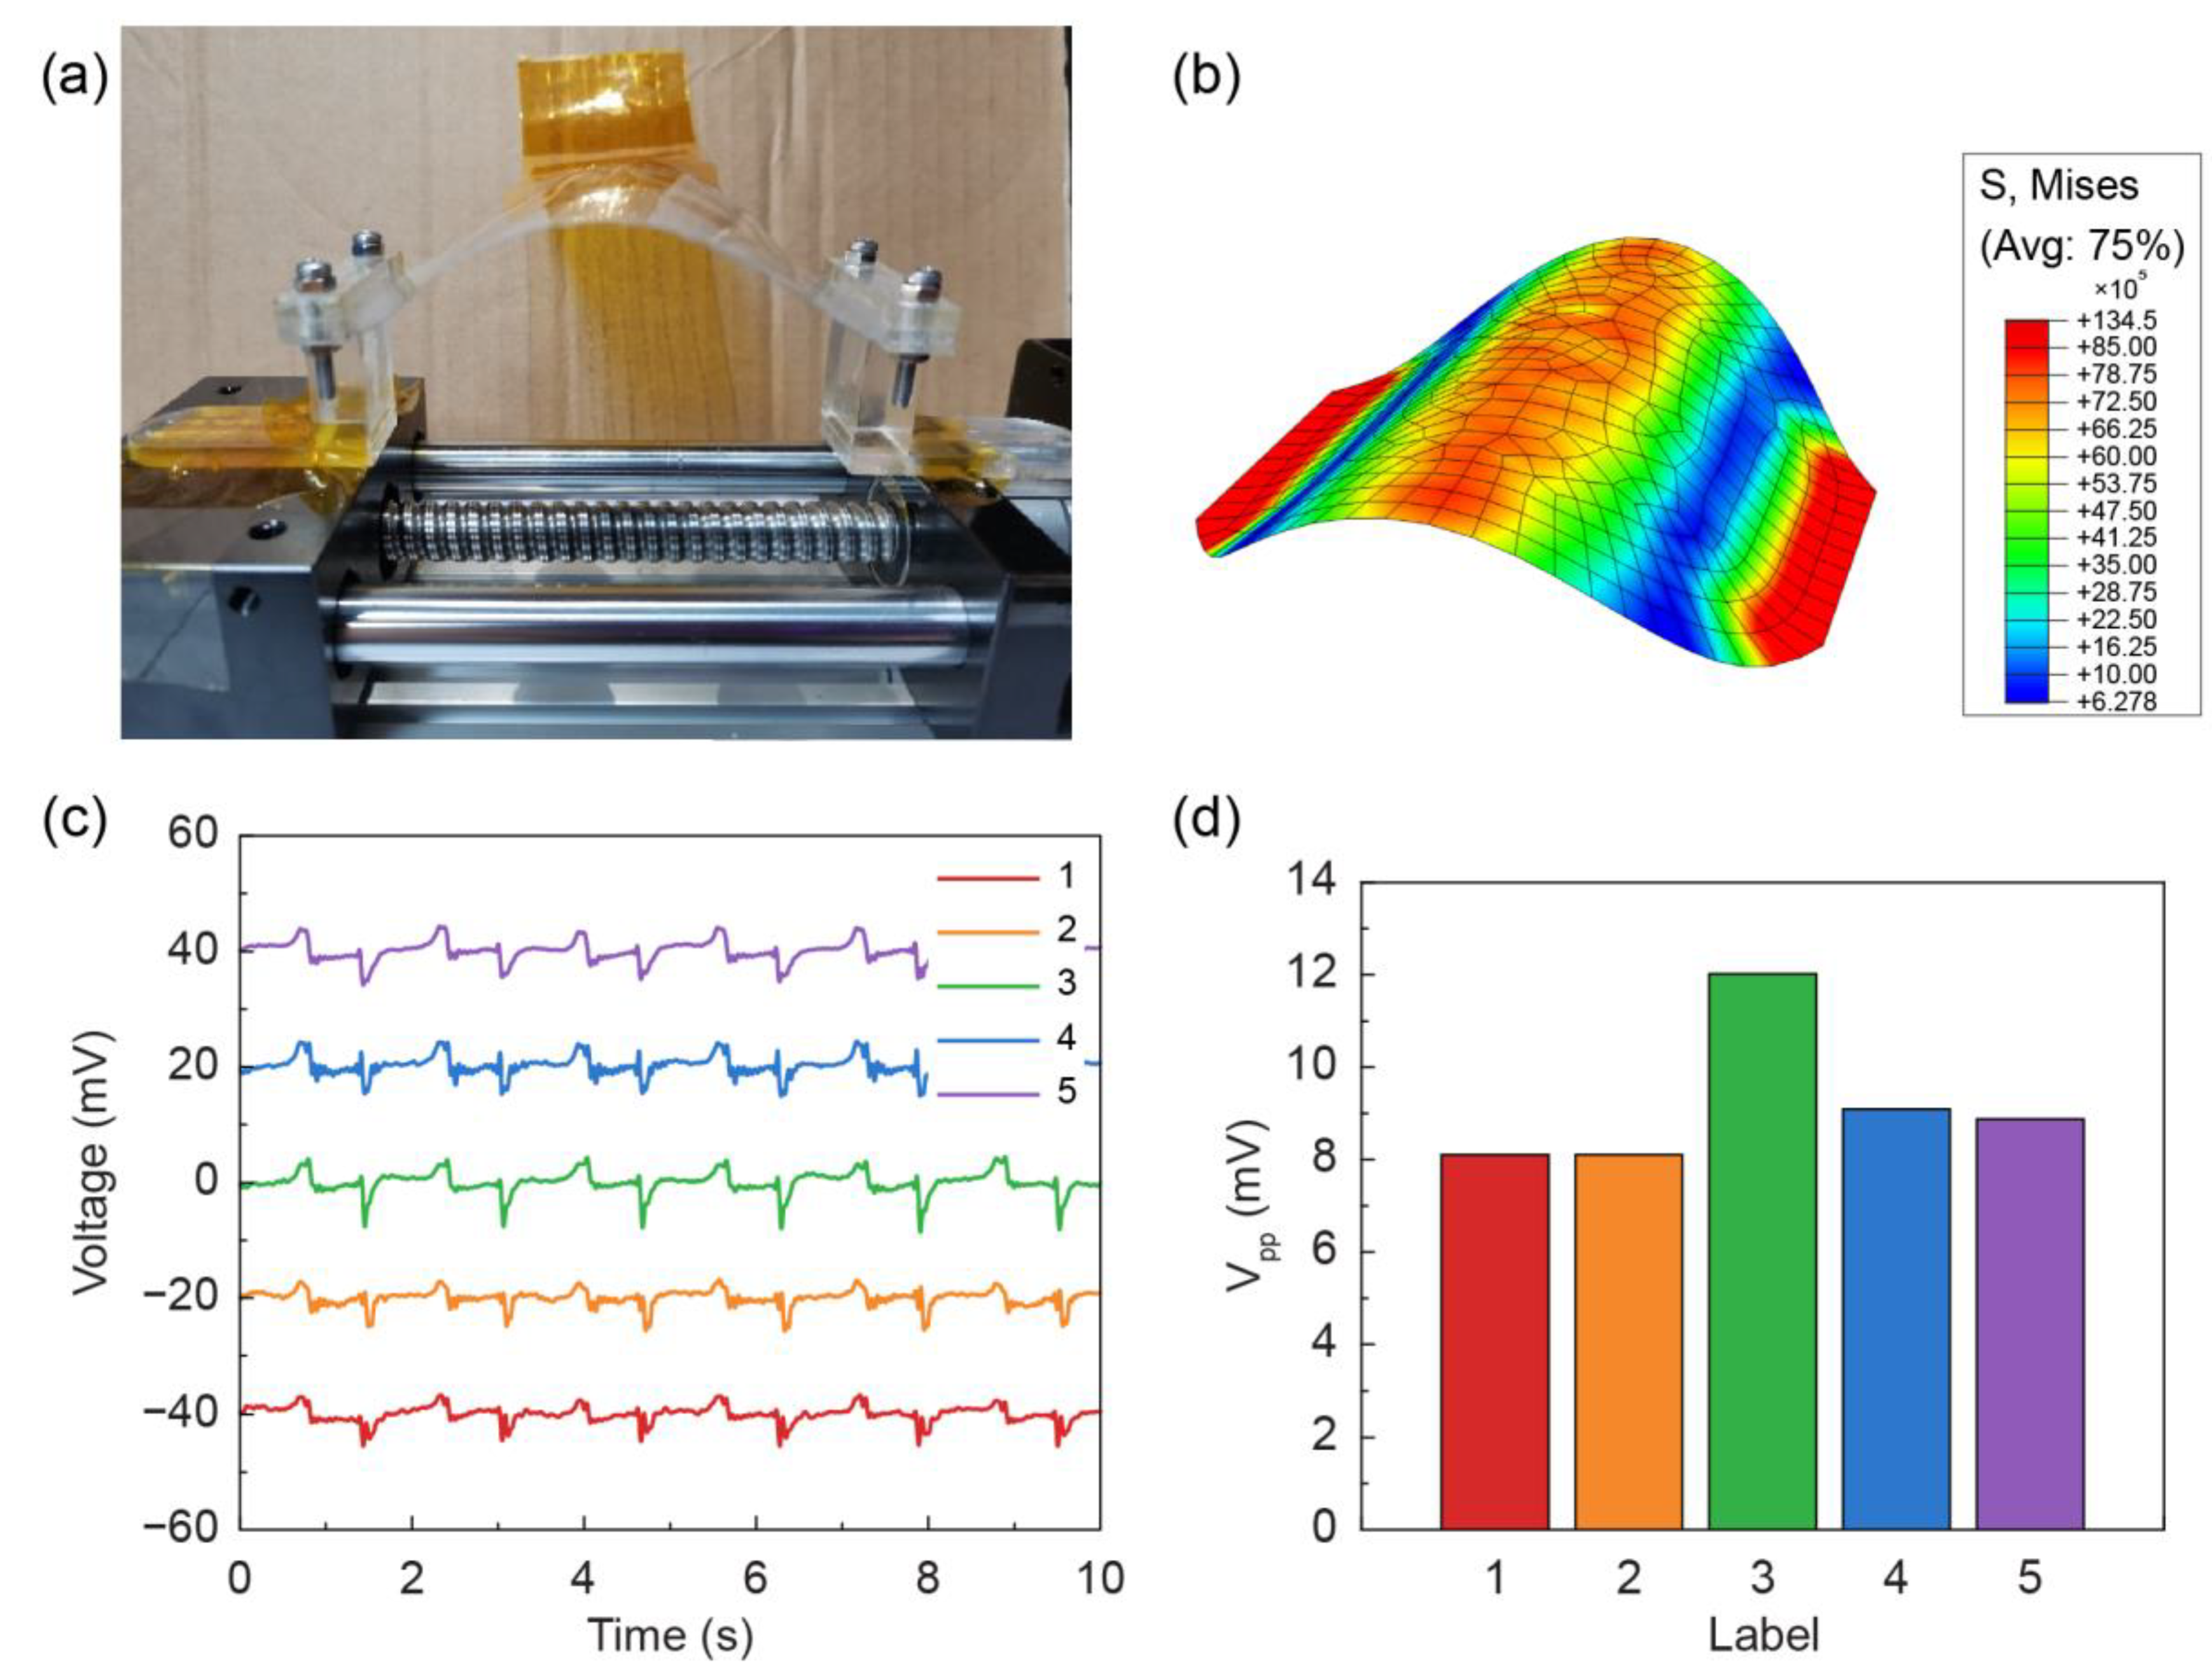
3.1. Characterization of the Piezoelectric Sensor Array

A compressing–releasing cyclic experiment was carried out to evaluate the consistency of the piezoelectric performance of each pixel unit of the fabricated flexible sensor array. The compressing–releasing test platform is a piece of single-axis stepping equipment with a ball screw and includes a programmable controller. Two ends of the sensor array were fixed on the 3D-printed clamps. One clamp was fixed on one fixed end of the equipment, and the programmable controller was set to adjust the displacement of the movable end, so that the device was just in a flat state when the other clamp was fixed on the movable end of the equipment along the coaxial direction. This can also be regarded as the initial state of the device testing. The moving speed of the movable clamp was set to 75 cm/min while the maximum moving distance was set to 1 cm through the programmable controller. The device was bent and released periodically with a frequency of about 0.6 Hz. The piezoelectric signal output of each piezoelectric sensor unit was recorded by an oscilloscope. Figure 3a is a photograph of the compressing–releasing experiment platform and the compressing state of the device.
Generally, each pixel’s piezoelectric sensitivity processed separately of the sensor array is different because the process conditions cannot be controlled to be entirely consistent. However, the sensor proposed in this paper has obvious advantages. The thickness of the piezoelectric film formed by spin coating is the same, and there is no difference between the substrate, the encapsulation layer and the electrodes of each sensor unit. Moreover, each sensor unit is defined by a hard mask made by laser cutting and sputtered with gold, which results in high precision. These conditions basically determine that the performance of each sensor pixel will not have a significant difference. ABAQUS software was used to simulate the stress distribution of the device during compression or bending. An eigenvalue buckling analysis was performed, and the result was set as the initial perturbation in the following post-buckling analysis. The simulation results show that the stress in the middle of the device is the largest except for the fixed ends on both sides and gradually decreases when moving to two sides, which is distributed symmetrically (Figure 3b). Therefore, according to the label numbers depicted in the inset of Figure 1b, the output voltage signal of the sensor of label 3 is higher than that of the sensors of the other four sensors, and the output voltages of the four sensors should theoretically be the same. The voltage-time signals of five channels collected by an oscilloscope were filtered by MATLAB software to remove the power frequency noise, and then drawn in Figure 3c. The distribution of average peak-to-peak voltage of each sensor unit is plotted in Figure 3d, showing that the peak-to-peak voltage of the sensor unit labeled 3 is the largest in this experiment, while the voltage signals of the other four sensor units have little difference.
To further prove the sensor consistency, the positive compression test was incorporated. The sensitivity under different pressure was tested with the help of an exciter, which is shown in Figure 4. According to the output range of the exciter, the sensor units were struck by force from 1 N to 5 N. Then, the peak-to-peak voltage values of each sensor unit were fitted by the least square method.
When the P(VDF-TrFE) piezoelectric film is thin, the piezoelectric effect can be simplified as only stress from one direction needs to be considered [46]. The output charge Q of the P(VDF-TrFE) can be expressed as:
Q = d σ S = d E P V D F S T
where d is the piezoelectric strain constant, E P V D F is the elastic modulus, S is the area size, and T is the stress. Then the voltage output U can be simplified as:
U = Q C = d E P V D F S T C
where C is the equivalent capacitance of the whole circuit, which is relevant to the P(VDF-TrFE), electrode, and the test circuit. As shown in Equation (2), the output voltage is proportional to the pressure when the sensor is fixed. Therefore, the slope fitted by the least square method was used to represent the sensitivity of the sensor unit in this work.
The maximum and minimum slopes of different sensor units in the array were calculated as the MIN–MAX difference. The ratio of MIN–MAX difference to the average slope, named MIN–MAX ratio in Table 1, was considered as one of the evaluation methods of sensor unit consistency. In addition, the ratio of the slope standard deviation to the average of slopes, named STD ratio in Table 1, was also considered. Related work rarely described the sensitivity difference in the array, which makes it difficult to make direct comparison. Tian et al. presented a 3 × 3 sensor array based on laser cutting and polishing process [20]. Li et al. introduced a five-cell tactile sensor array based on fiber Bragg grating sensing [45]. They observed the sensitivity difference and attributed it to the fabrication and assembly errors. Based on the sensitivity given in their paper, the same metrics were calculated in this work (MIN–MAX ratio and STD ratio). Table 1 shows the consistency result of different sensor arrays, and our P(VDF-TrFE) piezoelectric sensor array using ITO-coated PET substrate has a significantly higher sensitivity consistency.
These tests verify the five sensor units on the manufactured sensor array have almost the same piezoelectric performance. Compared with the method of connecting separate sensor units into arrays, our shared substrate and synchronous-fabrication method can better ensure the consistency of sensor units, thus providing a guarantee for motion recognition.

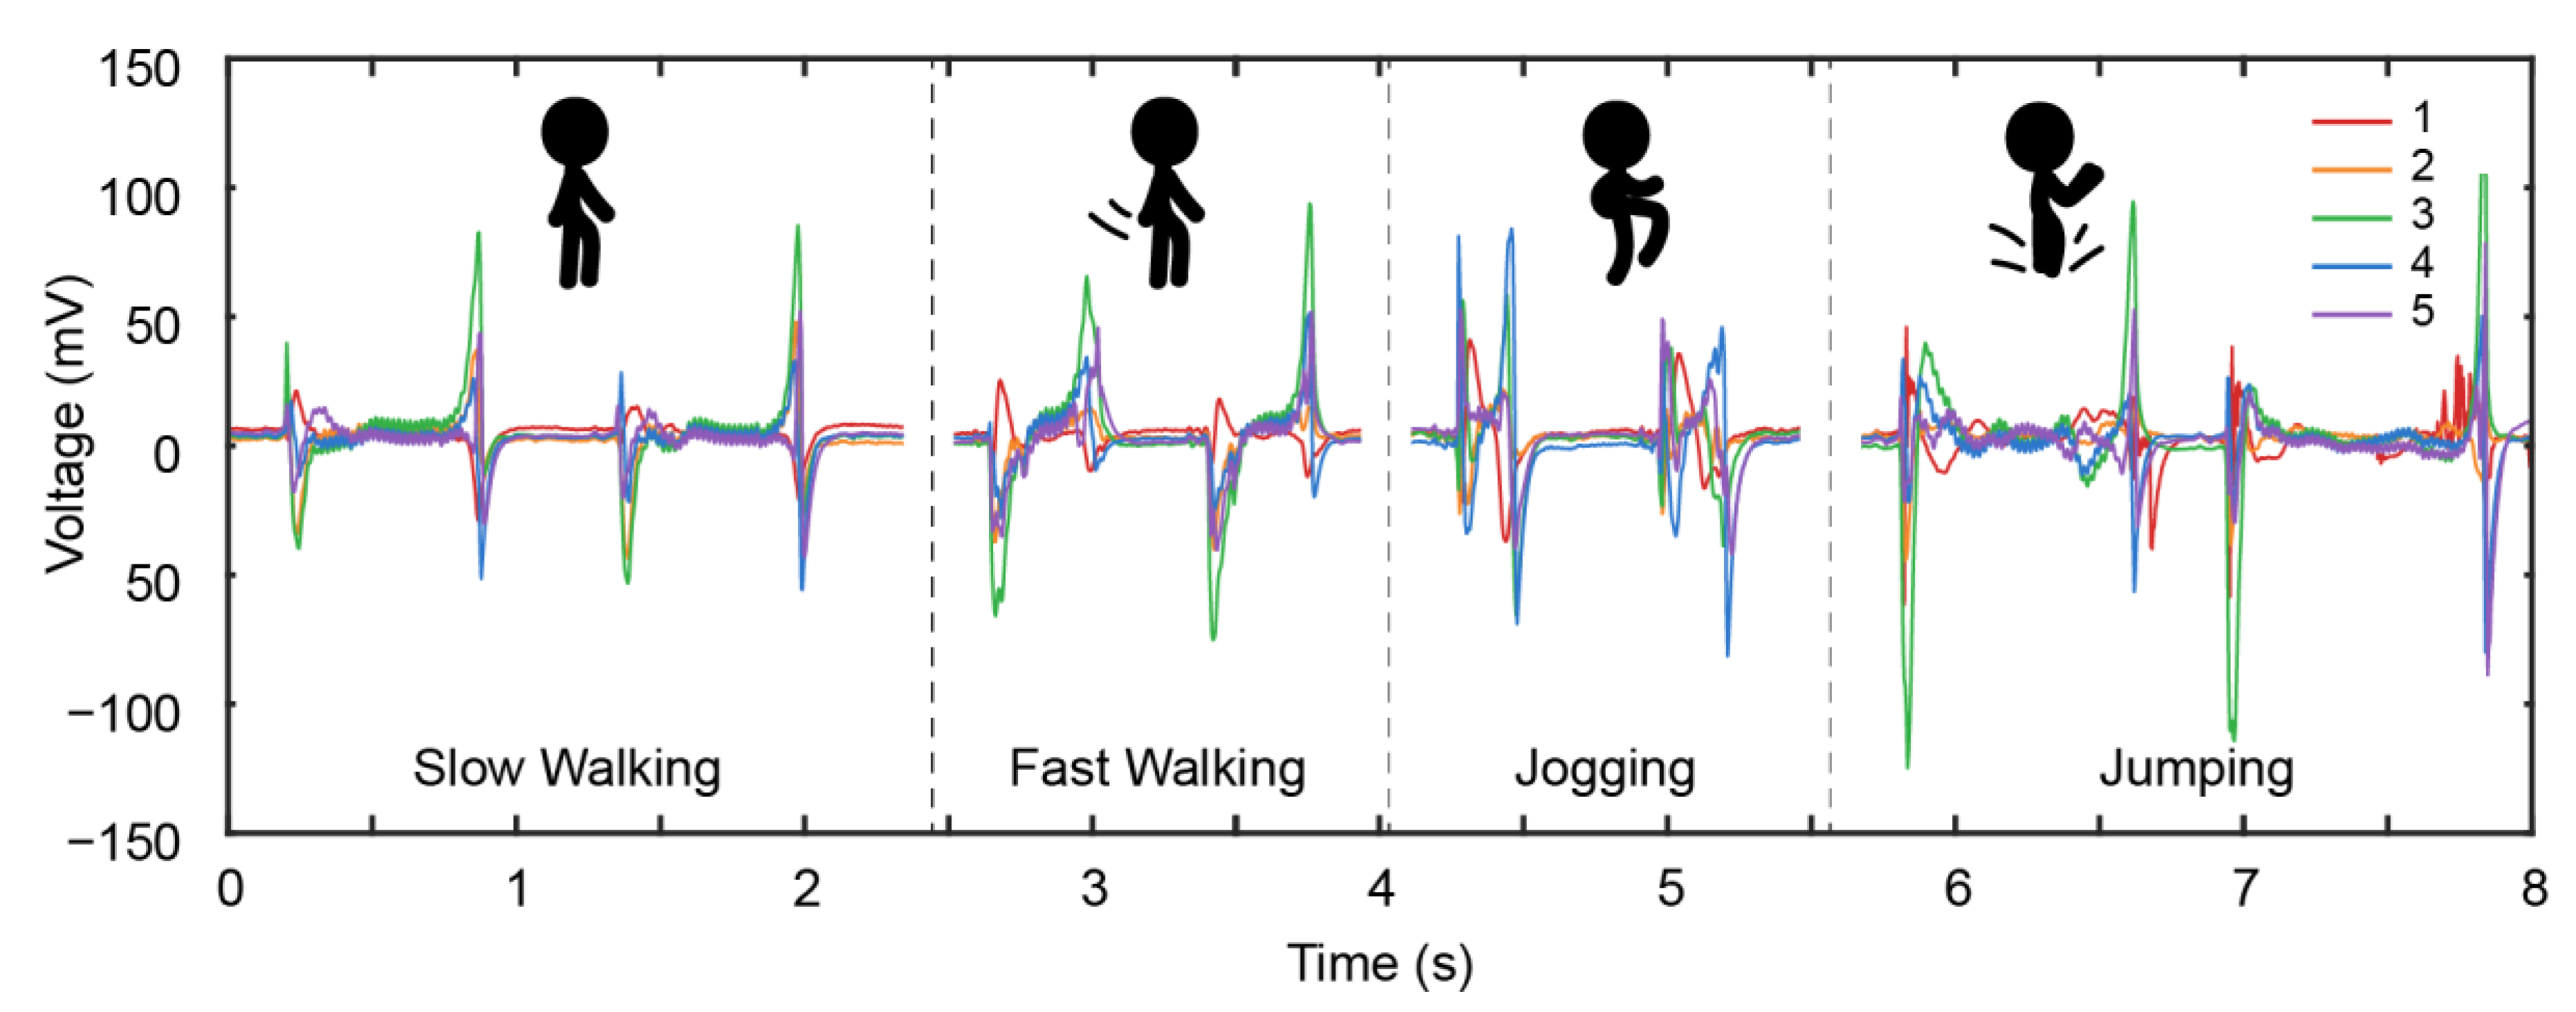
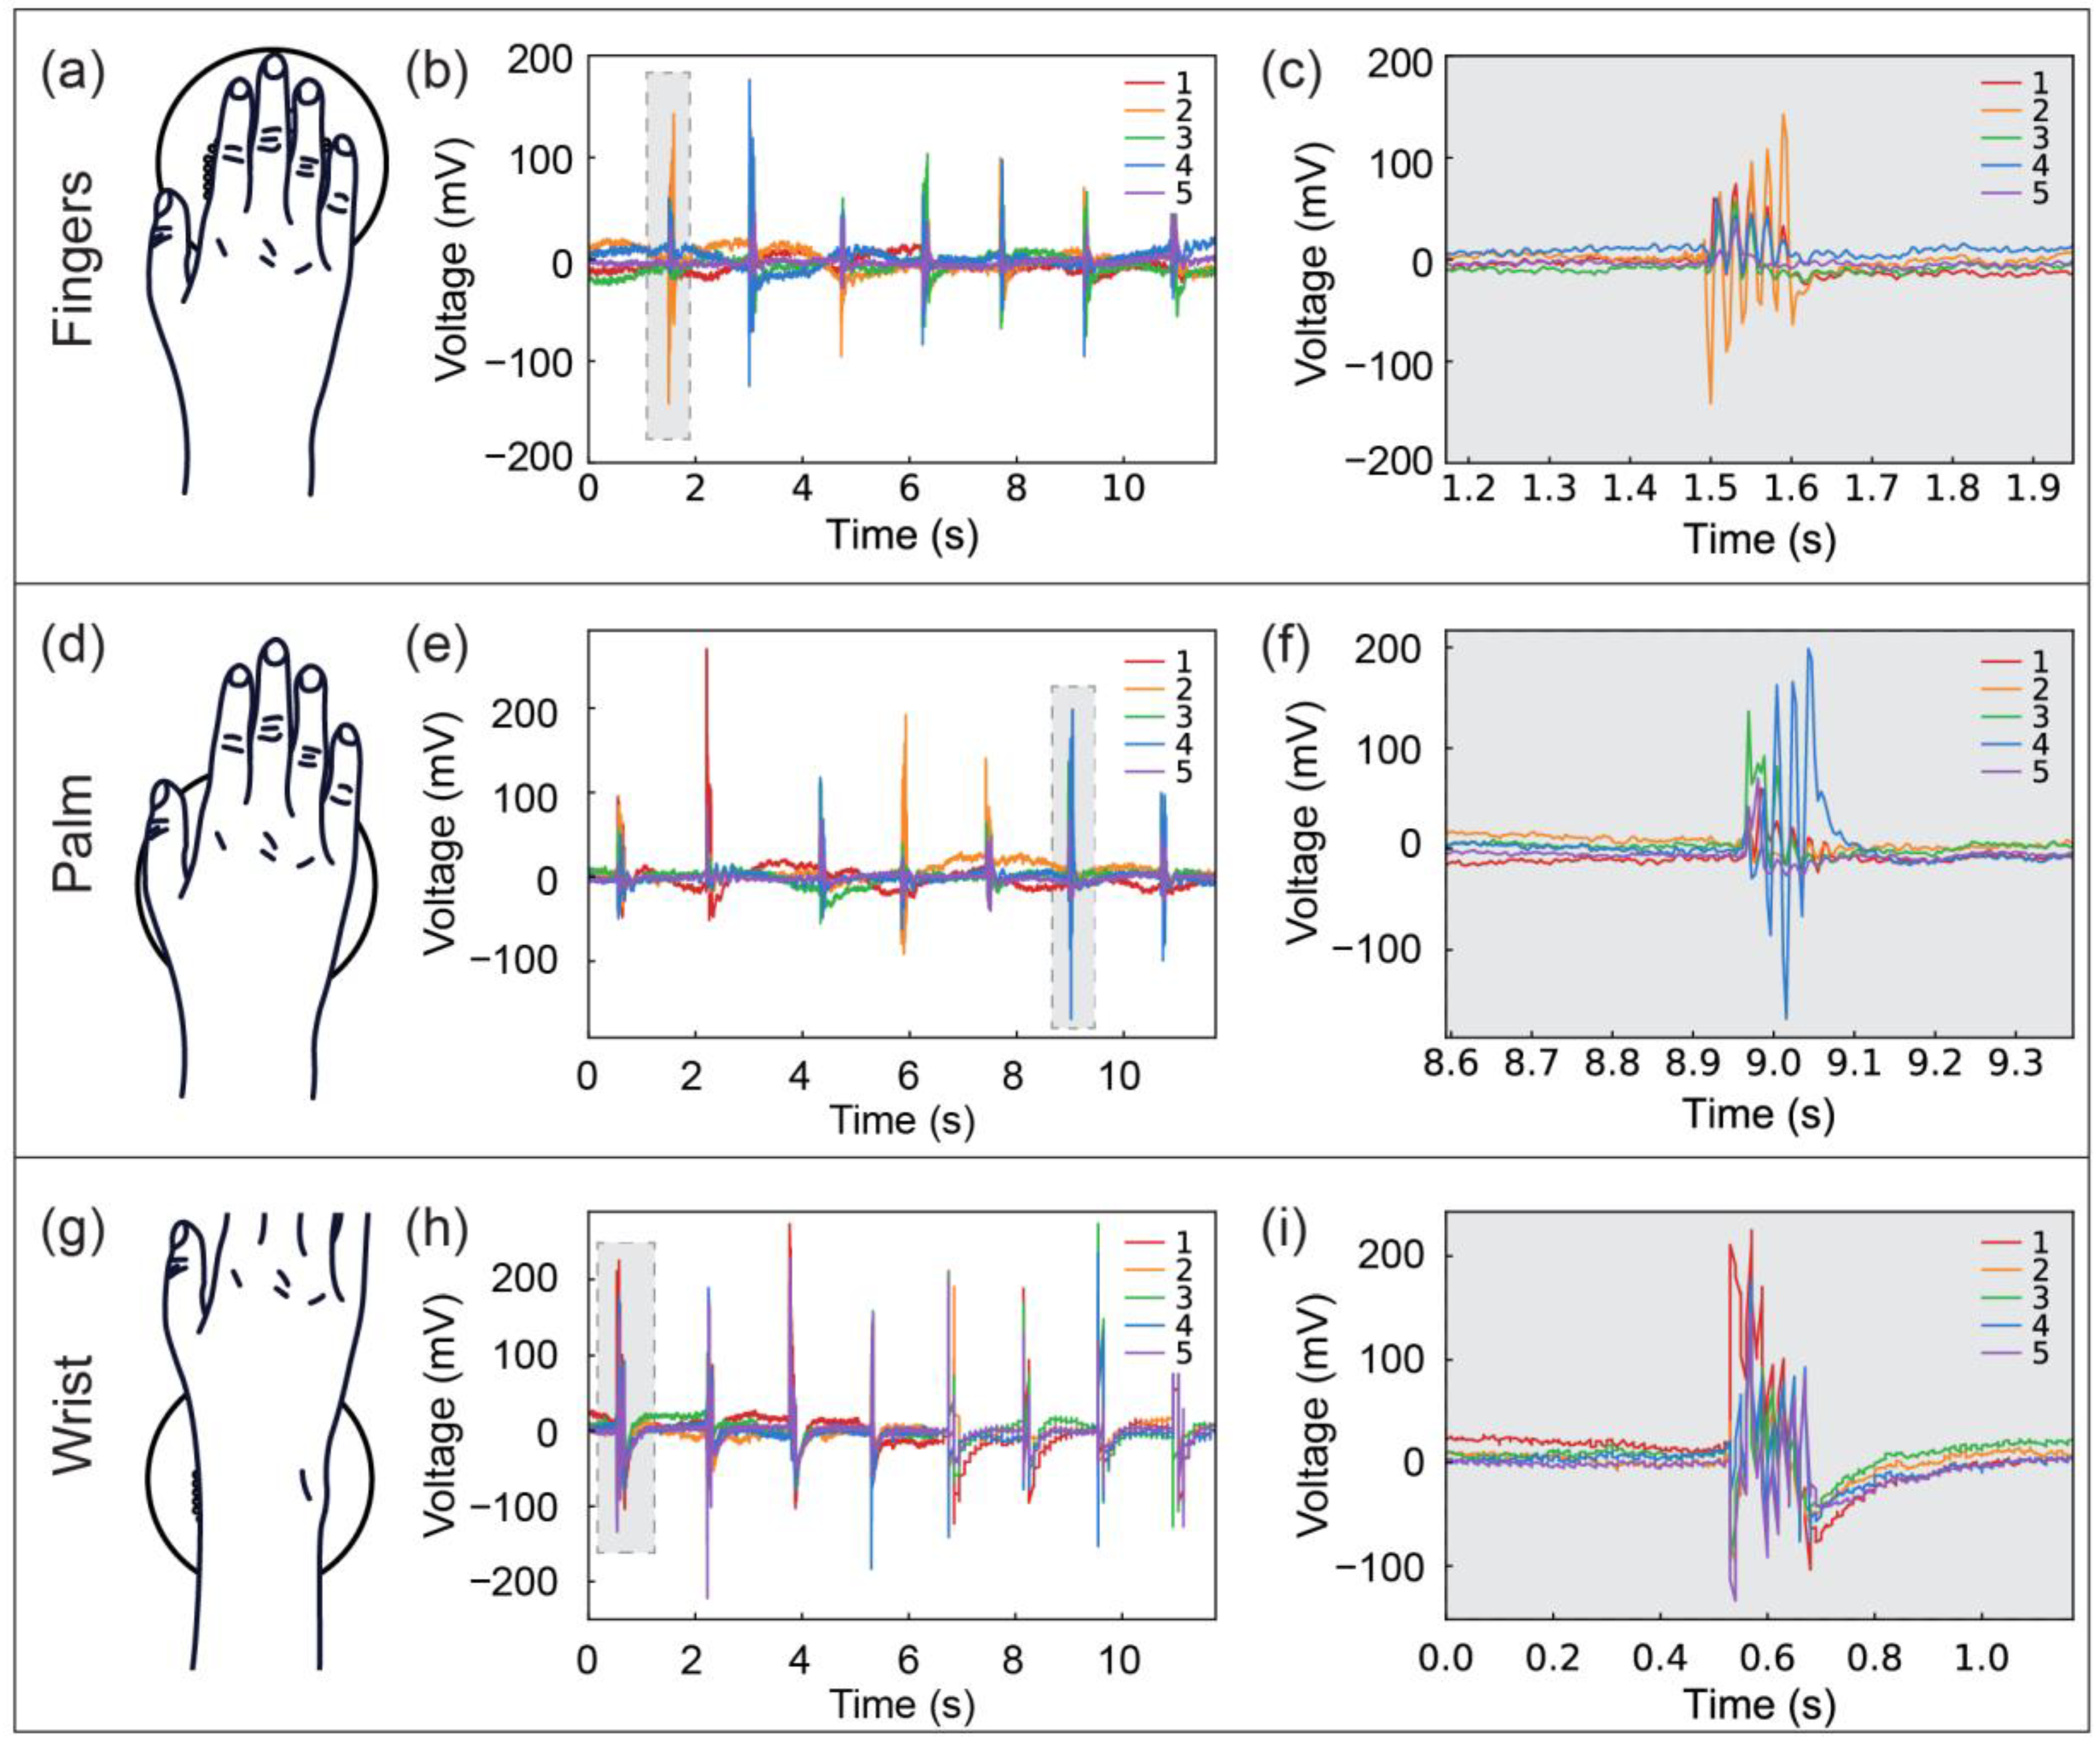
3.2. Activity Monitoring

The cross-shaped piezoelectric tactile sensor array can be adopted for activity monitoring in daily life. The flexible device was fixed on the ground, and a person performed different types of actions in place to make the heel with socks contact with the surface of the sensor array, including slow walking, fast walking, jogging, and jumping. The output signals of these four types of activities were recorded by an oscilloscope and depicted in Figure 5. Compared with slow walking, the signal waveform of fast walking is similar, but the amplitude and frequency are higher. In the jogging activity, the contact time between the heel and the device is shorter, and the voltage signal is generated and released quickly, so the output waveform of jogging is obviously different from the signal generated by walking. Because of the longer contact time and greater contact pressure between the heel and the device, the piezoelectric signal generated by the two-foot jumping activity is obviously different from the first three. According to the overall amplitude, waveform and frequency of the output signals, different activities can be easily distinguished and identified. In addition, the combination of output signals from different channels is also a method to judge contact activity, which can be used to monitor more complex activities, indicating the activity monitoring ability of the cross-shaped sensor array and its potential applications in fields of medical care and sports training.

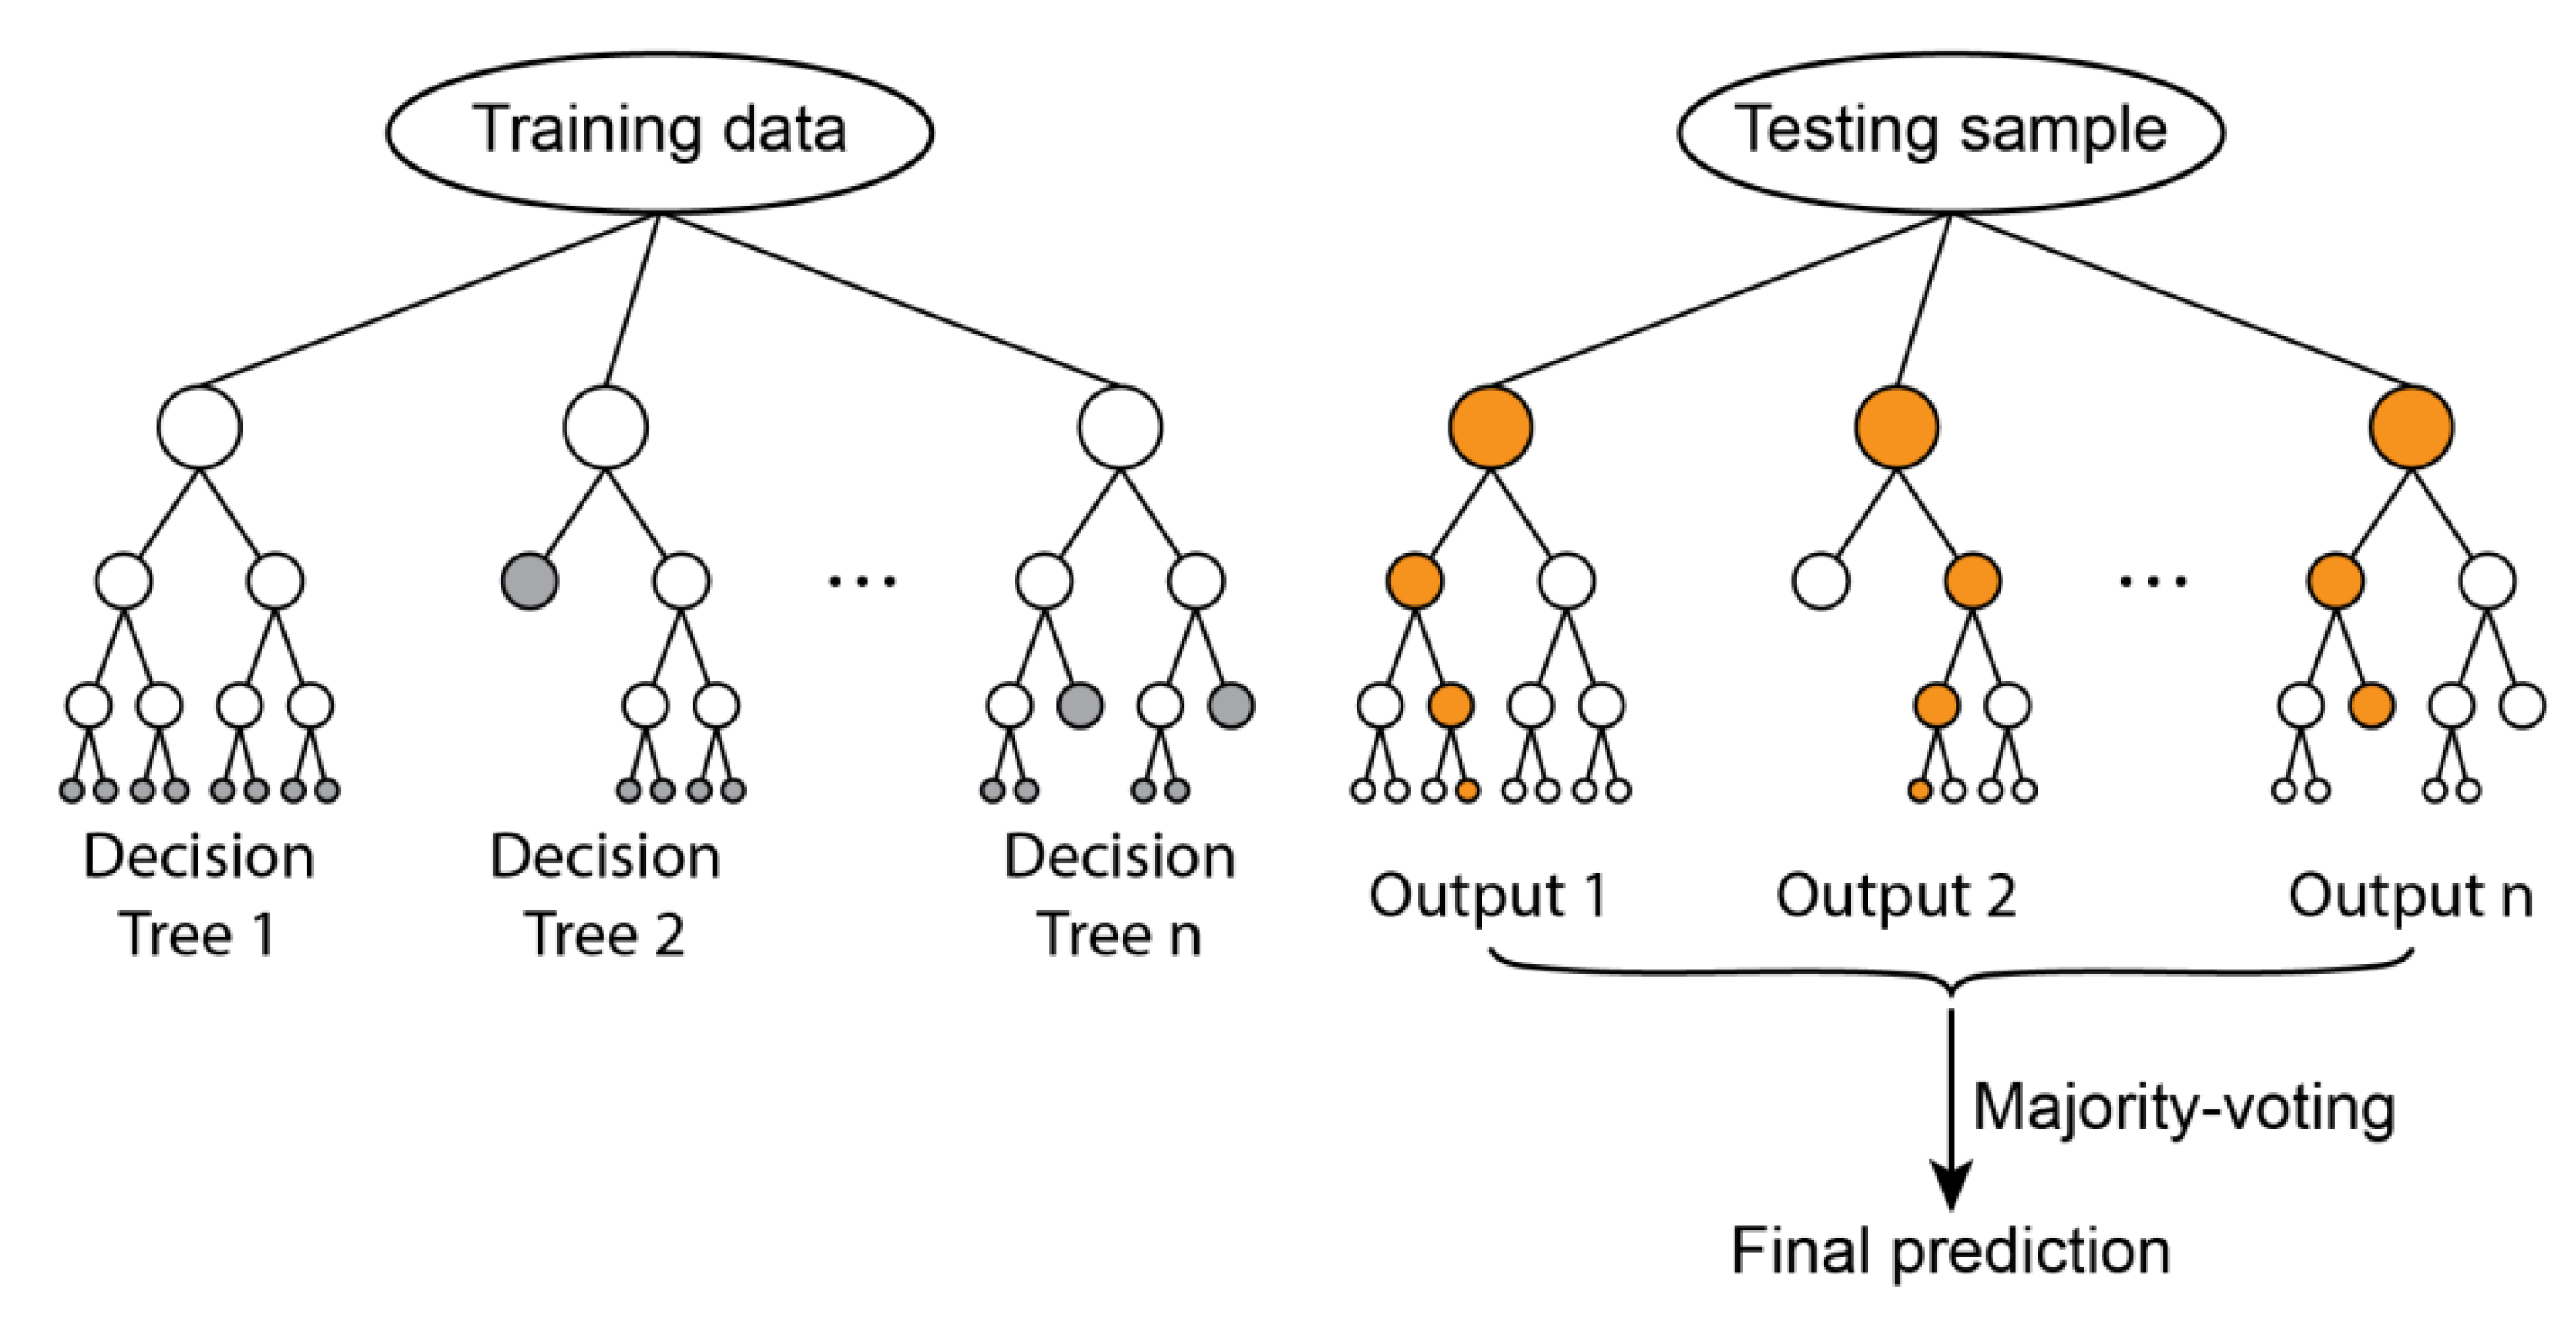
3.3. Tactile Recognition

The cross-shaped sensor array can produce a set of vector data, which enables the multi-pixel sensor to be sensitive to the touch of different objects. This ability can realize target recognition through machine learning technology. With the sensor array’s help, identification of objects could be achieved, which may play an essential role in fully automated factories, blind assistive devices, sports training, touch alarm devices. For these reasons, verifying the tactile discrimination ability of the sensor in the real-life environment is necessary.
The tactile recognition of different hand positions was verified as an example in the experiment. This kind of scene is often encountered in life. For example, if the clothes are equipped with flexible sensors, the wearer can wake up different functions with different gestures. Three different tactile senses were compared here. Testers dropped their arms and made flapping motions, so that three different positions of the hand were in contact with the sensor array, including the fingers part, the palm part, and the wrist part, representing three different scenes, as schematically shown in Figure 6a,d,g. In the experiment, each scene was repeated 100 times at a certain time interval. The flap direction and contact strength were random. The signals of the sensor array during this period were collected to determine what was touching it. The experiment is to verify the effectiveness of the sensor array. Considering the further possible commercial use, more samples that are collected from different environments, such as different temperatures, different humidity, and different races, can be used to retrain the model. Figure 6b,e,h capture several voltage signals of touches. Figure 6c,f,i are single enlarged views of the corresponding scene, so that the waveform can be displayed more clearly. Although the touch pressure was random in each scene, there was no obvious difference in the touch strength among the three scenes. Therefore, it demonstrated that different contacts are not distinguished by different voltage amplitudes, but by waveform shape and vectors combination.
Rules can be made to identify different signal patterns to distinguish different tactile impressions. For objects of different materials and shapes, the contact signal may be quite different, so signals can be distinguished in essence. However, there are too many rules to make if various tactile impressions need to be judged. These human-made rules may be complex and imperfect. To solve this problem, this paper introduces a machine learning method, random forest, to identify different signal features. This work applies relevant technologies to compare the recognition capabilities of a single sensor and the sensor array. Machine learning models have the advantage of automatically extracting features and learning the association between features and targets, which is often used for face recognition, speech recognition, and so on. Although neural networks, such as fully connected networks and CNN [47] are more popular, they need powerful computing and storage resources. In wearable devices, resources are often limited. Therefore, the random forest model has more advantages in practical deployment. The random forest is a classifier containing multiple decision trees. Every decision tree classifies data based on information entropy [48]. It has a tree-shape data structure, in which each internal node represents a set of attributes, each branch represents a classification process and each leaf node represents a category. Figure 7 schematically describes the principle of random forest. The random forest is implemented using Scikit learn, a machine learning library in Python, in this work. The parameter setting of the model is as follows. The maximum depth of the tree is 20 while the number of the tree is 50. Other parameters remain unchanged by default.
Early works simply use peak-to-peak voltage for prediction, whose recognition rate is between 80% and 90% [49,50,51]. In order to make better use of the waveform information, the data of different points in the waveform are used in this work. In this way, the model can analyze more detailed distinctions. The training process of the model is as follows. The first step was data preprocessing. The data of the sensor array was transformed into the input samples of the random forest model. Each sensor’s time-series data were first divided into several segments, each of which was a touch signal. Then, each data segment was averaged every 0.02 s for a total of 16 times. After that, the model’s input was a cascade of five sensors’ data at one touch, whose size was 80.
The second step was model fitting. In the 300 touch signal samples, a random of 210 samples were selected to train the random forest. These samples had three different labels, which represent different scenes. Random forest strived to learn the corresponding relationship between sample features and labels.
Finally, another 90 samples were used for testing. During the test phase, the model did not know whether the fingers, palm or wrist touched the sensor. It gave a recognition result according to the signal distribution. The accurate number of tactile impressions was recorded as #acci, where i { 1 ,   2 ,   3 } , and the total number of recognition times was recorded as #total. The accuracy of the finger, palm and wrist, respectively, represented the proportion of correct judgment in their respective total number of tests. Then, the model accuracy referred to the overall accuracy of judging the three gestures, which was calculated as:
Model   accuracy =     # acc i # total .
The advantages of the proposed sensor array in tactile recognition compared with a single sensor were also verified in the experiment. The single sensor was made in the same fabrication way with a larger area to sense the pressure. The expression ability of the multi-pixel sensor is stronger than the single sensor. It can tell the pressure difference between different positions of touch. Therefore, the sensor array significantly improves recognition accuracy. The recognition accuracies of different situations are compared in Table 2. The recognition accuracy of the sensor array is up to 95.5%. However, when only a single sensor unit was used for testing, the model accuracy dropped greatly. This result shows the advantages of the cross-shaped sensor array that the vector signal from the sensor array can better capture the difference of the tactile through machine learning technology.

4. Conclusions

In summary, the shared ITO-coated-PET substrate and synchronous-fabrication method were introduced to the flexible P(VDF-TrFE) tactile sensor array fabrication process. Benefited by this process, each sensor unit exhibits almost the same piezoelectric performance and output a clear and stable piezoelectric signal, which is beneficial for the motioned recognition scenarios. In addition, the cross-shaped array design of five piezoelectric pixels can achieve sensitive tactile sensing function with a small number of channels, and different activities can be easily distinguished by the sensor array. Furthermore, a new data processing method that makes use of the waveform information is proposed. Combined with the machine learning method, more complex hand part tactile is effectively recognized with a high model recognition accuracy of 95.5%.

Author Contributions

Conceptualization, B.Y.; Data curation, W.D.; Investigation, W.D.; Writing—original draft, W.D.; Writing—review & editing, L.L., Y.C., J.L. and B.Y. All authors have read and agreed to the published version of the manuscript.

Funding

This research was funded by Pre-research Foundation of Equipment (No. 6142004190205) and Joint Foundation of Pre- research of Equipment and Ministry of Education (No. 6141A02022637), The Natural Science Foundation of Hubei Province of China (No. 2016CFC724).

Acknowledgments

The authors are grateful to the Center for Advanced Electronic Materials and Devices (AEMD) of Shanghai Jiao Tong University.

Conflicts of Interest

The authors declare no conflict of interest.

References

  1. Jafarifarmand, A.; Badamchizadeh, M.A.; Khanmohammadi, S.; Nazari, M.A.; Tazehkand, B.M. A new self-regulated neuro-fuzzy framework for classification of EEG signals in motor imagery BCI. IEEE Trans. Fuzzy Syst. 2017, 26, 1485–1497. [Google Scholar] [CrossRef]
  2. Tseng, K.-K.; Fu, L.; Liu, L.; Lee, D.; Wang, C.; Li, L.; Meng, Y. Human identification with electrocardiogram. Enterp. Inf. Syst. 2018, 12, 798–819. [Google Scholar] [CrossRef]
  3. Jafri, S.R.A.; Hamid, T.; Mahmood, R.; Alam, M.A.; Rafi, T.; Haque, M.Z.U.; Munir, M.W. Wireless brain computer interface for smart home and medical system. Wirel. Pers. Commun. 2019, 106, 2163–2177. [Google Scholar] [CrossRef]
  4. Chen, X.; Li, X.; Shao, J.; An, N.; Tian, H.; Wang, C.; Han, T.; Wang, L.; Lu, B. High-performance piezoelectric nanogenerators with imprinted P (VDF-TrFE)/BaTiO3 nanocomposite micropillars for self-powered flexible sensors. Small 2017, 13, 1604245. [Google Scholar] [CrossRef] [PubMed]
  5. Chen, X.; Shao, J.; An, N.; Li, X.; Tian, H.; Xu, C.; Ding, Y. Self-powered flexible pressure sensors with vertically well-aligned piezoelectric nanowire arrays for monitoring vital signs. J. Mater. Chem. C 2015, 3, 11806–11814. [Google Scholar] [CrossRef]
  6. Navaraj, W.; Dahiya, R. Fingerprint-Enhanced Capacitive-Piezoelectric Flexible Sensing Skin to Discriminate Static and Dynamic Tactile Stimuli. Adv. Intell. Syst. 2019, 1, 1900051. [Google Scholar] [CrossRef]
  7. Bao, R.; Wang, C.; Dong, L.; Yu, R.; Zhao, K.; Wang, Z.L.; Pan, C. Flexible and controllable piezo-phototronic pressure mapping sensor matrix by ZnO NW/p-polymer LED array. Adv. Funct. Mater. 2015, 25, 2884–2891. [Google Scholar] [CrossRef]
  8. Niu, H.; Gao, S.; Yue, W.; Li, Y.; Zhou, W.; Liu, H. Highly Morphology-Controllable and Highly Sensitive Capacitive Tactile Sensor Based on Epidermis-Dermis-Inspired Interlocked Asymmetric-Nanocone Arrays for Detection of Tiny Pressure. Small 2020, 16, 1904774. [Google Scholar] [CrossRef]
  9. Pyo, S.; Lee, J.; Kim, W.; Jo, E.; Kim, J. Multi-Layered, Hierarchical Fabric-Based Tactile Sensors with High Sensitivity and Linearity in Ultrawide Pressure Range. Adv. Funct. Mater. 2019, 29, 1902484. [Google Scholar] [CrossRef]
  10. Wei, H.; Wang, H.; Xia, Y.; Cui, D.; Shi, Y.; Dong, M.; Liu, C.; Ding, T.; Zhang, J.; Ma, Y. An overview of lead-free piezoelectric materials and devices. J. Mater. Chem. C 2018, 6, 12446–12467. [Google Scholar] [CrossRef]
  11. Zou, L.; Ge, C.; Wang, Z.J.; Cretu, E.; Li, X. Novel tactile sensor technology and smart tactile sensing systems: A review. Sensors 2017, 17, 2653. [Google Scholar] [CrossRef] [PubMed]
  12. Ghosh, S.K.; Mandal, D. Synergistically enhanced piezoelectric output in highly aligned 1D polymer nanofibers integrated all-fiber nanogenerator for wearable nano-tactile sensor. Nano Energy 2018, 53, 245–257. [Google Scholar] [CrossRef]
  13. Pan, H.H.; Wong, Y.-D.; Su, Y.-M. Piezoelectric cement sensor and impedance analysis for concrete health monitoring. In Proceedings of the Nondestructive Characterization and Monitoring of Advanced Materials, Aerospace, Civil Infrastructure, and Transportation XIII; International Society for Optics and Photonics: Bellingham, WA, USA, 2019; p. 109710Y. [Google Scholar]
  14. Bai, S.; Xu, Q.; Gu, L.; Ma, F.; Qin, Y.; Wang, Z.L. Single crystalline lead zirconate titanate (PZT) nano/micro-wire based self-powered UV sensor. Nano Energy 2012, 1, 789–795. [Google Scholar] [CrossRef]
  15. Yang, B.; Yi, Z.; Tang, G.; Liu, J. A gullwing-structured piezoelectric rotational energy harvester for low frequency energy scavenging. Appl. Phys. Lett. 2019, 115, 063901. [Google Scholar] [CrossRef]
  16. Yi, Z.; Xie, F.; Tian, Y.; Li, N.; Dong, X.; Ma, Y.; Huang, Y.; Hu, Y.; Xu, X.; Qu, D. A Battery-and Leadless Heart-Worn Pacemaker Strategy. Adv. Funct. Mater. 2020, 2000477. [Google Scholar] [CrossRef]
  17. Li, N.; Yi, Z.; Ma, Y.; Xie, F.; Huang, Y.; Tian, Y.; Dong, X.; Liu, Y.; Shao, X.; Li, Y. Direct powering a real cardiac pacemaker by natural energy of a heartbeat. ACS Nano 2019, 13, 2822–2830. [Google Scholar] [CrossRef]
  18. Shibata, T.; Unno, K.; Makino, E.; Ito, Y.; Shimada, S. Characterization of sputtered ZnO thin film as sensor and actuator for diamond AFM probe. Sens. Actuators A Phys. 2002, 102, 106–113. [Google Scholar] [CrossRef]
  19. Fu, Y.Q.; Luo, J.; Du, X.; Flewitt, A.; Li, Y.; Markx, G.; Walton, A.; Milne, W. Recent developments on ZnO films for acoustic wave based bio-sensing and microfluidic applications: A review. Sens. Actuators B Chem. 2010, 143, 606–619. [Google Scholar] [CrossRef]
  20. Tian, Y.; He, P.; Yang, B.; Yi, Z.; Lu, L.; Liu, J. A flexible piezoelectric strain sensor array with laser-patterned serpentine interconnects. IEEE Sens. J. 2020, 20, 8463–8468. [Google Scholar] [CrossRef]
  21. Song, K.; Zhao, R.; Wang, Z.L.; Yang, Y. Conjuncted Pyro-Piezoelectric Effect for Self-Powered Simultaneous Temperature and Pressure Sensing. Adv. Mater. 2019, 31, 1902831. [Google Scholar] [CrossRef]
  22. Jiang, J.; Tu, S.; Fu, R.; Li, J.; Hu, F.; Yan, B.; Gu, Y.; Chen, S. Flexible Piezoelectric Pressure Tactile Sensor Based on Electrospun BaTiO3/Poly (vinylidene fluoride) Nanocomposite Membrane. ACS Appl. Mater. Interfaces 2020, 12, 33989–33998. [Google Scholar] [CrossRef] [PubMed]
  23. Gullapalli, H.; Vemuru, V.S.; Kumar, A.; Botello-Mendez, A.; Vajtai, R.; Terrones, M.; Nagarajaiah, S.; Ajayan, P.M. Flexible piezoelectric ZnO–paper nanocomposite strain sensor. Small 2010, 6, 1641–1646. [Google Scholar] [CrossRef] [PubMed]
  24. Tian, G.; Deng, W.; Gao, Y.; Xiong, D.; Yan, C.; He, X.; Yang, T.; Jin, L.; Chu, X.; Zhang, H. Rich lamellar crystal baklava-structured PZT/PVDF piezoelectric sensor toward individual table tennis training. Nano Energy 2019, 59, 574–581. [Google Scholar] [CrossRef]
  25. Pi, Z.; Zhang, J.; Wen, C.; Zhang, Z.-B.; Wu, D. Flexible piezoelectric nanogenerator made of poly (vinylidenefluoride-co-trifluoroethylene)(PVDF-TrFE) thin film. Nano Energy 2014, 7, 33–41. [Google Scholar] [CrossRef]
  26. Lu, L.; Yang, B.; Zhai, Y.; Liu, J. Electrospinning core-sheath piezoelectric microfibers for self-powered stitchable sensor. Nano Energy 2020, 76, 104966. [Google Scholar] [CrossRef]
  27. Lu, L.; Ding, W.; Liu, J.; Yang, B. Flexible PVDF based piezoelectric nanogenerators. Nano Energy 2020, 105251. [Google Scholar] [CrossRef]
  28. Dario, P.; De Rossi, D. Tactile sensors and the gripping challenge: Increasing the performance of sensors over a wide range of force is a first step toward robotry that can hold and manipulate objects as humans do. IEEE Spectr. 1985, 22, 46–53. [Google Scholar] [CrossRef]
  29. Tian, H. A robot attached the soft sensor using PVDF film for objects discrimination. Integr. Ferroelectr. 2018, 192, 94–102. [Google Scholar] [CrossRef]
  30. Chuang, C.-H.; Wang, M.-S.; Yu, Y.-C.; Mu, C.-L.; Lu, K.-F.; Lin, C.-T. Flexible tactile sensor for the grasping control of robot fingers. In Proceedings of the 2013 International Conference on Advanced Robotics and Intelligent Systems, Tainan, Taiwan, 31 May–2 June 2013; pp. 141–146. [Google Scholar]
  31. Baek, H.J.; Chung, G.S.; Kim, K.K.; Park, K.S. A smart health monitoring chair for nonintrusive measurement of biological signals. IEEE Trans. Inf. Technol. Biomed. 2011, 16, 150–158. [Google Scholar] [CrossRef]
  32. Maity, K.; Garain, S.; Henkel, K.; Schmeißer, D.; Mandal, D. Self-Powered Human-Health Monitoring through Aligned PVDF Nanofibers Interfaced Skin-Interactive Piezoelectric Sensor. ACS Appl. Polym. Mater. 2020, 2, 862–878. [Google Scholar] [CrossRef]
  33. Yi, Z.; Zhang, Y.; Peters, J. Bioinspired tactile sensor for surface roughness discrimination. Sens. Actuators A Phys. 2017, 255, 46–53. [Google Scholar] [CrossRef]
  34. Koç, İ.M.; Akça, E. Design of a piezoelectric based tactile sensor with bio-inspired micro/nano-pillars. Tribol. Int. 2013, 59, 321–331. [Google Scholar]
  35. Deng, C.; Tang, W.; Liu, L.; Chen, B.; Li, M.; Wang, Z.L. Self-Powered Insole Plantar Pressure Mapping System. Adv. Funct. Mater. 2018, 28, 1801606. [Google Scholar] [CrossRef]
  36. Chen, X.; Shao, J.; Tian, H.; Li, X.; Wang, C.; Luo, Y.; Li, S. Scalable Imprinting of Flexible Multiplexed Sensor Arrays with Distributed Piezoelectricity-Enhanced Micropillars for Dynamic Tactile Sensing. Adv. Mater. Technol. 2020, 2000046. [Google Scholar] [CrossRef]
  37. Deng, W.; Jin, L.; Zhang, B.; Chen, Y.; Mao, L.; Zhang, H.; Yang, W. A flexible field-limited ordered ZnO nanorod-based self-powered tactile sensor array for electronic skin. Nanoscale 2016, 8, 16302–16306. [Google Scholar] [CrossRef]
  38. Yamashita, T.; Okada, H.; Kobayashi, T.; Togashi, K.; Zymelka, D.; Takamatsu, S.; Itoh, T. Ultra-thin piezoelectric strain sensor array integrated on flexible printed circuit for structural health monitoring. In Proceedings of the 2016 IEEE SENSORS, Orlando, FL, USA, 30 October–3 November 2016; pp. 1–3. [Google Scholar]
  39. Jung, Y.H.; Hong, S.K.; Wang, H.S.; Han, J.H.; Pham, T.X.; Park, H.; Kim, J.; Kang, S.; Yoo, C.D.; Lee, K.J. Flexible piezoelectric acoustic sensors and machine learning for speech processing. Adv. Mater. 2019, 1904020. [Google Scholar] [CrossRef]
  40. Zhu, M.; Sun, Z.; Zhang, Z.; Shi, Q.; He, T.; Liu, H.; Chen, T.; Lee, C. Haptic-feedback smart glove as a creative human-machine interface (HMI) for virtual/augmented reality applications. Sci. Adv. 2020, 6, eaaz8693. [Google Scholar] [CrossRef]
  41. Zhu, M.; He, T.; Lee, C. Technologies toward next generation human machine interfaces: From machine learning enhanced tactile sensing to neuromorphic sensory systems. Appl. Phys. Rev. 2020, 7, 031305. [Google Scholar] [CrossRef]
  42. Shi, Q.; Zhang, Z.; He, T.; Sun, Z.; Wang, B.; Feng, Y.; Shan, X.; Salam, B.; Lee, C. Deep learning enabled smart mats as a scalable floor monitoring system. Nat. Commun. 2020, 11, 1–11. [Google Scholar] [CrossRef]
  43. Booth, R.; Goldsmith, P. A Wrist-Worn Piezoelectric Sensor Array for Gesture Input. J. Med. Biol. Eng. 2018, 38, 284–295. [Google Scholar] [CrossRef]
  44. Meyer, J.; Lukowicz, P.; Troster, G. Textile pressure sensor for muscle activity and motion detection. In Proceedings of the 2006 10th IEEE International Symposium on Wearable Computers, Montreux, Switzerland, 11–14 October 2006; pp. 69–72. [Google Scholar]
  45. Li, T.; Shi, C.; Ren, H. A High-Sensitivity Tactile Sensor Array Based on Fiber Bragg Grating Sensing for Tissue Palpation in Minimally Invasive Surgery. IEEE/ASME Trans. Mechatron. 2018, 23, 2306–2315. [Google Scholar] [CrossRef]
  46. Ding, B.-B.; Wu, X.-M.; Han, X.-C.; Chen, J.-Y. Studies on strain sensing properties of PVDF piezoelectric films. In Proceedings of the 2017 Symposium on Piezoelectricity, Acoustic Waves, and Device Applications (SPAWDA), Chengdu, China, 27–30 October 2017; pp. 155–158. [Google Scholar]
  47. Krizhevsky, A.; Sutskever, I.; Hinton, G.E. Imagenet classification with deep convolutional neural networks. Proc. Adv. Neural Inform. Process. Syst. 2017, 1097–1105. [Google Scholar] [CrossRef]
  48. Liaw, A.; Wiener, M. Classification and regression by randomForest. R News 2002, 2, 18–22. [Google Scholar]
  49. Schmitz, A.; Bansho, Y.; Noda, K.; Iwata, H.; Sugano, S. Tactile object recognition using deep learning and dropout. In Proceedings of the 2014 IEEE-RAS International Conference on Humanoid Robots, Madrid, Spain, 18–20 November 2014. [Google Scholar]
  50. Islam, M.R.U.; Bai, S. Intention detection for dexterous human arm motion with FSR sensor bands. In Proceedings of the Companion of the 2017 ACM/IEEE International Conference on Human-Robot Interaction, Vienna, Austria, 6–9 March 2017; pp. 139–140. [Google Scholar]
  51. Schneider, A.; Sturm, J.; Stachniss, C.; Reisert, M.; Burkhardt, H.; Burgard, W. Object identification with tactile sensors using bag-of-features. In Proceedings of the 2009 IEEE/RSJ International Conference on Intelligent Robots and Systems, St. Louis, MO, USA, 10–15 October 2009; pp. 243–248. [Google Scholar]
Figure 1. (a) Schematics of the cross-shaped sensor array. (b) Photograph of the fabricated crossed-shaped P(VDF-TrFE) based sensor array with a shared bottom electrode, where the inset describes the labels of the five sensor units. (c) Photograph of the flexibility of the sensor array.
Coatings 10 01094 g001
Figure 2. Fabrication process of the cross-shaped sensor array.
Coatings 10 01094 g002
Figure 3. (a) Photograph of the experimental platform of periodic compressing–releasing testing and device in compressing state; (b) Simulation of stress distribution of the piezoelectric thin film when the free-end clamp moves to the maximum compression displacement; (c) The output signals of each sensor unit of the cross-shaped sensor array; (d) The average peak-to-peak voltage signal of five sensor units.
Coatings 10 01094 g003
Figure 4. (a) Photograph of the experiment platform of the positive compression test; (b) The peak-to-peak voltage of the sensor unit at different pressure of the exciter, and their least squares linear fitting results.
Coatings 10 01094 g004
Figure 5. Activity monitoring for slow walking, fast walking, jogging, and jumping.
Coatings 10 01094 g005
Figure 6. The signal of different types of touch. (a) Schematic diagram, (b) piezoelectric signal and (c) partially enlarged diagram of fingers part contacting with the sensor array. (d) Schematic diagram, (e) piezoelectric signal and (f) partially enlarged diagram of palm part contacting with the sensor array. (g) Schematic diagram, (h) piezoelectric signal and (i) partially enlarged diagram of wrist part contacting with the sensor array.
Coatings 10 01094 g006
Figure 7. The structure of random forest model used in this article.
Coatings 10 01094 g007
Table 1. The sensor unit sensitivity consistency result.
MetricMIN–MAX RatioSTD Ratio
This work11.3%4.6%
Li et al. [45]65.2%27.2%
Tian et al. [20]91.0%31.9%
Table 2. The recognition accuracy in different situations.
CategoryFingerPalmWristModel
Sensor Array93.3%96.6%96.6%95.5%
Single sensor80.0%83.3%90.0%84.4%
Publisher’s Note: MDPI stays neutral with regard to jurisdictional claims in published maps and institutional affiliations.

