Article

Experiment Study on Topological Characteristics of Sandstone Coating by Micro CT

1
State Key Laboratory for Geomechanics and Deep Underground Engineering, China University of Mining and Technology, Xuzhou 221116, China
2
Mechanics and Civil Engineering Institute, China University of Mining and Technology, Xuzhou 221116, China
3
Laboratory of Mine Cooling and Coal-Heat Integrated Exploitation, China University of Mining and Technology, Xuzhou 221116, China
*
Author to whom correspondence should be addressed.
Coatings 2020, 10(12), 1143; https://doi.org/10.3390/coatings10121143
Submission received: 27 October 2020 / Revised: 17 November 2020 / Accepted: 19 November 2020 / Published: 24 November 2020
(This article belongs to the Special Issue Mechanical Properties of Advanced Multifunctional Coatings)

Abstract

:
The pore structure is an important factor of tunnel coating failure, cracking and water leakage. Some investigations on the statistical law of pores and pore networks have been conducted, but little quantitative analysis is observed on topology structure of the pore network, and even the pore structure of sandstone is complex and cross-scale distributed. Therefore, it is of theoretical and engineering significance to quantitatively characterize the connectivity of the pore network in sandstone. This study proposes a new complex network theory to analyze the three-dimensional nature of pore network structure in sandstone. The topological network structure, such as clustering degree, average path length and the module, which cannot be analyzed by traditional coordination number and fractal dimension methods, is analyzed. Numerical simulation results show that a scale-free network model is more suitable for describing the sandstone pore network than random models. The pore network of sandstone has good uniformity. The connectivity of sandstone pore networks has great potential for permeability enhancement. Therefore, this new method provides a way to deeply understand the pore connectivity characteristics of sandstone and to explore the distribution of crack grids in the arch of tunnel coatings.

1. Introduction

An important problem in tunnels is how to effectively reduce the coating leakage, so the connectivity of rock pore structure and the waterproof materials in the coating are the key issues [1,2,3]. The structure of the rock pore network is the result of the interaction among its physical and chemical properties, and external stress environments. Rock has large numbers of pores, whose shapes and connected structures are complex [4,5,6]. How to comprehensively and quantitatively characterize the three-dimensional pore structure and explore the topological characteristics of effective seepage networks is of important theoretical significance and engineering application value [7]. This can help us to reveal the seepage mechanism and effectively reduce the leakage in tunnels [8,9,10,11].
In recent years, a lot of studies have been conducted on the statistical characteristics and evolution model of rock pore structure [12,13,14,15,16]. Blunt and Raeini [4,17] developed a generalized network extraction method for three-dimensional digital core to reduce the uncertainties of modeling. Using a focused ion beam scanning electron microscope (FIB-SEM), Shaina et al. [18] obtained a microscale shale digital core and compared it with the conventional scanning electron microscopy. The porosity, organic content and pore connectivity were studied. Hajizadeh [19] took the CT(computerized tomography) scan image data of sandstone as a sample of a statistical method. They coupled the continuous two-dimensional multi-point statistical simulation with the multi-scale data extraction program, and proposed a random reconstruction technique for porous media. As the traditional Darcy law is no longer suitable for dense rock, Civan et al. [20] used the modified Darcy law to describe the gas migration in dense shale. The apparent permeability is a function of intrinsic permeability and porosity. Zhang et al. [21] considered the basic concept of a pore network model and proposed a modeling method based on pore volume and throat searching. They combined the pore network model with the percolation theory to calculate the permeability of different models. Ju et al. [22] used fractal control function to describe the complex morphology of rock pore structure, and proposed a fractal reconstruction model of rock pore structure with an improved simulated annealing algorithm. From the pore number per unit volume, porosity, average pore size, pore volume, minimum maximum pore radius and minimum average pore radius, Gong et al. [23] analyzed the pore radius and average pore shape factor of the eight pore structure parameters of sandstone pore structure characteristics. Usually, nuclear magnetic resonance and CT images are used to extract the three-dimensional structure of rock pores, and the quantitative results describe the pore structure of rocks by specific surface area, surface roughness and fractal dimension. However, the selection of seepage path and pore community structure cannot be quantified.
As the main component of spraying materials for tunnel coating materials, the pore structure characteristics of sandstone play a key role in the deformation and permeability of tunnel coatings. In this study, the topological characteristics and correlation properties of pore networks are analyzed by a new method—complex network theory. Three new network parameters of sandstone with different porosity are analyzed: (1) degree distribution; (2) modularity; (3) degree of pore aggregation. This proposed method can quantitatively analyze the structure parameters which cannot be quantified by traditional connectivity analysis and fractal dimension analysis. This provides a new way to further understand the mechanism of the pore network structure characteristics to the macroscopic permeability. A new method for sorting the importance of sandstone pores, called “eigenvector centrality”, is given and provides a basis for revealing the microscopic mechanism of porous rock seepage.

2. Basic Information of Sandstone Pore Network

2.1. Sandstone Network Extraction

This study uses the experimental data of a sandstone core which were obtained by Professor Blunt of Imperial College London. Micro CT produced by the German Phoenix company was used to analyze the image, which is equipped with a 1 m focus system with a view of 512 × 512 pixels with a 0.2 m 16-bit detector. The tomographic images were generated by X-ray radiation, and then transferred into binary images according to the porosity of each sample. Four sandstone samples with porosities of 14.1%, 16.9%, 17.1% and 24.6% are used in our study. The sandstone networks are extracted from the 3D digital core. The network scale is 3 mm by 3 mm by 3 mm, which was chosen from the cubes inside the four samples.
More than 4000 nodes were extracted from each core. In order to analyze the effective seepage network, the following two corrections are made in this study. Firstly, isolated pores, which are not connected with the main network, are ignored. This is because the isolated pores do not influence the seepage process. They were removed during the pore network construction of sandstone. Then, ring-shaped throats are deleted. The three-dimensional sandstone pore networks of the four digital cores are obtained based on the above calculations and shown in Figure 1 [24].

2.2. Basic Parameters of Sandstone Networks in Complex Network Theory

The rock pore structure is commonly described in quantitative analysis by porosity, pore diameter, pore throat radius, specific surface area, Euler number and coordination number [25,26,27]. However, the network topological properties are yet to be found. This study uses complex network theory to study the quantitative characterization of the sandstone pore structure. The basic information of the pore network structure of sandstone is firstly analyzed. The analysis results are listed in Table 1.
This table shows that the pore network properties of sandstone are mainly related to network size (nodal number) rather than sandstone porosity. When the scale of the network increases, the diameter of the network and the average path length grow correspondingly. In complex network theory, the degree k of node i is used to express the connectivity of the node. It is defined as the number of other nodes connected with this node. The average degree of all nodes in the network is called the average degree of the network (denoted as k ). Because the contribution of each pair of edges is 2, the average degree of the network is:
k = 1 N i = 1 N k i = 2 M N
where M represents the number of edges of the network; N represents the number of nodes of the network.
The network diameter D and the average path length L are also used to measure the network transmission efficiency. The maximum value of the shortest path length d between any two nodes in the network is called the network diameter:
D = max i , j ( d i j )
The distance between any two nodes in a network is defined as the number of edges of the shortest path between the two nodes. The average path length L is defined as the average distance between all nodes in a network:
L = 2 N ( N 1 ) i = 1 N 1 j = i + 1 N d i j
Further, network density is used to describe the degree of denseness between nodes in a network. It is defined as the ratio of the actual number of edges to the upper limit of the number of edges in the network:
ρ = 2 M N ( N 1 )
According to Table 1, the network diameter and average path length of the sandstone pore network are large, but the network density is small. So, the network structure connectivity of the sandstone pore network is much smaller than that of the global coupling network (any two nodes are connected).

3. Sandstone Network Structure Analysis in Complex Network Theory

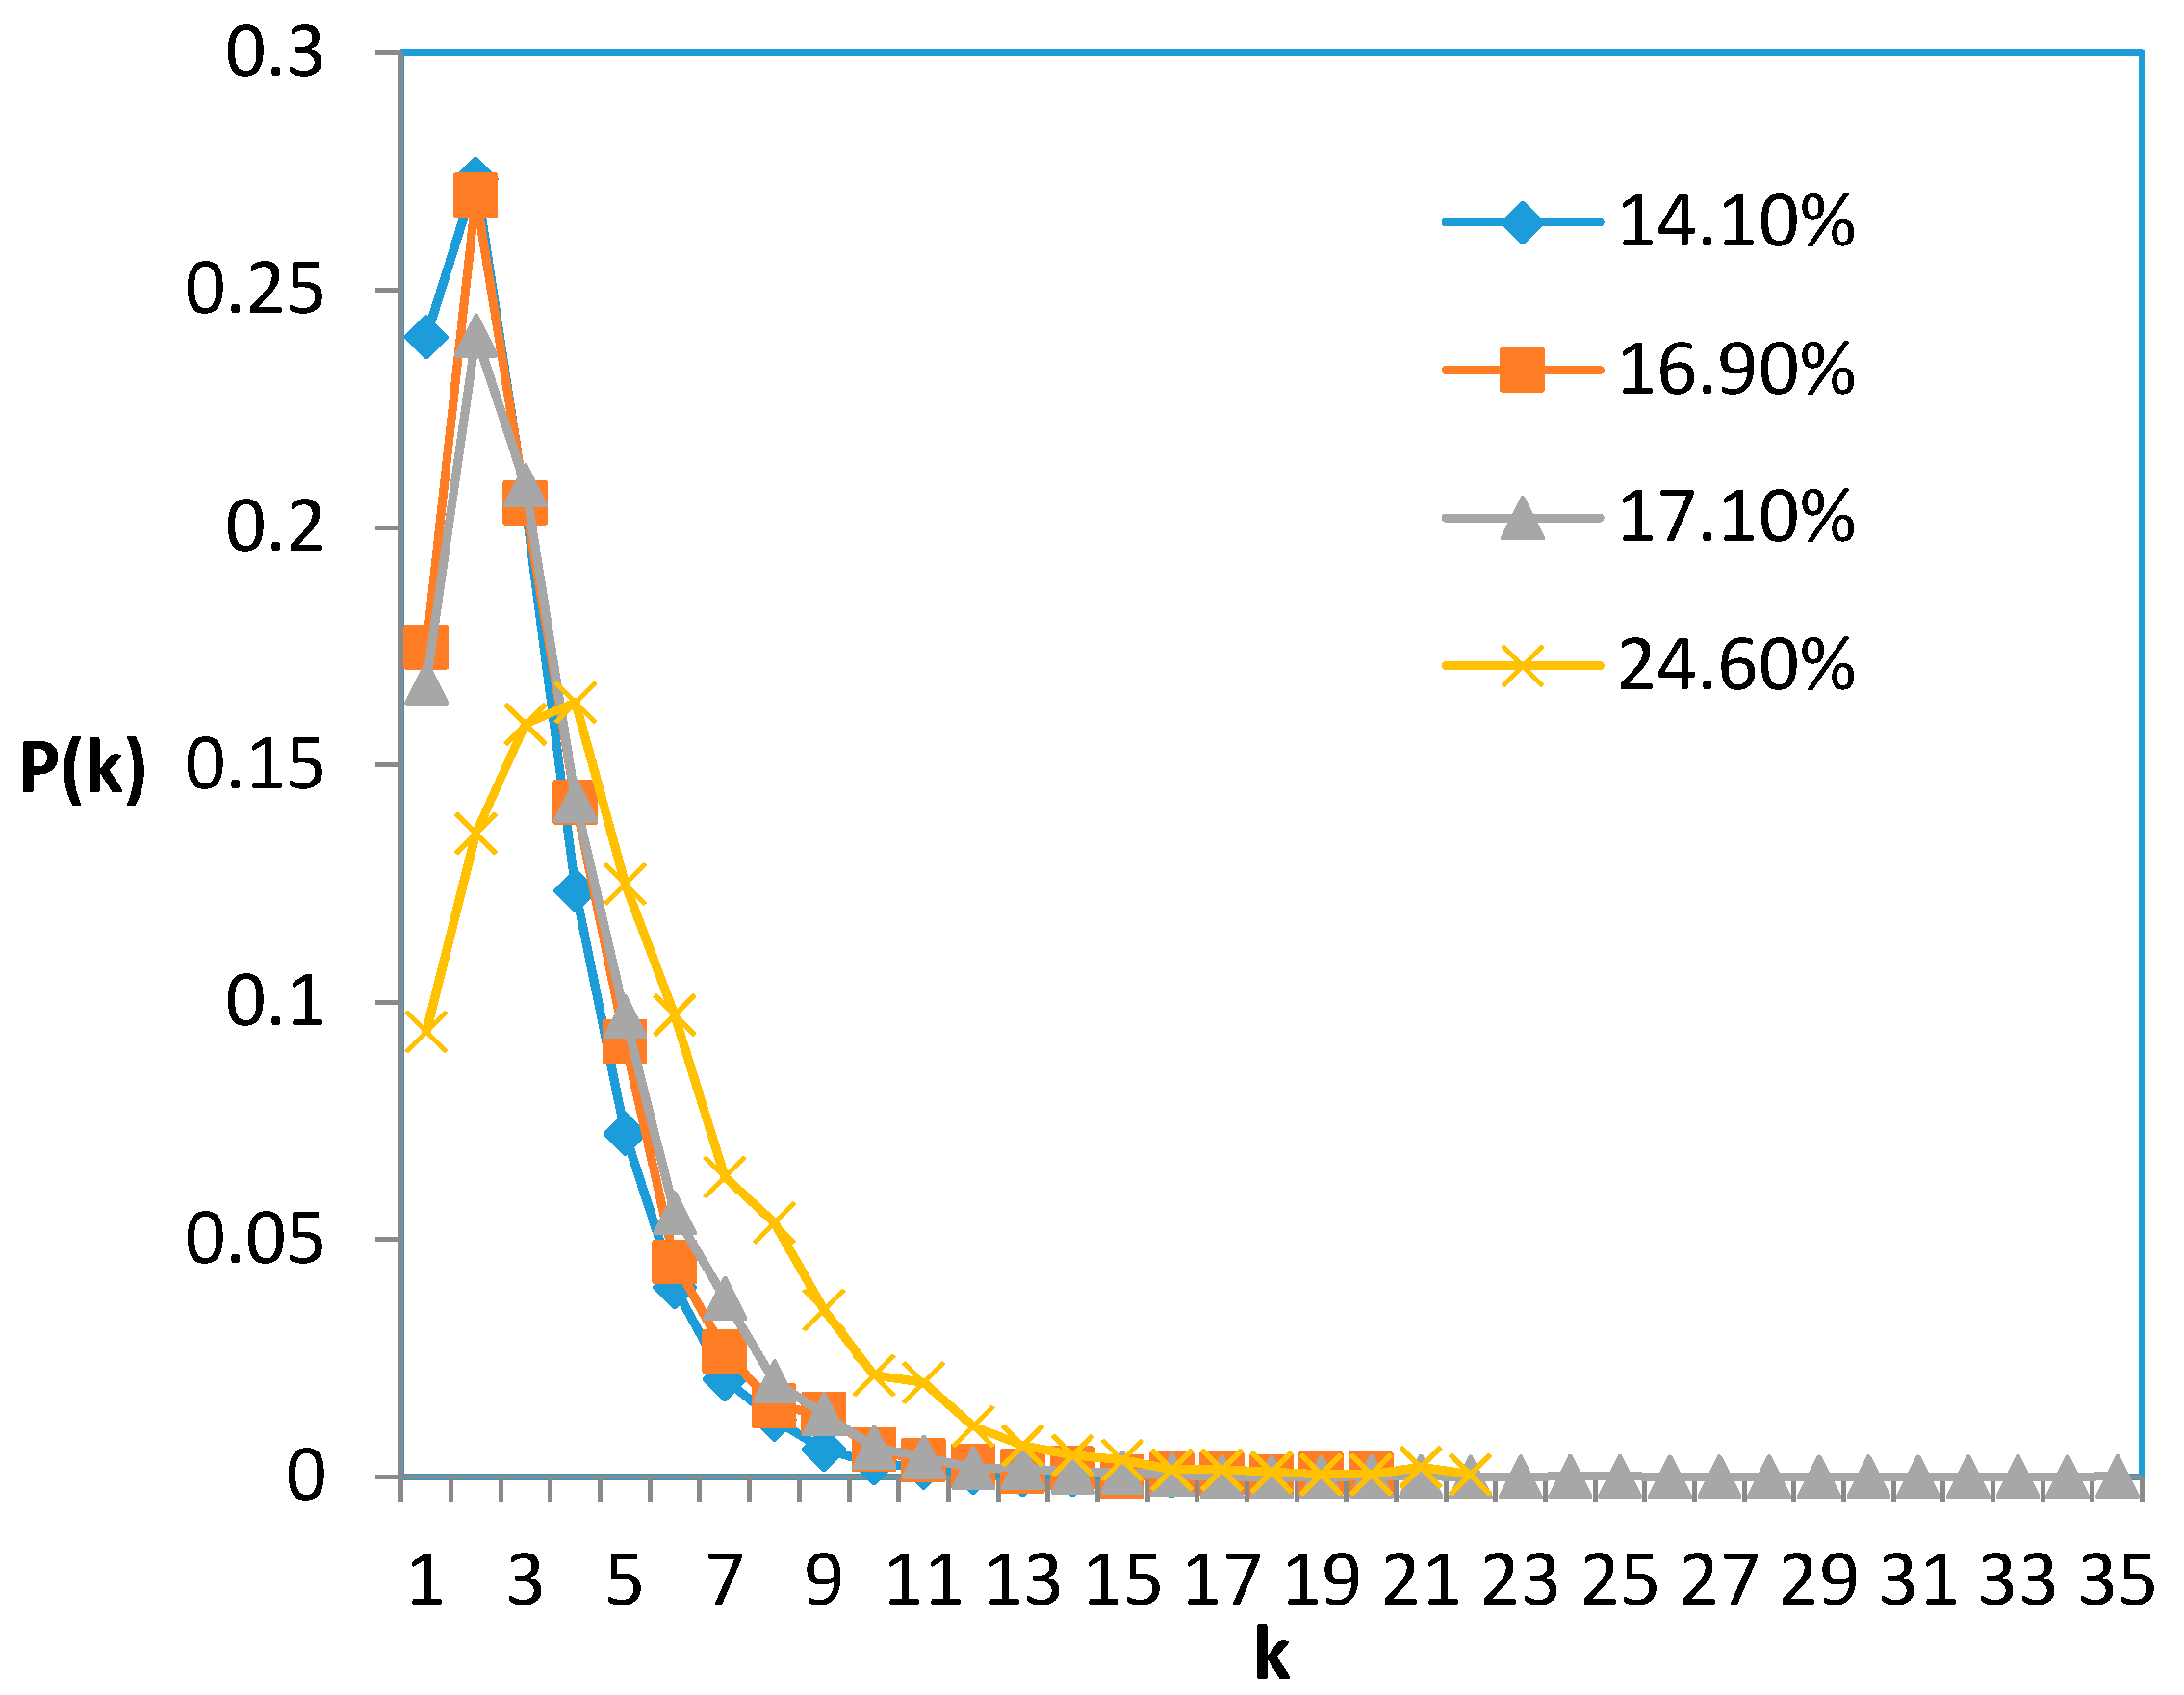
In order to further analyze the microstructure characteristics of the sandstone pore network, the degree distributions of nodes in the network are analyzed. Figure 2 is the degree distribution of three-dimensional pore networks of the four sandstone cores. The degree distributions of the sandstone pore network are single-peaked curves, but the sandstone pore networks have different characteristic values which are variable with porosity. When the porosities are 14.1%, 16.9% and 17.1%, the nodes have a moderate proportion which has a degree of 2. When the porosity is 24.6%, the highest proportion of nodes is the nodes whose degree is 4. When the degree exceeds these values, the number of nodes decreases abruptly.
According to the density of the number of edges among nodes, a network can be divided into different groups called communities. For the community structure identification in the network, different algorithms have been put forward, such as the hierarchical clustering method and shortest path betweenness method. The shortest path betweenness method can not only give the results of community structure division, but also give the evaluation of this division. This is called modularity.
A symmetric matrix E = ( e i j ) is defined, in which the element e i j represents the proportion of the edges of the i community and the j community in all edges of the network. The sum of the elements on the diagonal is T r E = i e i j , which represents the proportion of the edges between the nodes in a community within all edges. The sum of the elements in each row is a i = j e i j , indicating the proportion of the edges connected to the nodes in the i community in all edges. On this basis, the definition of modularity is given:
Q = i ( e i j a i 2 )
Modularity measures the difference between the proportion of the inner edge of the community and the proportion among communities. When the proportion of the inner edge of the community is equal to that of the edge among the community, there is Q = 0 , which means that there is no obvious difference of the proportion between the inside and outside edges of the community, and there is no obvious community. On the contrary, if Q 1 , the proportion of the inner side of the community is much higher, indicating that the division of the community is very obvious. Usually, when Q 0.3 , there is an obvious community structure.
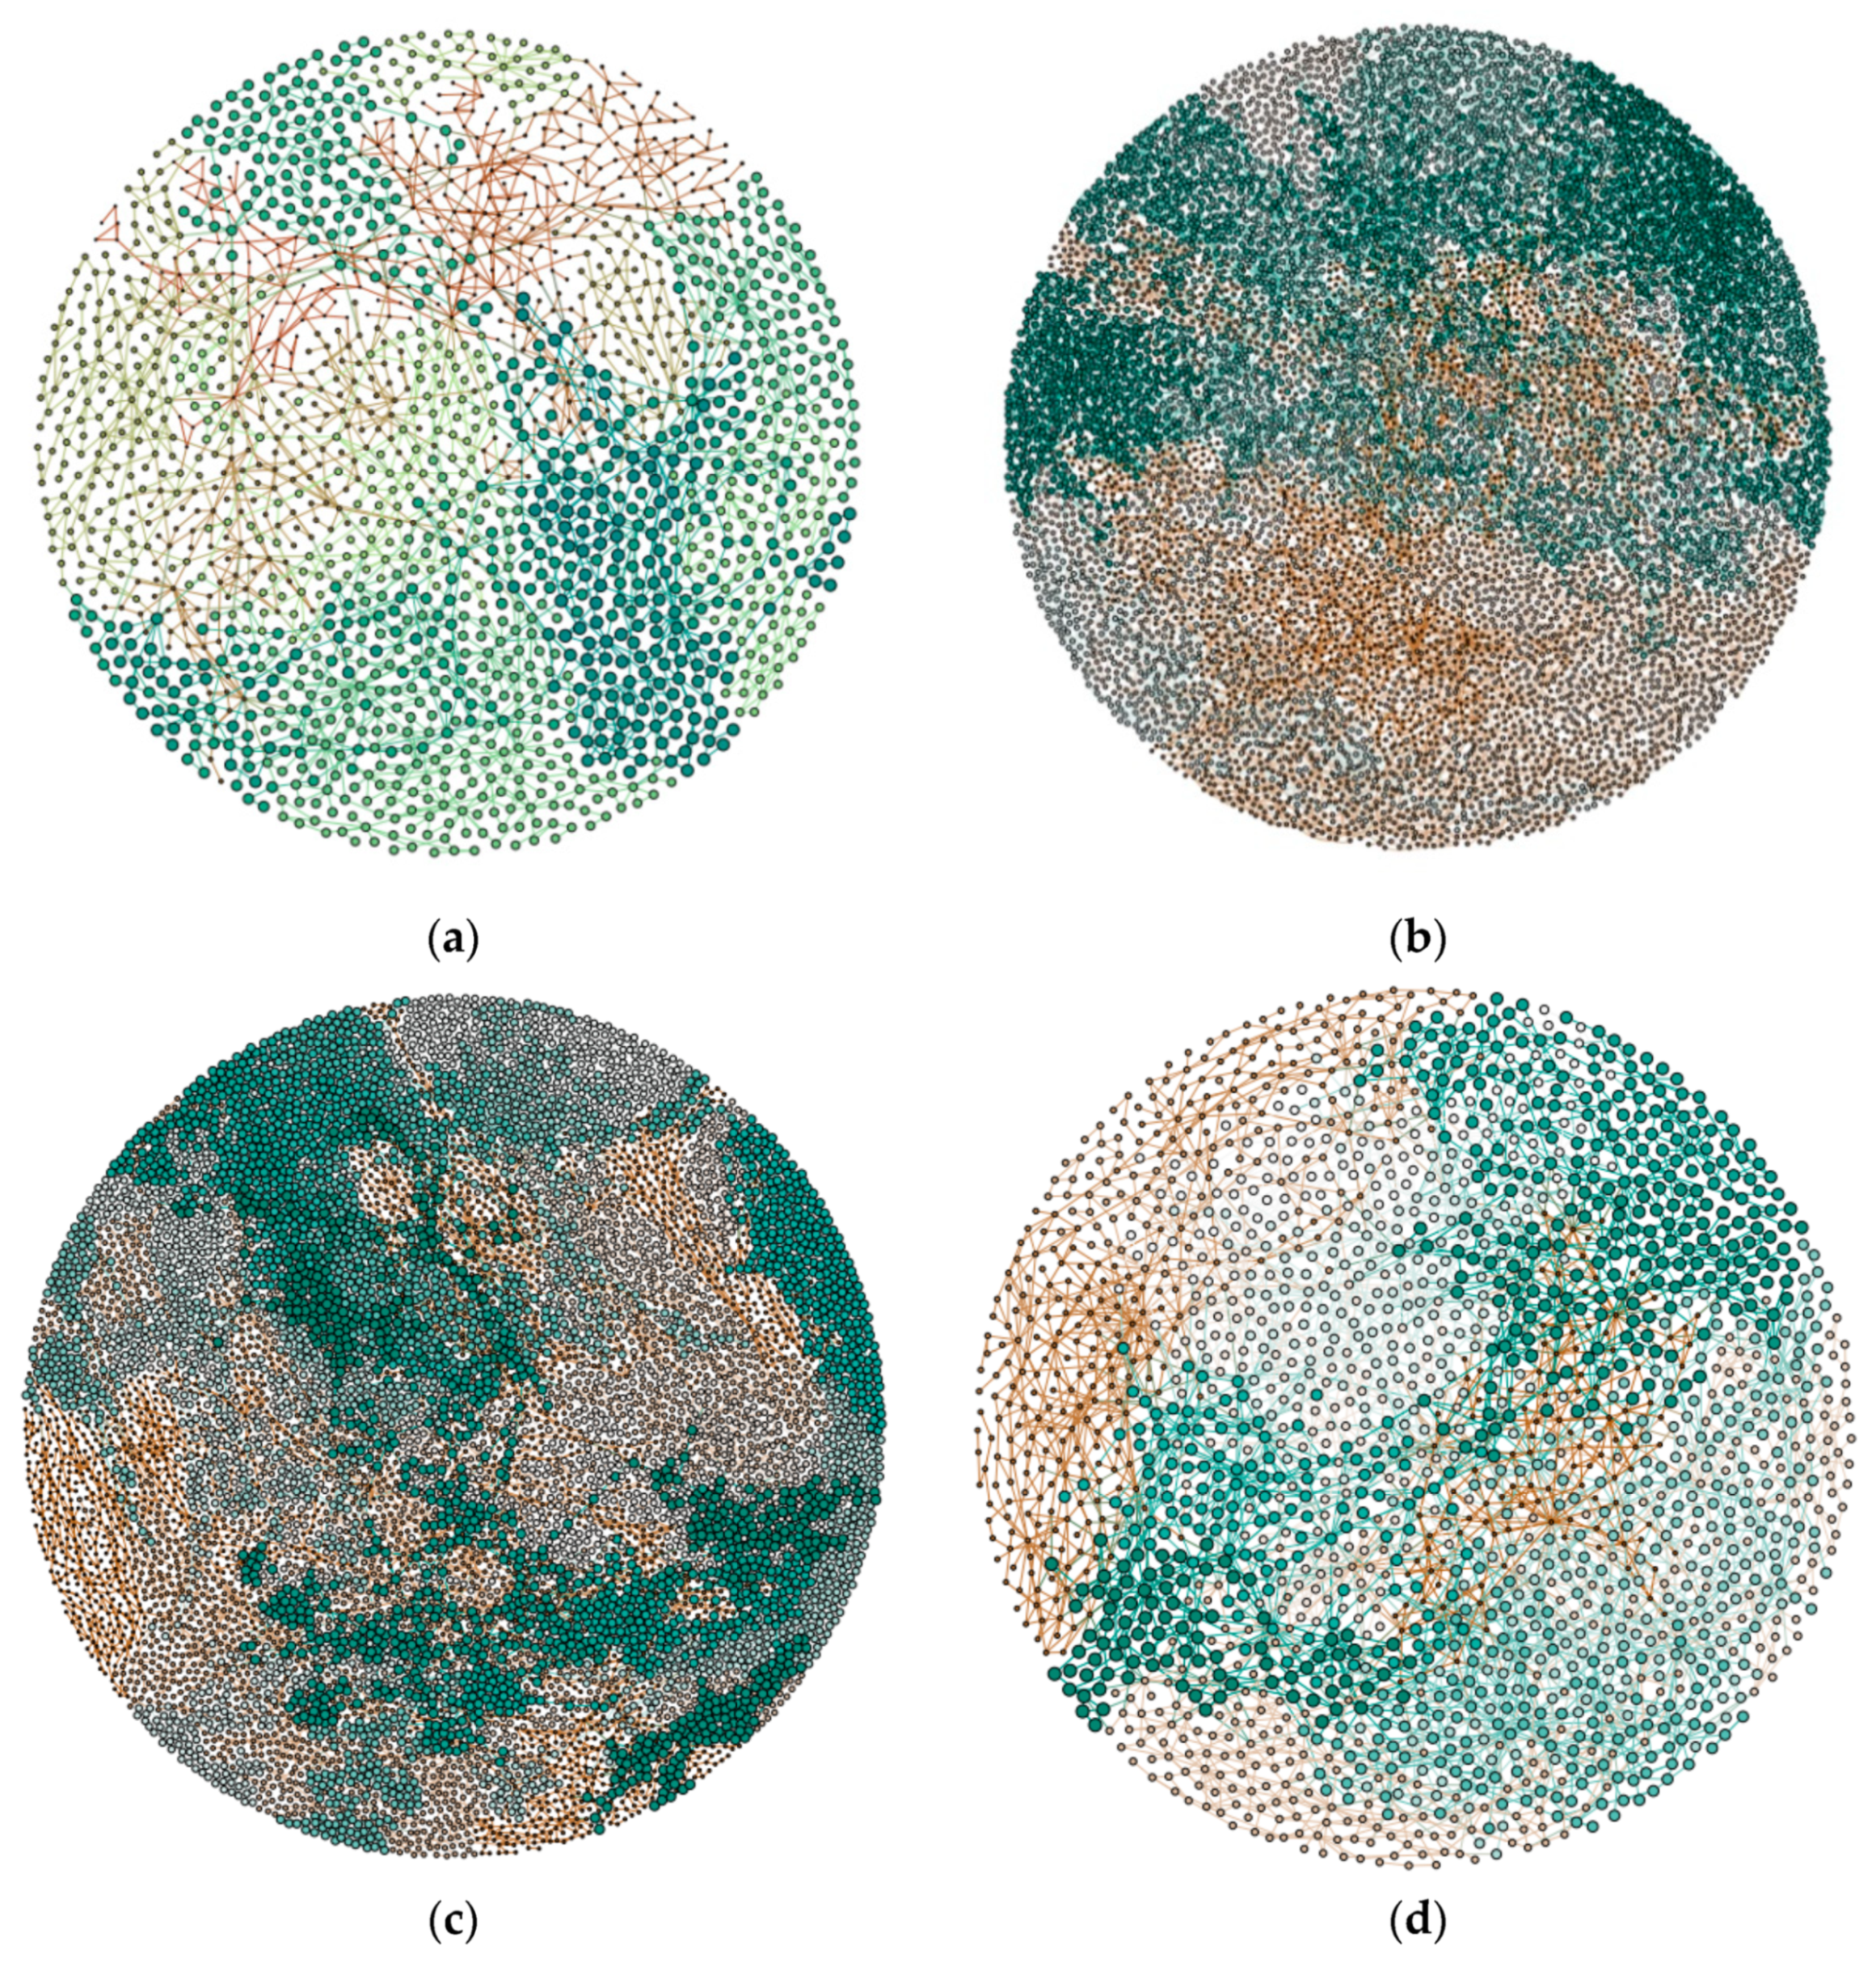
The modularity of each network is calculated and shown in Figure 3. When the porosity of the sandstone is 17.1%, its pore network module is approximately equal to 0.919 and the pore size of different sandstone pore networks is close to 1. This shows that the sandstone pore network has a good community structure. The nodes are grouped according to different societies, and the results are shown in Figure 4, where the same community nodes are of the same color and size.
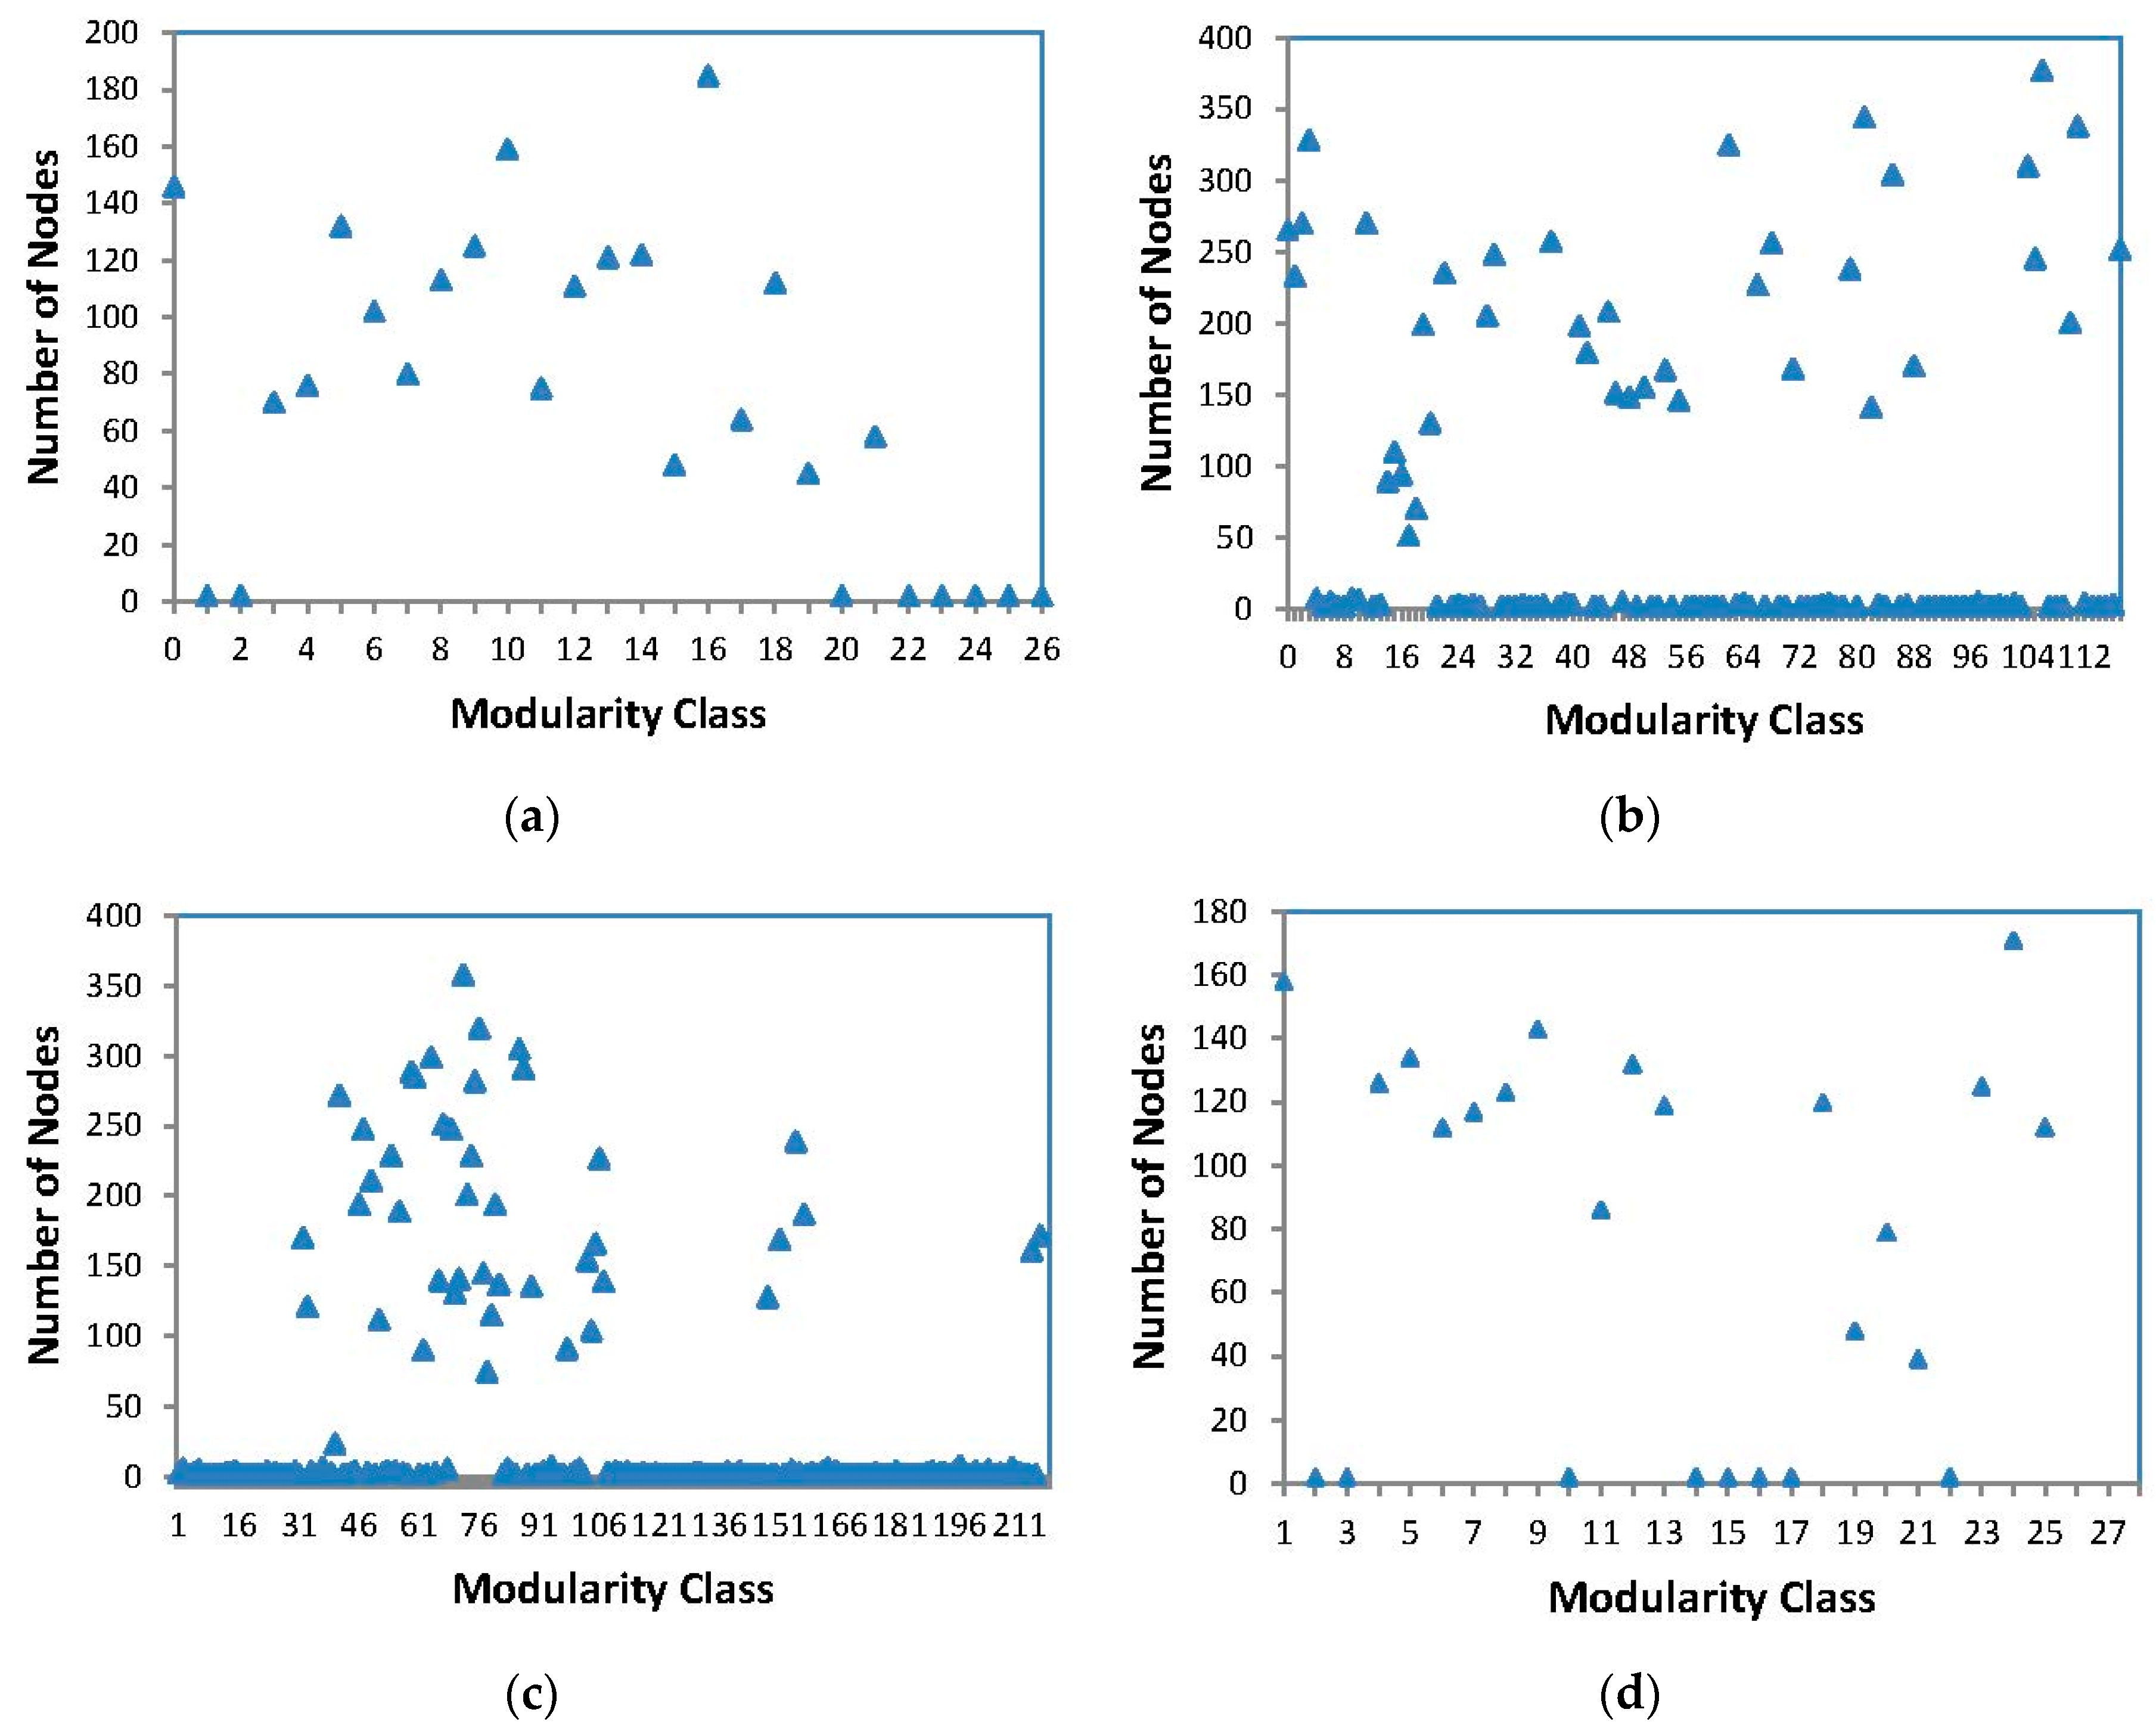
As shown in Figure 5, when the porosity is 14.1% and 24.6%, the number of nodes in the pore network is less, and the number of nodes in each community is less than 200, which is about 1/10 of the total number of nodes. When the porosity is 16.9% and 17.1%, with the increase in network size, the number of nodes in a single community increases obviously. In the four samples, when the porosity is 16.9% and modularity class is 110, the maximum number of nodes in the network community is about 375, less than 1/20 of the total number of nodes. These show that sandstone pore network distribution is uniform, and there is no phenomenon that some communities play a leading role in the whole sandstone network.
For the further measurement of the sandstone pore network transmission mechanism of the recovery enhancement, Liu [15] has carried out quantitative analysis for the pore structure by fractal dimension. However, the discussion about the microscopic connectivity characteristic of the sandstone pore network is sparce. This study chooses the clustering coefficient related to transmission efficiency to analyze the sandstone pore network. The clustering coefficient is the coefficient that indicates the degree of node aggregation in a graph. In the network of reality, the higher the clustering coefficient, the more nodes tend to be closely connected. In the network, if the node i is connected to the node i + 1 and the node i + 1 is connected to the node i + 2 , the node i + 2 may be connected to i . This phenomenon reflects the connection density between nodes. In an undirected network, the clustering coefficients can be expressed as:
C = n C k 2 = 2 n k ( k 1 )
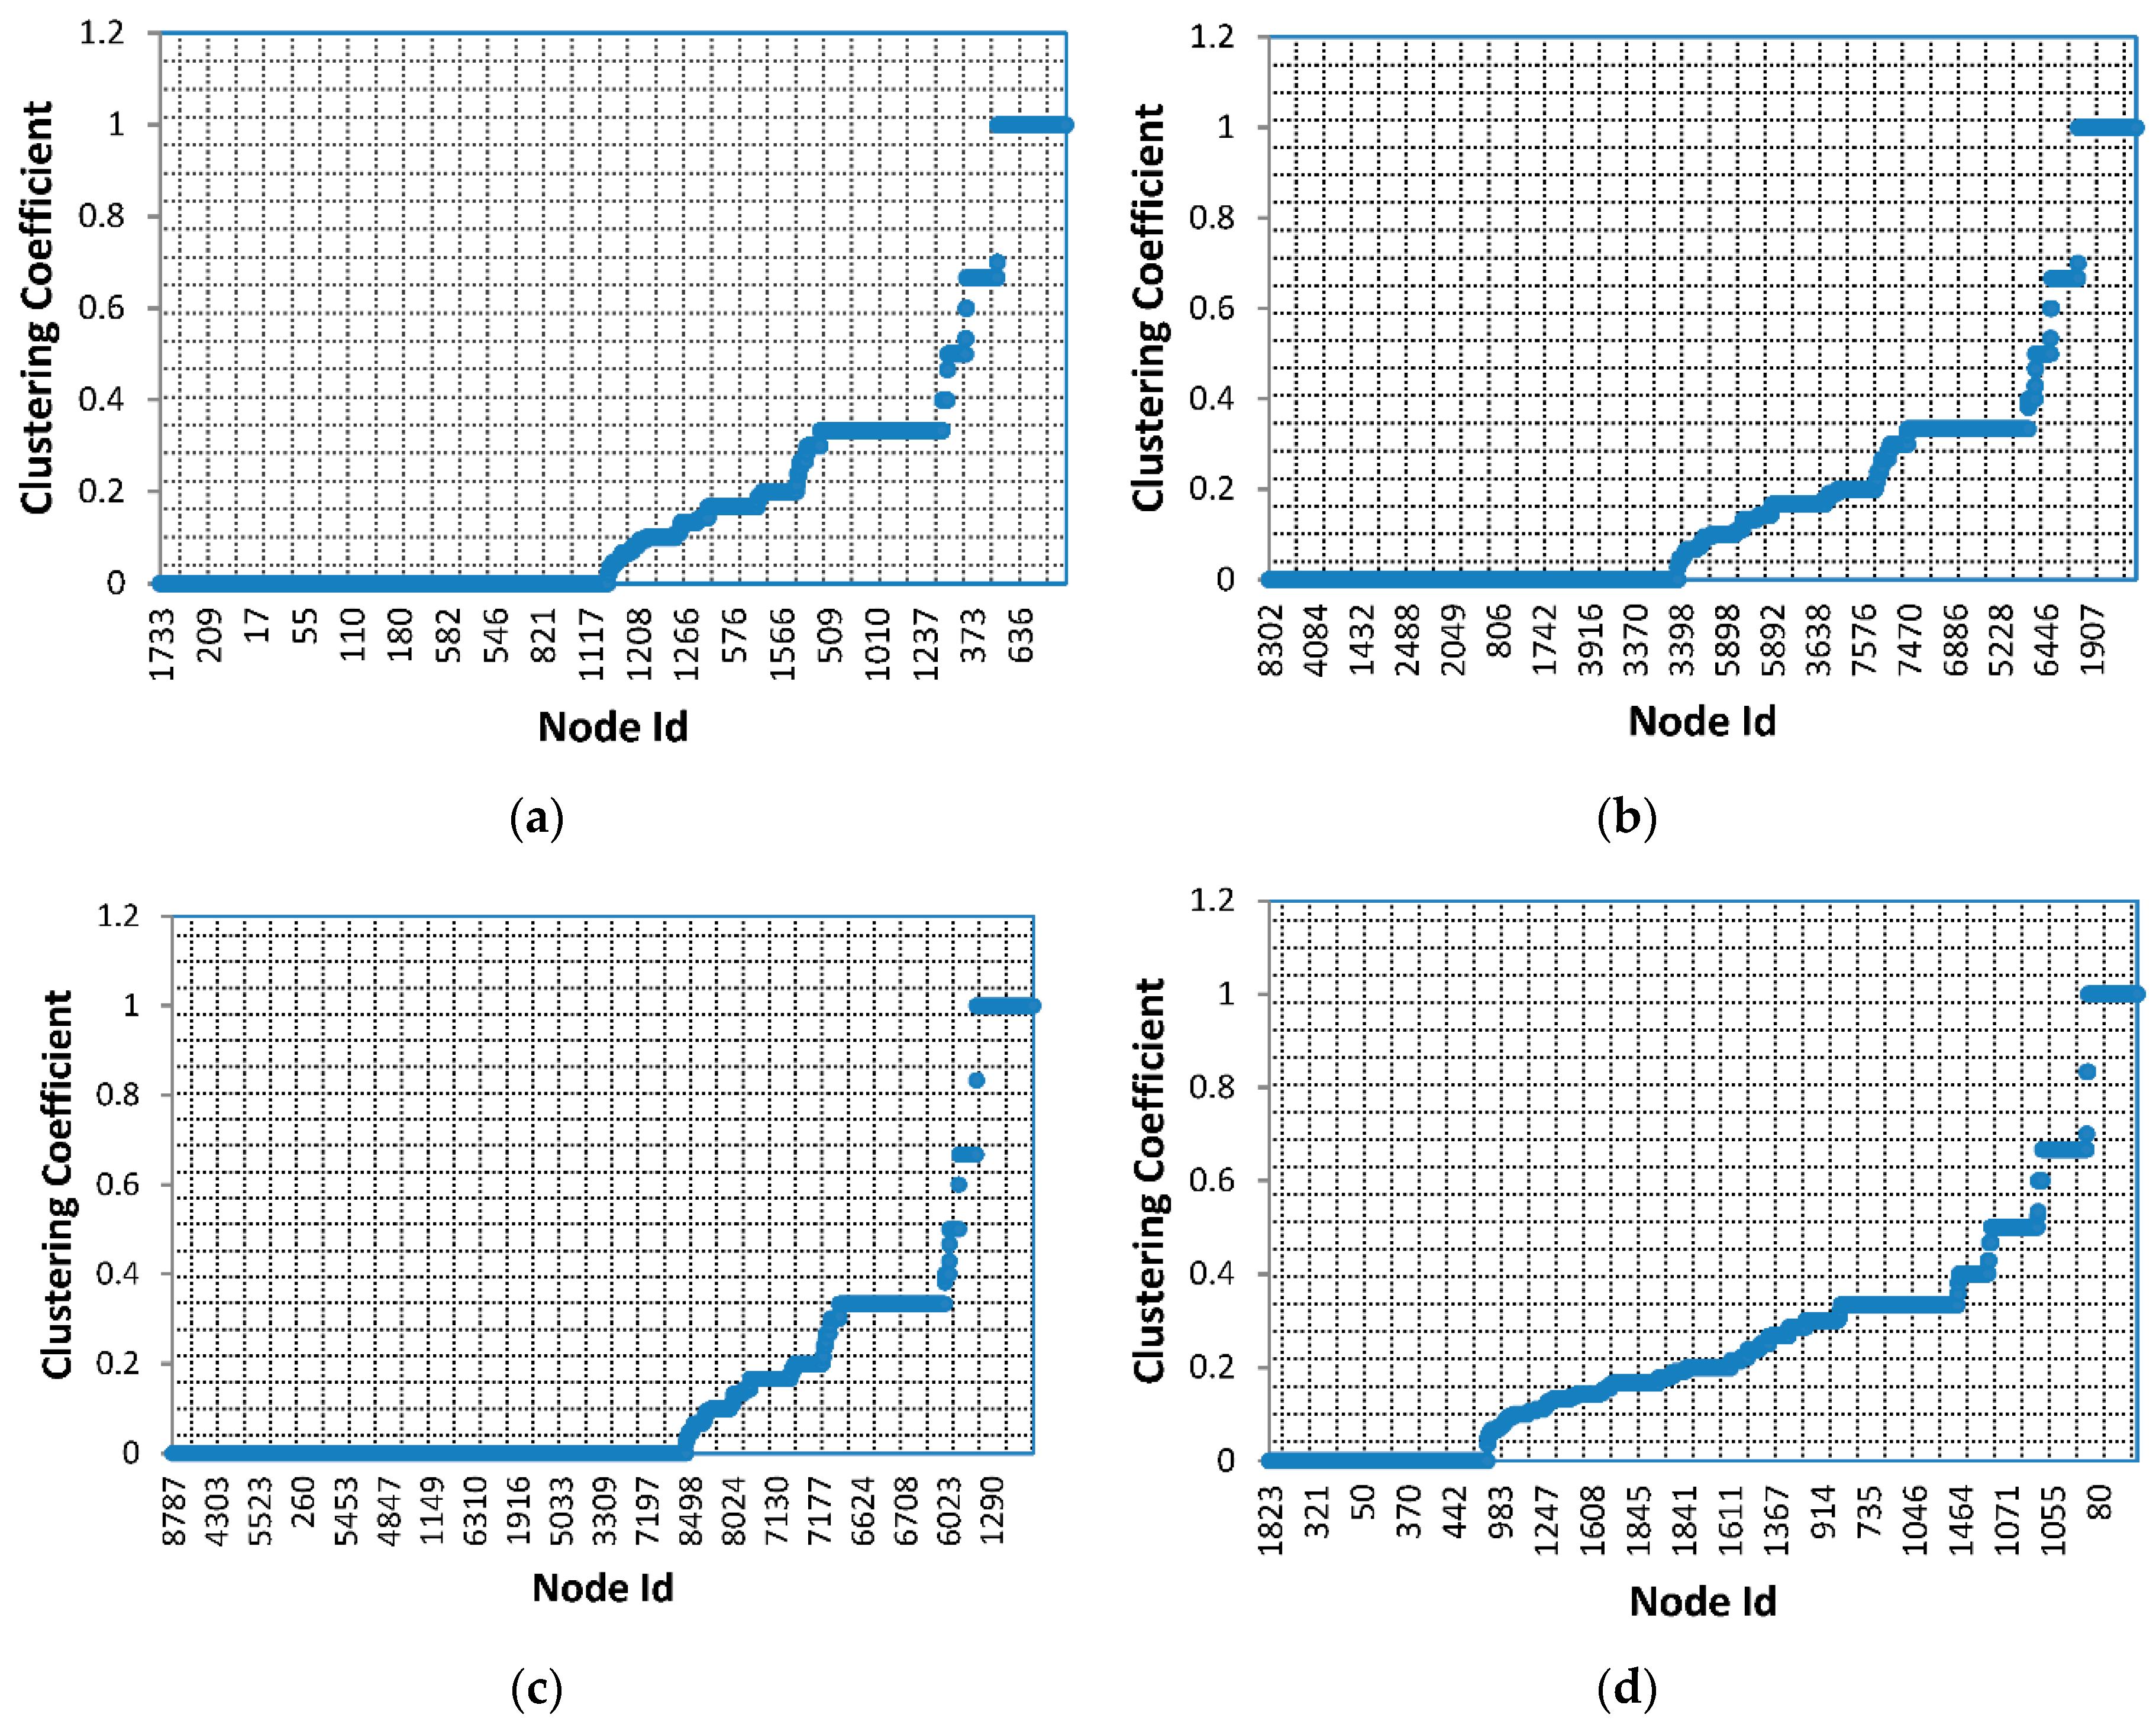
where n represents the number of edges that are connected among all adjacent nodes of the node i . The clustering coefficient distribution of the sandstone pore network is shown in Figure 6. This figure shows that the clustering coefficients of different sandstone pore networks are mainly distributed between 0 and 0.5. The nodes with the clustering coefficient of 0 have the largest proportion, and the number of nodes decreases as the clustering coefficient increases. It shows that the sandstone pore network has less connectivity than the global coupling network whose clustering coefficient is 1. According to Figure 2, the main reason is that the main pore connected to the sandstone pore is the peripheral pore node. In general, as the distance increases, the probability of connection between two nodes becomes weaker.
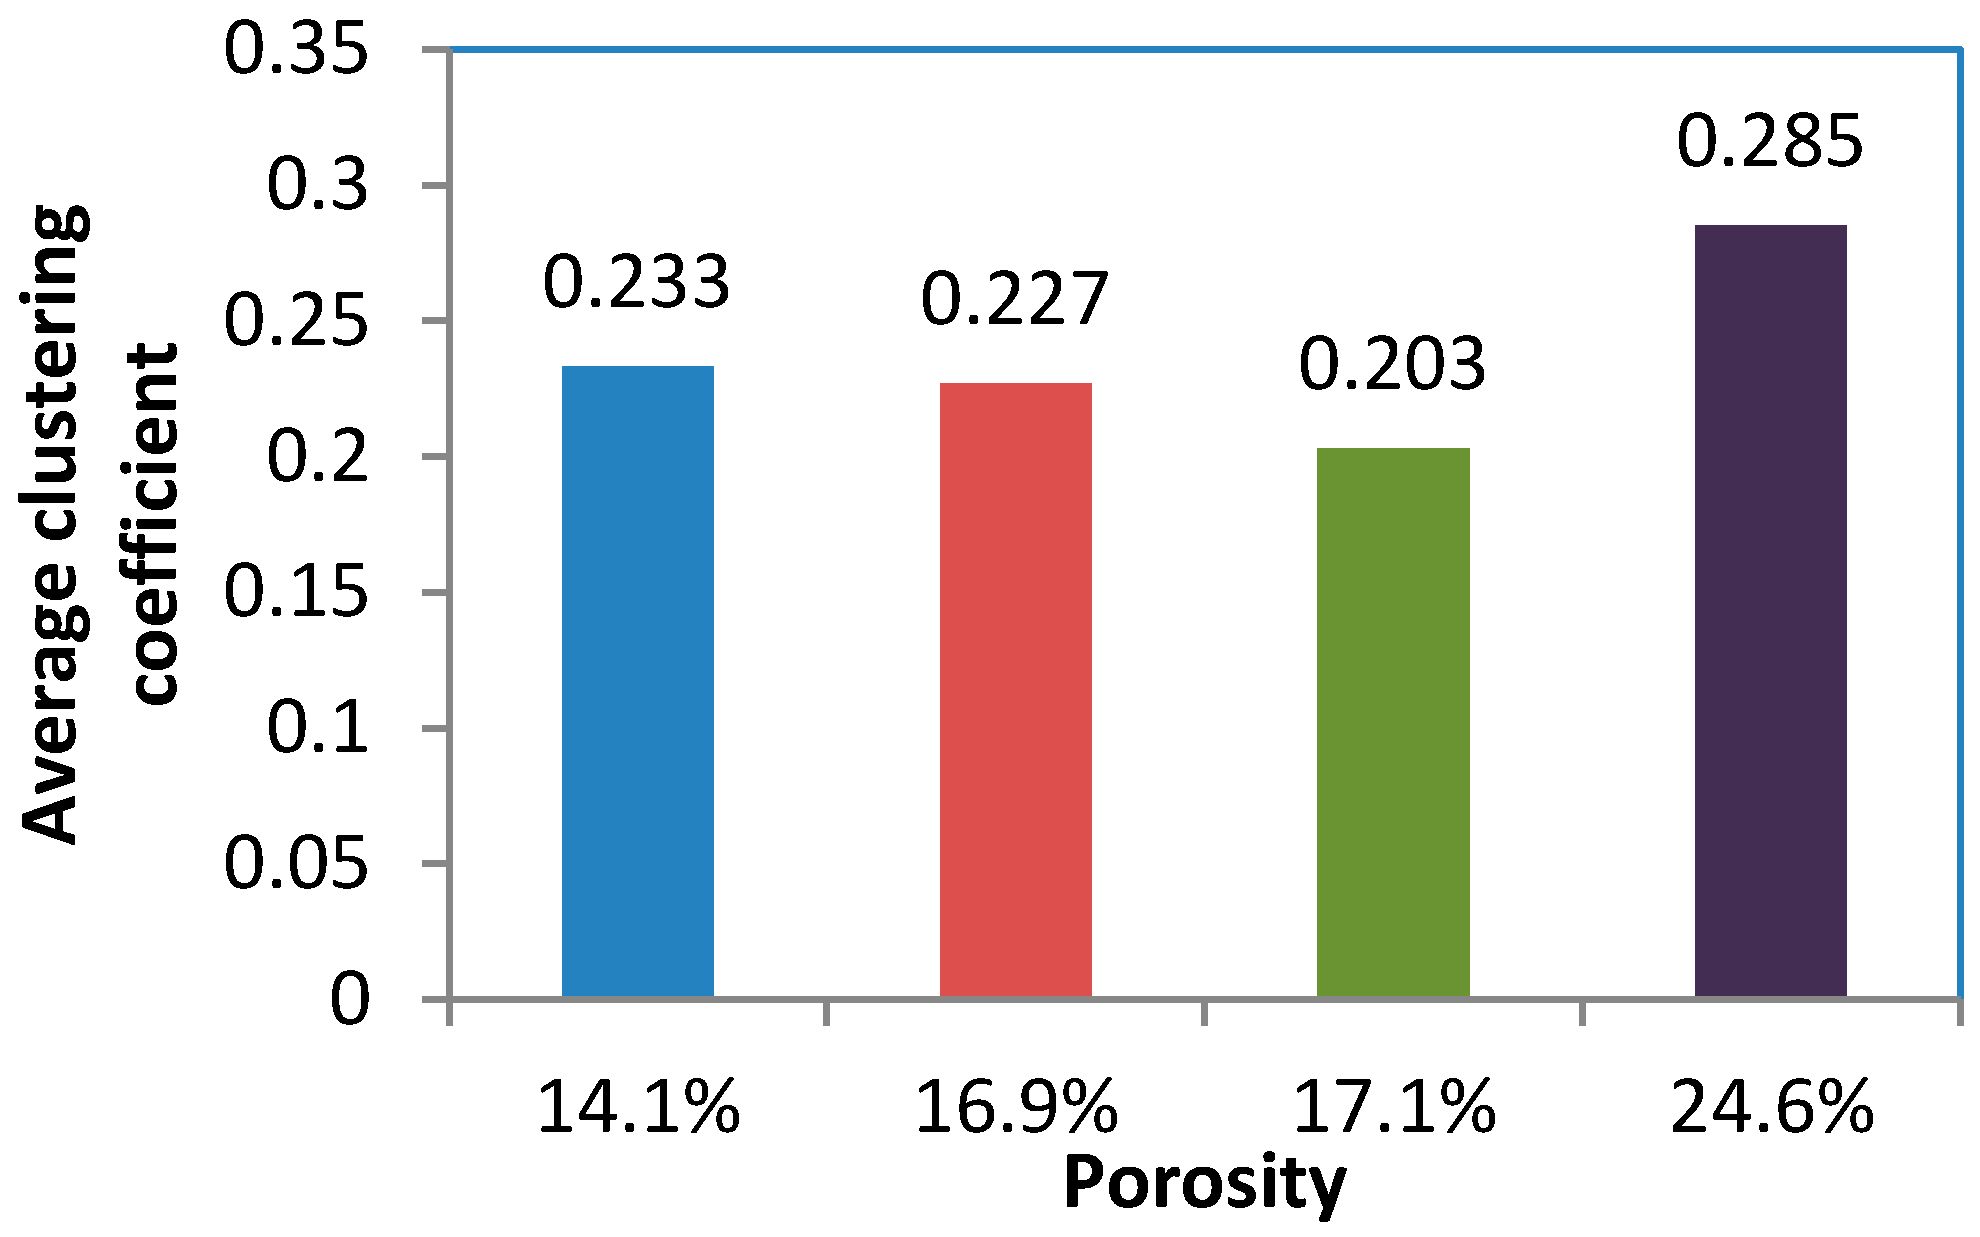
The degree of aggregation of the entire network can be represented by the average value of the clustering coefficients of all nodes, as shown in Figure 7. The networks with higher average clustering coefficients have smaller average distances in different nodes. The average clustering coefficient is the largest when the porosity is 24.60% in the sampling sandstone and, as shown in Table 1, the average path length is the minimum. That is, the network has the best connectivity among the four sandstone samples.
For the data in Figure 7, a simple one-way ANOVA is performed, as shown in Table 2. We can see that F is less than F crit and P is greater than 0.05, so the porosity and average clustering coefficient have statistical significance.
In order to analyze the importance of individual nodes in sandstone pore networks, the eigenvector centrality is used to compute the network nodes. Make x i the index value of node i , and A i j the adjacency matrix of the network. For node i , the centrality index is proportional to the exponential sum of all nodes connected to it. That is:
x i = 1 λ j M i x j = 1 λ j = 1 N A i , j x j
where M i is the set of nodes connected to node i . λ is constant.
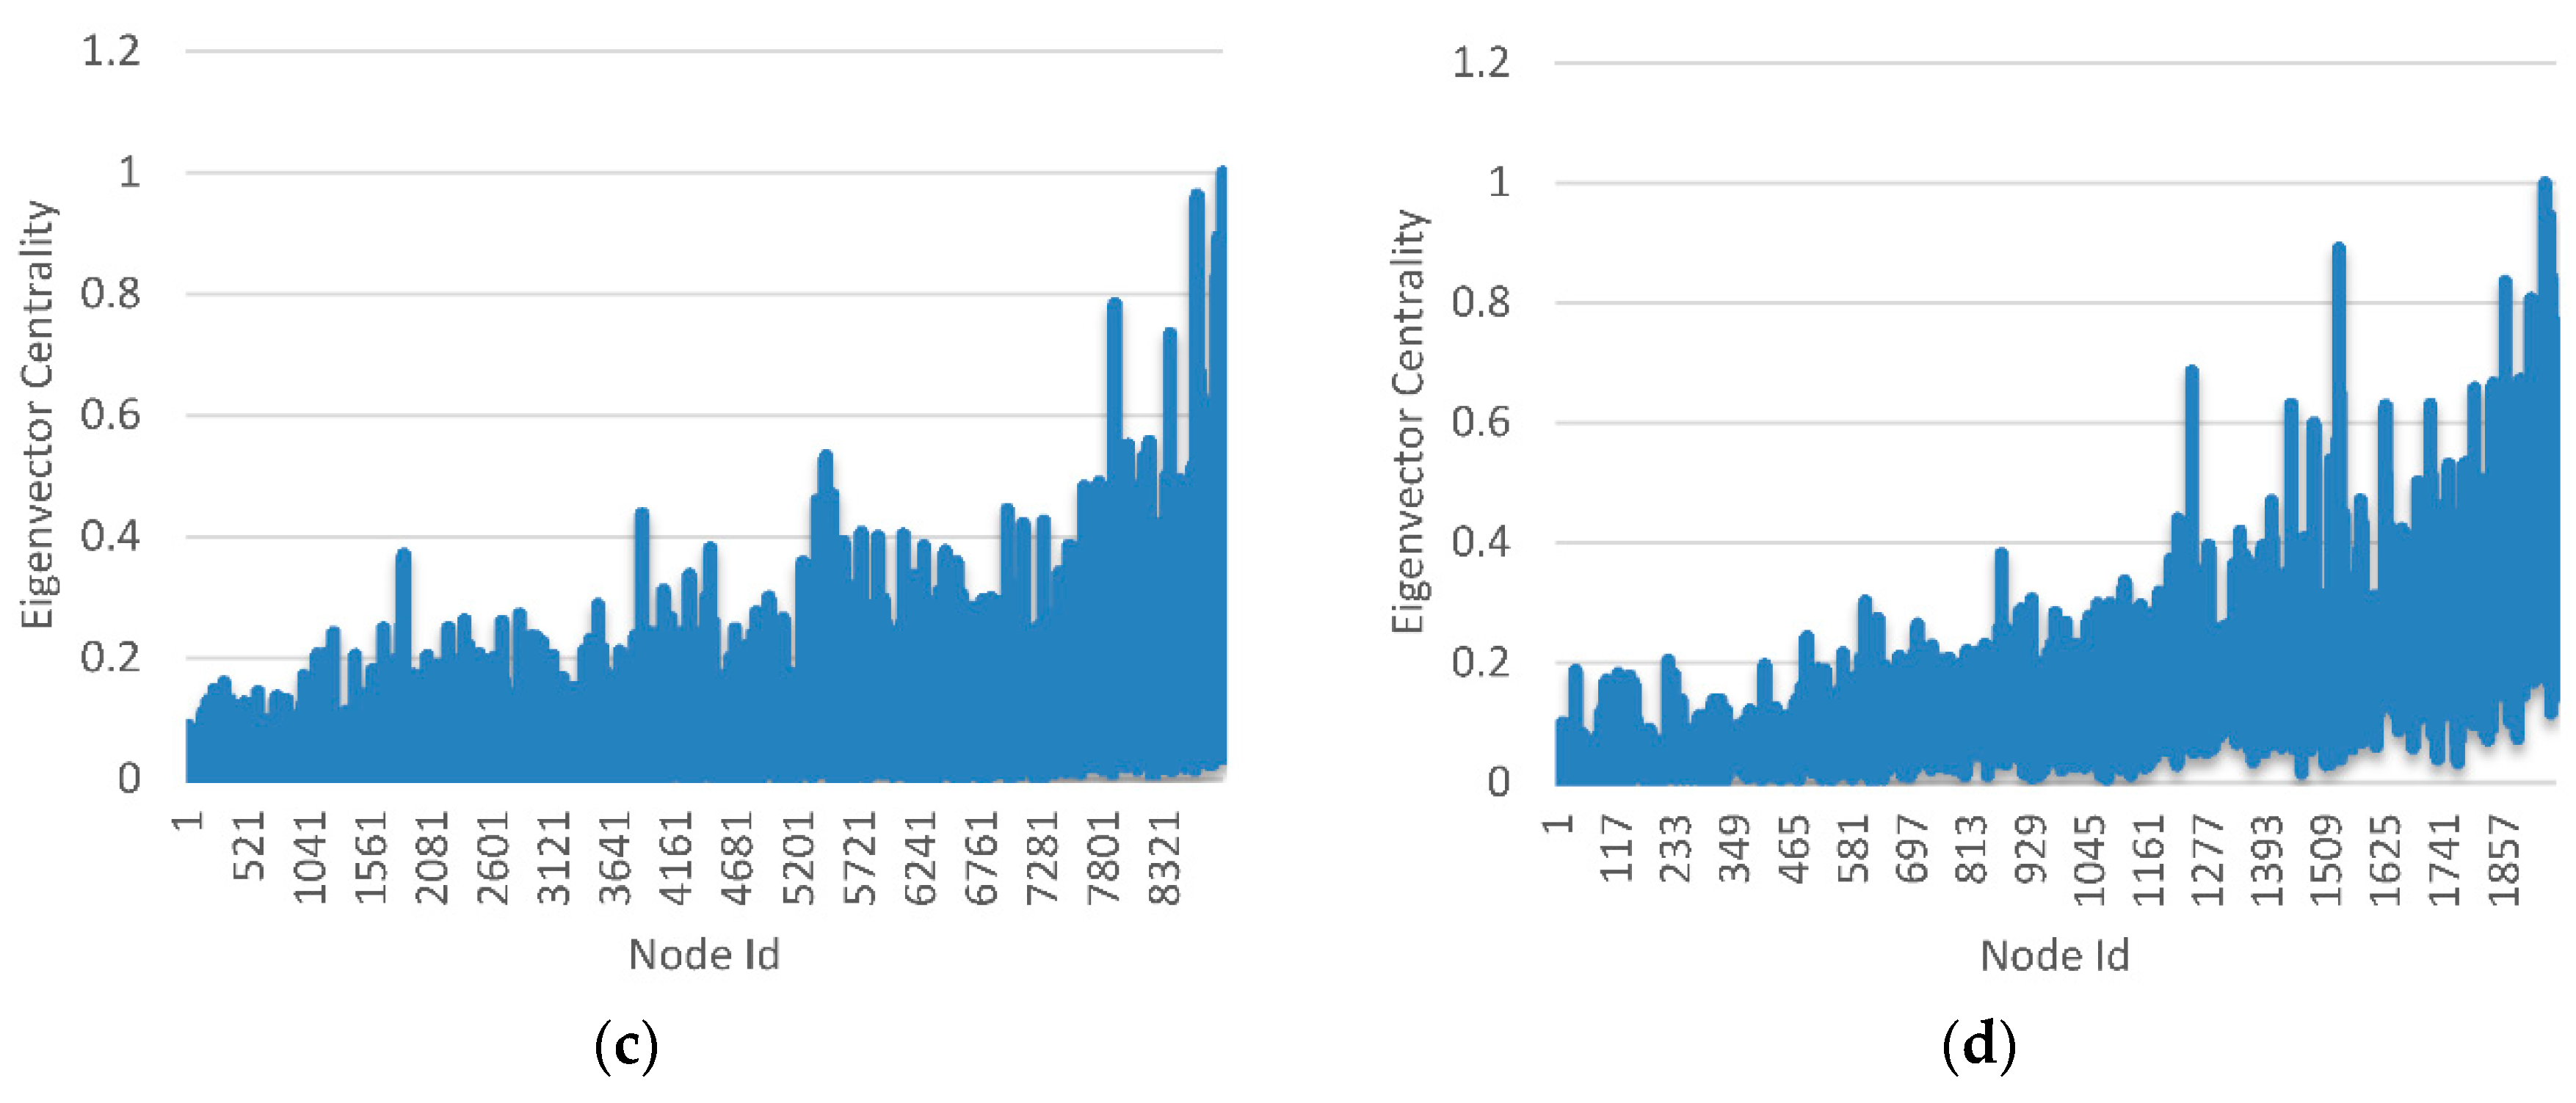
The centrality of the eigenvector is shown in Figure 8. The abscissa in the figure is the node Id. When the porosity of sandstone is between 14.1% and 24.6%, the eigenvector centrality of most nodes is less than 0.4. Only a small number of nodes have high centrality.
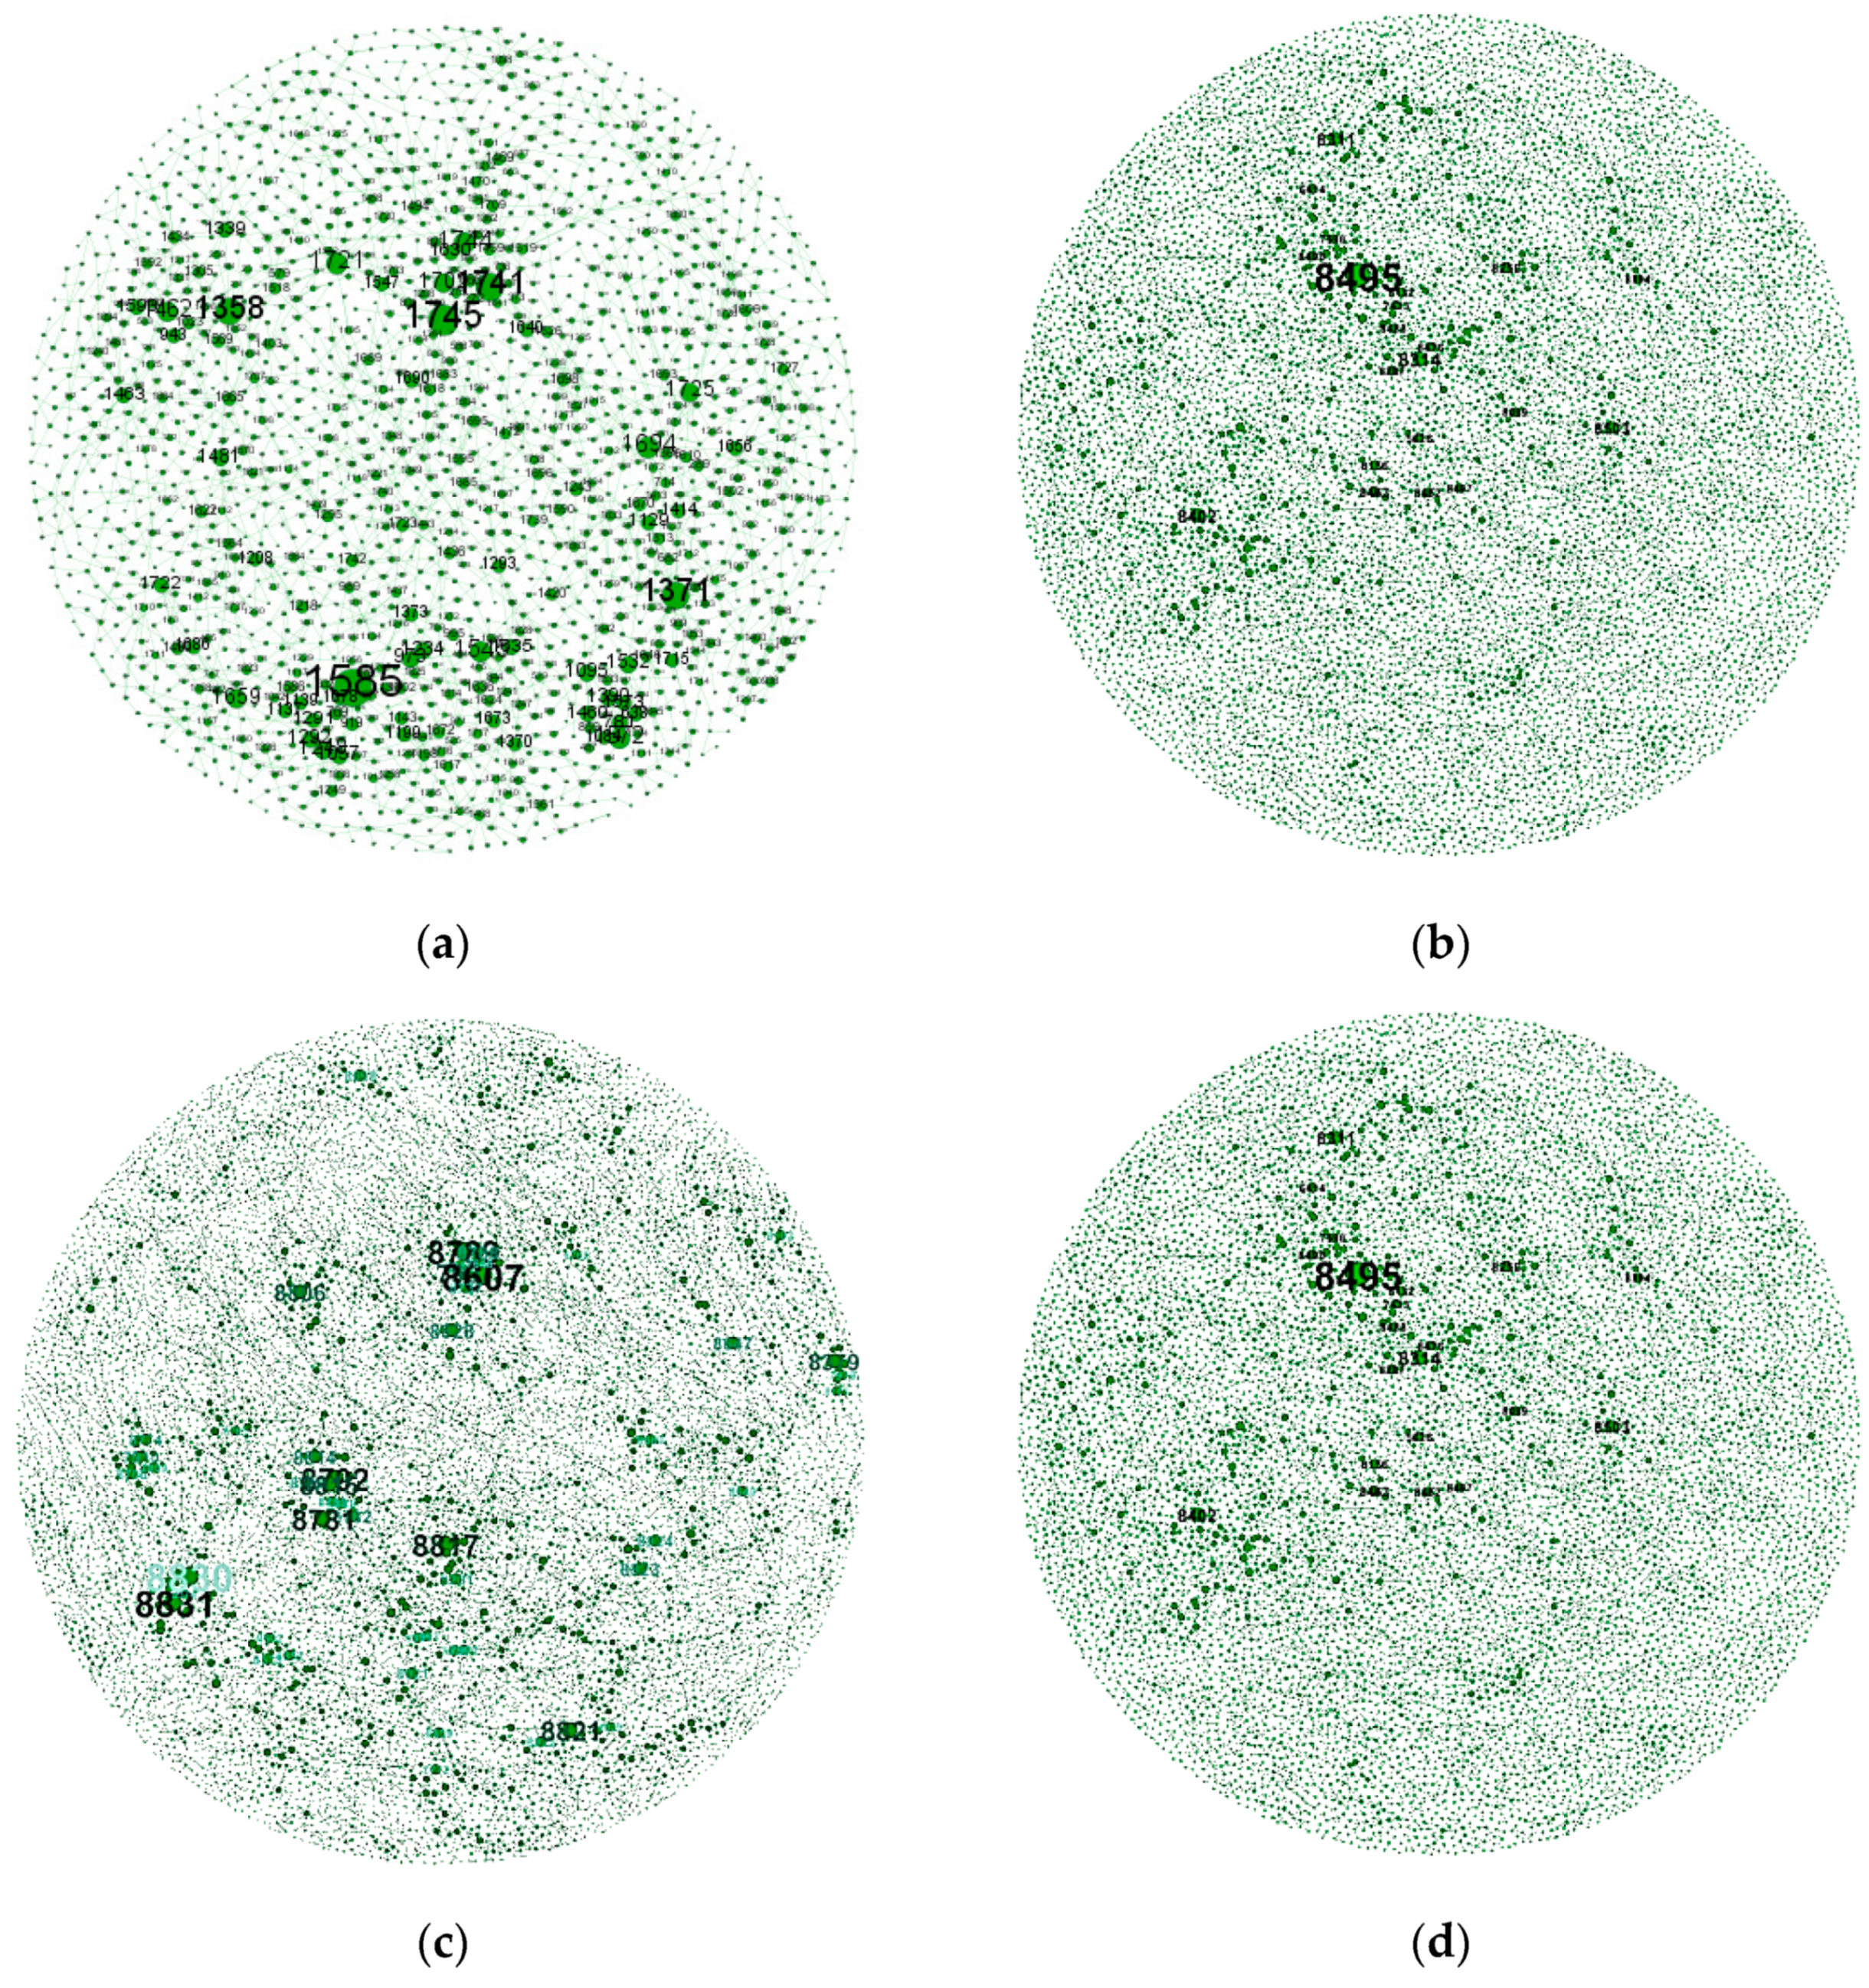
To facilitate intuitive understanding, the Fruchterman–Reingold algorithm is used to distribute the pore nodes in Figure 1 uniformly on a circular surface. The node centrality is sorted in Figure 9, where the node size represents the node centrality, and the number represents the node Id.

4. Conclusions

In this study, complex network theory was applied to investigate the network characteristics of the pore structure, which cannot be quantitatively analyzed by traditional methods such as Euler number and fractal dimension. Three network structure parameters, including degree distribution, clustering coefficient and modularity, were taken into account. A new eigenvector centrality method was used to sort the importance of the nodes in the percolation network. Based on these studies, following conclusions can be drawn:
(1)
The results show that a scale-free model is more suitable for the degree distribution of the sandstone seepage network. Without considering pore volume and pore throat volume weight, the overall permeability of the network may be determined by a small number of pores with large degree (number of connections with other pores).
(2)
The modular degree Q of the pore network of different porosity sandstone tends to 1, which means that the pore network of sandstone has an obvious modularized structure. According to the network topology, the sandstone network can be divided into several relatively independent communities. The associations within the community are closely connected, and have strong permeability, while the connection between communities is less, which inhibits the overall permeability of sandstone.
(3)
The aggregation coefficients of different sandstone pore networks are mainly distributed between 0 and 0.5. The connectivity of the sandstone pore network is far less than that of fully coupled networks with all nodes connected. That is, the sandstone has a strong antireflection potential.

Author Contributions

Data curation, F.G.; Formal analysis, Y.H.; Funding acquisition, F.G.; Investigation, Y.H.; Methodology, Y.Y.; Software, G.L.; Writing–original draft, F.G.; Writing–review and editing, G.L. All authors have read and agreed to the published version of the manuscript.

Funding

This work was supported by the Fundamental Research Funds for the Central Universities (Grant No. 2020ZDPYMS02).

Conflicts of Interest

The authors declare no conflict of interest.

References

  1. Chen, P.; Chen, S.; Peng, J.; Gao, F.; Liu, H. The interface behavior of a thin film bonded imperfectly to a finite thickness gradient substrate. Eng. Fract. Mech. 2019, 217, 106529. [Google Scholar] [CrossRef]
  2. Lou, L.; Chen, P.; Wang, Z.; Zhang, S.; Gao, F. Cohesive energy measurement of van der Waals heterostructures by the shaft loaded blister test. Extreme Mech. Lett. 2020, 41, 100987. [Google Scholar] [CrossRef]
  3. Chen, P.; Chen, S.H.; Liu, H.; Peng, J.; Gao, F. The interface behavior of multiple piezoelectric films attaching to a finite-thickness gradient substrate. J. Appl. Mech. Trans. ASME 2020, 87, 011003. [Google Scholar] [CrossRef]
  4. Blunt, M.J.; Bijeljic, B.; Hu, D.; Gharbi, O.; Iglauer, S.; Mostaghimi, P.; Paluszny, A. ChristopherPentlan Pore-scale imaging and modelling. Adv. Water Resour. 2013, 51, 197–216. [Google Scholar] [CrossRef] [Green Version]
  5. Arand, F.; Hesser, J. Accurate and efficient maximal ball algorithm for pore network extraction. Comput. Geosci. 2017, 101, 28–37. [Google Scholar] [CrossRef]
  6. Bauer, B.; Cai, X.; Peth, S.; Schladitz, K.; Steidl, G. Variational-based segmentation of bio-pores in tomographic images. Comput. Geosci. 2017, 98, 1–8. [Google Scholar] [CrossRef] [Green Version]
  7. Chen, P.; Peng, J.; Chen, Z.; Peng, G. On the interfacial behavior of a piezoelectric actuator bonded to a homogeneous half plane with an arbitrarily varying graded coating. Eng. Fract. Mech. 2019, 220, 106645. [Google Scholar] [CrossRef]
  8. Liu, G.; Yu, B.; Gao, F.; Ye, D.; Yue, F. Analysis of permeability evolution characteristics based on dual fractal coupling model for coal seam. Fractals 2020, in press. [Google Scholar] [CrossRef]
  9. Li, K.; Kong, S.; Xia, P.; Wang, X. Microstructural characterisation of organic matter pores in coal-measure shale. Adv. Geo-Energy Res. 2020, 4, 372–391. [Google Scholar] [CrossRef]
  10. Li, Z.; Duan, Y.; Fang, Q.; Wei, M. A study of relative permeability for transient two-phase flow in a low permeability fractal porous medium. Adv. Geo-Energy Res. 2018, 2, 369–379. [Google Scholar] [CrossRef] [Green Version]
  11. Qin, X.; Zhou, Y.; Sasmito, A.P. An effective thermal conductivity model for fractal porous media with rough surfaces. Adv. Geo-Energy Res. 2019, 3, 149–155. [Google Scholar] [CrossRef]
  12. Zeng, J.; Liu, J.; Li, W.; Leong, Y.K.; Elsworth, D.; Guo, J. Evolution of shale permeability under the influence of gas diffusion from the fracture wall into the matrix. Energy Fuels 2020, 34, 4393–4406. [Google Scholar] [CrossRef]
  13. Li, W.; Liu, J.; Zeng, J.; Leong, Y.K.; Elsworth, D.; Tian, J.; Li, L. A fully coupled multidomain and multiphysics model for evaluation of shale gas extraction. Fuel 2020, 278, 118214. [Google Scholar] [CrossRef]
  14. Li, W.; Liu, J.; Zeng, J.; Leong, Y.K.; Elsworth, D. A fully coupled multidomain and multiphysics model for shale gas production. In Proceedings of the 5th ISRM Young Scholars’ Symposium on Rock Mechanics and International Symposium on Rock Engineering for Innovative Future, Okinawa, Japan, 1–4 December 2019. [Google Scholar]
  15. Liu, G.; Yu, B.; Ye, D.; Gao, F.; Liu, J. Study on evolution of fractal dimension for fractured coal seam under multi field coupling. Fractals 2020, 28, 2050072. [Google Scholar] [CrossRef]
  16. Zeng, J.; Wang, X.; Guo, J.; Zeng, F.; Zeng, F. Modeling of heterogeneous reservoirs with damaged hydraulic fractures. J. Hydrol. 2019, 574, 774–793. [Google Scholar] [CrossRef]
  17. Raeini, A.Q.; Bijeljic, B.; Blunt, M.J. Generalized network modeling: Network extraction as a coarse-scale discretization of the void space of porous media. Phys. Rev. E 2017, 96, 013312. [Google Scholar] [CrossRef] [Green Version]
  18. Shaina, K.; Hesham, E.; Carlos, T.; Balhoff, M.T. Assessing the utility of FIB-SEM images for shale digital rock physics. Adv. Water Resour. 2015, 18, 302–316. [Google Scholar]
  19. Hajizadeh, A.; Safekordi, A.; Farhadpour, F.A. multiple-point statistics algorithm for 3D pore space reconstruction from 2D images. Adv. Water Resour. 2011, 34, 1256–1267. [Google Scholar] [CrossRef]
  20. Civan, F.; Rai, C.S.; Sondergeld, C.H. Shale-gas permeability and diffusivity inferred by improved formulation of relevant retention and transport mechanisms. Transp. Porous Media 2011, 86, 925–944. [Google Scholar] [CrossRef]
  21. Zhang, T.Y.; Li, D.L.; Yang, J.Q. A study of the effect of pore characteristic on permeability with a pore network model. Pet. Sci. Technol. 2013, 31, 1790–1796. [Google Scholar] [CrossRef]
  22. Ju, Y.; Zheng, J.; Marcelo, E.; Sudak, L.; Wang, J.; Zhao, X. 3D numerical reconstruction of well-connected porous structure of rock using fractal algorithms. Comput. Meth. Appl. Mech. Eng. 2014, 279, 212–226. [Google Scholar] [CrossRef]
  23. Gong, L.; Nie, L.; Xu, Y. Geometrical and Topological Analysis of Pore Space in Sandstones Based on X-ray Computed Tomography. Energies 2020, 13, 3774. [Google Scholar] [CrossRef]
  24. Iassonov, P.; Gebrenegus, T.; Tuller, M. Segmentation of X-ray computed tomography images of porous materials: A crucial step for characterization and quantitative analysis of pore structures. Water Resour. Res. 2009, 45, W09415. [Google Scholar] [CrossRef]
  25. Liu, K.; Ostadhassan, M.; Zhou, J.; Gentzis, T.; Rezaee, R. Nanoscale pore structure characterization of the Bakken shale in the USA. Fuel 2017, 209, 567–578. [Google Scholar] [CrossRef]
  26. Yao, J.; Wang, C.C.; Yang, Y.F.; Sun, H. The Construction method and microscopic flow simulation of carbonate dual pore network model. Sci. Sin. Phys. Mech. Astron. 2013, 43, 896–902. [Google Scholar] [CrossRef]
  27. Zhang, Z.; Shi, Y.; Li, H.; Jin, H. Experimental study on the pore structure characteristics of tight sandstone reservoirs in Upper Triassic Ordos Basin China. Energy Explor. Exploit. 2016, 34, 418–439. [Google Scholar] [CrossRef] [Green Version]
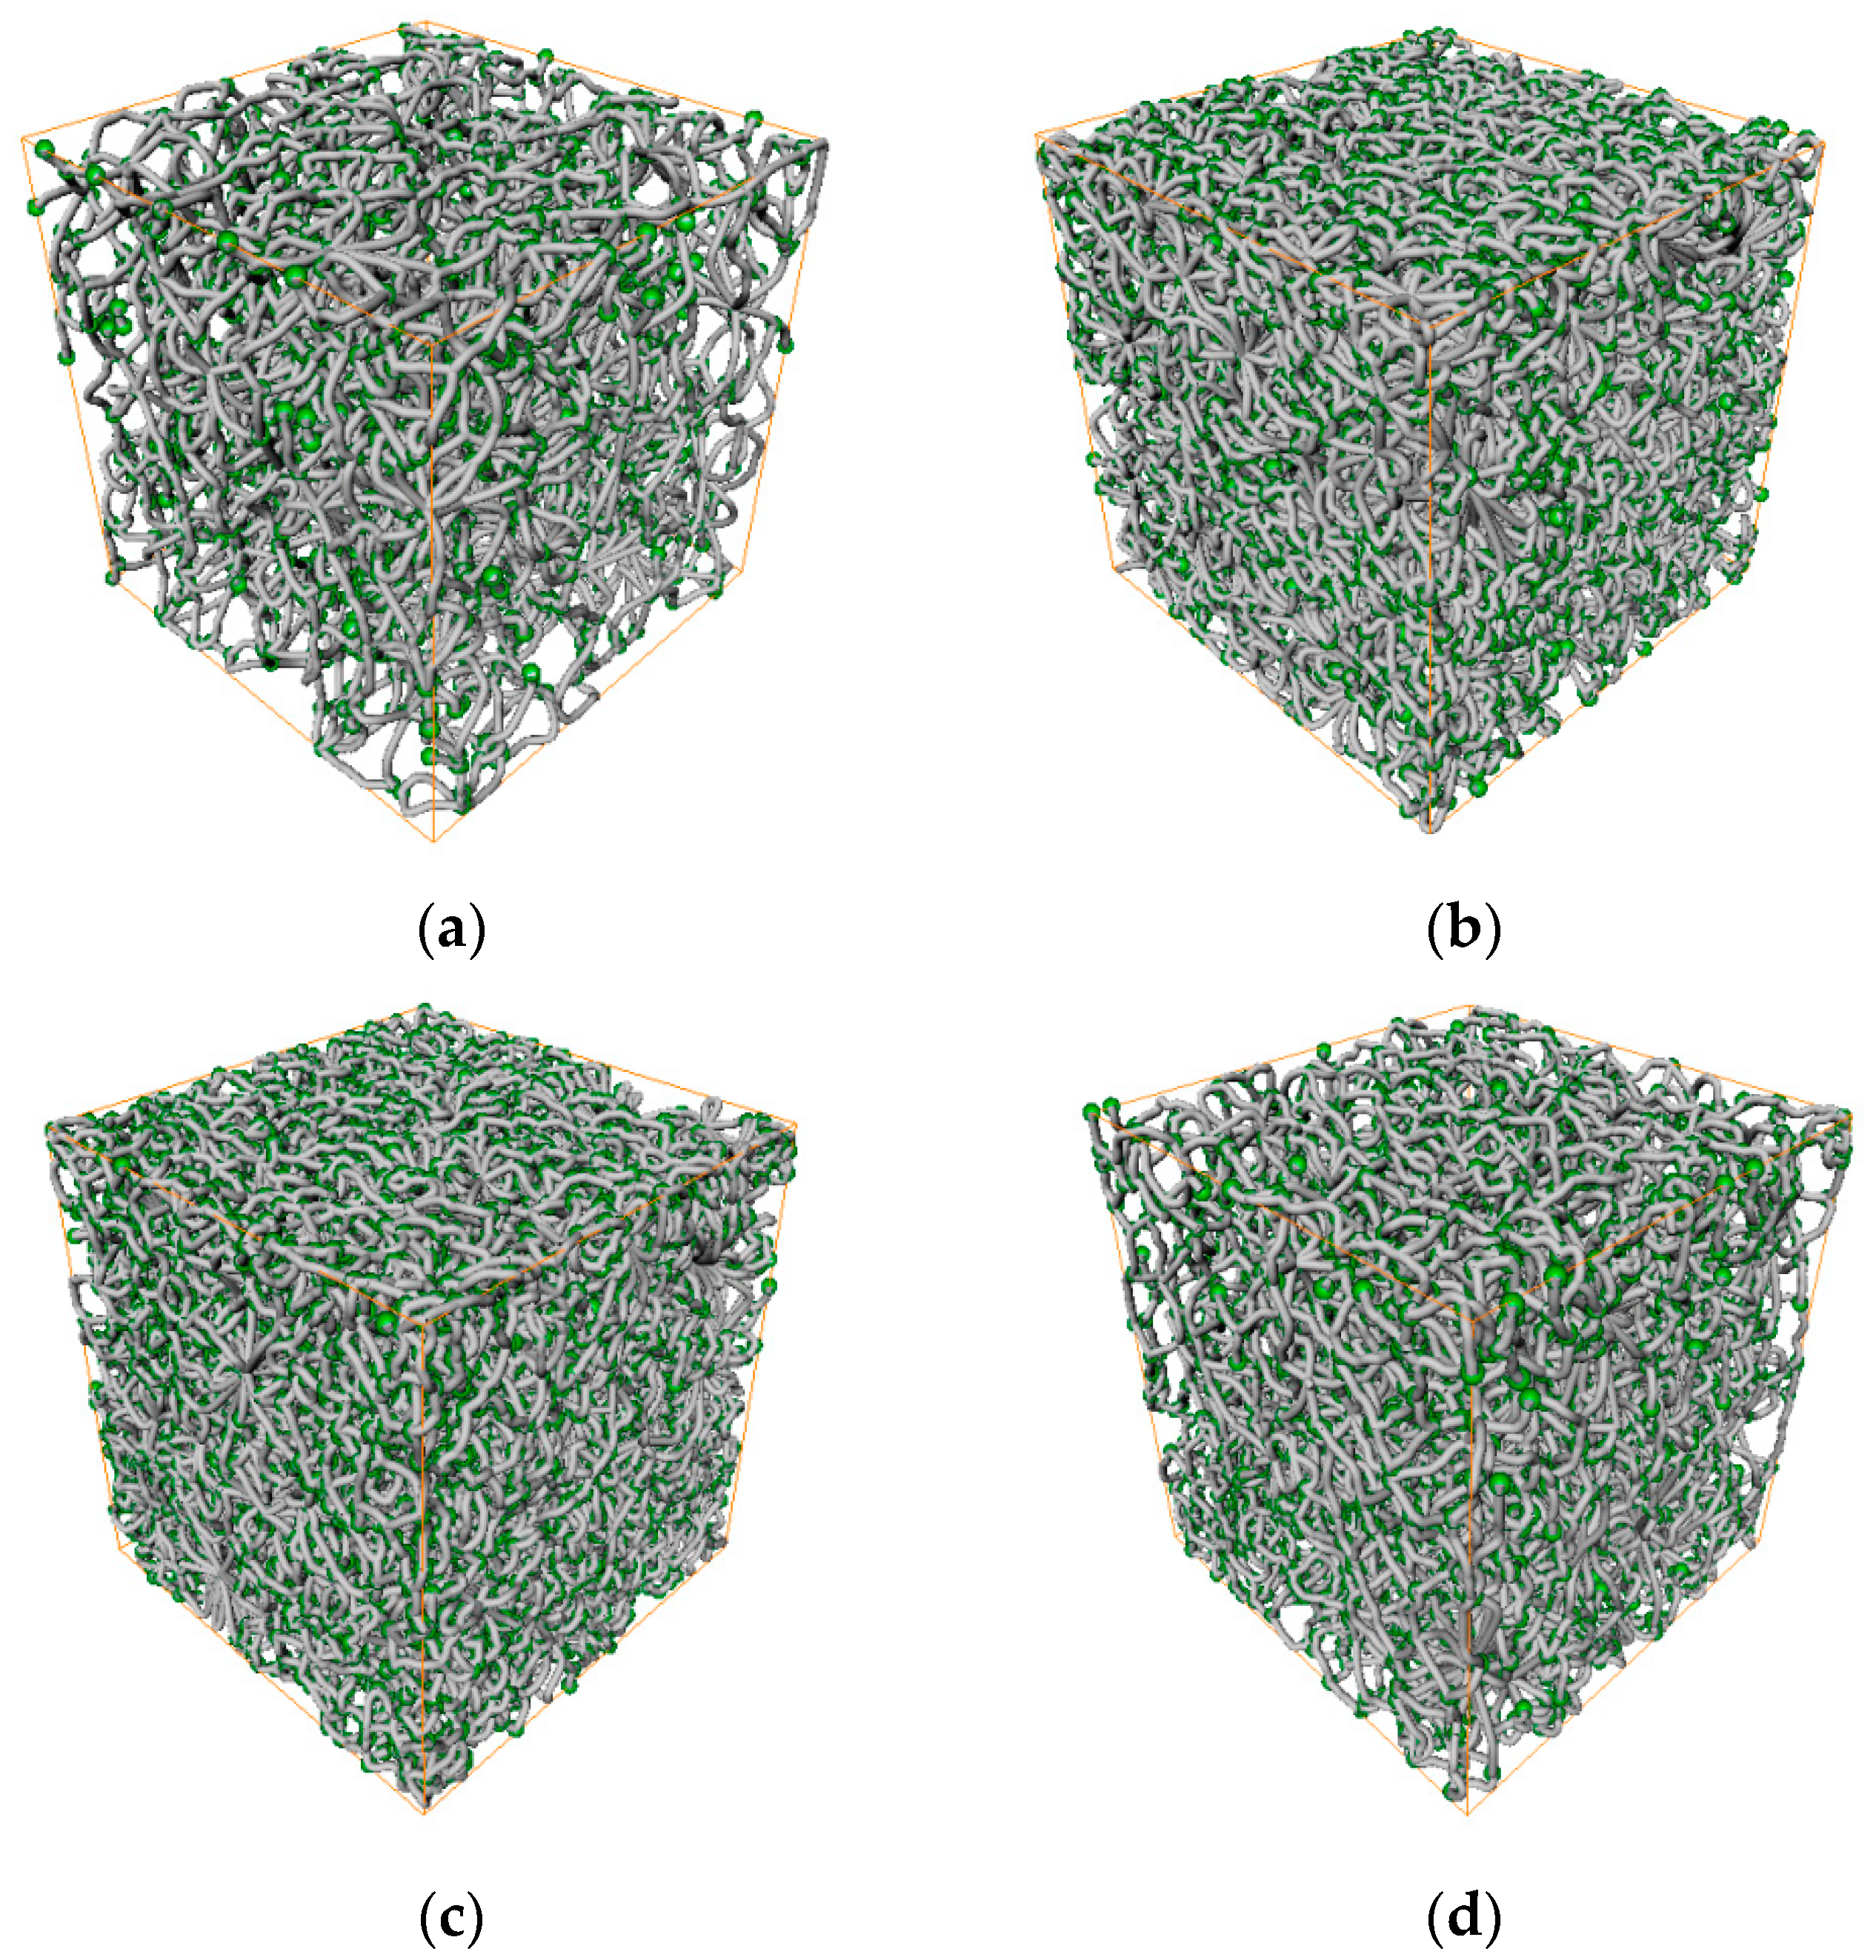
Figure 1. Sandstone three-dimensional pore network (bounding box volume: 3 mm by 3 mm by 3 mm. The pore network is extracted by the skeleton algorithm in the digital rock reconstructed from the X-ray CT scanner): (a) 14.1%; (b) 16.9%; (c) 17.1%; (d) 24.6%.
Coatings 10 01143 g001
Figure 2. Degree distribution of sandstone three-dimensional pore network.
Coatings 10 01143 g002
Figure 3. Sandstone pore network modularity.
Coatings 10 01143 g003
Figure 4. Association structure of sandstone pore network: (a) 14.1%; (b) 16.9%; (c) 17.1%; (d) 24.6%.
Coatings 10 01143 g004
Figure 5. Distribution of node numbers in network community of sandstone: (a) 14.1%; (b) 16.9%; (c) 17.1%; (d) 24.6%.
Coatings 10 01143 g005
Figure 6. Clustering coefficient distribution of sandstone three-dimensional pore network: (a) 14.1%; (b) 16.9%; (c) 17.1%; (d) 24.6%.
Coatings 10 01143 g006
Figure 7. Average clustering coefficient of sandstone pore network.
Coatings 10 01143 g007
Figure 8. Eigenvector centrality distribution of sandstone network nodes: (a) 14.1%; (b) 16.9%; (c) 17.1%; (d) 24.6%.
Coatings 10 01143 g008aCoatings 10 01143 g008b
Figure 9. Centrality sorting of sandstone pore nodes: (a) 14.1%; (b) 16.9%; (c) 17.1%; (d) 24.6%.
Coatings 10 01143 g009
Table 1. Basic parameters of sandstone networks.
Porosity
ϕ
Node Number
N
Edge Number
M
Average Degree
k
Network Diameter
D
Average Path Length
L
Network Density
ρ
14.1%171728243.2892510.1510.002
16.9%830114,3813.4654616.4690
17.1%854212,4322.9625019.4280
24.6%194546974.83228.4660.002
Table 2. One-way ANOVA.
Differences between the SourcesSSdfMSFp-ValueF Crit
between groups0.00610510.0061053.7987870.099195.987378
within the same group0.00964360.001607---
sum0.0157487----
Publisher’s Note: MDPI stays neutral with regard to jurisdictional claims in published maps and institutional affiliations.