Article

Design, Development and Validation of a Portable Gas Sensor Module: A Facile Approach for Monitoring Greenhouse Gases

by
Supriya A. Mane
1,
Digambar Y. Nadargi
2,*,
Jyoti D. Nadargi
3,
Omar M. Aldossary
4,*,
Mohaseen S. Tamboli
5 and
Vinayak P. Dhulap
1,*
1
School of Earth Sciences, Punyashlok Ahilyadevi Holkar Solapur University, Solapur 413255, India
2
School of Physical Sciences, Punyashlok Ahilyadevi Holkar Solapur University, Solapur 413255, India
3
Centre for Research and Technology Development, Sinhgad Institute, Kegaon Campus, Solapur 413255, India
4
Department of Physics and Astronomy, College of Science, King Saud University, P.O. Box 2455, Riyadh 11451, Saudi Arabia
5
Department of Chemistry, Hanyang University, Seongdong-gu, Seoul 04763, Korea
*
Authors to whom correspondence should be addressed.
Coatings 2020, 10(12), 1148; https://doi.org/10.3390/coatings10121148
Submission received: 10 November 2020 / Revised: 17 November 2020 / Accepted: 19 November 2020 / Published: 25 November 2020

Abstract

:
We report the unique design and prototype of a portable gas sensor module for monitoring greenhouse gases. The commercially available gas sensors (MQ-02, MQ-135, and TGS2602) were adopted in designing the module using Arduino Uno. Different locations in the city of Solapur, India (17.6599° N, 75.9064° E), were scanned for the usability of the developed prototype of the mobile gas sensor module. The choice of gas sensors in combination with Arduino Uno led to an excellent prototype for measuring the concentration of greenhouse gases, and therefore the wrong alarm for toxic gases. The prototype model and corresponding greenhouse gas concentrations (ppm) are described using an interplay of sensor design, software program, and greenhouse gases sites.

1. Introduction

A greenhouse gas (GRG) absorbs and emits the radiant energy within the thermal infrared region. Ozone, water vapor, carbon dioxide, nitrous oxide, and methane are primary greenhouse gases in the Earth’s atmosphere. These gases have an influence on the earth as a consequence of greenhouse effect [1,2,3,4]. The Earth’s average surface temperature will be around −18 °C without greenhouse gasses, rather than the present average of 15 °C. However, the extreme liberation of GRG is increasing the atmospheric temperature, every year. The ambient carbon dioxide levels increased 45%, from 280 ppm in 1750 to 415 ppm in 2019, with the activity of humans after the advent of the Industrial Revolution (about 1750) [5,6,7,8,9]. Many anthropogenic carbon emissions come from the burning of fossil fuels, mainly coal, petroleum and gas, with additional deforestation and other land use changes [10,11,12,13]. Farming, closely accompanied by the release of gas and fugitive fossil fuel emissions, is the main source of anthropogenic methane emissions. The annual greenhouse emissions from different parts of society are shown in Figure 1 [14]. The probable impacts would definitely threaten the world’s habitats, biodiversity and livelihoods [15,16,17,18]. This desperately calls for a monitoring of these dangerous gases (carbon dioxide CO2, methane CH4 and hydrogen sulphide H2S) which raises consciousness of stopping and minimizing domestic and industrial development. In tracking and alarming these gases, gas sensors play an important function. The sensor market is valued at USD 400 million by 2020, USD 2.4 billion in the year 2022 and over USD 3 billion by the year 2027 by IDTech Ex analysts [19,20]. The state-of-the-art gas sensors have gained a great deal of interest because of their robustness, stability, and economic performance across the different gas sensors (electrochemical sensors, semiconducting gas sensors, and optical particle monitoring) [21,22,23,24,25]. Amongst them semiconducting gas sensors are more favorable due to its cost effectiveness, high-electron mobility, electrical conductivity, thermal, chemical and mechanical stability. Moreover, they possess better sensitivity towards various oxidizing and reducing gases. The worldwide Nano Metal Oxide (NMO) market size was expected more than USD 4 billion in 2016. Growing utilization of personal and skin care products are also in demand positively. Industrial production, medical field, environmental monitoring, indoor air quality control, transportation and security control all have a growing demand for better and cheaper gas sensors. The requirements of these applications demand immediate and uninterrupted analysis to detect target gases.
Various gases are required to be detected are broadly categorized into following three groups.
(1) Oxygen: oxygen monitoring is very much essential for the healthy atmosphere. It is also required for the control of combustion processes such as boilers and internal combustion engines. The oxygen concentration of 20% and 0–5%, is required, respectively.
(2) Toxic gases: For the safety measures of the employees working at different places, the detection and monitoring of toxic gases is must. The exposure limits for toxic gases is in the range 1 to several hundred ppm. These gases are H2S, NOX, CO, SO2, etc.
(3) Inflammable gases: To avoid the accidental fire or explosion. The concentrations of the flammable gases are up to the lower explosive level (LEL) which, for most gases, is up to a few percent (ex. ethanol vapors, acetone vapors, methane, LPG, etc.).
Speaking about the available literature in the field, Chen and co-worker have reported Pd-loaded mesoporous SnO2 hollow spheres for methane gas sensing [26]. Recently, Juang et al. has reported CO2 sensing properties of zinc oxide and tin oxide (ZnO/SnO2) nanocomposites [27]. A comprehensive review of different types of methane detectionsensors, including optical sensors, calorimetric sensors, pyroelectric sensors, semiconducting oxidesensors, and electrochemical sensorsis made by Fowler et al. [28]. Khan and co-worker have reviewed the recent advances inelectrochemical sensors for toxic gases such as NOx, SOx, H2S and other S-containing gases detections and summarized their gas sensors. The recent progress of the detection of each of these toxic gases was categorized by the highly explored sensing materials over the past few decades [29]. Importantly, K. Santhanam and N. Ahamed have reported the details review of greenhouse gas sensors fabricated with new materials for climatic usage. It contains the few publications that detail the use of new methods and materials for sensing these gases [30].
There is a variety of individual gas sensors commercially available on the market. For example, in the present study, we have used MQ-02, MQ-135, and TGS2602 commercial gas sensors. The MQ-02 sensor is used in gas-leakage-detecting equipment in domestic and industry settings and is suitable for detecting LPG, i-butane, propane, methane, alcohol, hydrogen, smoke. The structure and configuration of the MQ-2 gas sensor is composed by micro alumina—Al2O3 ceramic tube, SnO2 sensitive layer, measuring electrode and heater are fixed into a crust made by plastic and stainless steel net. The heater provides necessary work conditions for work of sensitive components. MQ-135 is an air quality sensor for detecting a wide range of gases, including NH3, NOx, alcohol, benzene, smoke and CO2. Ideal for use in office or factory. The MQ135 gas sensor has a high sensitivity to Ammonia, Sulfide and Benzene steam, also sensitive to smoke and other harmful gases. It is with low cost and particularly suitable for Air quality monitoring application. The TGS 2602 has a high sensitivity to low concentrations of odorous gases such as ammonia and H2S generated from waste materials in office and home environments. The sensor also has a high sensitivity to low concentrations of VOCs such as toluene emitted from wood finishing and construction products.
However, to the best of our knowledge, little-to-no work has been carried out to design and built the unique mobile gas sensor unit, which can measure the greenhouse gases in a combined manner [31]. In the present work, results are disseminated in two main parts—i) prototype design and assembly, and ii) validation as a greenhouse gas sensor. In the following, we shall discuss the aforementioned parts individually.

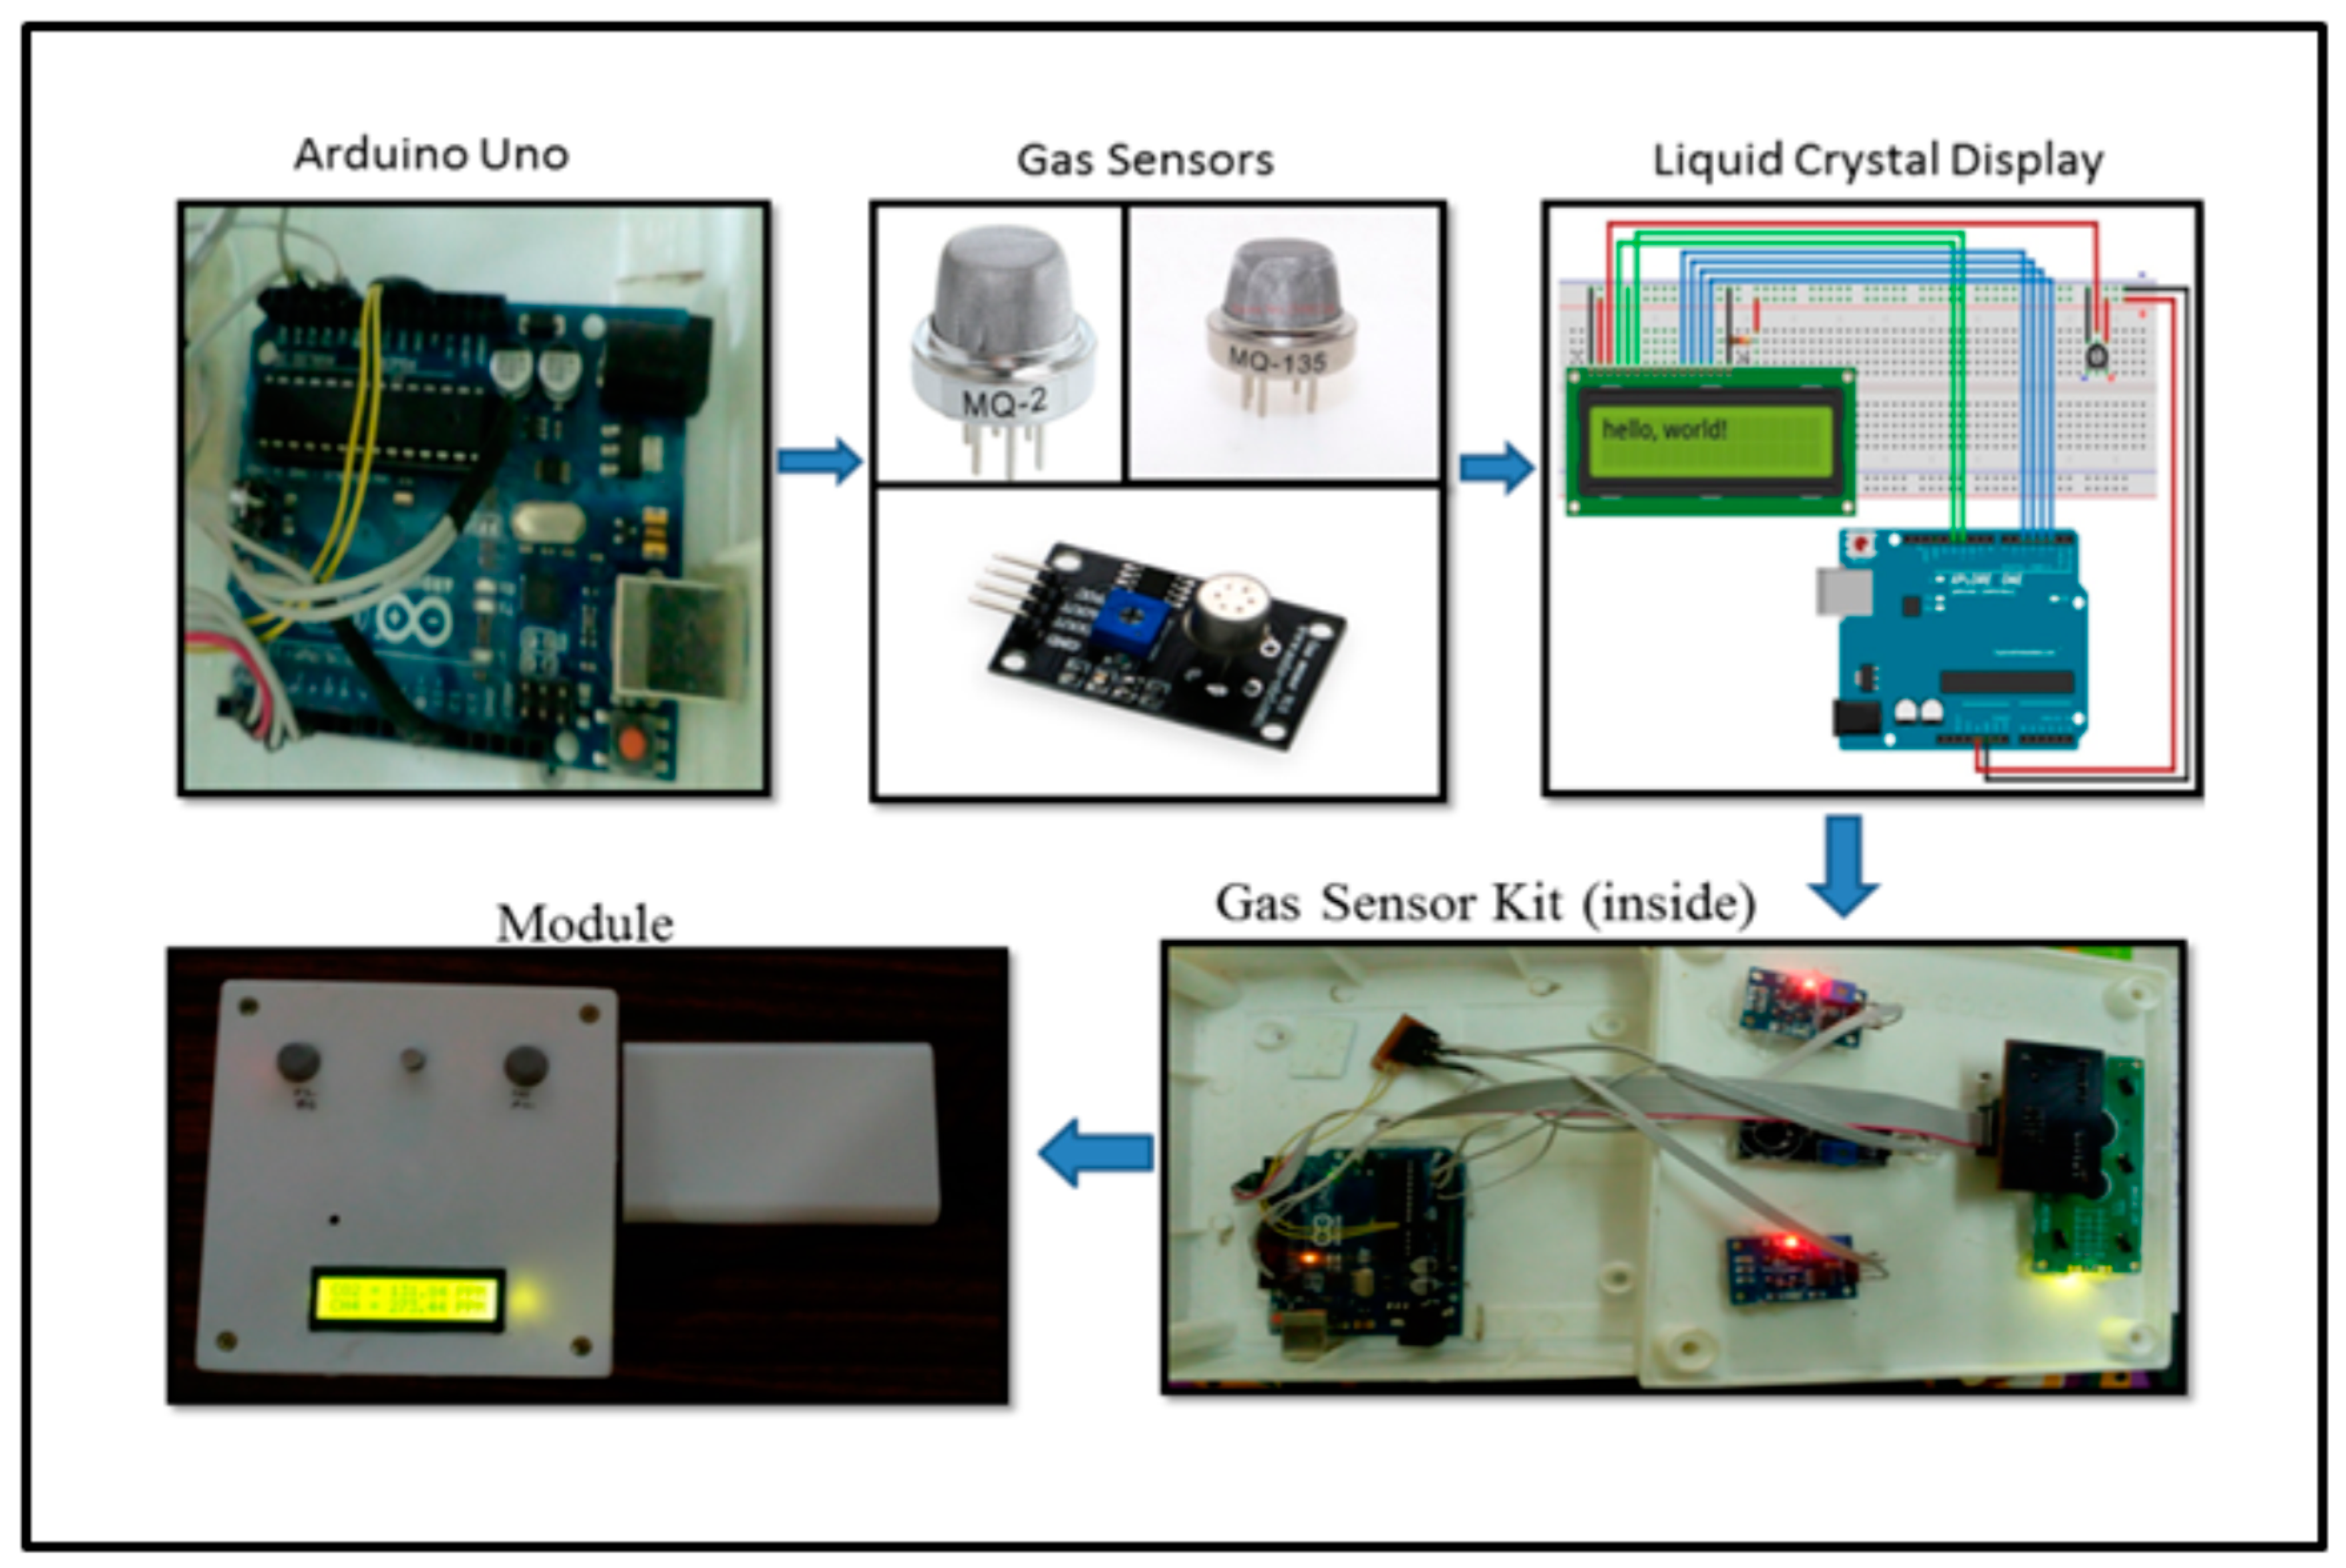
2. Prototype Design and Assembly: PART I

To materialise the idea of the portable gas sensor module, a systematic design and development of the sensor unit was conceptually made into three separate parts, which were then combined to make a unified sensor unit. The unique combination of (a) design, (b) hardware (electronic circuit), and (c) software are described below to build the prototype (Figure 2).
The design comprises of Arduino Uno microcontroller, sensors (MQ2, MQ135 and TGS2602), Liquid Crystal Display (LCD) and portable battery. Hardware implementation involves conversion of design into actual electronic components and their connections, and thereby a complete circuit on Printed Circuit Board (PCB). On the software note, the following code was developed and programmed to Ardunio to materialize the prototype. Finally, the testing, debugging and error fixation of the complete module was made. In the following section each unit is described in detail.

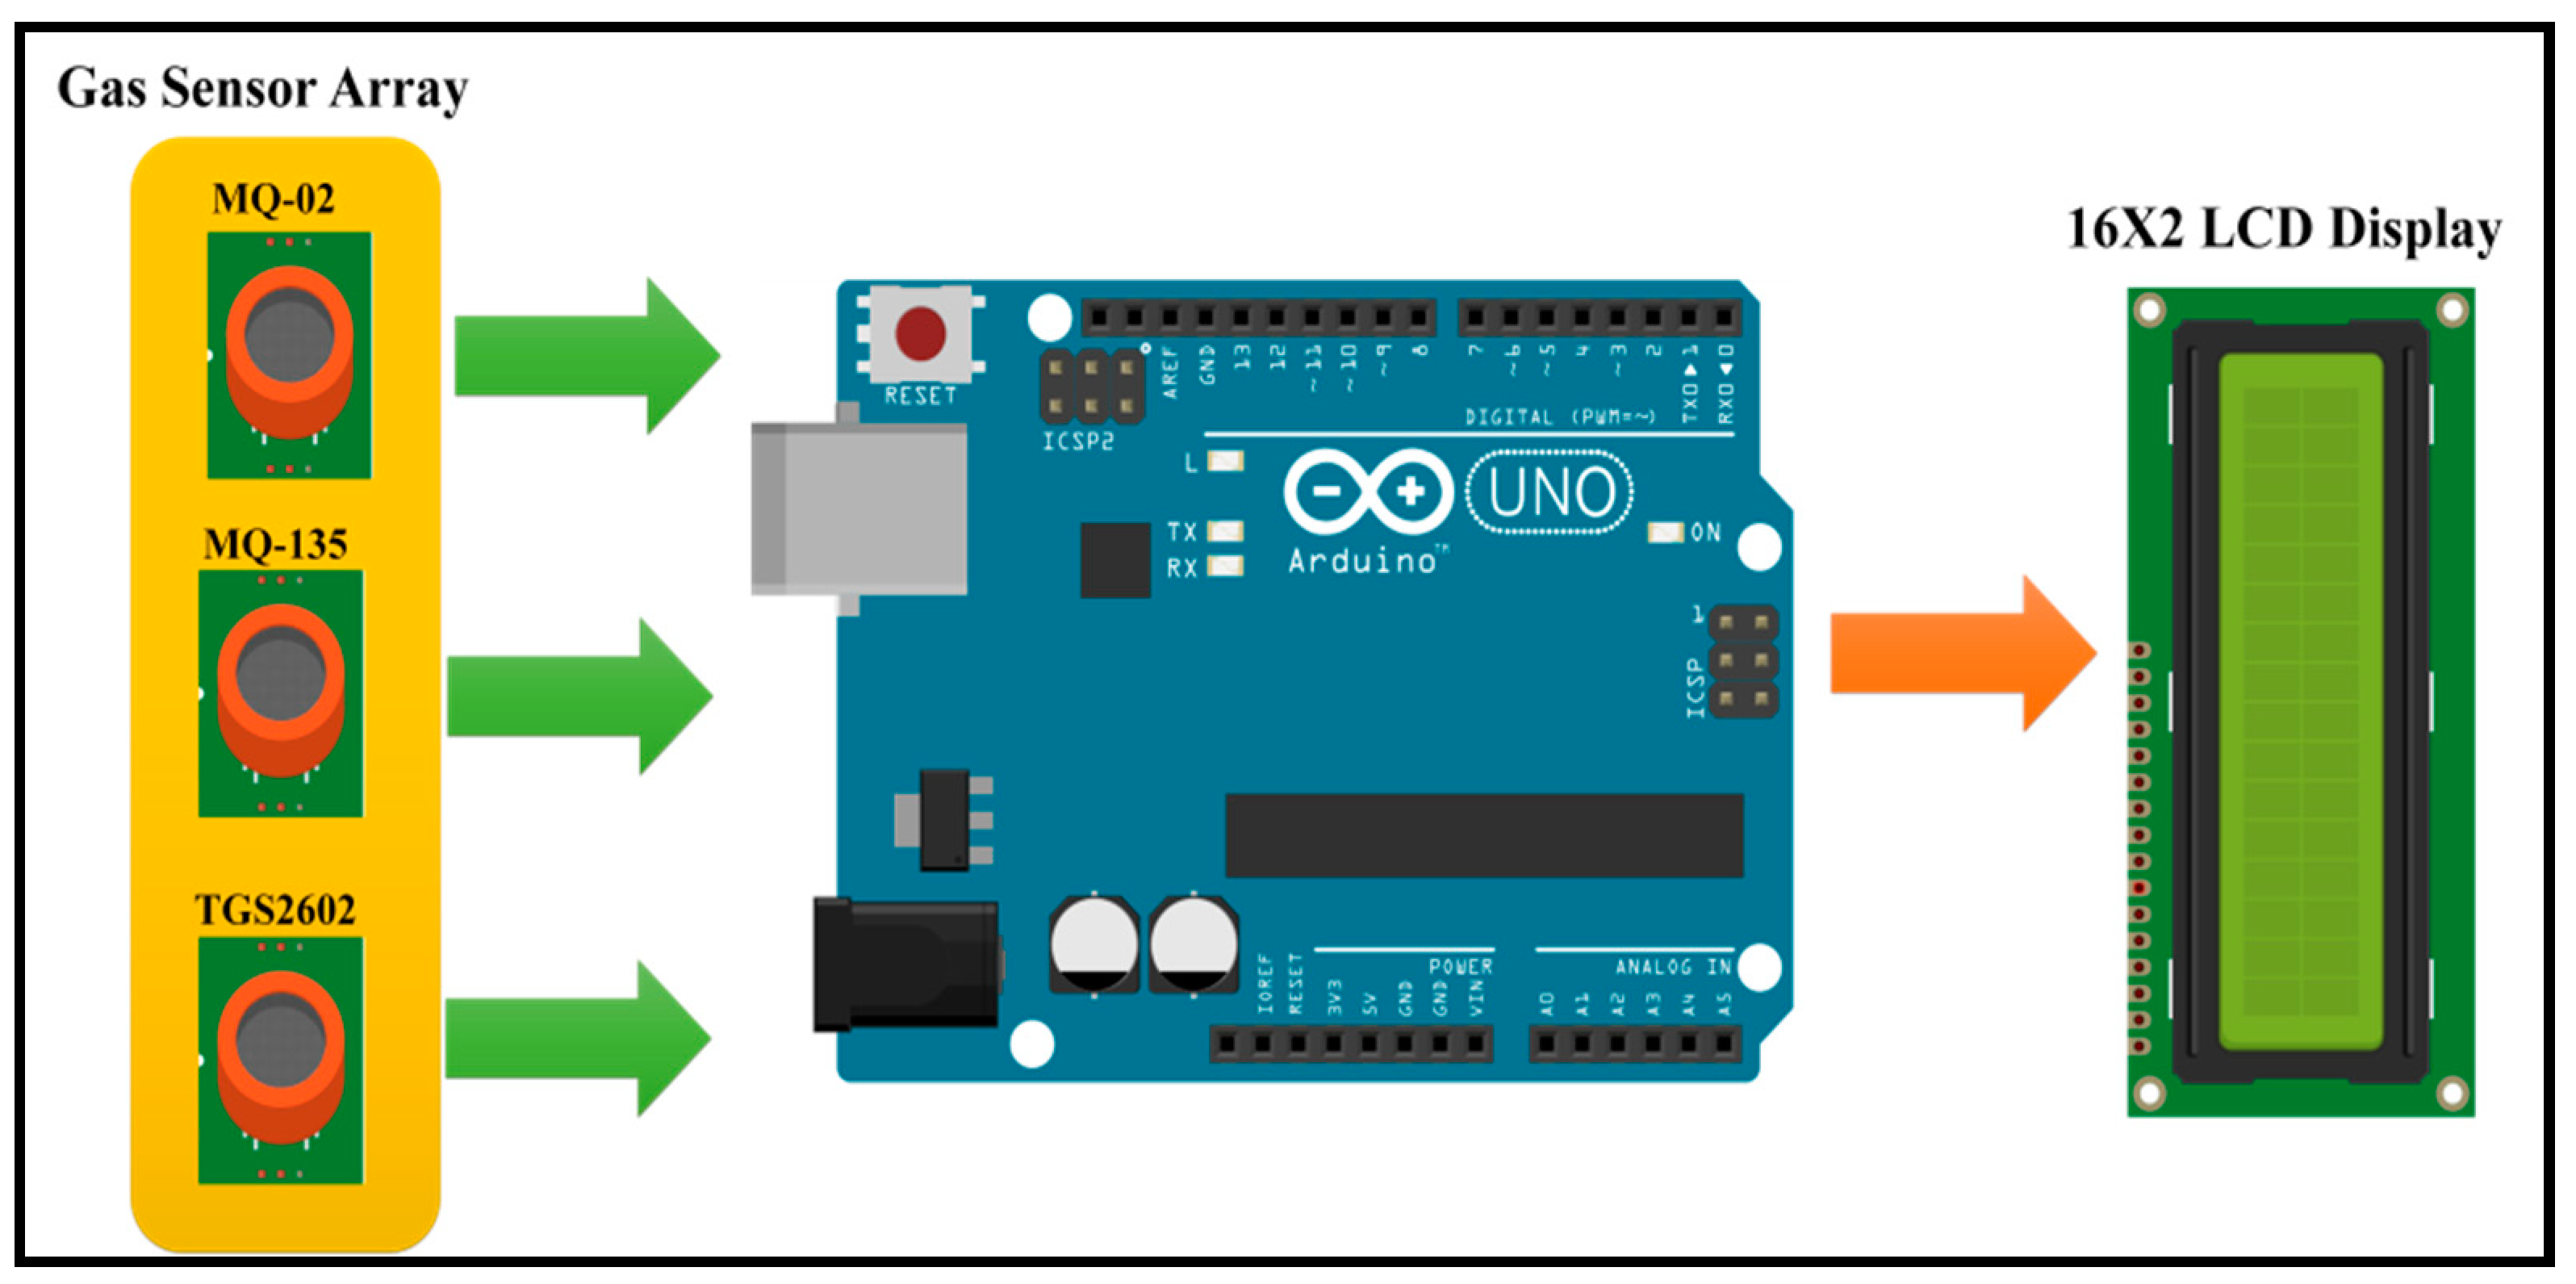
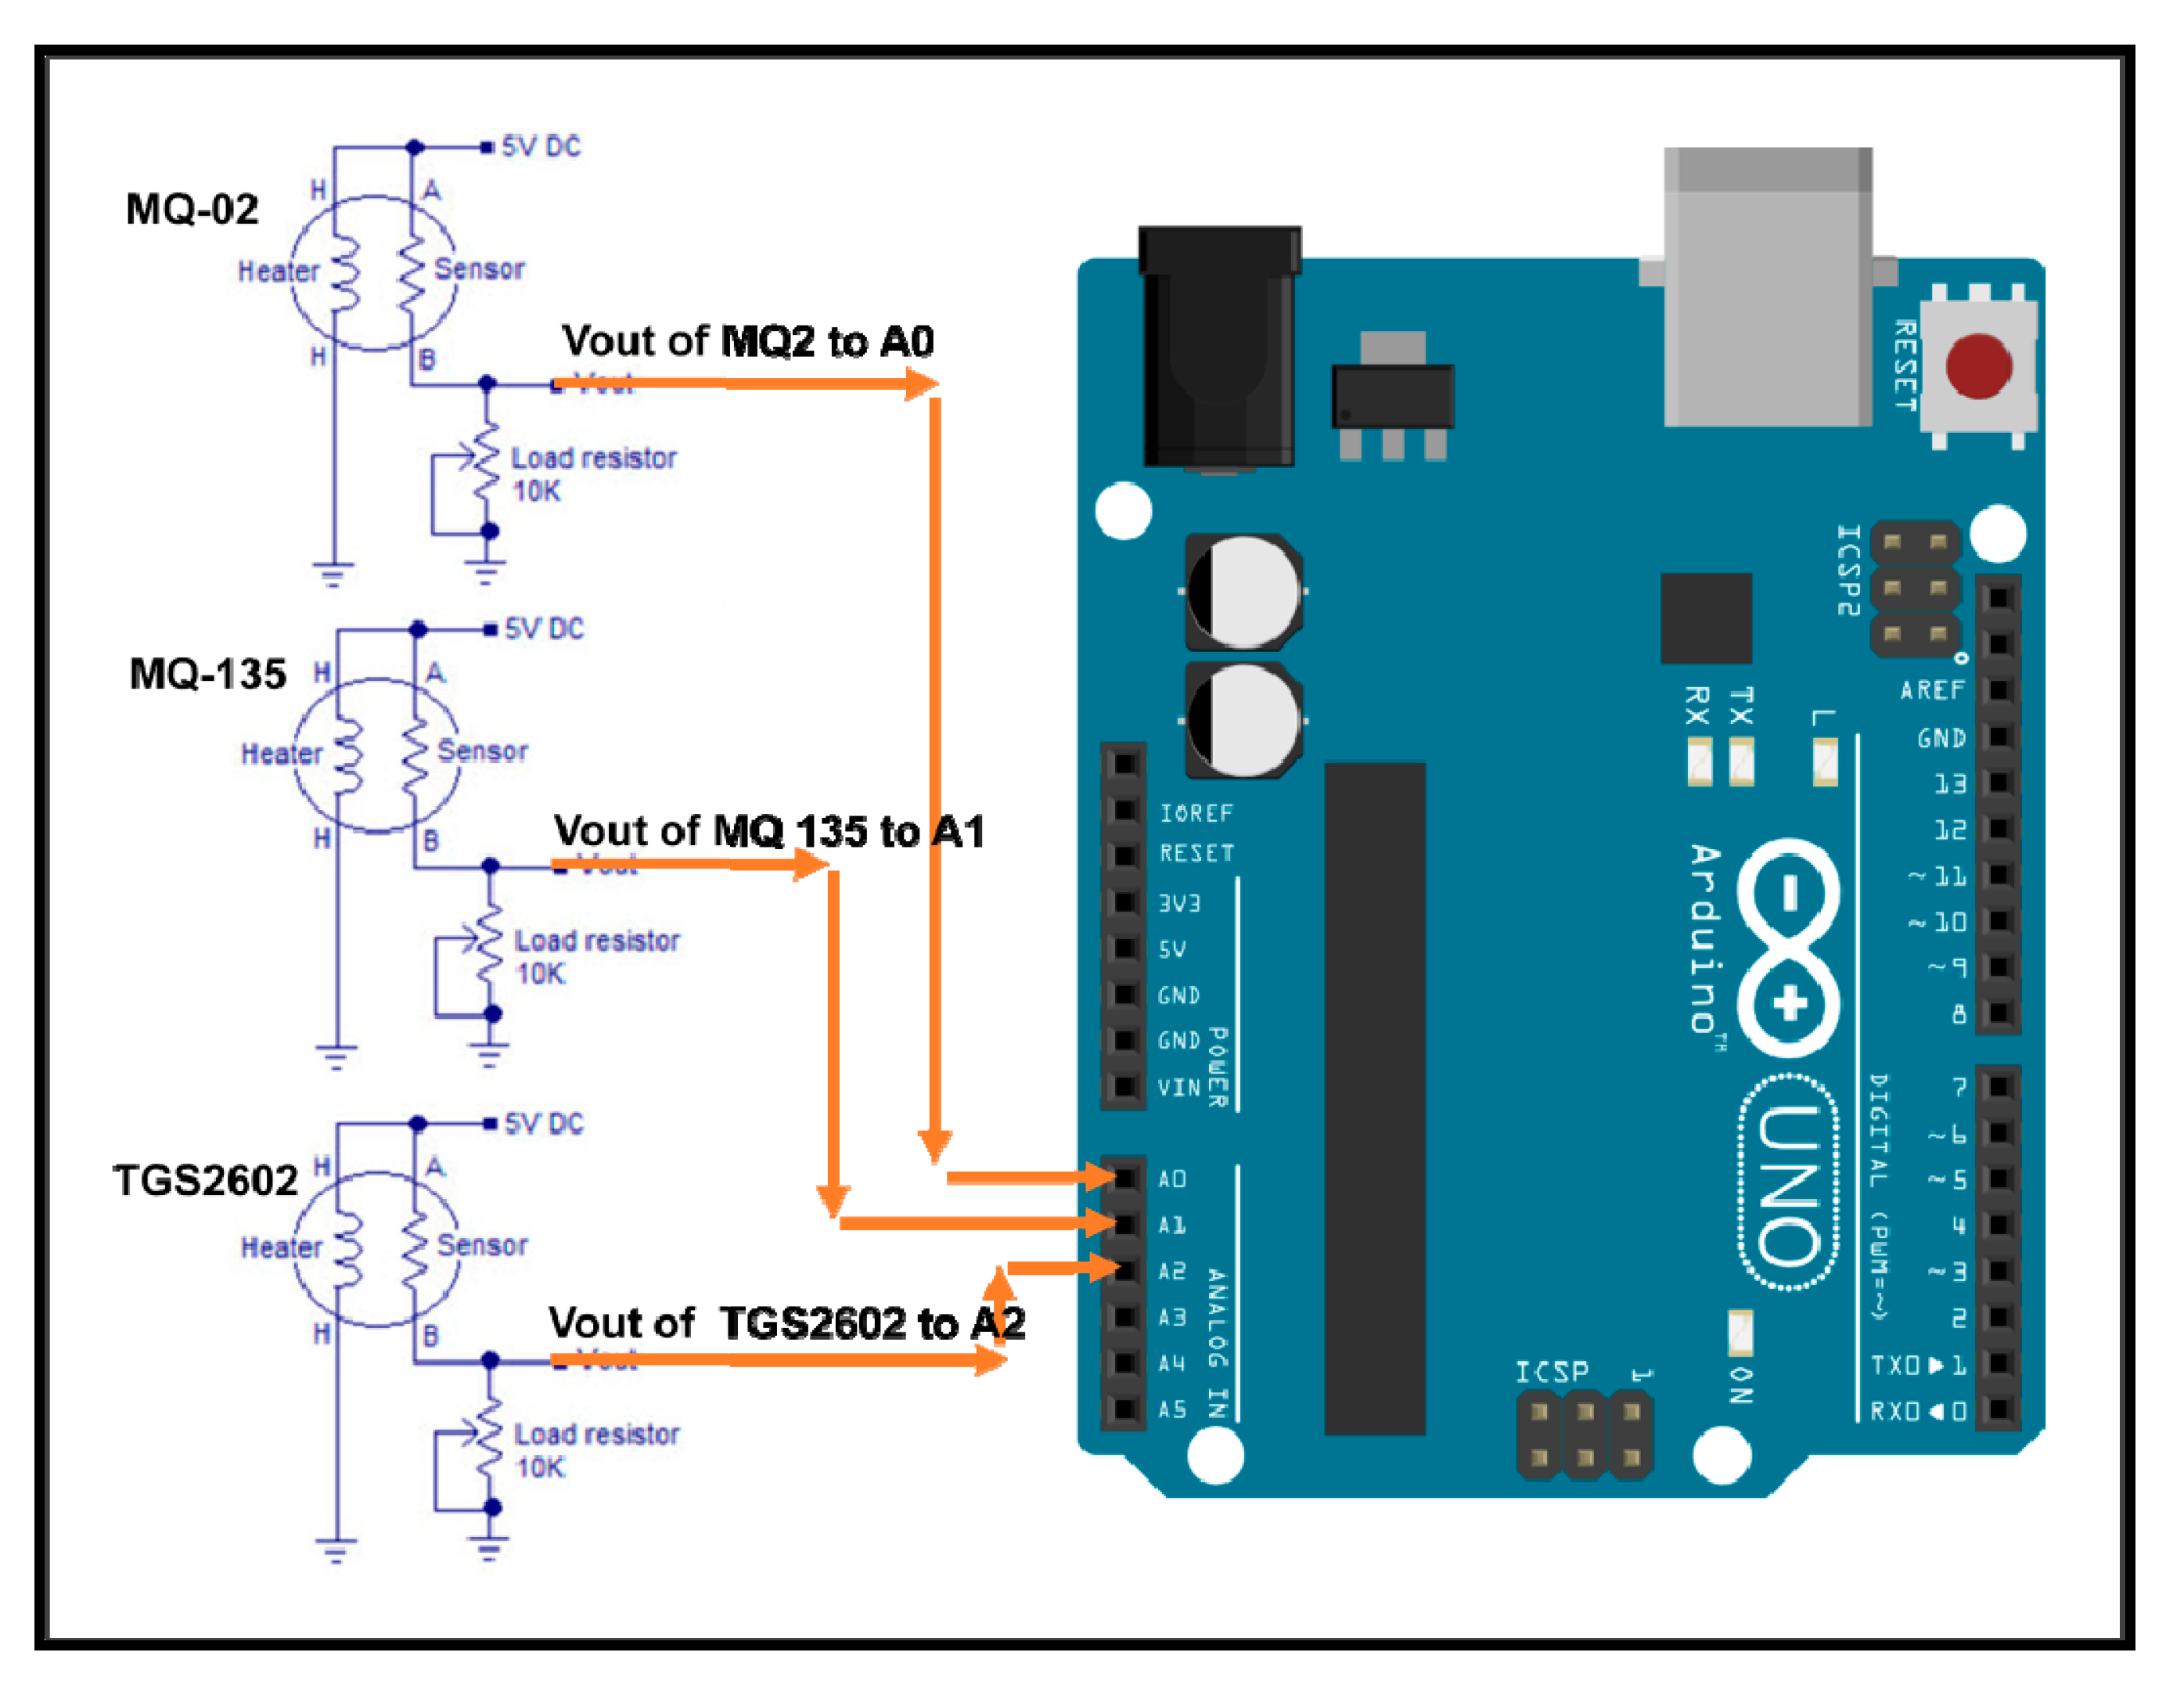
2.1. System Architecture

Figure 3 shows the system architecture of a portable gas sensor module. The system consists of Arduino Uno microcontroller, gas sensor array (MQ-02, MQ-135 and TGS2602), and LCD (16 × 2 works on 4 bit mode). Arduino reads the analog voltage from gas sensor array using a 10 bit inbuilt analogue to digital converter. After the appropriate data processing/calibration, it stores the value of gas concentration in ppm and displays on LCD.

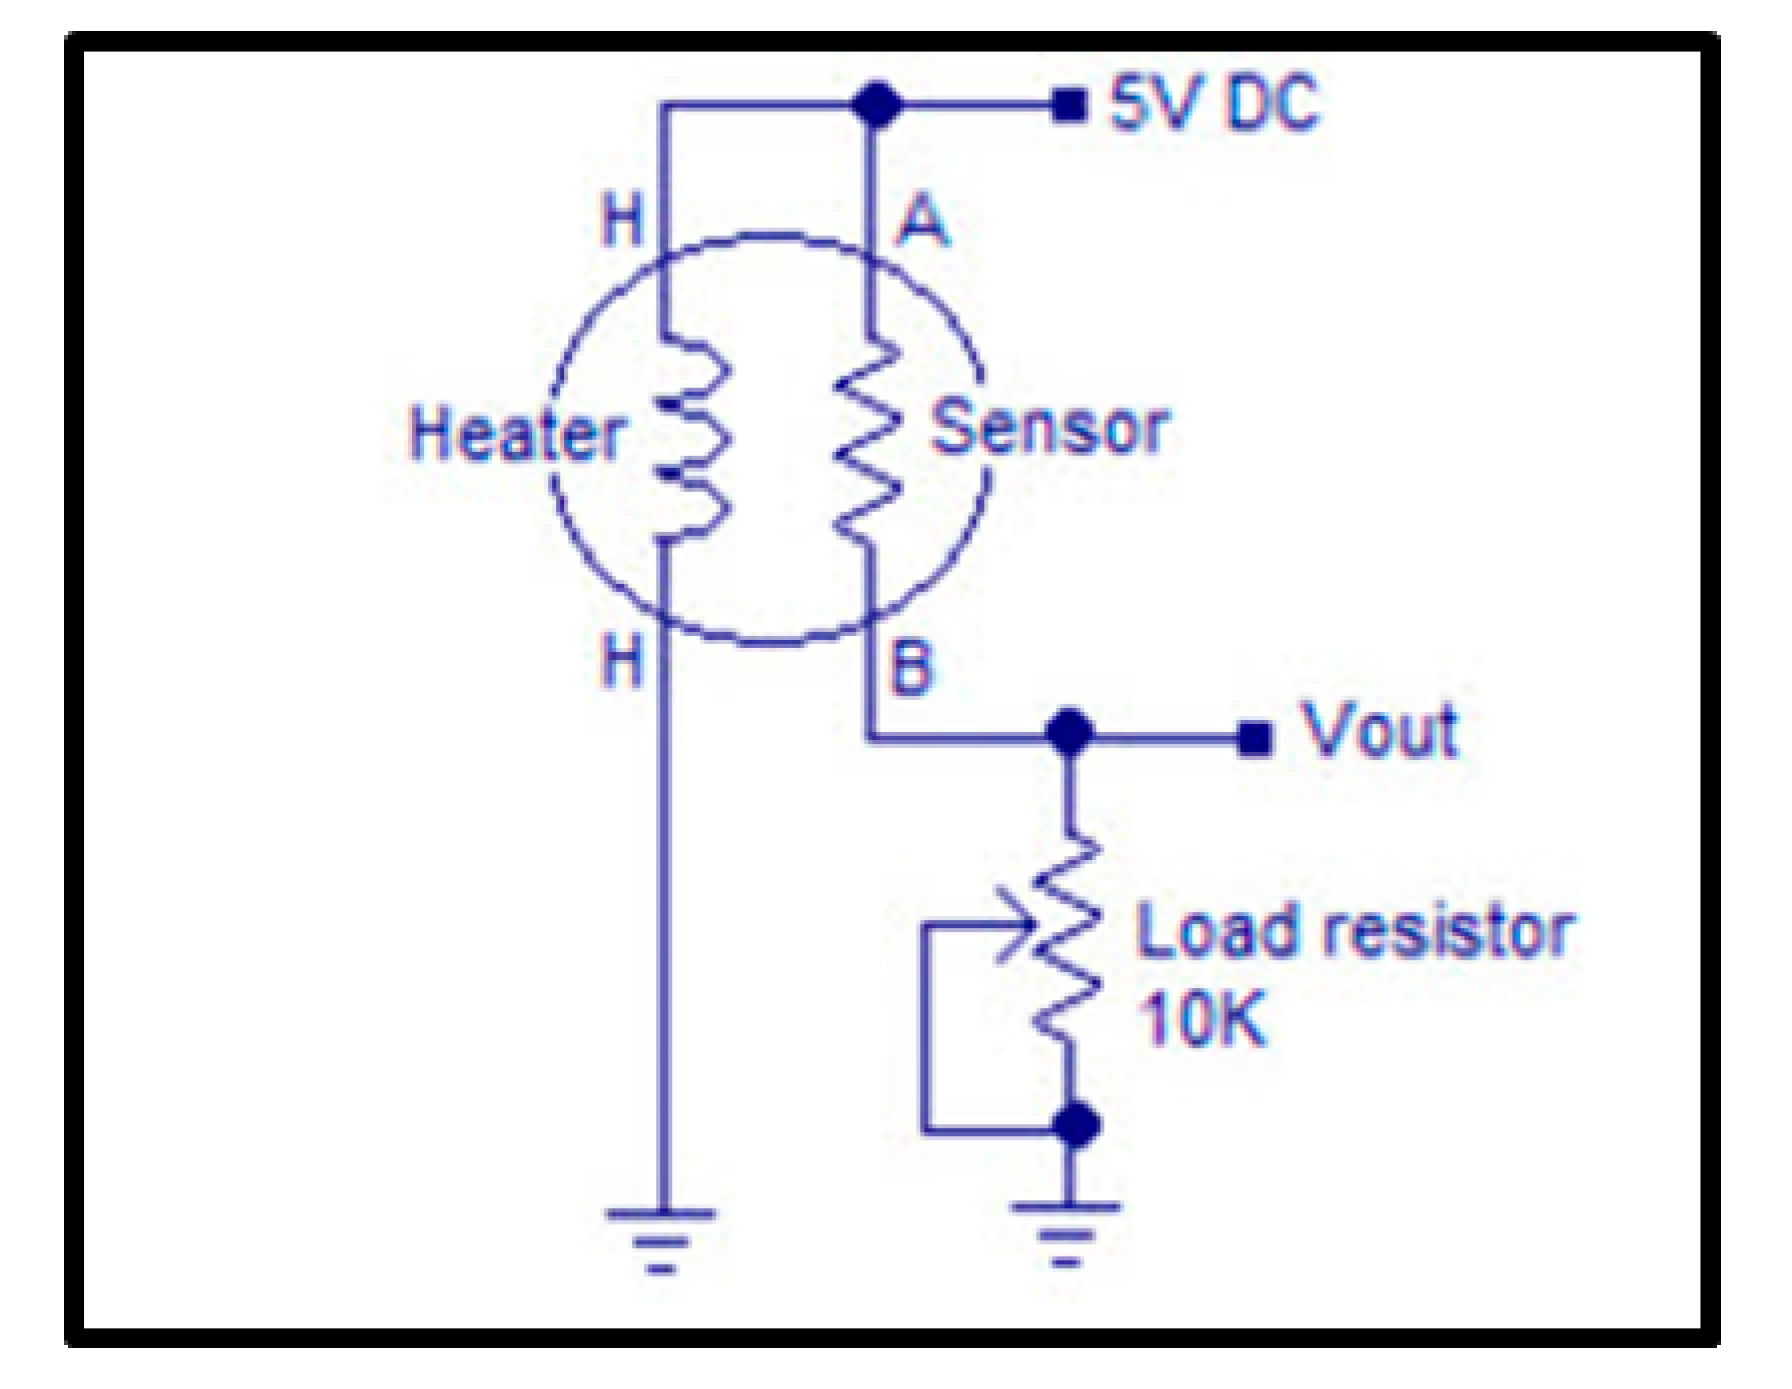
2.2. Gas Sensor Signal Conditioning and Interfacing

Figure 4 highlights the signal conditioning and interfacing of all the gas sensor with Arduino Uno. The Gas Sensor MQ2 module is useful for gas leakage detection (domestic as well as industry). It is suitable for detecting hydrogen H2, liquefied petroleum gas LPG, CH4, carbon monoxide CO, and alcohol. Due to its high sensitivity and fast response/recovery time, quick measurement records are possible. MQ-135 is an air quality monitoring sensor for detecting a wide range of gases, including ammonia NH3, nitrous oxide NOx, alcohol, benzene, smoke, and CO2. The TGS 2602 has high sensitivity towards low concentrations of odorous gases such as ammonia and H2S generated from waste materials. The sensor also has high sensitivity towards low concentrations of volatile organic compounds such as toluene emitted from wood finishing and construction products. The sensitivity of all these sensors can be adjusted by potentiometer. All the used sensors respond in term of “change in resistance” according to the aformentioned gas concentrations in ppm.
Signal conditioning MQ-02, MQ-0135 and TGS2602 sensors:
The signal conditionaing of the sensors used in the prototype development, is as follows. All the used sensors give change in resistance according gas concentration in ppm. For signal condition resistance to voltage, the simple voltage divider circuit idea is used where a gas sensor along with load resistance is used, which converts resistance to voltage. Sensor MQ-02 is connected to ADC pin A0, MQ-0135 to ADC pin A1, and TGS2602 to ADC pin A2. Figure 4 and Figure 5 show the common signal condition circuit of MQ-02, MQ-0135 and TGS2602 sensors. The calibration equation of MQ-02, MQ-0135 and TGS2602 sensor is:
Rs = (Vc/VRL − 1)
where, according to datasheet, Rs/R0 for sensor MQ-02, Rs/R0 for sensor MQ-0135, and Rs/R0 for sensor TGS2602.

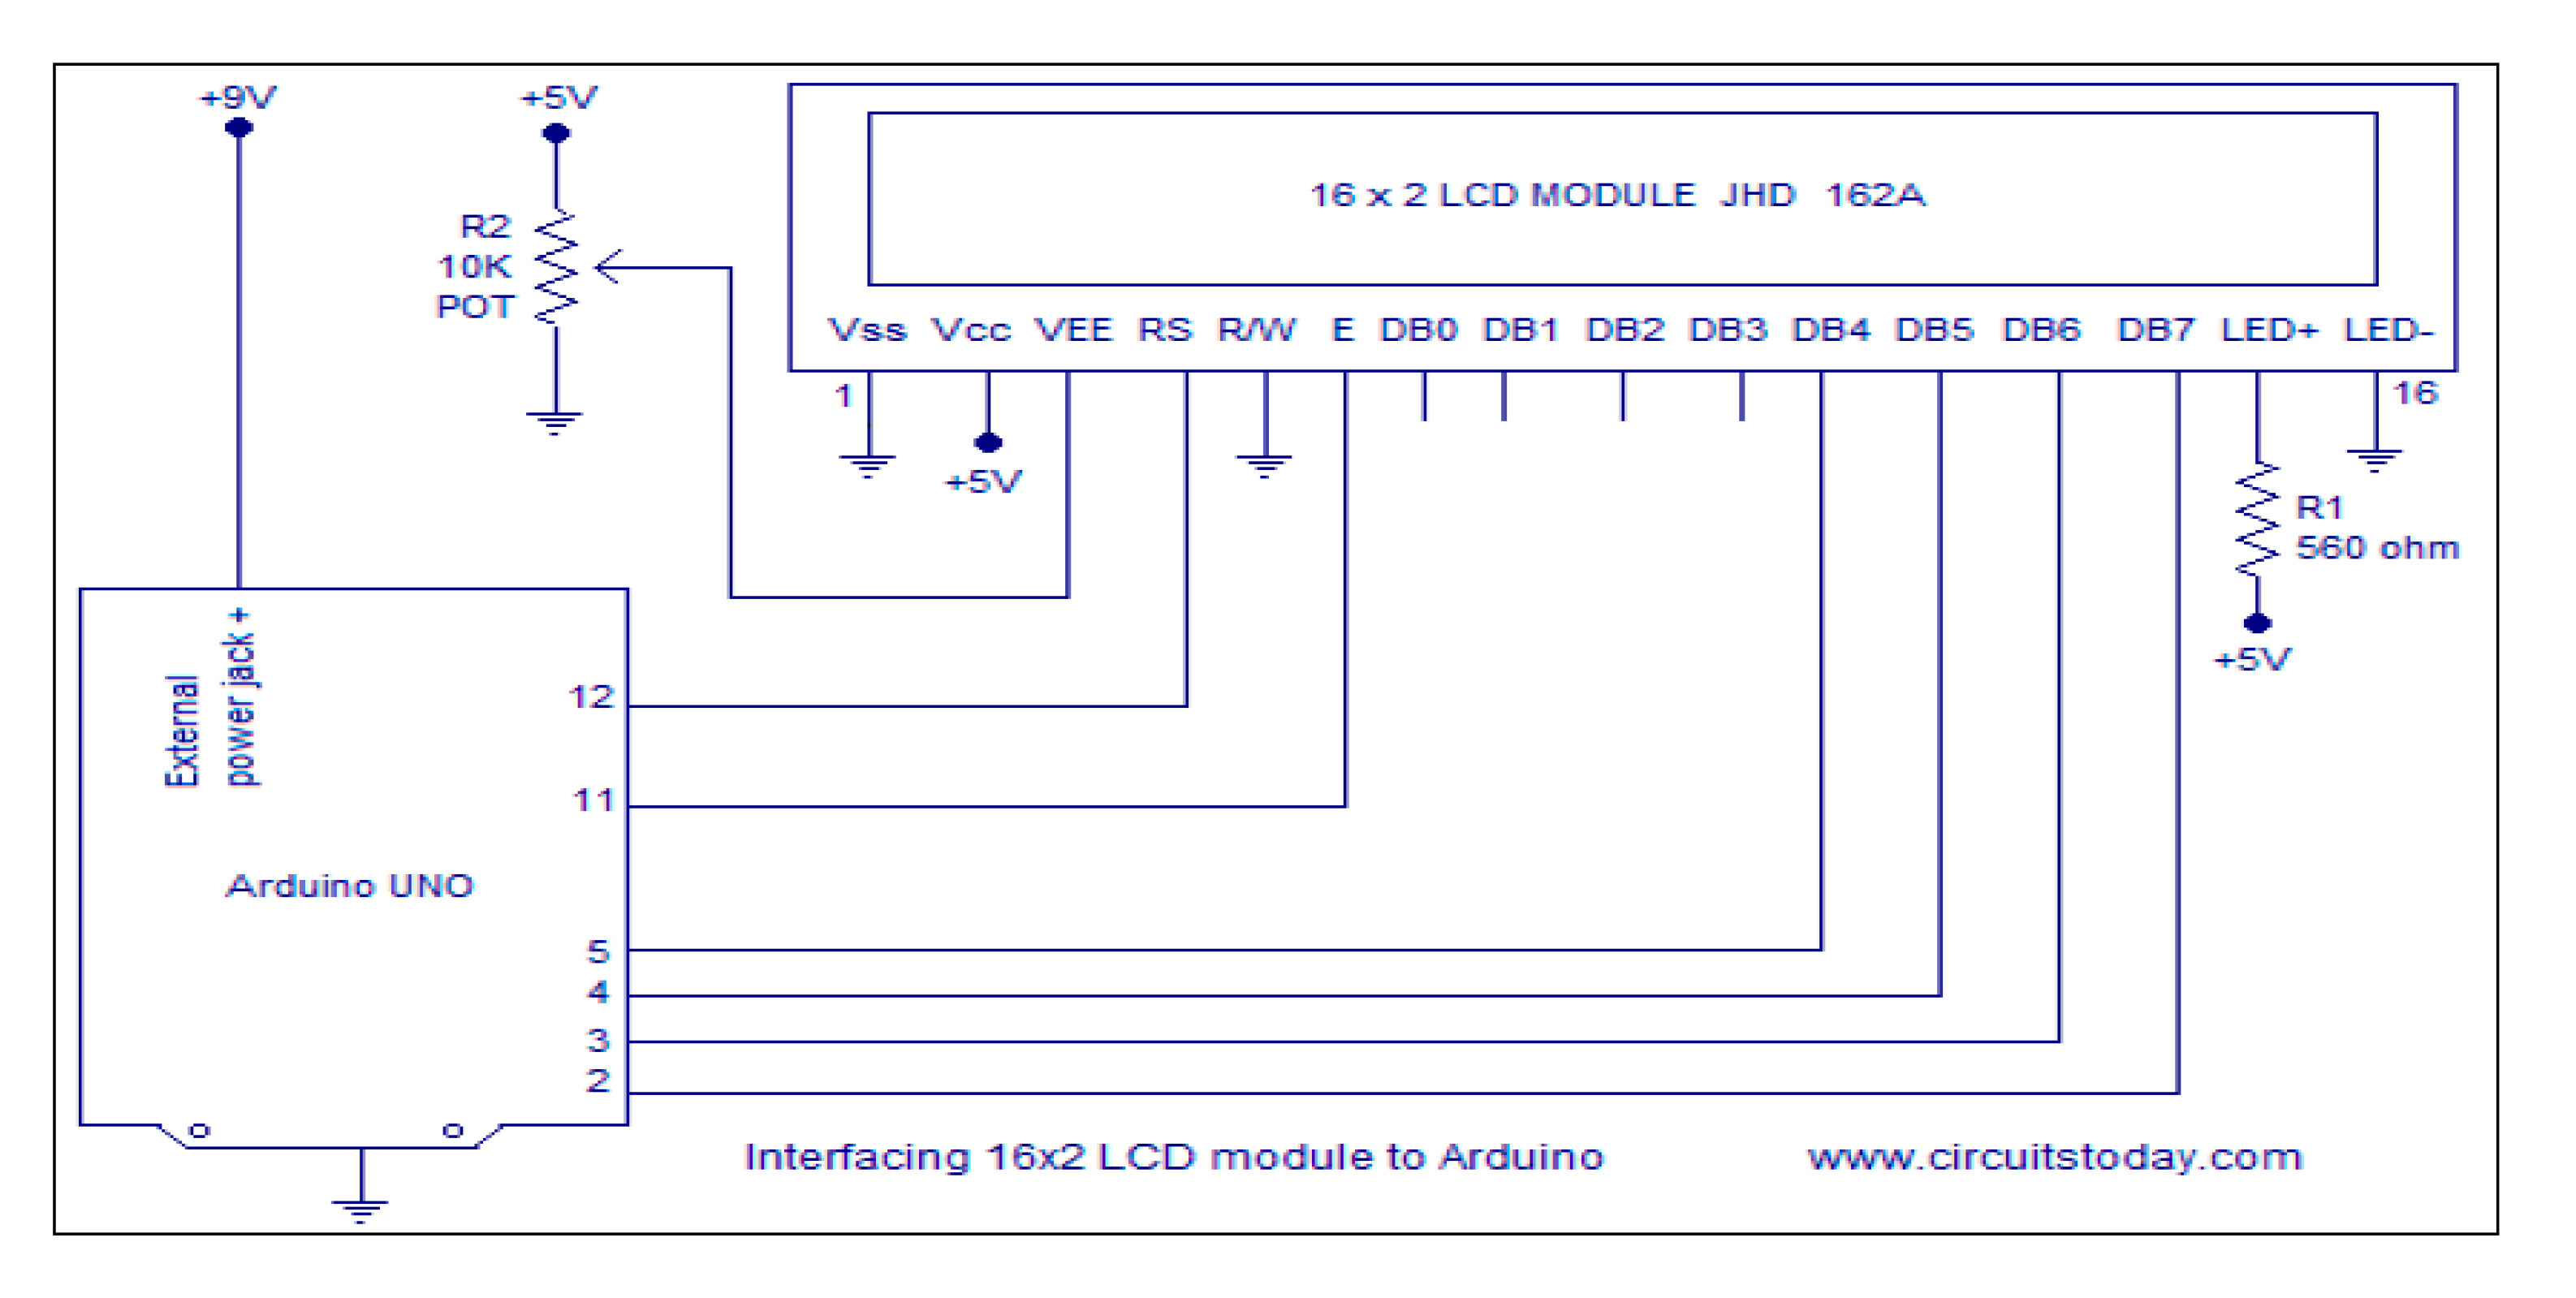
2.3. Liquid Crystal Display (LCD) Conditioning and Interfacing

A typical LCD display consists of 16 pins that control various features of the screen. A schematic of the pinscan be seen in Figure 6 below. The Arduino microcontroller can output voltages of either 5 or 3.3 V, so the LCD can be powered by wiring VSS and VDD to the ground and 5 V pins on the microcontroller. It is possible to adjust the contrast of the screen by wiring a variable resistor to V0 located at pin 3 on the screen. The RS, R/W, and E pins are wired to pins 12, ground, and 11, respectively, on the Arduino. The LCD screen can operate in both 8-bit mode and 4-bit mode.
To interface with the LCD in 4-bit mode, the Arduino only needs to be connected to pins DB4-DB7, which will connect to digital output pins 5-2, respectively. Pins 15 and 16 on the LCD screen are used to power a backlight in the screen. This makes text displayed in the screen easier to read in poorly lit environments and is optional. In order to power the backlight, pin 15 should be connected to ground while pin 16 should be connected to the 5 V output of the Arduino. To power the Arduino, a 9 V battery can be connected to the voltage input (Vin) and ground pins on the Arduino. Once all of the wiring is complete, the Arduino can write text to the LCD via programs that are loaded onto the microcontroller. Programs utilizing the JAVA programming language are then uploaded to the microcontroller via free open source software made by Arduino.

2.4. Program for Gas Sensors

2.4.1. Initialization of parameter:

  • A = 0
  • B = 0
  • C = 0

2.4.2. Initialization of system:

Start sensing gas by sensors.

2.4.3. Actual program call:

Function
i.
X = (A, B, C) = CO2
ii.
Y = (A, B, C) = CH4
iii.
Z = (A, B, C) = H2S
iv.
N = Names

2.4.4. Function Return Definition:

i.
Function X = CO2
{
A = Variable
B = Variable
C = Variable
}
ii.
Function Y = CH4
{
A = Variable
B = Variable
C = Variable
}
iii.
Function Z = H2S
{
A = Variable
B = Variable
C = Variable
}
iv.
Function N = Name
{
Display The Names
}

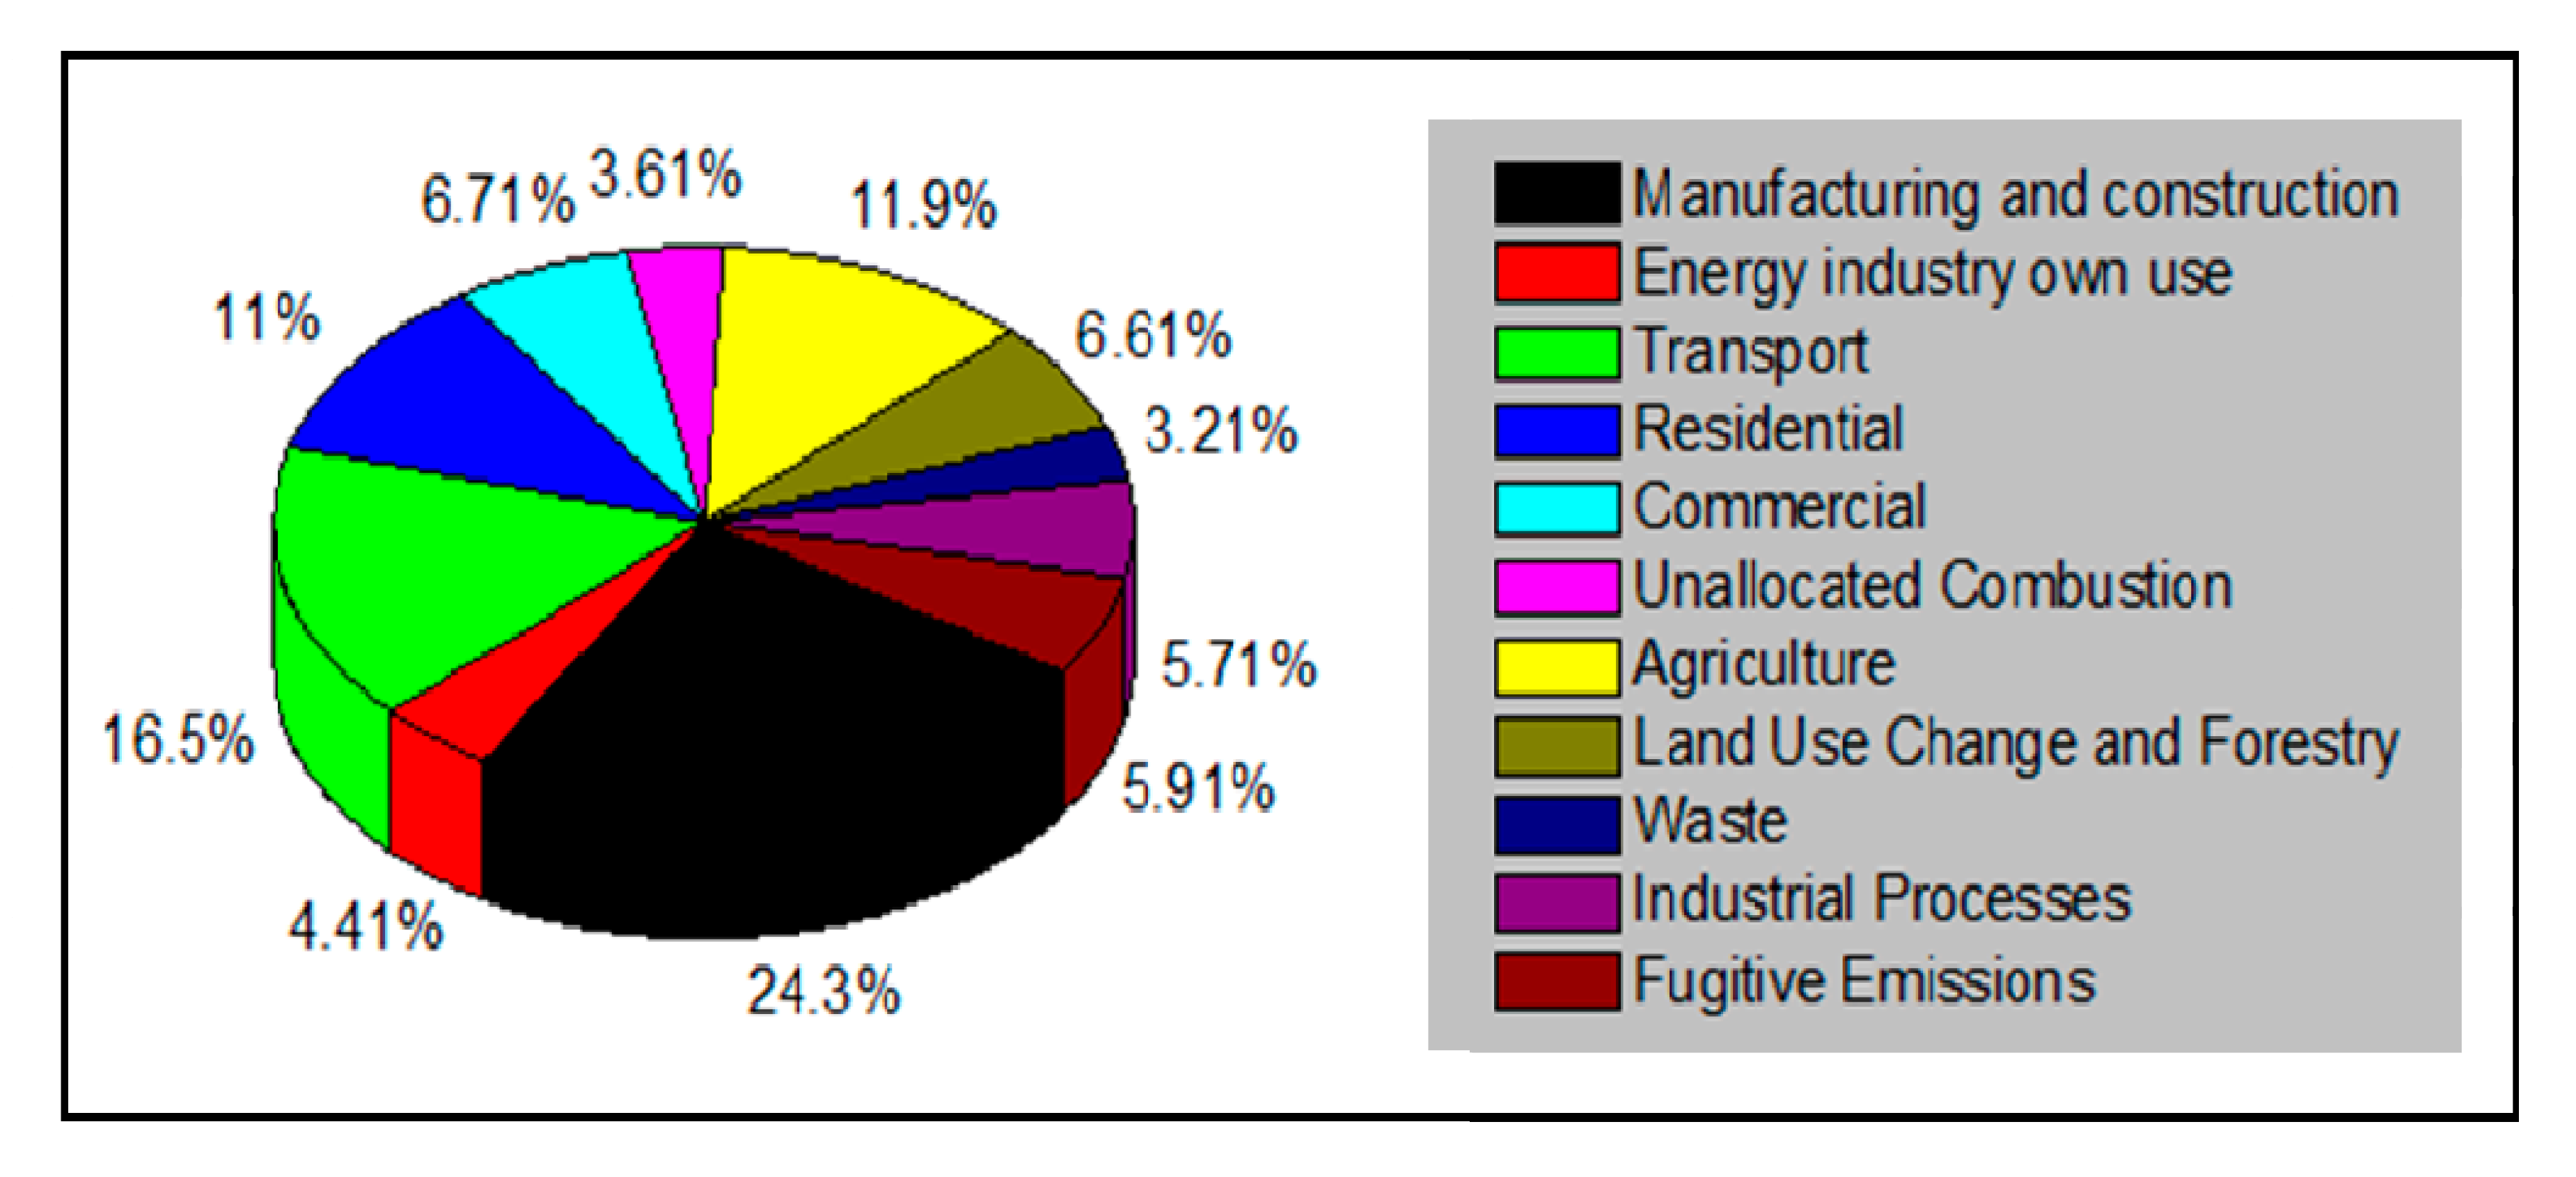
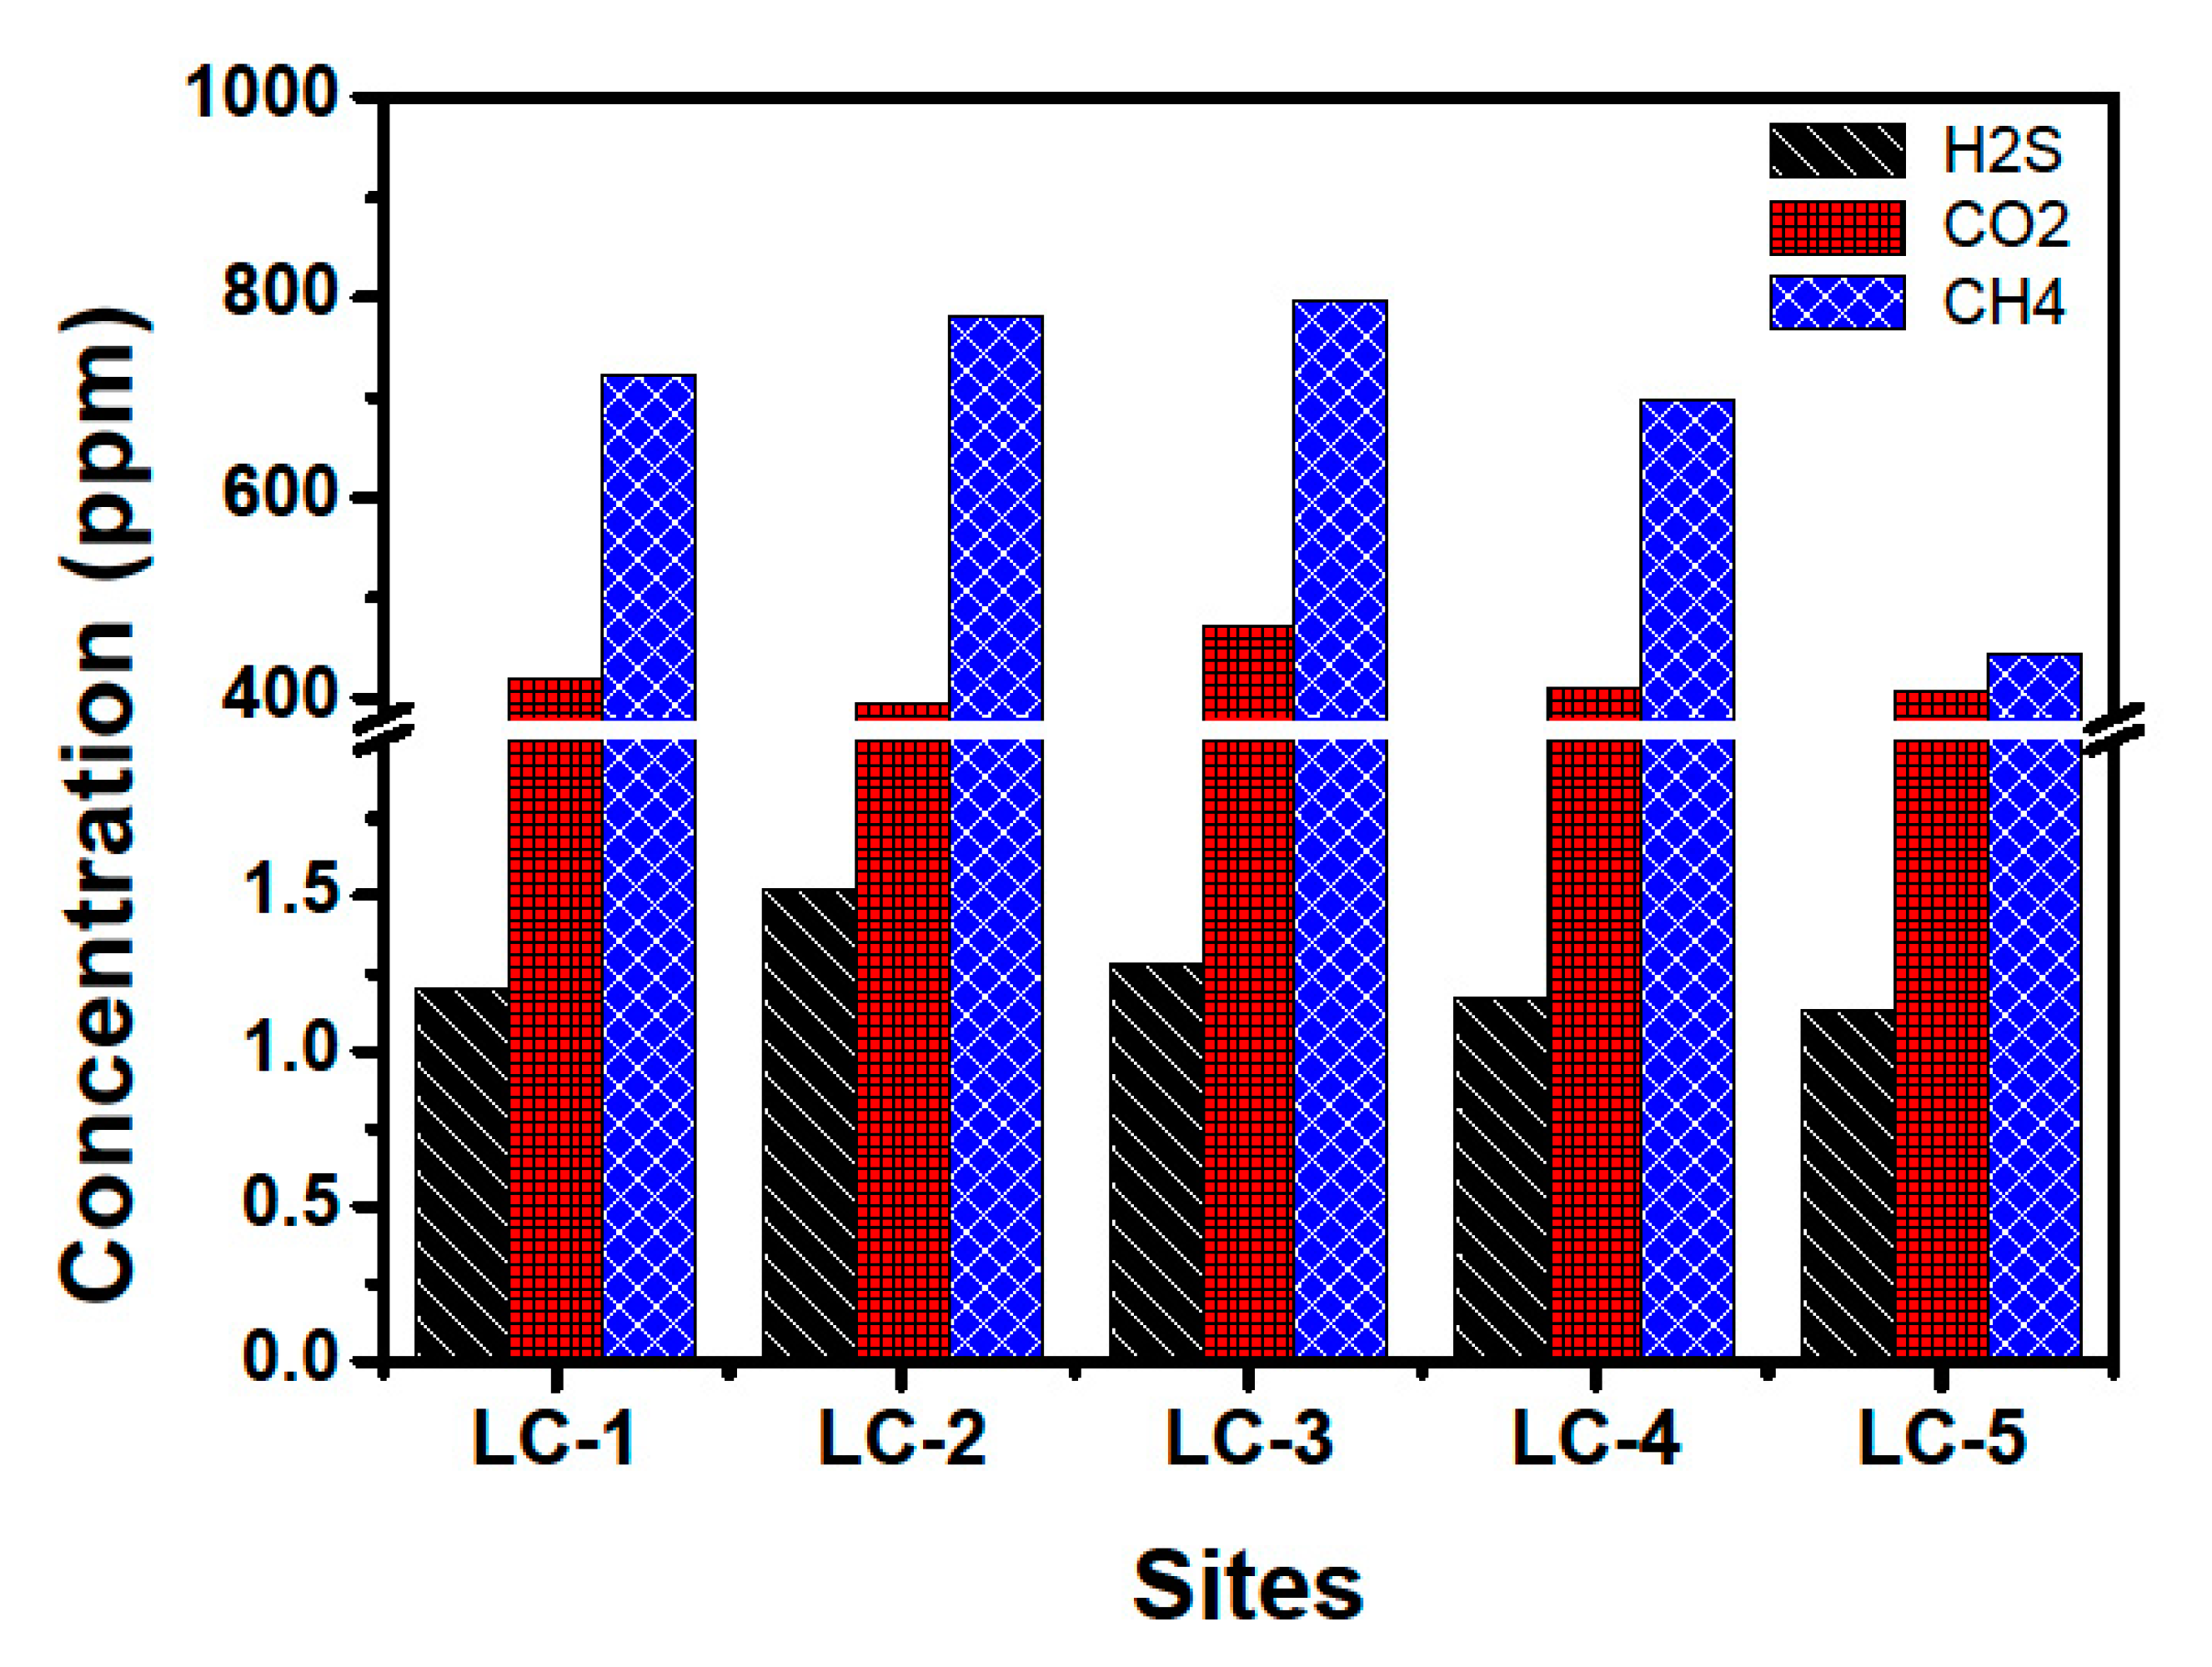
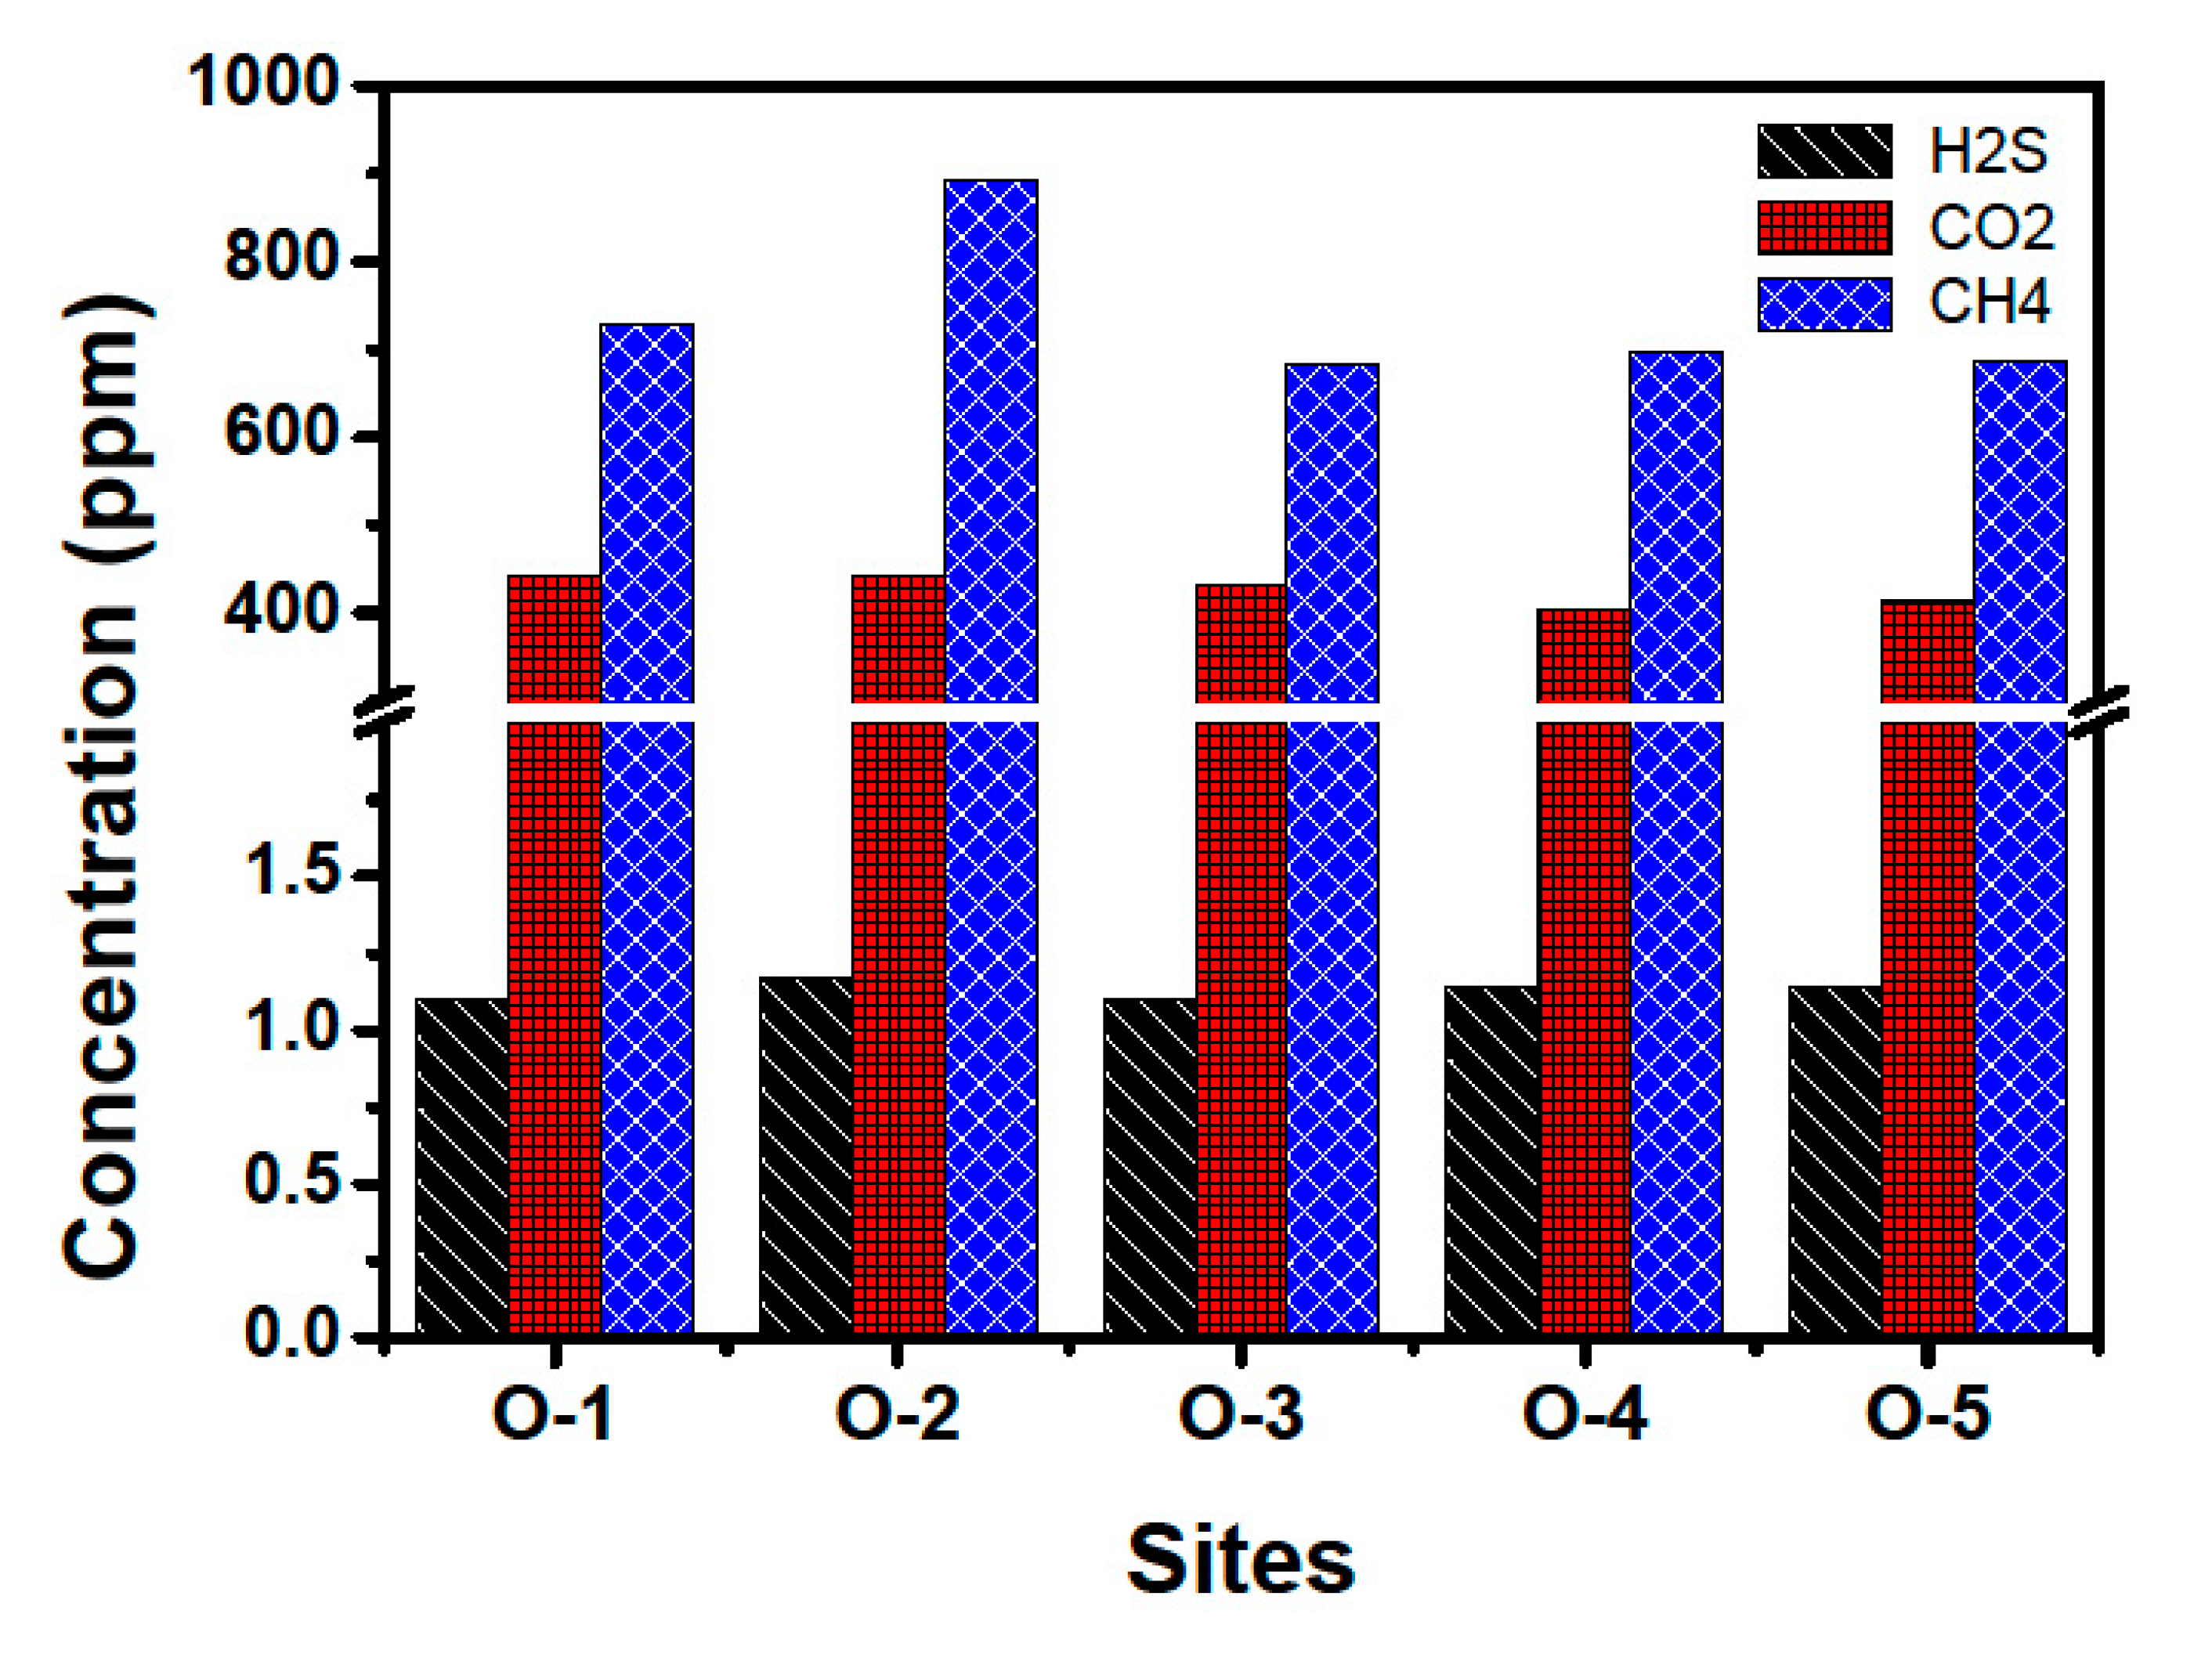
3. Validation as Greenhouse Gas Sensor Module: PART II

For the validation of the developed gas sensor module, in total, ten different sites were taken into consideration. These sites were defragmented into two categories: (i) large containers (LC) that are solid waste dumping sites, and (ii) open sites (OS) such as market place, garden area within city, traffic area, etc. The geographical identification of the sites under testing is tabulated below in Table 1 and Figure 7.
Figure 8 and Figure 9 highlight the gas sensing analysis of the developed mobile module both at large container dumping sites (Figure 8) as well as open sites (Figure 9). Within the scattered selected areas, the diversity in the production of greenhouse gases has been observed. The developed mobile module proved its measurement sensitivity in three different ranges: very low (for H2S: ~1 ppm), moderate (for CO2: ~400–500 ppm), and high (for CH4: >700 ppm).

4. Conclusions

In today’s complex lifestyle, protection amenities are of paramount importance. Gas sensors have a special location, among many other protection features, as safety utensils. In recent years, the need for gas sensors has grown immensely. Furthermore, increasing annual greenhouse emissions from different parts of society are growing high. Therefore, the unique design and prototype of portable gas sensor module for monitoring greenhouse gases is successfully materialized. The adopted commercial gas sensors (MQ-02, MQ-135, and TGS2602) were merged with the Arduino Uno. The developed software for measurements of greenhouse gases was precisely worked for all the three measurement ranges: very low (for H2S: ~1 ppm), moderate (for CO2: ~400–500 ppm), and high (for CH4: >700 ppm). Different locations in the city of Solapur, India (17.6599° N, 75.9064° E), were scanned for the usability of the developed prototype of a mobile gas sensor module, and the prototype model proved to be a sustainable mobile gas monitor and therefore the wrong alarm for toxic gases.

Author Contributions

Data curation, S.A.M.; Formal analysis, S.A.M. and J.D.N.; Funding acquisition, O.M.A.; Project administration, D.Y.N.; Software, D.Y.N. and M.S.T.; Writing—original draft, V.P.D.; Writing—review & editing, V.P.D. All authors have read and agreed to the published version of the manuscript.

Funding

The researchers supporting project number (RSP-2020/61), King Saud University, Riyadh, Saudi Arabia, for financial support.

Acknowledgments

The authors are grateful to the School of Physical Sciences and Geoinformatics PAH, Solapur University, for providing experimental facilities. D. Y. Nadargi acknowledges the UGC-DSK Postdoctoral Fellowship Scheme, India, for granting financial support to this work (Project No.F.4-2/2006(BSR)/PH/19-20/0013). Jyoti Nadargi acknowledges DST-WOSA, New Delhi, India, for awarding the Women Scientist position (SR/WOS-A/PM-2/2018 dated 28/08/2018). The authors extend their appreciation to the researchers supporting project number (RSP-2020/61), King Saud University, Riyadh, Saudi Arabia, for financial support.

Conflicts of Interest

The authors declare that there is no conflict of interest.

References

  1. NASA GISS: Science Briefs: Greenhouse Gases: Refining the Role of Carbon Dioxide. Available online: www.giss.nasa.gov (accessed on 16 November 2020).
  2. Vaclav Smil. The Earth’s Biosphere: Evolution, Dynamics, and Change; MIT Press: Cambridge, MA, USA, 2003; p. 107. ISBN 978-0-262-69298-4. [Google Scholar]
  3. IPCC. Annex III: Glossary. In Climate Change 2013: The Physical Science Basis. Contribution of Working Group I to the Fifth Assessment Report of the Intergovernmental Panel on Climate Change; Planton, S., Ed.; Cambridge University Press: Cambridge, UK; New York, NY, USA, 2013. [Google Scholar]
  4. IPCC AR4 WG1; Solomon, S.; Qin, D.; Manning, M.; Chen, Z.; Marquis, M.; Averyt, K.B.; Tignor, M.; Miller, H.L. (Eds.) Climate Change 2007: The Physical Science Basis, Contribution of Working Group I to the Fourth Assessment Report of the Intergovernmental Panel on Climate Change; Cambridge University Press: Cambridge, UK, 2007; ISBN 978-0-521-88009-1. [Google Scholar]
  5. Climate Change: Atmospheric Carbon Dioxide. NOAA Climate.gov. Available online: www.climate.gov (accessed on 16 November 2020).
  6. Deep Ice Tells Long Climate Story. BBC News, 4 September 2006. Retrieved 4 May 2010. Available online: http://news.bbc.co.uk/2/hi/science/nature/5314592.stm (accessed on 16 November 2020).
  7. Hileman, B. Ice Core Record Extended. Chem. Eng. News 2005, 83, 7. [Google Scholar] [CrossRef]
  8. Bowen, M. Thin Ice: Unlocking the Secrets of Climate in the World’s Highest Mountains; Owl Books: New York, NY, USA, 2006; ISBN 978-1429932707. [Google Scholar]
  9. Temperature Change and Carbon Dioxide Change; U.S. National Oceanic and Atmospheric Administration. Available online: https://www.ncdc.noaa.gov/global-warming/temperature-change (accessed on 16 November 2020).
  10. Global Greenhouse Gas Emissions Data; U.S. Environmental Protection Agency. Available online: https://www.epa.gov/ghgemissions/global-greenhouse-gas-emissions-data (accessed on 16 November 2020).
  11. IPCC. Climate Change 2014: Synthesis Report. Contribution of Working Groups I, II and III to the Fifth Assessment Report of the Intergovernmental Panel on Climate Change; Core Writing Team, Pachauri, R.K., Meyer, L.A., Eds.; IPCC: Geneva, Switzerland, 2014; 151p. [Google Scholar]
  12. Enhanced Greenhouse Effect—Glossary. Nova. Australian Academy of Scihuman Impact on the Environment. 2006. Available online: https://www.science.org.au/curious/earth-environment/enhanced-greenhouse-effect (accessed on 16 November 2020).
  13. Hansen, J. A slippery slope: How much global warming constitutes “dangerous anthropogenic interference”? Clim. Chang. 2005, 68, 269–279. [Google Scholar] [CrossRef]
  14. Greenhouse Gas. Available online: https://en.wikipedia.org/wiki/Greenhouse_gas#cite_ref-11 (accessed on 16 November 2020).
  15. David, G.; Zhou, D. Climate Change 2014 Mitigation of Climate Change, Ch.1: Introductory Chapter. Fifth Assessment Report of the Intergovernmental Panel on Climate Change. Available online: https://www.ipcc.ch/site/assets/uploads/2018/02/ipcc_wg3_ar5_full.pdf (accessed on 16 November 2020).
  16. Karl, T.R.; Trenberth, K.E. Modern global climate change. Science 2003, 302, 1719–1723. [Google Scholar] [CrossRef] [PubMed] [Green Version]
  17. Bolle, H.J.; Seiler, W.; Bolin, B. Other greenhouse gases and aerosols; assessing their role for atmospheric radiative transfer. In The Greenhouse Effect, Climatic Change and Ecosystems; Bolin, B., Doos, B.R., Warrick, B., Jager, D., Eds.; John Wiley and Sons: New York, NY, USA, 1986. [Google Scholar]
  18. Vilda, F. Feeding systems based on sugar cane. In Integration of Livestock with Crops in Response to Increasing Population Pressure on Available Resources; Preston, T.R., Rosales, M., Eds.; CTA: Wageningen, The Netherlands, 1989. [Google Scholar]
  19. Chansin, G.; Pugh, D. Environmental Gas Sensors 2017–2027: Technologies, Manufacturers, Forecasts. Scientific Report. 2017. Available online: www.idtechex.com/research/reports/environmental-gas-sensors-2017-2027-000500.asp (accessed on 16 November 2020).
  20. Jiang, L. Environmental Gas Sensors 2020–2030: Technologies, Manufacturers, Forecasts. Scientific Report. 2020. Available online: https://www.idtechex.com/en/research-report/environmental-gas-sensors-2020-2030/718 (accessed on 16 November 2020).
  21. Shaikh, S.F.; Ghule, B.G.; Nakate, U.T.; Shinde, P.V.; Ekar, S.U.; O’Dwyer, C.; Kim, K.H.; Mane, R.S. Low-Temperature Ionic Layer Adsorption and Reaction Grown Anatase TiO2 Nanocrystalline Films for Efficient Perovskite Solar Cell and Gas Sensor Applications. Sci. Rep. 2018, 8, 11016. [Google Scholar] [CrossRef] [PubMed] [Green Version]
  22. Waghmare, S.D.; Raut, S.D.; Ghule, B.G.; Jadhav, V.V.; Shaikh, S.F.; Al-Enizi, A.M.; Ubaidullah, M.; Nafady, A.; Thamer, B.M.; Mane, R.S. Pristine and palladium-doped perovskite bismuth ferrites and theirnitrogen dioxide gas sensor studies. J. King Saud Univ. Sci. 2020, 32, 3125–3130. [Google Scholar] [CrossRef]
  23. Mehta, S.S.; Nadargi, D.Y.; Tamboli, M.S.; Chaudhary, L.S.; Patil, P.S.; Mulla, I.; Suryavanshi, S.S. Ru-Loaded mesoporous WO3 microflowers for dual applications: Enhanced H2S sensing and sunlight-driven photocatalysis. Dalton Trans. 2018, 47, 16840–16845. [Google Scholar] [CrossRef] [PubMed]
  24. Shaikh, S.F.; Ghule, B.G.; Shinde, P.V.; Raut, S.D.; Gore, S.; Ubaidullah, M.; Mane, R.S.; Al-Enizi, A.M. Continuous hydrothermal flow-inspired synthesis and ultra-fast ammonia and humidity room-temperature sensor activities of WO3 nanobricks. Mater. Res. Express 2020, 7, 015076. [Google Scholar] [CrossRef]
  25. Nadargi, D.Y.; Tamboli, M.S.; Patil, S.S.; Dateer, R.B.; Mulla, I.S.; Choi, H.; Suryavanshi, S.S. Microwave-Epoxide-Assisted Hydrothermal Synthesis of the CuO/ZnO Heterojunction: A Highly Versatile Route to Develop H2S Gas Sensors. ACS Omega 2020, 5, 8587–8595. [Google Scholar] [CrossRef] [PubMed] [Green Version]
  26. Yang, L.; Wang, Z.; Zhou, X.; Wu, X.; Han, N.; Chen, Y. Synthesis of Pd-loaded mesoporous SnO2 hollow spheres for highly sensitive and stable methane gas sensors. RSC Adv. 2018, 8, 24268–24275. [Google Scholar] [CrossRef] [Green Version]
  27. Juang, F.-R.; Chern, W.-C.; Chen, B.-Y. Carbon dioxide gas sensing properties of ZnSn(OH)6-ZnO nanocomposites with ZnO nanorod structures. Thin Solid Films 2018, 660, 771–776. [Google Scholar] [CrossRef]
  28. Aldhafeeri, T.; Tran, M.-K.; Vrolyk, R.; Pope, M.A.; Fowler, M. A Review of Methane Gas Detection Sensors: Recent Developments and Future Perspectives. Inventions 2020, 5, 28. [Google Scholar] [CrossRef]
  29. Khan, A.H.; Rao, M.V.; Li, Q. Recent Advances in Electrochemical Sensors for Detecting Toxic Gases: NO2, SO2 and H2S. Sensors 2019, 19, 905. [Google Scholar] [CrossRef] [PubMed] [Green Version]
  30. Santhanam, K.S.V.; Ahamed, N.N.N. Greenhouse Gas Sensors Fabricated with New Materials for Climatic Usage: A Review. ChemEngineering 2018, 2, 38. [Google Scholar] [CrossRef] [Green Version]
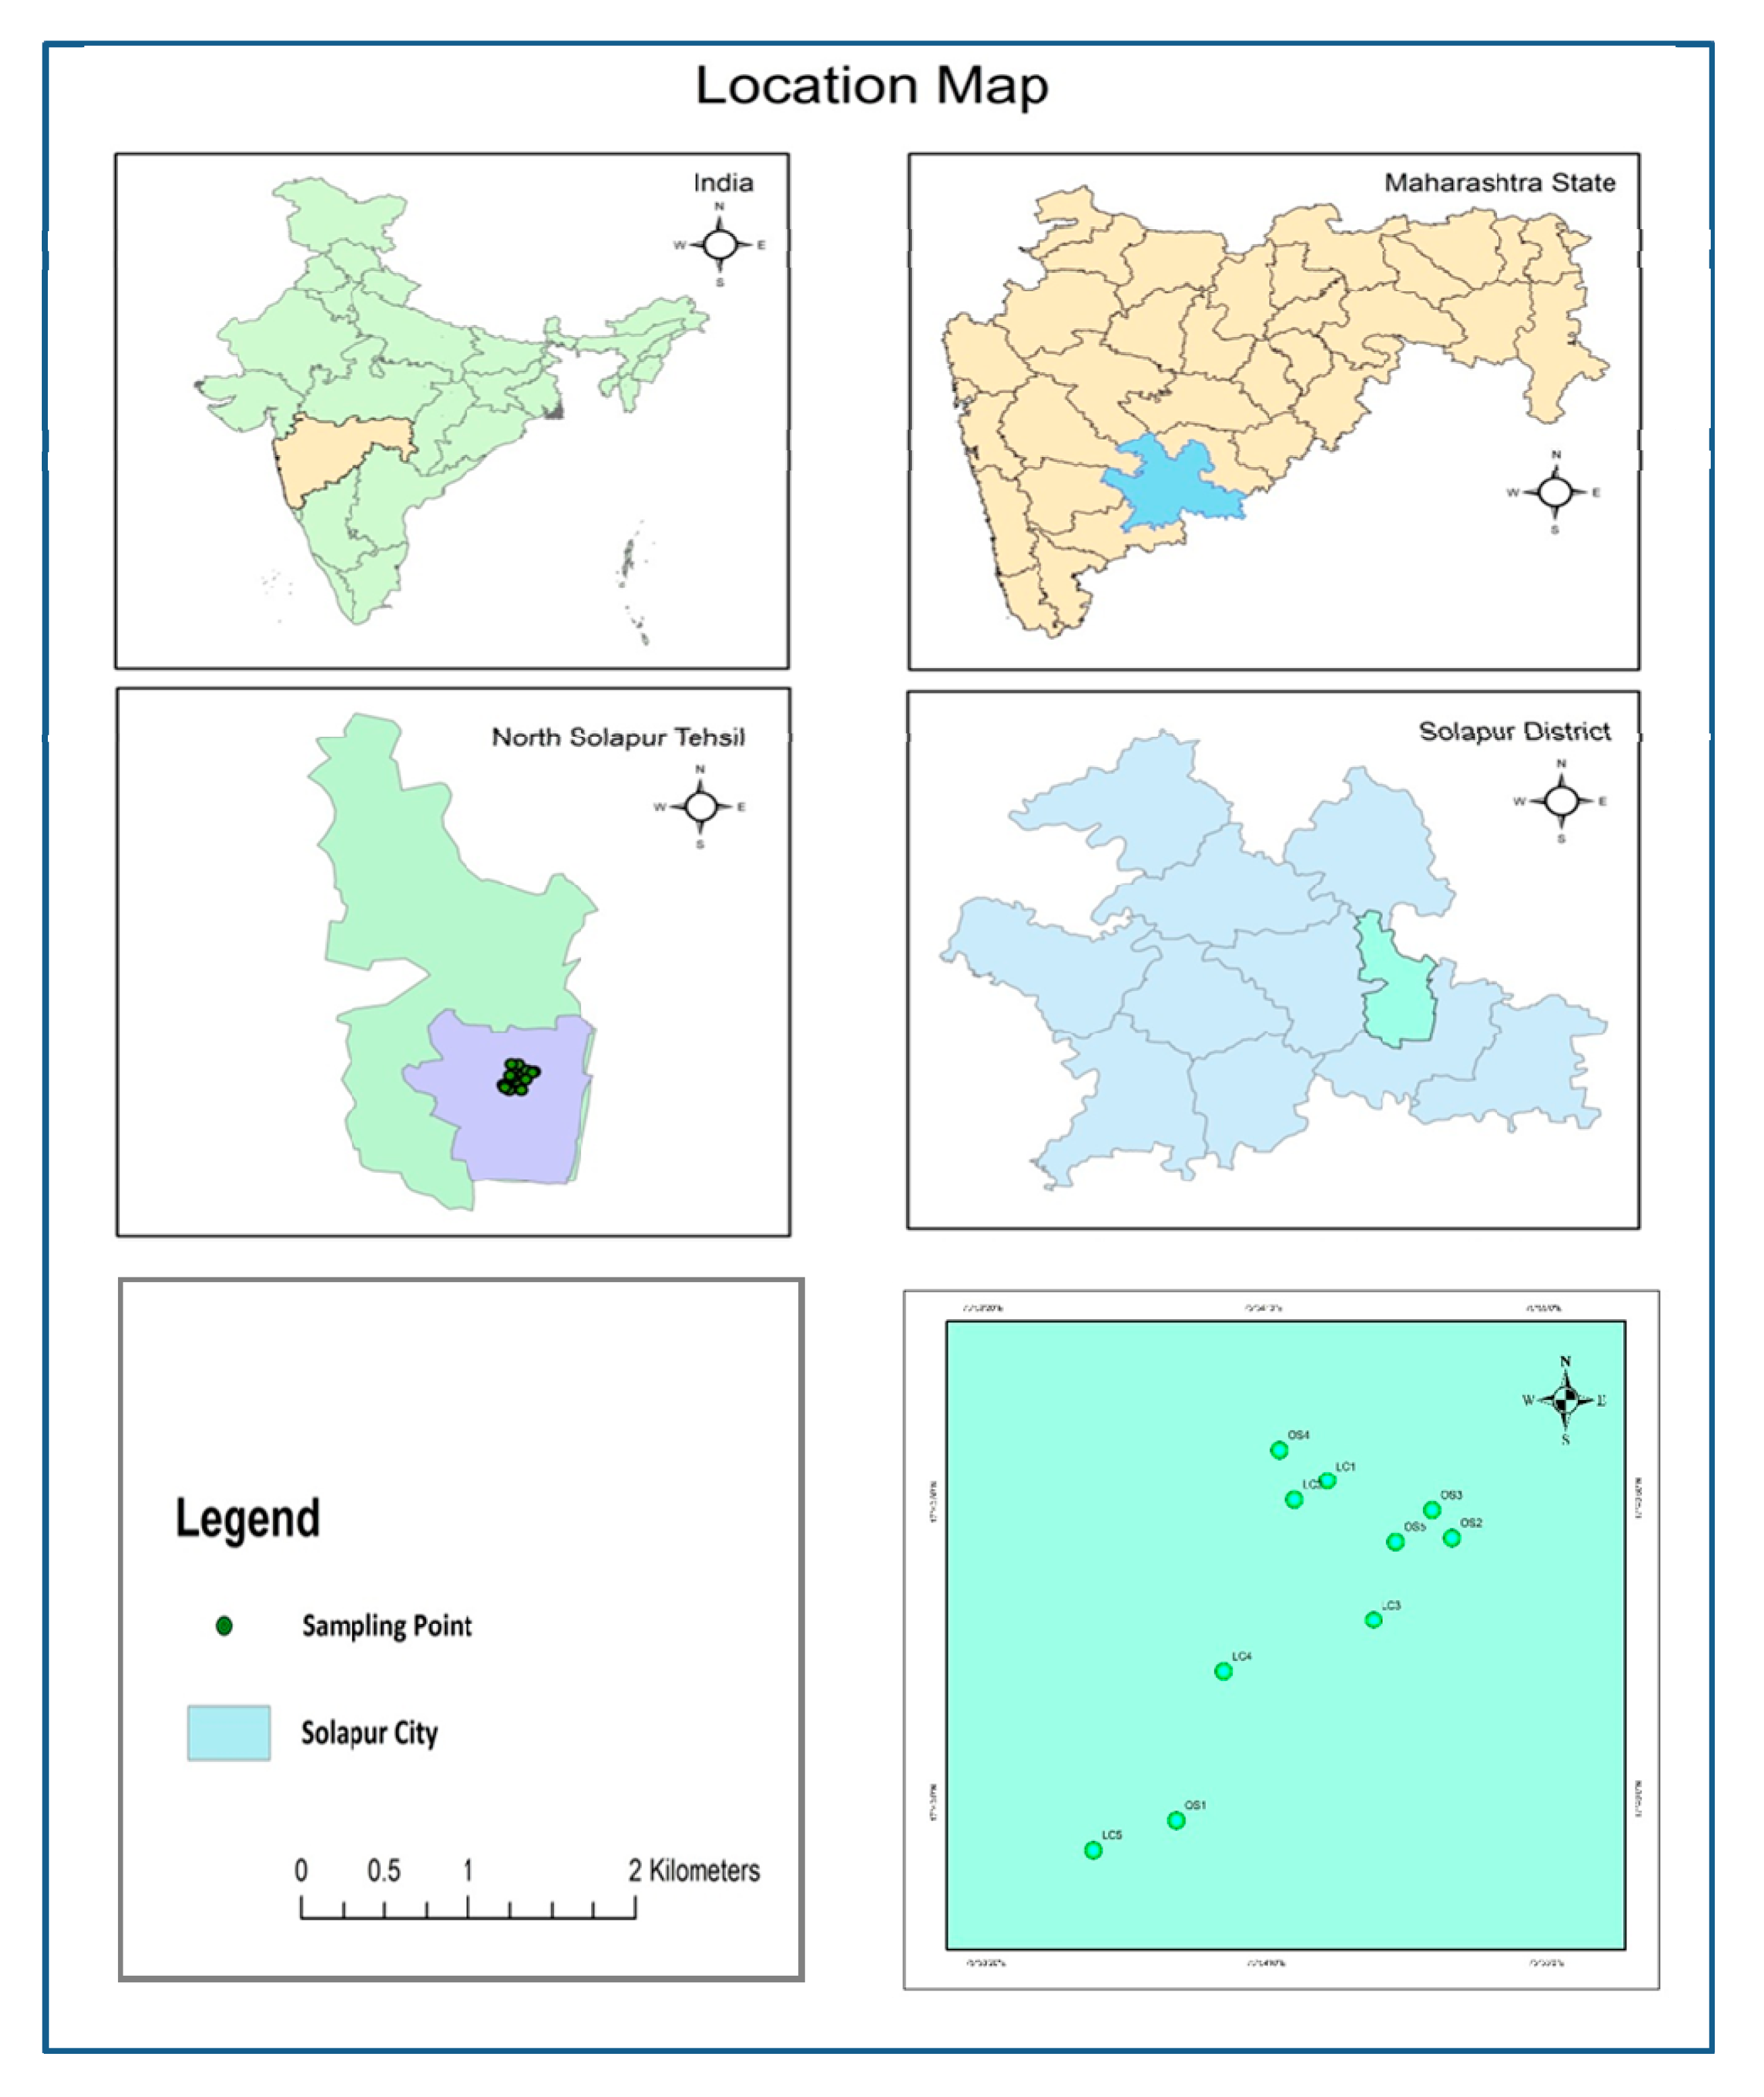
  31. Maske, V.R.; Dhulap, V.P. Development of handy prototype gas sensors kit for monitoring of ambient greenhouse gases from solid waste disposal sites of Solapur city. In AIP Conference Proceedings; Emerging Technologies: Micro to Nano (ETMN-2017); AIP Publishing LLC: New York, NY, USA, 1989. [Google Scholar] [CrossRef]
Figure 1. Schematic of annual greenhouses gas emissions by various sectors of society, in the world.
Coatings 10 01148 g001
Figure 2. Systematic design and development of the sensor unit.
Coatings 10 01148 g002
Figure 3. System architecture of portable gas sensor module.
Coatings 10 01148 g003
Figure 4. Signal condition circuit for all the used gas sensors.
Coatings 10 01148 g004
Figure 5. Gas sensor signal condition and interfacing with Arduino Uno.
Coatings 10 01148 g005
Figure 6. Circuit diagram of Liquid Crystal Display (LCD).
Coatings 10 01148 g006
Figure 7. Study area of the sites under testing.
Coatings 10 01148 g007
Figure 8. Gas sensing analysis of the developed module at large container sites.
Coatings 10 01148 g008
Figure 9. Gas sensing analysis of the developed module at open sites.
Coatings 10 01148 g009
Table 1. Geographical identification (altitude and latitude) of the sites under testing.
Site #LatitudeLongitude
Large Containers Site
Site LC-117°40′53.29″ N75°54′21.16″ E
Site LC-217°40′50.12″ N75°54′15.34″ E
Site LC-317°40′30.15″ N75°54′29.20″ E
Site LC-417°40′21.66″ N75°54′2.48″ E
Site LC-517°39′52.07″ N75°53′39.16″ E
Open Sites
Site OS-117°39′56.92″ N75°53′54.04″ E
Site OS-217°40′43.66″ N75°54′43.29″ E
Site OS-317°40′48.26″ N75°54′39.82″ E
Site OS-417°40′58.51″ N75°54′12.75″ E
Site OS-517°40′43.06″ N75°54′33″ E
Publisher’s Note: MDPI stays neutral with regard to jurisdictional claims in published maps and institutional affiliations.

