Article

Study on the Wear and Seawater Corrosion Resistance of Ni–Co–P Alloy Coatings with Jet Electrodeposition in Different Jet Voltages and Temperatures of Plating Solution

1
College of Engineering, Nanjing Agricultural University, Nanjing 210031, China
2
Guanyun Research Institute for Modern Agricultural Equipment, Nanjing Agricultural University, Guanyun 222200, China
3
Nanjing Institute of Agricultural Mechanization, Ministry of Agriculture and Rural Affairs, Nanjing 210008, China
*
Author to whom correspondence should be addressed.
Coatings 2020, 10(7), 639; https://doi.org/10.3390/coatings10070639
Submission received: 4 June 2020 / Revised: 23 June 2020 / Accepted: 29 June 2020 / Published: 30 June 2020

Abstract

:
In order to improve the wear and seawater corrosion resistance of metals, Ni–Co–P alloy coatings were fabricated on 45 steel substrates with jet electrodeposition in different jet voltages and temperatures of plating solution. The cross-section morphology, chemical composition, crystalline structure, microhardness, wear, and seawater corrosion resistance of the samples were analyzed and characterized using scanning electron microscopy (SEM), energy dispersive spectroscopy (EDS), X-ray diffraction (XRD), microhardness tester, friction wear tester, and electrochemical workstation, respectively. The results showed that the contents of Co in Ni–Co–P alloy coatings changed with the variation of jet voltages and temperature of plating solution. The content of Co in Ni–Co–P alloy coatings reached a maximum value of 47.46 wt·% when the jet voltage was 12 V and the temperature of the plating solution was 60 °C. The XRD patterns of Ni–Co–P alloy coatings showed that there was an obvious preferred orientation in the (111) plane. With an increase in the jet voltages and temperature of the plating solution, the microhardness of Ni–Co–P alloy coatings first increased and then decreased, with the maximum value obtained being 634.9 HV0.1. When the jet voltage was 12 V and the temperature of the plating solution was 60 °C, the wear scar width of the Ni–Co–P alloy coatings reached a minimum value of 463.4 µm. In addition, the polarization curves in the electrochemical test indicated that the samples deposited at 60 °C and 12 V exhibited the lowest corrosion current density (Icorr) of 1.72 µA/cm2 and highest polarization resistance (Rp) of 19.61 kΩ·cm2, which indicated that the coatings had better seawater corrosion resistance.

1. Introduction

It is worth noting that metals and their alloys are susceptible to suffering corrosion and wear in major engineering and daily life. In addition, the corrosion and wear processes are gradual and concealed. The damage caused to metals and their alloys by corrosion and wear is usually much greater than the simple sum of pure wear and corrosion, which causes engineering materials’ premature failure [1,2]. In recent years, study on wear and corrosion of metals in the marine environment has drawn a lot of interest since metals are much more affected in this environment compared to a normal water environment.
At present, researchers have developed numerous methods to enhance the properties of metals and their alloys. One such technique is the coating of a metal surface with an anticorrosive layer to provide a barrier between the metal surface and the corrosive environment [3,4]. The service life of the parts can be effectively prolonged by preparing coatings on the surfaces [5]. In general, electrodeposition is a convenient, inexpensive, and low-cost technique for fabricating coatings [6]. Ni–Co–P alloy coatings prepared by electrodeposition have high hardness, high wear resistance, high corrosion resistance, saturation magnetization, and low coercive force, and are widely used as an anticorrosion material, diffusion barrier, and electrocatalysis material [7]. Fetohi [8] reported that Ni–Co–P coatings have lower corrosion current densities and more positive corrosion potentials than Ni–P coatings, which indicated much better corrosion resistance. Khan et al. [9] found that the Ni–Co–P coating deposited at different electrodeposition parameters have higher coercivity than Co–P coatings. Lew et al. [10] studied the effect of pH and current density on electrodeposited Ni–Co–P alloy thin films. The deposited films exhibited good magnetic properties at high pH value and low magnetic properties at low pH value. Also, the low plating rate and current densities of the electrodeposition resulted in low processing rate and long processing time, which limited the extensive application for the production of metal matrix thin films [11,12].
Compared with conventional immersion electrodeposition methods, jet electrodeposition has the advantages of high current density, selective processing, and fine grains, which can be applied to prepare metal matrix thin films with high accuracy and excellent mechanical performance [12,13,14]. Mridul et al. [15] developed mathematical models for predicting deposition rate and deposition height with respect to input applied voltage, concentration of metal ions, and interelectrode gap in the jet electrodeposition process. Ning et al. [16] studied the influences of cationic surfactant CTAB (hexadecyl trimethyl ammonium bromide) and anionic surfactant SDS (sodium dodecyl sulfate) on electrodeposition of Cu–TiO2 composite coatings by jet electrodeposition. The microhardness and wear resistance of the coatings were obviously enhanced due to second phase strengthening and grain refinement strengthening with optimum addition of CTAB (30 mg/L) and SDS (50 mg/L) in the electrolyte. Qiao et al. [17] investigated the effect of concentration of Co2+ ions in the electrolyte and the key parameters of jet electrodeposition on the chemistry and microstructure of Ni–Co alloys. It was found that cobalt content in the alloy was increased by increasing the Co2+ ion concentration in the bath, increasing the electrolyte jet speed, decreasing the cathodic current density, and decreasing of the electrolyte temperature. Liu et al. [18] designed a friction nozzle, which can provide controlled pressure constantly during deposition so that the proposed method can forcibly restrain the rapid growth of the coarse grains. In addition, the authors found that the surface quality of the coating was excellent when the rolling pressure was 5 N and the scanning speed of the cathode was 860 mm/min. Xia et al. [19] investigated the effect of jet rate on microhardness and corrosion properties of Ni–TiN nanocoatings using jet pulse electrodeposition. The nanocoatings presented maximum microhardness of 876.2 HV and obtained the best corrosion resistance at 3 m/s. The role of average current density is a very important factor to affect the grain size and microhardness of films [20]. Similar findings were reported by Tian et al. [21], who researched the effect of average current density on the grain size and microhardness of Ni coatings by pulse jet electrodeposition. It was reported that the grain size decreased with increase in current density, with the smallest average grain size (13.7 nm) and the highest microhardness achieved at a current density of 39.8 A·dm−2. All findings derived from these research works demonstrated that jet electrodeposition exhibits certain advantages in the preparation of the coatings. In addition, it has been found that suitable process parameters of jet electrodeposition significantly improve the mechanical properties of the coating. It has been reported that Ni–Co alloys deposited using jet electrodeposition have exhibited improved microhardness and lower grain sizes [22]. To further enhance these properties, P has been added to the Ni–Co matrix and increased microhardness has been reported [7]. Considerable research concerning the wear and corrosion resistance of the Ni–Co–P alloy coatings has also been conducted [23,24]. The effect of varying temperature and jet voltage on the properties of jet electrodeposited coatings has not been extensively researched in the past. In most cases, electrodeposition of coatings using the jet deposition technique has been conducted with constant temperature [25] and jet voltage [26]. For this reason, the studies about the effects of jet voltages and temperature of plating solution on the Ni–Co–P alloy coatings have been considered in the improvement of material surface wear resistance and seawater corrosion resistance properties.
In this work, Ni–Co–P alloy coatings were fabricated on 45 steel substrates by jet electrodeposition and the effects of jet voltages and the temperature of the plating solution on coating properties were studied in order to improve the wear resistance and seawater corrosion resistance of Ni–Co–P alloy coatings. The cross-section morphology, chemical composition, crystalline structure, microhardness, wear resistance, and seawater corrosion resistance of the samples were analyzed and characterized by scanning electron microscopy (SEM, Hillsboro, OR, USA), energy dispersive spectroscopy (EDS, XFlash Detector 5030, BRUKER, Karlsruhe, Germany), X-ray diffraction (XRD, X’Pert Powder, PANalytical B.V., Almelo, Holland), microhardness tester, friction wear tester, and electrochemical workstation, respectively. The above tests and analysis results may be useful to improve the wear and seawater corrosion resistance of Ni–Co–P alloy coatings and provide a theoretical basis for its application.

2. Experimental Device and Procedure

2.1. Experimental Device

Jet electrodeposition is a kind of high-velocity, selective electrodeposition technique that uses high deposition current density. The Ni–Co–P alloy coatings were obtained with self-made jet electrodeposition equipment in the experiment. Figure 1 shows the experimental device of numerical control jet electrodeposition. It can be seen that the experimental device consists of a thermostatic apparatus, circulating pump, numerical control servo device, power source, and machine accessories. The plating solution was heated to a set temperature through the thermostatic apparatus. The circulating pump transferred the plating solution to the anode cavity and sprayed it on the cathode workpiece through a rectangular nozzle with a size of 20 mm × 2 mm. Then, the plating solution passed through the bottom piping to the thermostatic apparatus. The workpiece was fixed on the object table and moved back and forth along the Y axis. Under the action of an electric field, metal cations of the plating solution were electrodeposited.

2.2. Materials and Pretreatments

Type steel 45 samples (with a size of 30 mm × 8 mm × 7 mm, chemical composition: 0.46 wt·% C, 0.27 wt·% Si, 0.05 wt·% Cr, 0.04 wt·% Ni, 0.59 wt·% Mn, 0.02 wt·% P, 0.05 wt·% Cu, and 0.02 wt·% S) were purchased from Suzhou Co. (Jiangsu, China). These samples were used throughout the experiment. The 45 steel substrates usually require a series of pretreatment steps to ensure a good quality deposit. Firstly, the substrates were cleaned and polished by #320 WC sandpaper. Further abrasive action with #800 to #1500 grades WC sandpaper obtained a bright and smooth surface. Secondly, the substrates were treated by electric cleaning solution to degrease them. The treatment current was 1 A, and the processing time was 25 s. Thirdly, the substrates were immersed into a strong activation solution for the removal of oxide film. The strong activation treatment current was 1 A, and the processing time was 30 s. Finally, the substrates were immersed into a weak activation solution for the removal of carbon black. The weak activation treatment current was 1 A and the processing time was 30 s. After every step, the 45 steel substrates were rinsed with deionized water and air dried. The different solution constituents in the pretreatment experiment are shown in Table 1.

2.3. Preparation of Ni–Co–P Alloy Coatings

Jet electrodeposition was carried out (i) with different jet voltages (6, 8, 10, 12, 14, 16, 18, and 20 V) at a constant temperature of 60 °C and (ii) with different temperatures of the plating solution (40, 45, 50, 55, 60, 65, 70, and 75 °C) at a constant jet voltage of 12 V. Ni–Co–P alloy coatings were fabricated on the 45 steel substrates by jet electrodeposition with an aqueous solution outlined in Table 2. In the process of preparing the Ni–Co–P alloy coatings, the high purity nickel plate was connected to the anode and the 45 steel substrates were connected to the cathode. The injection speed of the plating solution was 1.5 m·s−1 and the electrodeposition time was 20 min. The speed of the reciprocating sweep of the nozzle relative to the cathode was 150 mm·s−1 and the jet gap between the nozzle and the cathode was 2.0 mm. After the process of jet electrodeposition, the samples were cleaned in the ultrasonic cleaner for 5 min.

2.4. Characterization and Tests

The cross-section morphologies of the samples were characterized using a scanning electron microscope (SEM, Quanta 250, FEI, Hillsboro, OR, USA) and the chemical composition was analyzed by an energy dispersive spectrometer (EDS, XFlash Detector 5030, BRUKER, Karlsruhe, Germany). The crystalline structure of the samples was studied by X-ray diffraction (XRD, X’Pert Powder, PANalytical B.V., Almelo, Holland). The X-ray source used Cu Kα radiation (λ = 0.154056 nm) and was operated at 40 kV within the range of 20° and 90° at a scanning rate of 2θ = 4°/min.
The microhardness of the samples was measured using a microhardness tester (Struers, Duramin-40 A1, Ballerup, Copenhagen, Denmark). The test load was 100 g, and a loading time of 15 s was selected. To increase accuracy of results, four separate samples from the same batch were used for each microhardness test, and on each sample, five different points were selected. An average value of the twenty points was then calculated and this was presented as the microhardness. The wear resistance test was carried out using a high frequency reciprocating wear test machine with a ball on disk pair. Before and after each test, the samples were ultrasonically cleaned in the ultrasonic cleaner. A loaded GCr15 ball with a diameter of 3 mm slid with a 4 mm stroke without lubrication over the surface of the samples. Loads of 3.2 N were applied. Each specimen test was conducted for 0.5 h under the same conditions. The surface morphologies showing the worn grooves were analyzed using scanning electron microscope.
The corrosion resistance of the samples was tested by electrochemical workstation (CS350, Wuhan Corrtest Instruments Corp., Ltd., Wuhan, China). Owing to the nature of polarization resistance testing, only a single sample was selected for each batch, and averaging of corrosion resistance test results was not considered. Typically, the samples, platinum plate, and saturated calomel electrode were considered as working electrode, counter electrode, and reference electrode, respectively. The exposure area of the working electrode was 1 cm2. All corrosion tests were under artificial seawater environment, and the chemical composition of this liquid medium was prepared according to Standard ASTM D 1141–98 as shown in Table 3 [27]. In order to obtain stable test results, the samples were immersed into artificial seawater for 0.5 h before the electrochemical experiments. Afterwards, the potential dynamic sweeping range was performed in the potential range of ± 0.6 V with respect to the Eocp by 0.5 mV/s sweeping rate. Furthermore, the electrochemical impedance spectroscopy (EIS) investigations were generated in the sinusoidal signal amplitude of 10 mV and at a frequency range of 105~10−2 Hz.

3. Results and Discussion

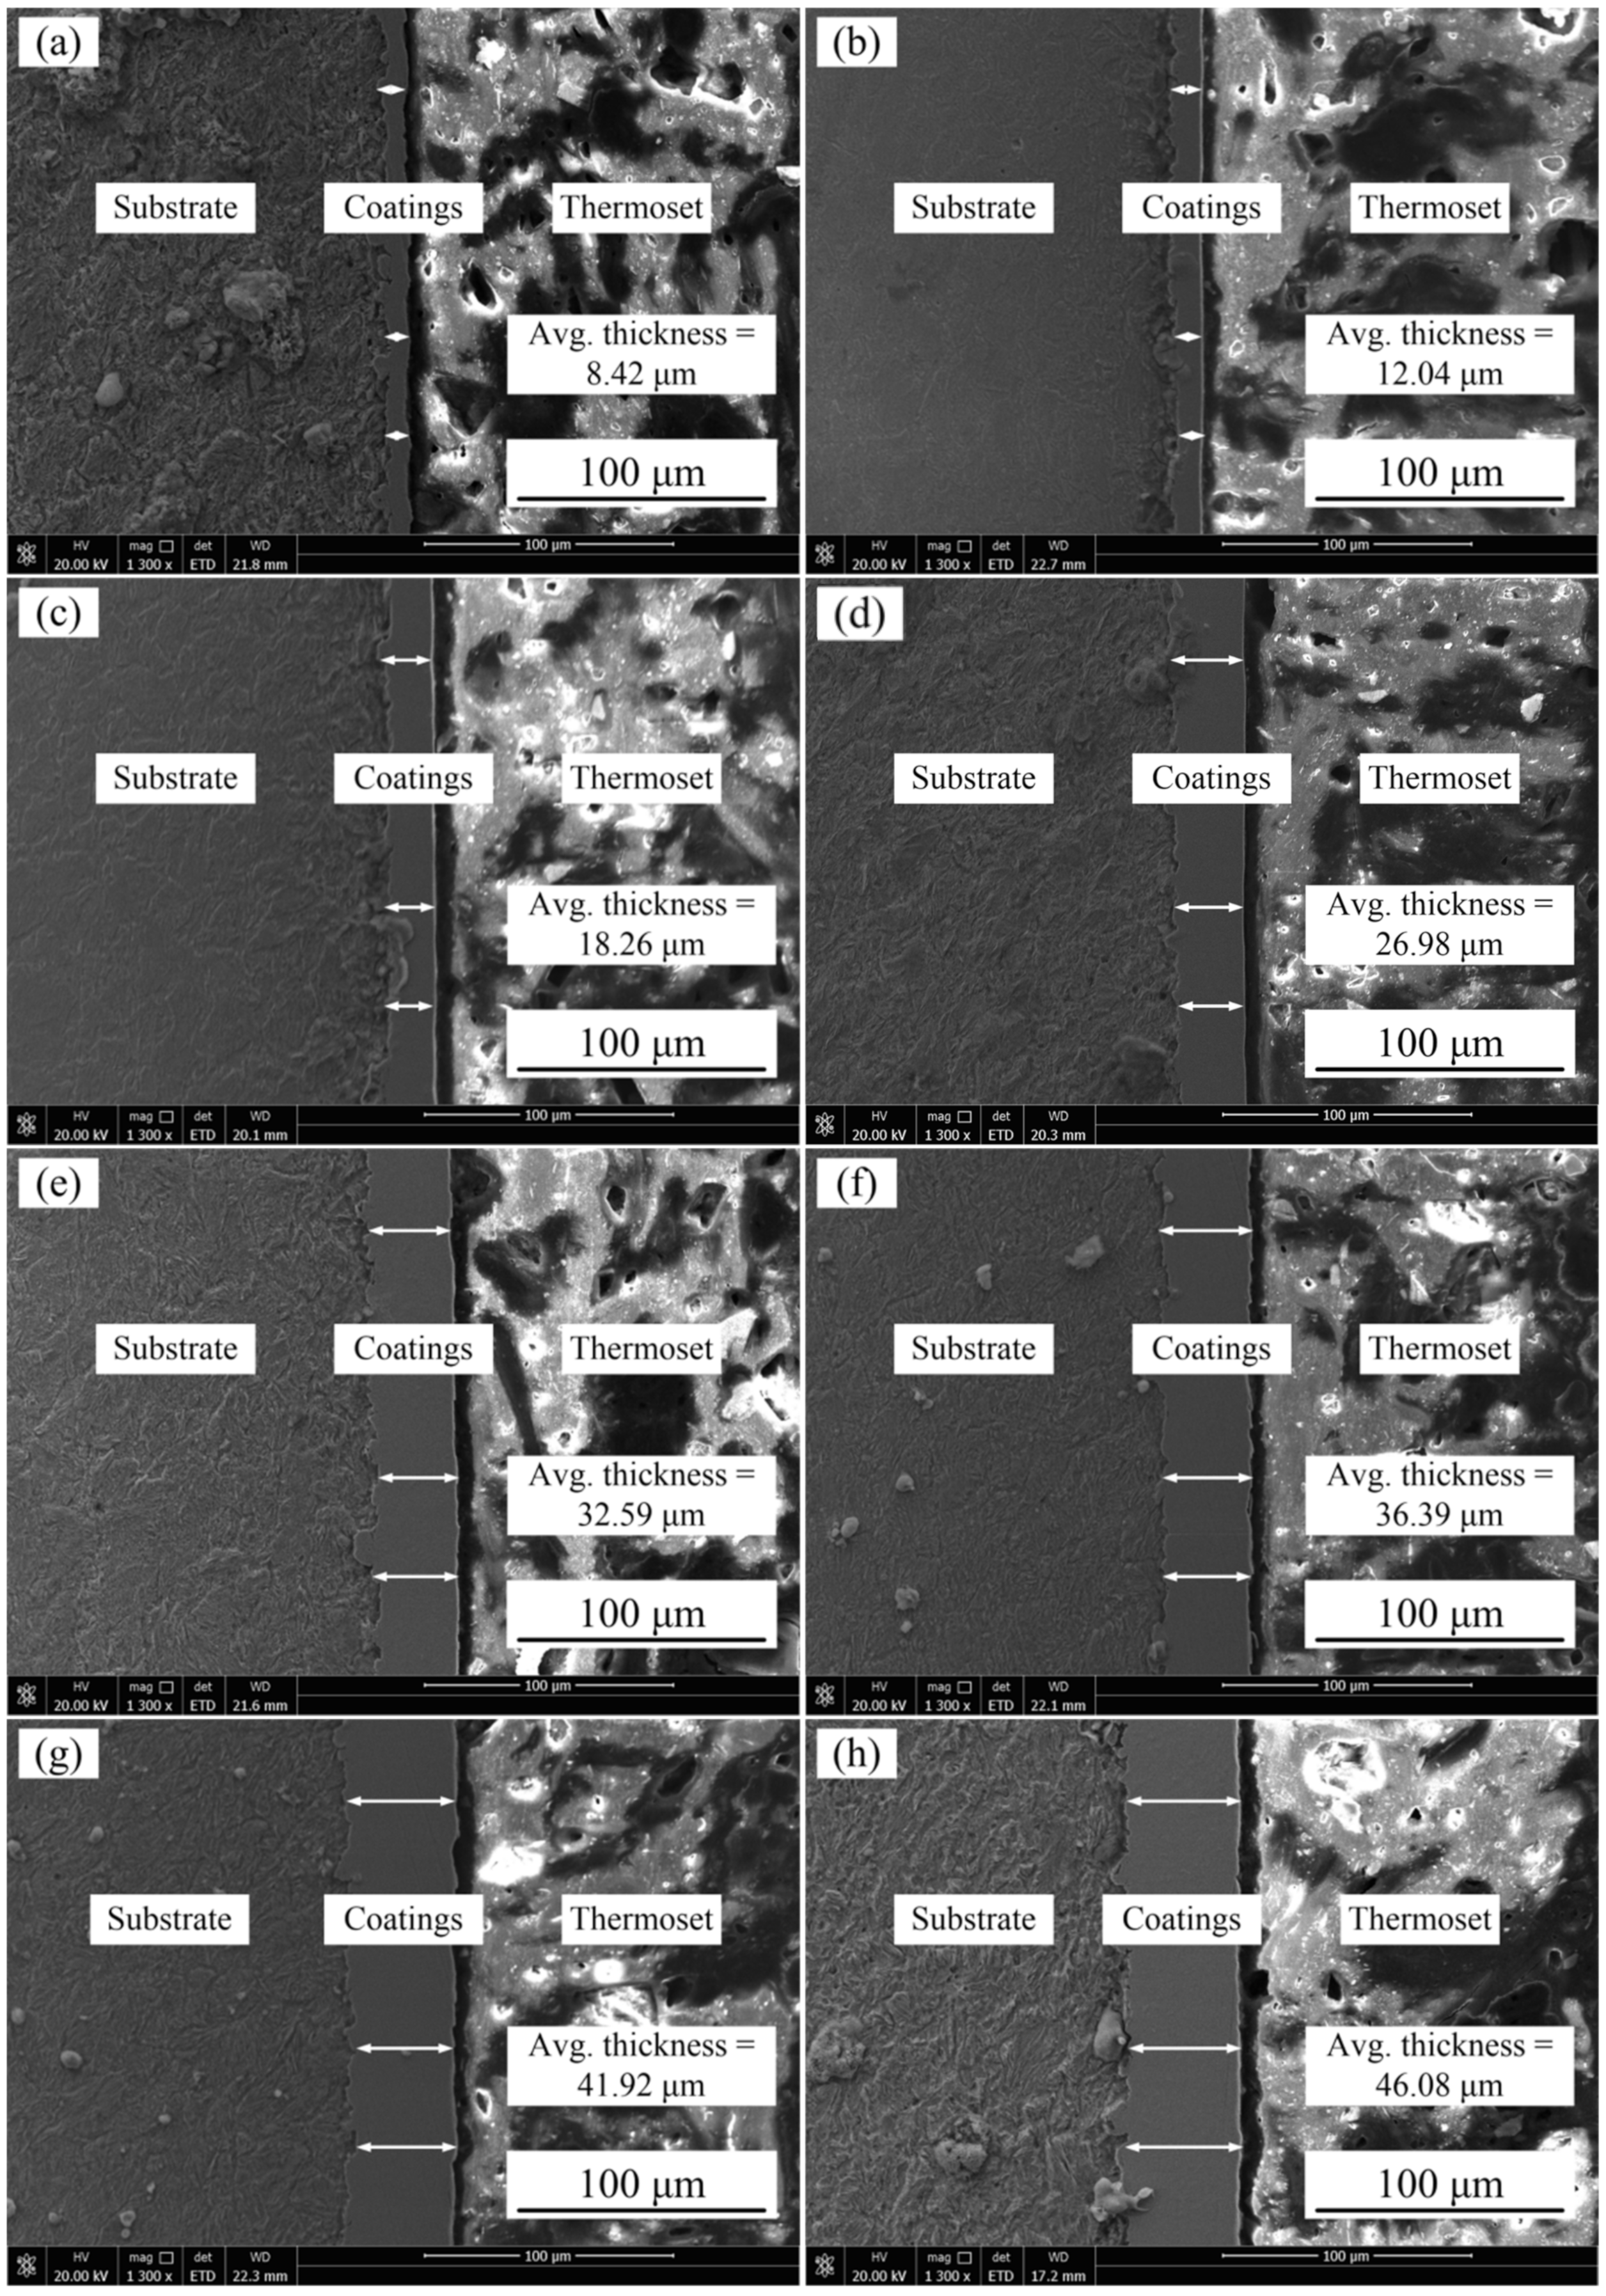
3.1. Effects of Jet Voltages and Temperature of Plating Solution on the Cross-Section Morphologies of Ni–Co–P Alloy Coatings

Figure 2 shows the effect of jet voltages on cross-section morphologies of Ni–Co–P alloy coatings when the temperature of the plating solution was 60 °C. It can be seen from Figure 2 that jet voltages have a great influence on the cross-section morphologies of coatings. When the jet voltage was 6 V, thickness of the Ni–Co–P alloy coating was 8.42 µm. The thickness of the coating increased with the increase in jet voltage. When jet voltage was 20 V, the thickness of the coating reached a value of 46.08 µm. The above phenomena may be due to the fact that the lower overpotential affects the crystallization rate of metal ions to a certain extent when the jet voltage is low. As the jet voltage increases, the overpotential of the cathode increases gradually, which promotes the electro crystallization of metal ions and improves the efficiency of the electrocrystallization process [28]. As reported previously by Xia L. et al. [18], the thickness of the coating increased with increasing current density. Similarly, Ni–Co–P alloy coatings show a trend of rapid increase in thickness with an increase in the jet voltage.
Figure 3 shows the effect of the temperature of the plating solution on cross-section morphologies of Ni–Co–P alloy coating when the jet voltage was 12 V. From the figures, it can be seen that there is no obvious crack between the Ni–Co–P alloy coating and the substrate, and the coatings can attach to the substrate well. In addition, when the temperature of plating solution was 40 °C, thickness of the Ni–Co–P alloy coating was 14.46 µm. The thickness of the coating increased with the increased temperature of the plating solution. When the temperature of the plating solution was 75 °C, the thickness of coating reached a value of 40.27 µm. This can be attributed to the rise in temperature of the plating solution, which increased the internal energy of ions in the plating solution, thereby increasing their diffusion and migration rate, and this caused an increase in the deposition rate. Concurrently, the thickness of Ni–Co–P alloy coating became thicker.

3.2. Effect of Jet Voltages and Temperature of Plating Solution on the EDS Patterns of Ni–Co–P Alloy Coatings

Table 4 and Table 5 show the individual element content of Ni–Co–P alloy coatings with the variation of jet voltages and temperature of plating solution. As shown in Table 4 and Table 5, the contents of Ni, Co, and P elements in the coatings changed with the variation of jet voltages and temperature of plating solution. It can be seen that the contents of Ni in Ni–Co–P alloy coatings first decreased and then increased, and the content of Co first increased and then decreased with increases in the jet voltage and the temperature of the plating solution. The contents of Ni in Ni–Co–P alloy coatings reached a minimum value of 49.29 wt·% and the content of Co in Ni–Co–P alloy coatings reached a maximum value of 47.46 wt·% when the jet voltage was 12 V and the temperature of the plating solution was 60 °C.
In the process of preparing Ni–Co–P alloy coatings by jet electrodeposition, the jet voltage was 12 V and the temperature of the plating solution was 60 °C. Figure 4a shows the SEM images of the samples in secondary electrons mode. It shows that deposited Ni–Co–P alloy coatings were uniform and had dense structures without cracks. Figure 4b–d illustrate the elemental mapping images of the samples. It further suggests that Ni, Co, and P are uniformly distributed throughout the deposited Ni–Co–P alloy coatings. Figure 4e–f show the cross-section and EDS linear scanning results of the samples. Figure 4f shows the EDS element analysis along the yellow line in Figure 4e. This observation confirms the formation of Ni–Co–P alloy coatings and indicates that an appropriate physical bonding was achieved between coating and substrate.

3.3. Effect of Jet Voltages and Temperature of Plating Solution on the XRD Patterns of Ni–Co–P Alloy Coatings

Figure 5 shows the effect of jet voltages and temperature of plating solution on the XRD patterns of Ni–Co–P alloy coatings. Figure 5a displays the XRD patterns of Ni–Co–P alloy coatings under the different jet voltages when the temperature of the plating solution was 60 °C. The peaks at 2θ = 44.05°, 51.87°, and 76.44° are indexed as Ni (111), (200), and (220), respectively. From the figures it can be seen that the Ni–Co–P alloy coatings have a face-centered cubic (FCC) structure. Ni atoms and Co atoms formed the α-phase solid solution, where the Co atoms displaced some Ni atoms into the FCC Ni lattice. It was observed that the Ni content decreased as the Co content in the coatings increased, as shown in Table 4 and Table 5. In addition, the diffraction peaks for phosphorus are not evident and this can be attributed to phosphorus exiting in the coatings as a solid solution [29,30,31]. With the increase of jet voltages, the preferred orientation of Ni–Co–P alloy coatings did not change significantly. However, it is evident that the diffraction peak of the Fe matrix appeared when the jet voltages were low. Figure 5b displays the XRD patterns of Ni–Co–P alloy coatings under different plating solution temperatures when the jet voltage was 12 V. With the rise in plating solution temperature, the preferred orientation of Ni–Co–P alloy coatings did not change significantly. However, there was an obvious rise in the diffraction peak for Ni (200), which translated to a distinct FCC structure.

3.4. Effect of Jet Voltages and Temperature of Plating Solution on the Microhardness of Ni–Co–P Alloy Coatings

Figure 6a shows the effect of jet voltages on the microhardness of Ni–Co–P alloy coatings when the temperature of the plating solution was 60 °C. At 6 V jet voltage, the microhardness of the Ni–Co–P alloy coatings was 510.7 HV0.1. When the jet voltages increased, the microhardness of Ni–Co–P alloy coatings first increased and then decreased. At 12 V jet voltage, the microhardness of Ni–Co–P alloy coatings reached a maximum value of 634.9 HV0.1. The microhardness of Ni–Co–P alloy coatings is mainly affected by two aspects: as the jet voltage increases, the potential energy of the jet field increases and the mass transfer process of ions is enhanced, and this improves the electrodeposition efficiency. The nucleation rate of grains and the structure and microstructure of Ni–Co–P alloy coatings were refined, and the microhardness was improved. On the other hand, the solid solution formed by Ni atoms and Co atoms had a certain influence on the microhardness solution of the samples. As Ni–Co–P alloy coatings were prepared, Ni atoms and Co atoms formed a α-phase solid solution. Under the action of solid solution strengthening, increase of Co content in the Ni–Co–P alloy coating was beneficial to the improvement of microhardness. When the jet voltage was increased further, it caused the Co content to decrease, as shown in Table 4. Therefore, the microhardness of Ni–Co–P alloy coatings first increased and then decreased with increase in the jet voltage. Also, it can be seen from the pictograph that the Ni–Co–P coatings are oriented in the Ni (111) plane direction. Zimmerman A.F. et al. [32] reported that nanocrystalline Ni coatings with a preferred (111) crystallographic orientation exhibited higher hardness than those with a preferred (200) orientation.
Figure 6b shows the effect of the temperature of the plating solution on the microhardness of Ni–Co–P alloy coatings when the jet voltage was 12 V. It is evident that the microhardness of the Ni–Co–P alloy coatings first increased and then decreased with the rise in temperature of the plating solution. In addition, the microhardness of the Ni–Co–P alloy coatings decreased from 634.9 to 623.4 HV0.1 when the temperature of the plating solution increased from 60 to 75 °C, respectively. From the EDS data presented in Table 5, it can be seen that Co content in the coatings increases steadily with the increase in jet voltage, reaching a maximum value at 12 V. Similarly, the highest Co content as a function of varying plating solution temperature was achieved at a temperature of 60 °C. As such, it can be postulated that the microhardness of the deposited Ni–Co–P coatings was significantly influenced by Co content. The increase in Co content to a maximum value with the increase in jet voltage and the plating solution temperature can be attributed to increasing diffusion of Co2+ metallic ions in the electrolyte towards the cathode surface [33]. At the cathode, the Ni and Co elements in the Ni–Co–P coating combined to form a solid solution, which increased the hardness of the deposited coatings as a function of solid solution strengthening. Once the optimum jet voltage and plating solution temperature were achieved, further increase caused a decrease in Co content, and a corresponding decrease in microhardness. As a result, the microhardness of deposited Ni–Co–P alloy coatings first increased and then decreased with the rise in the temperature of the plating solution. It can be observed from the figure that all the coatings deposited with varying plating solutions had a preferred (111) orientation. The increase in microhardness can also be associated with the preferred orientation of the Ni–Co–P coatings [32].
Figure 7 shows the optical microscopy images of the Vickers indent for Ni–Co–P coatings deposited with varying jet voltage and plating solution temperatures. The absence of microcracks after the indenting indicated that the deposited Ni–Co–P coatings were compact. As such, it can be suggested that a load bearing Ni–Co–P matrix has significant resistance to formation and propagation of microcracks.

3.5. Effect of Jet Voltages and the Temperature of the Plating Solution on the Wear Resistance of Ni–Co–P Alloy Coatings

Figure 8a shows the effect of varying jet voltages on the wear resistance of Ni–Co–P alloy coatings. Figure 9a,b show the wear grooves for the Ni–Co–P alloy coatings at varying jet voltages. It can be seen that the wear scar width of the Ni–Co–P alloy coatings first decreased and then increased with the increase in jet voltage. In addition, the wear scar width of the Ni–Co–P alloy coatings increased from 463.4 to 499.3 µm when the jet voltage increased from 12 to 20 V. Figure 8b shows the effect of varying plating solution temperatures on the wear resistance of Ni–Co–P alloy coatings. Figure 9c,d shows the wear grooves for the Ni–Co–P alloy coatings at varying plating solution temperatures. When the temperature of plating solution was 40 °C, the wear scar width of Ni–Co–P alloy coatings was 553.2 µm. A rise in the temperature of the plating solution caused the wear scar width of Ni–Co–P alloy coatings to first decrease and then increase. When the temperature of the plating solution was 60 °C, the wear scar width of Ni–Co–P alloy coatings reached a minimum value of 463.4 µm. The wear resistance of the alloy coating is mainly determined by the microhardness and friction coefficient. A higher microhardness coupled with a lower friction coefficient means better wear resistance. The results show that the friction coefficient of Ni–Co–P alloy coatings was not distinctly different. Therefore, wear resistance of Ni–Co–P alloy coatings was mainly caused by the microhardness. As can be seen from Figure 6, the microhardness of Ni–Co–P alloy coatings reached a maximum value of 634.9 HV0.1 when the jet voltage was 12 V and the temperature of the plating solution was 60 °C. With these parameter combinations, the wear scar width of Ni–Co–P alloy coatings was at a minimum and the best wear resistance was exhibited.

3.6. Effect of Jet Voltage and Plating Solution Temperature on the Seawater Corrosion Resistance of Ni–Co–P Alloy Coatings

3.6.1. Effect of Jet Voltages on the Seawater Corrosion Resistance of Ni–Co–P Alloy Coatings

The potentiodynamic polarization curves of Ni–Co–P alloy coatings measured in artificial seawater with varying jet voltage are presented in Figure 10. The calculated corrosion potentials (Ecorr), corrosion current densities (Icorr), and polarization resistances (Rp) obtained from Figure 10 are listed in Table 6. In a typical polarization curve, a low corrosion current density or a high corrosion potential corresponds to a low corrosion rate and a good corrosion resistance [17]. As described in a previous publication [34], the corrosion potentials and current densities are calculated by the Stern–Geary equation, where βa and βc correspond to the anodic and cathodic Tafel slopes, respectively.
According to Figure 10 and Table 6, when the jet voltage was 6 V, the corrosion current density (Icorr) of Ni–Co–P alloy coatings was 41.60 µA·cm−2, the corrosion rate was 503.9 µm·year−1, and the polarization resistance (Rp) was 2.05 kΩ·cm−2. When the jet voltage increased, the corrosion current density (Icorr) and corrosion rate of Ni–Co–P alloy coatings first decreased and then increased, and the polarization resistances (Rp) first increased and then decreased. In addition, when the jet voltage was 12 V, the corrosion current density (Icorr) of the Ni–Co–P alloy coatings reached a minimum value of 1.72 µA/cm2, and the polarization resistance (Rp) reached a maximum value of 19.61 kΩ·cm−2. Such low current density and high polarization resistance showed that corrosion resistance was greatly improved. The above phenomena may be caused by the increase in Co and P element content. This can be seen from Table 4, where the content of Co and P in Ni–Co–P alloy coatings first increased and then decreased with increase in the jet voltage. The content of Co in Ni–Co–P alloy coatings reached a maximum value of 47.46 wt·% when the jet voltage was 12 V. The chemical activity of Co element is higher than that of Ni element. Therefore, the increase of Co content in Ni–Co–P alloy coatings promotes the adsorption and aggregation of corrosion products. The coverage area of corrosion products on the samples surface is increased, which can further improve the corrosion resistance of Ni–Co–P alloy coatings [35]. On the other hand, the P content has a significant effect on the corrosion resistance of the film. High P content films are more homogeneous and lack definite grain boundaries, which provide possible locations for preferential dissolution and this may account in part for the higher corrosion resistance [36].
Immediately after the electrodeposition process is complete, Ni and Co elements both form oxide layers on the surface when exposed to the air. These oxide layers effectively hinder corrosion when the substrate is introduced to an artificial seawater corrosive environment. On the onset, the original NiO and CoO oxides were dissolved first, as shown in reactions (1) and (2). Then, the extremely thin oxide coat was punctured under Cl attack and the metal within the coating in the corrosion solution underwent active dissolution, as shown in reactions (3) and (4). As the immersion time increased, Ni2+ and Co2+ reacted further with water to produce corrosion products, as shown in reactions (5) and (6) [35].
NiO + H2O → Ni2+ + 2OH
CoO + H2O → Co2+ + 2OH
Ni → Ni2+ + 2e
Co → Co2+ + 2e
Ni2+ + 2H2O → Ni (OH)2 + 2H+
Co2+ + 2H2O → Co (OH)2 + 2H+
For additional research, EIS tests were carried out as a supplement of the Tafel curves to evaluate seawater corrosion resistance of Ni–Co–P alloy coatings. Figure 11 depicts the Nyquist plots and Bode plots recorded for the coatings in artificial seawater with the variation of jet voltages. Figure 11a shows the Nyquist plots of Ni–Co–P alloy coatings. It can be found that the impedance semicircle diameter of Ni–Co–P alloy coatings first increased and then decreased with increase in the jet voltage. In general, a bigger impedance semicircle diameter represents better corrosion resistance of the samples. When the jet voltage was 12 V, the impedance semicircle diameter of the coatings was the largest, which indicated excellent corrosion protection. Figure 11b shows the Bode plots of Ni–Co–P alloy coatings (impedance modulus |Z| as a function of frequency). At a high frequency, it can be observed that |Z| of Ni–Co–P alloy coatings were much closer at different jet voltages, while at low frequency, |Z| of Ni–Co–P alloy coatings for 6 V was smallest. In addition, the modulus |Z| curves were very smooth and the slope had no obvious fluctuation. This indicates that the Ni–Co–P alloy coating exhibited uniform corrosion in artificial seawater environment without pitting. Figure 12 shows the used equivalent circuit model of Ni–Co–P alloy coatings for fitting EIS experiment data [36], where Rs is the solution resistance, CPEdl the CPE of the double layer capacitance, and Rct the charge transfer resistance on the substrate surface. A previous study [37,38] has shown that the corrosion resistance is always determined by the charge transfer resistance Rct of the samples. The fitting results are listed in Table 7. As shown in Figure 12 and Table 7, the Rs was not obvious, which indicates that the test system was in a stable state. It can be found that the charge transfer resistance (Rct) of Ni–Co–P alloy coatings first increased and then decreased with increase in the jet voltage. When the jet voltage was 12 V, the charge transfer resistance (Rct) of the Ni–Co–P alloy coatings reached a minimum value of 5.63 × 10⁴ Ω·cm−2, which indicated that the coating provided effective protection for the substrate. These results are in agreement with the polarization curves.

3.6.2. Effect of Plating Solution Temperature on the Seawater Corrosion Resistance of Ni–Co–P Alloy Coatings

The potentiodynamic polarization curves of Ni–Co–P alloy coatings deposited with varying plating solution temperature and measured in artificial seawater are presented in Figure 13. The calculated corrosion potentials (Ecorr), corrosion current densities (Icorr) and polarization resistances (Rp) obtained from Figure 13 are listed in Table 8. According to Figure 13 and Table 8, when the temperature of plating solution was 40 °C, the corrosion current density (Icorr) of Ni–Co–P alloy coatings was 7.99 µA·cm−2, the corrosion rate was 116.6 µm·year−1, and the polarization resistances (Rp) was 5.11 kΩ·cm−2. When the plating solution temperature increased, the corrosion current density (Icorr) and corrosion rate of Ni–Co–P alloy coatings first decreased and then increased, and the polarization resistances (Rp) first increased and then decreased. When the temperature of the plating solution was 60 °C, the corrosion current density (Icorr) of the Ni–Co–P alloy coatings reached a minimum value of 1.72 µA/cm2, and the polarization resistance (Rp) reached a maximum value of 19.61 kΩ·cm−2. The above phenomena may be associated with the change of Co element content. Co element is nobler than Ni, and increase in Co element content causes an increase in the electrochemical reactivity of the deposited Ni–Co–P coatings [39]. As can be seen from Figure 5, the content of Co in Ni–Co–P alloy coatings first increased and then decreased with increase in the temperature of plating solution. The content of Co in Ni–Co–P alloy coatings reached a maximum value of 47.46 wt·% when the temperature of plating solution was 60 °C. Also, from the XRD pictographs showing the effect of varying plating solution temperature (See Figure 5b), it can be seen that there was a rise in the Ni (200) diffraction peak with an increase in the plating solution temperature to show a distinctly FCC structure. Nyambura S.M. et al. [39] reported that structures having FCC structures exhibit better corrosion resistance properties than those comprising of BCC lattices and this attributed to the FCC structures having a higher packing factor. The same conclusions were reported by Bakhit B. et al. [40], who also identified the increase in corrosion resistance to a single-phase structure of the Ni–Co matrix. Similarly, the increase in corrosion resistance in the deposited Ni–Co–P coatings can also be associated to formation of a single-phase FCC structure. Beyond 60 °C however, the higher peaks do not translate to better corrosion resistance, and it can therefore be postulated that the Co content plays the major role in corrosion resistance of the Ni–Co–P coatings.
Additionally, EIS tests were carried out as a supplement of the Tafel curves to evaluate seawater corrosion resistance of Ni–Co–P alloy coatings. Figure 14 depicts the Nyquist plots and Bode plots recorded for the coatings in artificial seawater. Figure 14a shows the Nyquist plots of Ni–Co–P alloy coatings. It was found that the impedance semicircle diameter of Ni–Co–P alloy coatings first increased and then decreased with the increase in plating solution temperature. When the temperature of plating solution was 60 °C, the impedance semicircle diameter of the coatings was the largest, which indicated excellent corrosion protection. Figure 14b shows the Bode plots of Ni–Co–P alloy coatings (impedance modulus |Z| as a function of frequency). At a high frequency, it can be observed that |Z| of Ni–Co–P alloy coatings were much closer at different temperatures of the plating solution, while at low frequency, |Z| of Ni–Co–P alloy coatings for 40 °C was smallest. In addition, the modulus |Z| curves were very smooth and the slope had no obvious fluctuation. This indicates that the Ni–Co–P alloy coating exhibited uniform corrosion in artificial seawater environment without pitting. The fitting results obtained from Figure 14a are listed in Table 9. From Table 9, it can be seen that the charge transfer resistance (Rct) of Ni–Co–P alloy coatings first increased and then decreased with the increase in plating solution temperature. When the temperature of the plating solution was 60 °C, the charge transfer resistance (Rct) of the Ni–Co–P alloy coatings reached a maximum value of 5.63 × 10⁴ Ω·cm−2, which indicates that the suitable plating solution temperature with a constant jet voltage of 12 V is 60 °C.

4. Conclusions

In this work, Ni–Co–P alloy coatings were fabricated on 45 steel substrates by jet electrodeposition in order to study the effects of varying jet voltage and temperature of plating solution on jet electrodeposition. Through the tests and analysis of different samples, the following conclusions can be reached:
(1)
The variation of jet voltage and temperature of plating solution affected the cross-section morphologies, thickness, chemical composition, and crystalline structure of Ni–Co–P alloy coatings. The content of Co in Ni–Co–P alloy coatings reached a maximum value of 47.46 wt·% when the jet voltage was 12 V and the temperature of plating solution was 60 °C. The XRD patterns of Ni–Co–P alloy coatings showed that there was an obvious preferred orientation in the (111) plane.
(2)
When the jet voltage and temperature of the plating solution increased, the microhardness of the Ni–Co–P alloy coatings first increased and then decreased, with the maximum value obtained being 634.9 HV0.1. When the jet voltage was 12 V and the temperature of the plating solution was 60 °C, the wear scar width of Ni–Co–P alloy coatings reached a minimum value of 463.4 µm.
(3)
Jet voltage and temperature of the plating solution significantly influenced seawater corrosion resistance. When the jet voltage was 12 V and the temperature of the plating solution was 60 °C, the polarization curve in the electrochemical test showed that the samples exhibited a lower corrosion current density (Icorr) of 1.72 µA/cm2 and a higher polarization resistance (Rp) of 19.61 kΩ·cm−2, which indicated that the coatings had better seawater corrosion resistance.

Author Contributions

Conceptualization, Y.Z. and M.K.; Methodology, Y.Z. and L.Y.; Validation, Y.Z. and L.Y.; Formal analysis, Y.Z.; Investigation, M.J. and L.Y.; Resources, M.K.; Writing—original draft preparation, Y.Z. and N.S.M.; Writing—review and editing, Y.Z., N.S.M., and M.K.; Visualization, Y.Z.; Supervision, M.K.; Project administration, M.K. and J.Z.; Funding acquisition, M.K. All authors have read and agreed to the published version of the manuscript.

Funding

This research was funded by the Research and Innovation Program for Graduate Students in Jiangsu, China, Grant No. KYCX19_0607.

Acknowledgments

EDS spectra of Ni–Co–P alloy coatings’ surface were analyzed by Research Institute of Nanjing Chemical Industry Group, Sinopec.

Conflicts of Interest

The authors declare no conflict of interest. The funders had no role in the design of the study; in the collection, analyses, or interpretation of data; in the writing of the manuscript; or in the decision to publish the results.

References

  1. Ma, F.; Li, J.; Zeng, Z.; Gao, Y. Tribocorrosion behavior in artificial seawater and anti-microbiologically influenced corrosion properties of TiSiN-Cu coating on F690 steel. J. Mater. Sci. Technol. 2019, 35, 448–459. [Google Scholar] [CrossRef]
  2. Totolin, V.; Pejakovic, V.; Csanyi, T.; Hekele, O.; Huber, M.; Ripoll, M.R. Surface engineering of Ti6Al4V surfaces for enhanced tribocorrosion performance in artificial seawater. Mater. Des. 2016, 104, 10–18. [Google Scholar] [CrossRef]
  3. Momen, G.; Farzaneh, M. Facile approach in the development of icephobic hierarchically textured coatings as corrosion barrier. Appl. Surf. Sci. 2014, 299, 41–46. [Google Scholar] [CrossRef]
  4. Wang, P.; Zhang, D.; Lu, Z. Advantage of super-hydrophobic surface as a barrier against atmospheric corrosion induced by salt deliquescence. Corros. Sci. 2015, 90, 23–32. [Google Scholar] [CrossRef]
  5. Dong, T.; Liu, L.; Li, G.; Wang, R.; Yuan, J.; Feng, Y. Effect of induction remelting on microstructure and wear resistance of plasma sprayed NiCrBSiNb coatings. Surf. Coat. Technol. 2019, 364, 347–357. [Google Scholar] [CrossRef]
  6. Do, Q.; An, H.; Wang, G.; Meng, G.; Wang, Y.; Liu, B.; Wang, J.; Wang, F. Effect of cupric sulfate on the microstructure and corrosion behavior of nickel-copper nanostructure coatings synthesized by pulsed electrodeposition technique. Corros. Sci. 2019, 147, 246–259. [Google Scholar] [CrossRef]
  7. Pang, J.; Li, Q.; Wang, W.; Xu, X.; Zhai, J. Preparation and characterization of electroless Ni-Co-P ternary alloy on fly ash cenospheres. Surf. Coat. Technol. 2011, 205, 4237–4242. [Google Scholar] [CrossRef]
  8. Fetohi, A.E.; Hameed, R.M.A.; El-Khatib, K.M.; Souaya, E.R. Ni-P and Ni-Co-P coated aluminum alloy 5251 substrates as metallic bipolar plates for PEM fuel cell applications. Int. J. Hydrog. Energy 2012, 37, 7677–7688. [Google Scholar] [CrossRef]
  9. Khan, M.R.; Nicholson, E.L. Magnetic properties and microstructure of electroless plated Co-Ni-P and Co-P thin films for longitudinal recording. J. Magn. Magn. Mater. 1986, 54, 1654–1656. [Google Scholar] [CrossRef]
  10. Lew, K.S.; Raja, M.; Thanikaikarasan, S.; Kim, T.; Kim, Y.D.; Mahalingam, T. Effect of pH and current density in electrodeposited Co-Ni-P alloy thin films. Mater. Chem. Phys. 2008, 112, 249–253. [Google Scholar] [CrossRef]
  11. Ji, L.; Chen, F.; Huang, H.; Sun, X.; Yan, Y.; Tang, X. Preparation of nickel–graphene composites by jet electrodeposition and the influence of graphene oxide concentration on the morphologies and properties. Surf. Coat. Technol. 2018, 351, 212–219. [Google Scholar] [CrossRef]
  12. Xia, F.F.; Jia, W.C.; Ma, C.Y.; Yang, R.; Wang, Y.; Potts, M. Synthesis and characterization of Ni-doped TiN thin films deposited by jet electrodeposition. Appl. Surf. Sci. 2018, 434, 228–233. [Google Scholar] [CrossRef]
  13. Jiang, W.; Shen, L.; Qiu, M.; Wang, X.; Fan, M.; Tian, Z. Preparation of Ni-SiC composite coatings by magnetic field-enhanced jet electrodeposition. J. Alloys Compd. 2018, 762, 115–124. [Google Scholar] [CrossRef]
  14. Wang, Y.; Shen, L.; Jiang, W.; Wang, X.; Fan, M.; Tian, Z.; Han, X. Laser processing as an alternative electrodeposition pretreatment. Surf. Coat. Technol. 2019, 357, 957–964. [Google Scholar] [CrossRef]
  15. Rajput, M.S.; Pandey, P.M.; Jha, S. Modelling of high speed selective jet electrodeposition process. J. Manuf. Process. 2015, 17, 98–107. [Google Scholar] [CrossRef]
  16. Ning, D.; Zhang, A.; Murtaza, M.; Wu, H. Effect of surfactants on the electrodeposition of Cu-TiO2 composite coatings prepared by jet electrodeposition. J. Alloys Compd. 2019, 777, 1245–1250. [Google Scholar] [CrossRef]
  17. Qiao, G.; Jing, T.; Wang, N.; Gao, Y.; Zhao, X.; Zhou, J.; Wang, W. High-speed jet electrodeposition and microstructure of nanocrystalline Ni-Co alloys. Electrochim. Acta 2005, 51, 85–92. [Google Scholar] [CrossRef]
  18. Liu, X.; Shen, L.D.; Qiu, M.B.; Tian, Z.J.; Wang, Y.H.; Zhao, K.L. Jet electrodeposition of nanocrystalline nickel assisted by controllable friction. Surf. Coat. Technol. 2016, 305, 231–240. [Google Scholar] [CrossRef]
  19. Xia, F.; Jia, W.; Jiang, M.; Cui, W.; Wang, J. Microstructure and corrosion properties of Ni-TiN nanocoatings prepared by jet pulse electrodeposition. Ceram. Int. 2017, 43, 14623–14628. [Google Scholar] [CrossRef]
  20. Tóth-Kádár, E.; Bakonyi, I.; Pogány, L.; Cziráki, Á. Microstructure and electrical transport properties of pulse-plated nanocrystalline nickel electrodeposits. Surf. Coat. Technol. 1997, 88, 57–65. [Google Scholar] [CrossRef]
  21. Tian, Z.; Wang, D.; Wang, G.; Shen, L.; Liu, Z.; Huang, Y. Microstructure and properties of nanocrystalline nickel coatings prepared by pulse jet electrodeposition. Trans. Nonferr. Met. Soc. China 2010, 20, 1037–1042. [Google Scholar] [CrossRef]
  22. Qiao, G.; Jing, T.; Mang, N.; Gao, Y.; Zhao, X.; Zhou, J.; Wang, W. Effect of current density on microstructure and properties of bulk nanocrystalline Ni-Co alloys prepared by JED. J. Electrochem. Soc. 2006, 153, C305–C308. [Google Scholar] [CrossRef]
  23. Parente, M.V.; Mattos, O.R.; Diaz, S.L.; De Lima-Neto, P.; Miranda, F.F. Electrochemical characterization of Ni-P and Ni-Co-P amorphous alloy deposits obtained by electrodeposition. J. Appl. Electrochem. 2001, 31, 677–683. [Google Scholar] [CrossRef]
  24. Yao, S.; Liu, B.; Guo, H.; Takao, S. Study of Ni-Co-P amorphous alloy electrodeposition and its properties. J. Chem. Ind. Eng. 1996, 1, 48–52. [Google Scholar]
  25. Wang, C.; Shen, L.; Qiu, M.; Tian, Z.; Jiang, W. Characterizations of Ni-CeO2 nanocomposite coating by interlaced jet electrodeposition. J. Alloys Compd. 2017, 727, 269–277. [Google Scholar] [CrossRef]
  26. Li, H.; Kang, M.; Zhang, Y.; Liu, Y.; Jin, M.; Mbugua, N.S.; Zhu, G.; Liu, C. Fabrication of Ni-Co-BN (h) nanocomposite coatings with jet electrodeposition in different pulse parameters. Coatings 2019, 9, 50. [Google Scholar] [CrossRef] [Green Version]
  27. Fang, X.; Du, X.; Gao, S.; Zhang, X. Effect of artificial seawater temperature on electrochemical behavior of Ni-P and Ni-Cu-P alloy coatings. Trans. Nonferr. Met. Soc. China 2018, 6, 1176–1181. (In Chinese) [Google Scholar]
  28. Zhang, X.; Kang, M.; Shao, Y.; Zhang, Y.; Cai, G. Process parameters optimization of electric plating Ni-P alloy coating. Electromach. Mould. 2015, 4, 42–47. (In Chinese) [Google Scholar]
  29. Li, Z.; Deng, Y.; Shen, B.; Liu, L.; Hu, W. Synthesis, characterization and microwave properties of Ni-Co-P hollow spheres. J. Alloys Compd. 2010, 491, 406–410. [Google Scholar] [CrossRef]
  30. Apachitei, I.; Duszczyk, J. Autocatalytic nickel coatings on aluminium with improved abrasive wear resistance. Surf. Coat. Technol. 2000, 132, 89–98. [Google Scholar] [CrossRef]
  31. Apachitei, I.; Tichelaar, F.D.; Duszczyk, J.; Katgerman, L. The effect of heat treatment on the structure and abrasive wear resistance of autocatalytic Ni-P and Ni-P-SiC coatings. Surf. Coat. Technol. 2002, 149, 263–278. [Google Scholar] [CrossRef]
  32. Zimmerman, A.F.; Palumbo, G.; Aust, K.T.; Erb, U. Mechanical properties of nickel silicon carbide nanocomposites. Mater. Sci. Eng. A 2002, 328, 137–146. [Google Scholar] [CrossRef]
  33. Gilewicz, A.; Chmielewska, P.; Murzynski, D.; Dobruchowska, E.; Warcholinski, B. Corrosion resistance of CrN and CrCN/CrN coatings deposited using cathodic arc evaporation in Ringer’s and Hank’s solutions. Surf. Coat. Technol. 2016, 299, 7–14. [Google Scholar] [CrossRef]
  34. Stern, M.; Geary, A.L. Electrochemical polarization: I. A theoretical analysis of the shape of polarization curves. J. Electrochem. Soc. 1957, 104, 56–63. [Google Scholar] [CrossRef]
  35. Kang, M.; Zhang, Y.; Li, H. Study on the performances of Ni-Co-P/BN(h) nanocomposite coatings made by jet electrodeposition. Procedia CIRP 2018, 68, 221–226. [Google Scholar] [CrossRef]
  36. Liu, C.; Su, F.; Liang, J. Fabrication of Co-Ni-P film with excellent wear and corrosion resistance by electroplating with supercritical CO2 emulsion. Trans. Nonferr. Met. Soc. China 2018, 28, 2489–2498. [Google Scholar] [CrossRef]
  37. Meng, G.Z.; Li, Y.; Shao, Y.W.; Zhang, T.; Wang, Y.Q.; Wang, F.H.; Cheng, X.Q.; Dong, C.F.; Li, X.G. Effect of microstructures on corrosion behavior of nickel coatings: (II) competitive effect of grain size and twins density on corrosion behavior. J. Mater. Sci. Technol. 2016, 32, 465–469. [Google Scholar] [CrossRef]
  38. Dai, N.W.; Zhang, L.C.; Zhang, J.X.; Chen, Q.M.; Wu, M.L. Corrosion behavior of selective laser melted Ti-6Al-4V alloy in NaCl solution. Corros. Sci. 2016, 102, 484–489. [Google Scholar] [CrossRef]
  39. Mbugua, N.S.; Kang, M.; Li, H.; Liu, Y.; Joseph, N.; Zhang, Y. The influence of Co concentration on the properties of conventionally electrodeposited Ni-Co-Al2O3-SiC nanocomposite coatings. Prot. Met. Phys. Chem. Surf. 2020, 56, 94–102. [Google Scholar] [CrossRef]
  40. Bakhit, B.; Akbari, A.; Nasirpouri, F.; Hosseini, M.G. Corrosion resistance of Ni-Co alloy and Ni-Co/SiC nanocomposite coatings electrodeposited by sediment codeposition technique. Appl. Surf. Sci. 2014, 307, 351–359. [Google Scholar] [CrossRef]
Figure 1. Experimental device of numerical control jet electrodeposition.
Coatings 10 00639 g001
Figure 2. Effect of jet voltages on cross-section morphologies of Ni–Co–P alloy coatings: (a) 6 V; (b) 8 V; (c) 10 V, (d) 12 V; (e) 14 V; (f) 16 V; (g) 18 V; and (h) 20 V.
Coatings 10 00639 g002
Figure 3. Effect of the temperature of plating solution on cross section morphologies of Ni–Co–P alloy coatings: (a) 40 °C; (b) 45 °C; (c) 50 °C; (d) 55 °C; (e) 60 °C; (f) 65 °C; (g) 70 °C; and (h) 75 °C.
Coatings 10 00639 g003
Figure 4. (a) SEM images in secondary electrons mode; (b) elemental mapping images of Ni; (c) elemental mapping images of Co; (d) elemental mapping images of P; (e) cross section of the samples; and (f) EDS linear scanning results of the samples.
Coatings 10 00639 g004
Figure 5. XRD patterns of Ni–Co–P alloy coatings as a function of: (a) jet voltages; (b) the temperature of plating solution.
Coatings 10 00639 g005
Figure 6. Microhardness of Ni–Co–P alloy coatings as a function of: (a) jet voltages; (b) the temperature of plating solution.
Coatings 10 00639 g006
Figure 7. Optical microscopy images of the Vickers indent for (a) 10 V, 60 °C; (b) 12 V, 60 °C; (c) 20 V, 60 °C; and (d) 75 °C, 12 V.
Coatings 10 00639 g007
Figure 8. Wear resistance of Ni–Co–P alloy coatings as a function of varying: (a) jet voltages; (b) temperature of plating solution.
Coatings 10 00639 g008
Figure 9. SEM micrographs of worn surfaces of Ni–Co–P alloy coatings: (a) 12 V, 60 °C; (b) 20 V, 60 °C; (c) 40 °C, 12 V; and (d) 75 °C, 12 V.
Coatings 10 00639 g009aCoatings 10 00639 g009b
Figure 10. Effect of jet voltage on polarization curves of Ni–Co–P alloy coatings in artificial seawater.
Coatings 10 00639 g010
Figure 11. Effect of jet voltage on electrochemical impedance spectra of Ni–Co–P alloy coatings in artificial seawater: (a) Nyquist plots; (b) Bode plots.
Coatings 10 00639 g011
Figure 12. Equivalent circuit model of Ni–Co–P alloy coatings in artificial seawater.
Coatings 10 00639 g012
Figure 13. Effect of temperature of plating solution on polarization curves of Ni–Co–P alloy coatings in artificial seawater.
Coatings 10 00639 g013
Figure 14. Effect of temperature of plating solution on electrochemical impedance spectra of Ni–Co–P alloy coatings in artificial seawater: (a) Nyquist; (b) Bode.
Coatings 10 00639 g014
Table 1. Composition of the solution used in the pretreatment experiment.
SolutionCompositionConcentration (g·L−1)
Electric Cleaning
Solution
NaOH25.0
Na2CO321.7
Na3PO450.0
NaCl2.4
Strong Activation SolutionHydrochloric acid25.0
NaCl140.1
Weak Activation SolutionH3C6H5O7·H2O94.3
NiCl2·6H2O3.0
Na3C6H5O7·2H2O141.2
Table 2. Composition of the solution used in the preparation of Ni–Co–P alloy coatings.
SolutionCompositionConcentration (g·L−1)
Plating SolutionNiSO4·6 H2O200.0
NiCl2·6 H2O30.0
CoSO4·7 H2O20.0
H3BO330.0
H3PO320.0
C6H8O760.0
Sodium dodecyl sulfate0.08
Sulfourea0.02
Table 3. Chemical composition of artificial seawater.
ConstituentNaClMgCl2Na2SO4CaCl2KClNaH
CO3
KBrH3BO3SrCl2NaF
Concentration (g·L−1)24.5305.2004.0901.1600.6950.2010.1010.0270.0250.003
Table 4. Effect of jet voltages on element content of Ni–Co–P alloy coatings.
Jet Voltages (V)Ni (wt·%)Co (wt·%)P (wt·%)
668.2630.760.98
867.2031.521.28
1058.6940.221.09
1249.2947.463.25
1451.9745.122.91
1655.4342.482.09
1856.8740.992.14
2057.5440.541.92
Table 5. Effect of the temperature of the plating solution on the element content of Ni–Co–P alloy coatings.
Plating Solution Temperature (°C)Ni (wt·%)Co (wt·%)P (wt·%)
4055.2942.981.73
4554.4643.551.99
5053.6743.982.35
5550.1947.352.46
6049.2947.463.25
6553.0543.883.07
7058.0539.242.71
7563.5933.552.86
Table 6. The corrosion potential (Ecorr), corrosion current density (Icorr), and corrosion rate obtained from the Figure 10.
Jet VoltageEcorr (mV)Icorr (µA·cm−2)Corrosion Rate (µm·year−1)βa (mV/dec)βc (mV/dec)Rp (kΩ·cm2)
6−61041.60503.94263662.05
8−50910.02121.22235376.83
10−4332.4529.67878912.59
12−2201.7220.89444419.61
14−3252.3524.824117518.76
16−2403.1436.8814709.56
18−3049.32112.81687166.34
20−51411.41138.22382924.99
Table 7. Impedance spectrum fitting value of Ni–Co–P alloy coatings at different jet voltages.
Jet VoltageRs (Ω·cm−2)CPE-T (10−5 μF·cm−2)CPE-PRct (104 Ω·cm−2)
66.9115.650.480.48
86.402.890.931.34
106.792.410.913.73
127.013.390.925.63
145.492.840.934.14
166.643.890.923.31
187.161.800.872.96
207.253.490.922.55
Table 8. The corrosion potential (Ecorr), corrosion current density (Icorr), and corrosion rate obtained from Figure 13.
Temperature of
Plating Solution (°C)
Ecorr (mV)Icorr
(µA·cm−2)
Corrosion Rate
(µm·year−1)
βa (mV/dec)βc (mV/dec)Rp (kΩ·cm2)
40−4387.99116.61049815.11
45−5255.9471.81652517.28
50−4995.3766.331550415.69
55−3152.1224.414622017.99
60−2201.7220.99444419.61
65−3311.8322.810419416.08
70−3952.0826.711821015.79
75−3683.4742.019335215.61
Table 9. Impedance spectrum fitting value of Ni–Co–P alloy coatings at different temperatures of plating solution obtained from the Figure 14.
Temperature of
Plating Solution (°C)
Rs (Ω·cm−2)CPE-T (10−5 μF·cm−2)CPE-PRct (104 Ω·cm−2)
406.953.170.900.88
456.425.390.841.75
506.333.450.932.42
556.322.920.943.71
607.013.390.925.63
656.063.410.865.07
706.253.460.934.01
756.252.660.903.28

