Article

Effects of Zirconium and Yttrium Oxide on Mechanical and Oxidation Properties of Mo–3Si–1B–1Zr–1Y2O3 (wt.%) Alloy

Basic Department, Air Force Engineering University, Xi’an 710000, China
*
Author to whom correspondence should be addressed.
Coatings 2020, 10(9), 833; https://doi.org/10.3390/coatings10090833
Submission received: 31 July 2020 / Revised: 14 August 2020 / Accepted: 25 August 2020 / Published: 28 August 2020

Abstract

:
Mo–3Si–1B alloys with zirconium (1 wt.%) and yttrium oxide (1 wt.%) additives were fabricated by vibrating sintering techniques. The doped Mo–3Si–1B alloys consisted mainly of α-Mo, Mo3Si, and Mo5SiB2 (T2) phases. It was found that the grains were reduced, and the intermetallics particles were dispersed more homogeneously after the addition of Zr and Y2O3. The optimization in microstructure induced corresponding improvements in both fracture toughness and oxidation resistance. The predominant strengthening mechanisms were fine-grain strengthening and particle dispersion strengthening. In addition, fracture toughness test showed that the additions could improve the toughness of Mo–3Si–1B alloys, for which the toughening mechanism involved a crack trapping by α-Mo phases and extensive small second phase particles in the alloys. What should be paid attention to is the satisfactory oxidation resistance, both at medium-low temperature (800 °C) and high temperature (1200 °C) with doped additives.

1. Introduction

The refractory metal Mo–Si–B alloy is expected to replace the nickel-based superalloy as the next generation of ultra-high temperature materials. The combination of a solid solution of molybdenum and intermetallic compounds, such as α-Mo and Mo5SiB2 and Mo3Si phases, has been extensively proven to have a balance of mechanical properties and high-temperature oxidation resistance. Figure 1 shows the isothermal section of Mo–Si–B at 1600 °C, reported by Nowotny [1]. The proportion of Si and B powders and other additives, such as niobium, yttrium oxide, and lanthanum oxide, has significant effects on the microstructure characterization, macro mechanical properties, and oxidation resistance. The effect of the Si/B ratio on the oxidation behavior of Mo–Si–B alloy has been discussed in Supatarawanich’s report [2]. The results show that when the Si/B ratio is increased to 1, the eutectic alloy has the best oxidation resistance at 1300 °C because Mo3Si provides a silicon source for the protective layer of silicified glass flakes at 1300 °C. Behrani et al. studied the oxidation behavior of Nb–Mo–Si–B alloy in flowing air at 1000 °C [3]. Experimentally, due to the similar structure of niobium and molybdenum, they can form complete mutual solubility, which greatly improves the fracture toughness at room temperature and the toughness at high temperature. But it also brings a problem that the niobium oxide formed above moderate temperature will not volatilize, and then impedes the formation of a protective layer of borosilicate glass. In Kumar’s report, zirconium can adsorb oxygen and carbon impurities in grain boundaries, improve the strength of grain boundaries, refined grains, and increase the oxidation resistance performance of molybdenum alloys by seven times [4]. In particular, Burk et al. reported the oxidation behavior of molybdenum alloy doped with zirconia at a high temperature. Their results showed that zirconia undergoing a phase change above 1100 °C would cause a reduction in volume, causing shrinkage and collapse to damage the borosilicate glass layer [5]. Recently, Guojun Zhang et al. [6,7,8] investigated the effect of ZrB2 addition on the oxidation resistance of Mo–12Si–8.5B alloys at 1300 °C, who found that in the case of high-quality loss during the oxidation transition stage, the oxidation mass loss of the doped zirconium-boride alloy was reduced by 88%. For the effect of vanadium addition on microstructure and mechanical properties in Mo–Si–B alloys, some vanadium atoms solve into the α-Mo matrix, and its fracture toughness reaches 13.3 MPa·m1/2, which is higher than undoped alloy, as shown by Julia Becker et al. [9]. In the study by Miyamoto Shimpei, TiC had a strong pinning effect on the grain boundary and interface migration [10]. Meanwhile, the doped alloy has a high bending strength and fracture toughness. Jéhanno suggested that yttrium oxide did improve oxidation resistance but was far less effective than lanthanum oxide [11,12].
As above, for Mo–Si–B alloy, the balance between its mechanical properties and oxidation resistance has been troubled for a long time, and one is in the process of increasing at the expense of the other. Even if its mechanical properties and oxidation resistance reach a relative balance, it is inevitable to encounter not the highest mechanical properties and not the best oxidation resistance. There are two main methods to solve this problem. One is to improve the processing technique, and the other is to improve its performance through doping. As for the undoped Mo–Si–B alloy, when its mechanical properties and oxidation resistance are relatively balanced, its fracture toughness is still relatively low, and its value is about 6–10 MPa [13,14,15]. There are few reports on the effects of yttrium oxide on the mechanical properties of molybdenum alloys. Therefore, the main work of paper focused on evaluating the effects of zirconium and yttrium oxide on the fracture toughness and oxidation resistance of Mo–Si–B alloy. The goal was to explore the mechanism of the change in fracture type after doping and the reason for the change in oxidation resistance at medium-low and high temperatures.

2. Materials and Methods

Mo, Si, B, Zr, and Y2O3 powder with a purity of 99.95%, 99.90%, 99.95%, 99.90%, and 99.90% were used in this study for mechanical alloying (MA), which achieved fine-grained and chemically homogeneous powder particles. After mechanizing the alloy, the powder was pressed at 200 MPa with a cold isostatic pressing technique for 2 h to make samples in a rectangular shape with the dimensions of 80 mm × 30 mm × 200 mm and, finally, sintered at 1850 °C in a sintering furnace with 8 Hz vibration frequency.
The microstructure of the samples was evaluated by the SEM (Tescan-vega3, TESCAN, Brno, Czech). The phase characteristics of the samples were detected by means of XRD (XRD-7000SAS, Shimadzu, Japan) using Cu-Kα radiation. Especially, the crystal size was calculated by the Scherrer formula. The content of various elements in grains and grain boundaries was analyzed by EDS (EDAX, Mahwah, NJ, USA). For the determination of phase volume fraction, it was verified by the X-ray diffraction spectrum calculation.
As shown in Figure 2, the fracture toughness was evaluated by the three-point bending test (single edge notched beam specimen techniques), which is a well-known experimental method for the estimation of toughness values of comparably brittle materials. The test adopted standard sample preparation with the length of the prefabricated crack up to 2 mm, which was divided into three groups (A, B, C) at a displacement rate of 0.05 mm/min, and the average value was finally taken. For comparison, the fracture toughness of undoped Mo–Si–B alloy was tested under the ordinary sintering method (E, F).
Mo–Si–B alloy had the lowest oxidation resistance at medium-low temperature. In order to explore its oxidation resistance at medium-low temperature after doping, an isothermal oxidation test at 800 °C was designed. In this experiment, twenty-five samples divided into five groups with a size of 3 mm × 3 mm × 3 mm were oxidized in the SX-G12133 reactor (Daheng Optical Precision Machinery Co., Ltd., Shanghai, China) for 50 h. Before the oxidation test was started, the sample was polished by SiC micro-powder and diamond abrading agent and then ultrasonically cleaned. Changes in a mass loss at 5, 10, 30, and 50 h were measured. Similarly, isothermal experiments were also performed at 1200 °C, and mass loss was also evaluated at 5, 10, 30, and 50 h. Finally, the oxidation results were compared by XRD.

3. Results

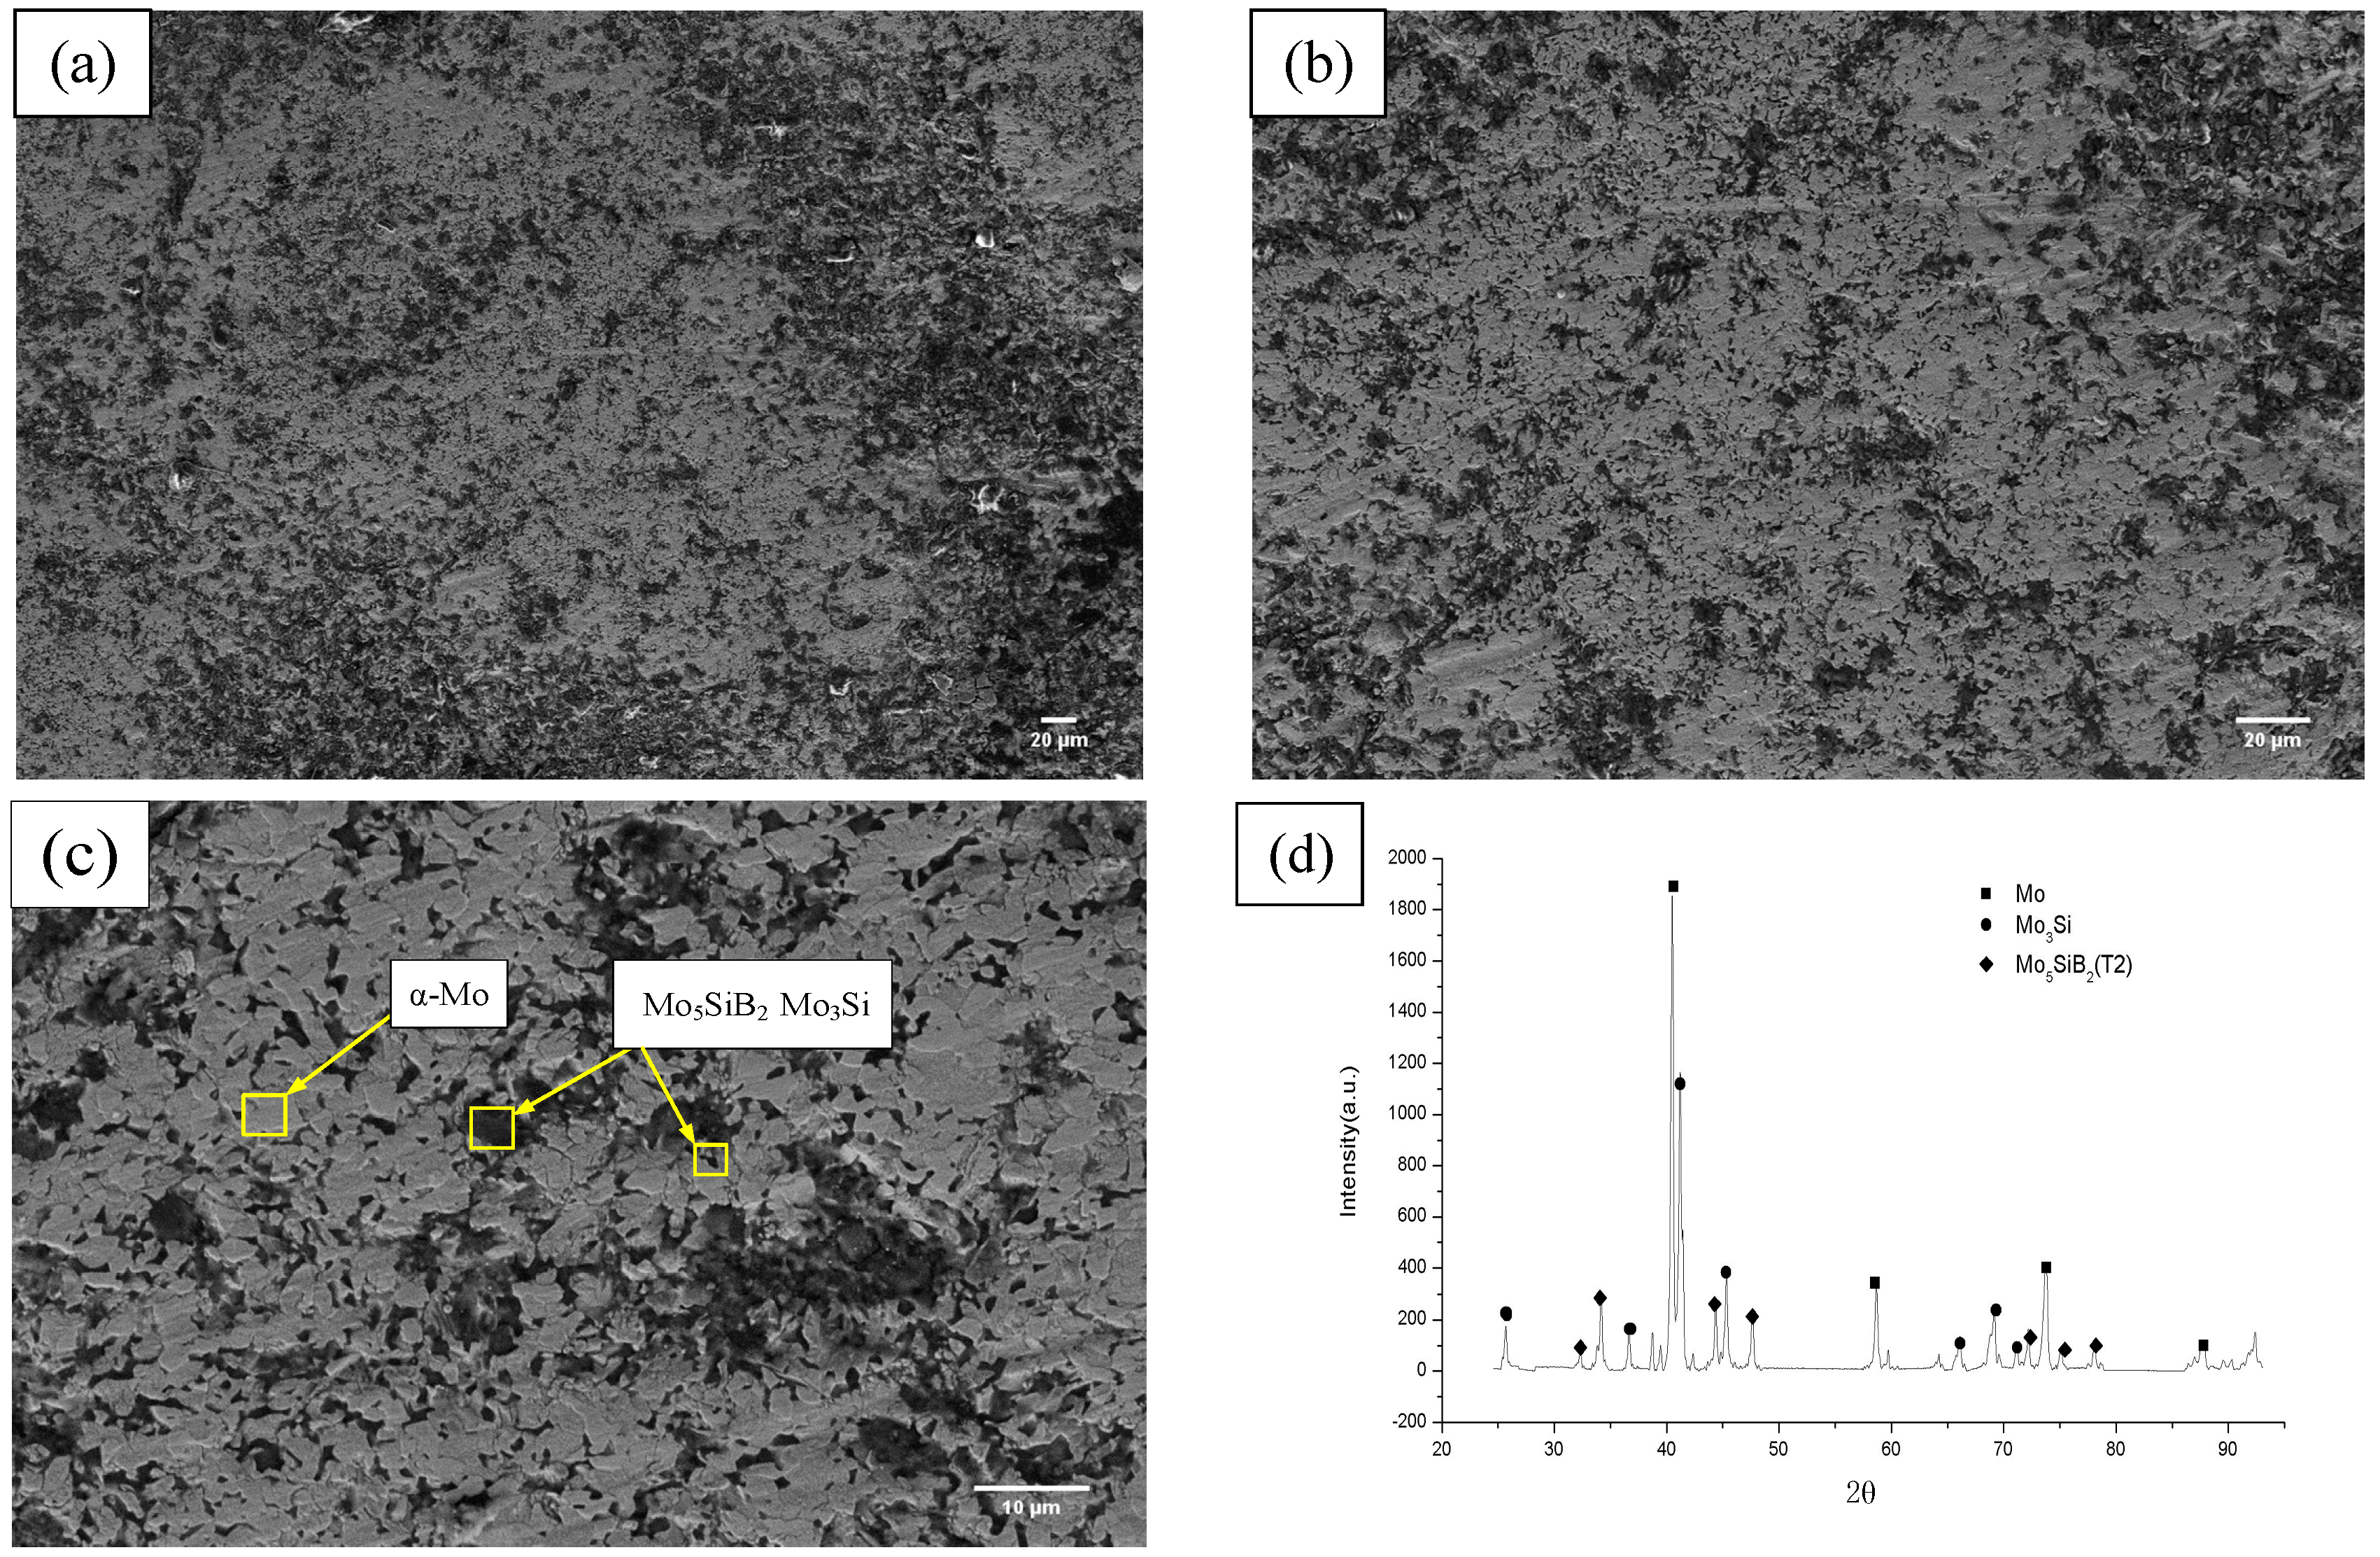
3.1. Microstructure Analysis

The microstructures of the Mo–3Si–1B–1Zr–1Y2O3 alloys are shown in Figure 3, illustrating that the improved powder metallurgy (PM) method allowed producing fine-grained and homogenous microstructures. It can also be seen from Figure 3 that the microstructure had a continuously distributed α-Mo matrix with embedded intermetallic phases, which exhibited an almost invisible crack zone. By means of X-ray diffraction analysis, Mo–Si–B alloy was examined, as shown in Figure 3d, and it was verified that it was mainly composed of three phases: α-Mo (gray), Mo5SiB2 (tetragonal D81, the T2 phase, dark black), and Mo3Si (cubic A15 structure, light black), as expected. The intermetallic phase could not be distinguished clearly due to a similar grayscale. The volume fraction of each phase was calculated by the X-ray diffraction spectra in Figure 3d. It was found that the α-Mo phase accounted for 59%, and Mo5SiB2 and Mo3Si accounted for 41%. Moreover, the average particle diameter of the fine-grained α-Mo phase calculated from the XRD was approximately 4 μm, and the average particle diameter of the intermetallic compounds was approximately 2 μm.
Table 1 shows the volume fractions calculated by the X-ray diffraction spectra.

3.2. Mechanical Properties of Mo–3Si–1B–1Zr–1Y2O3 Alloy

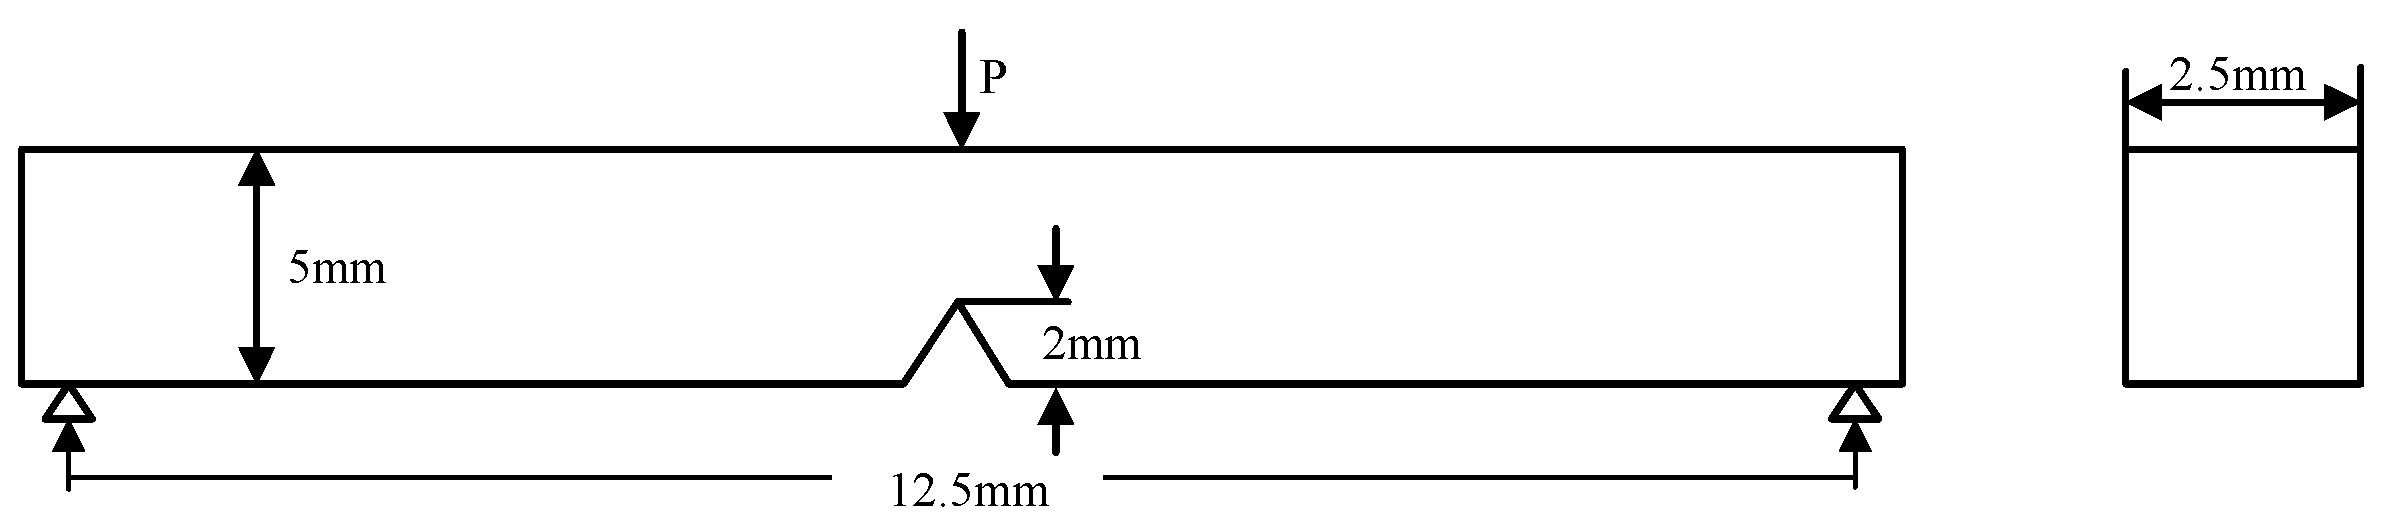
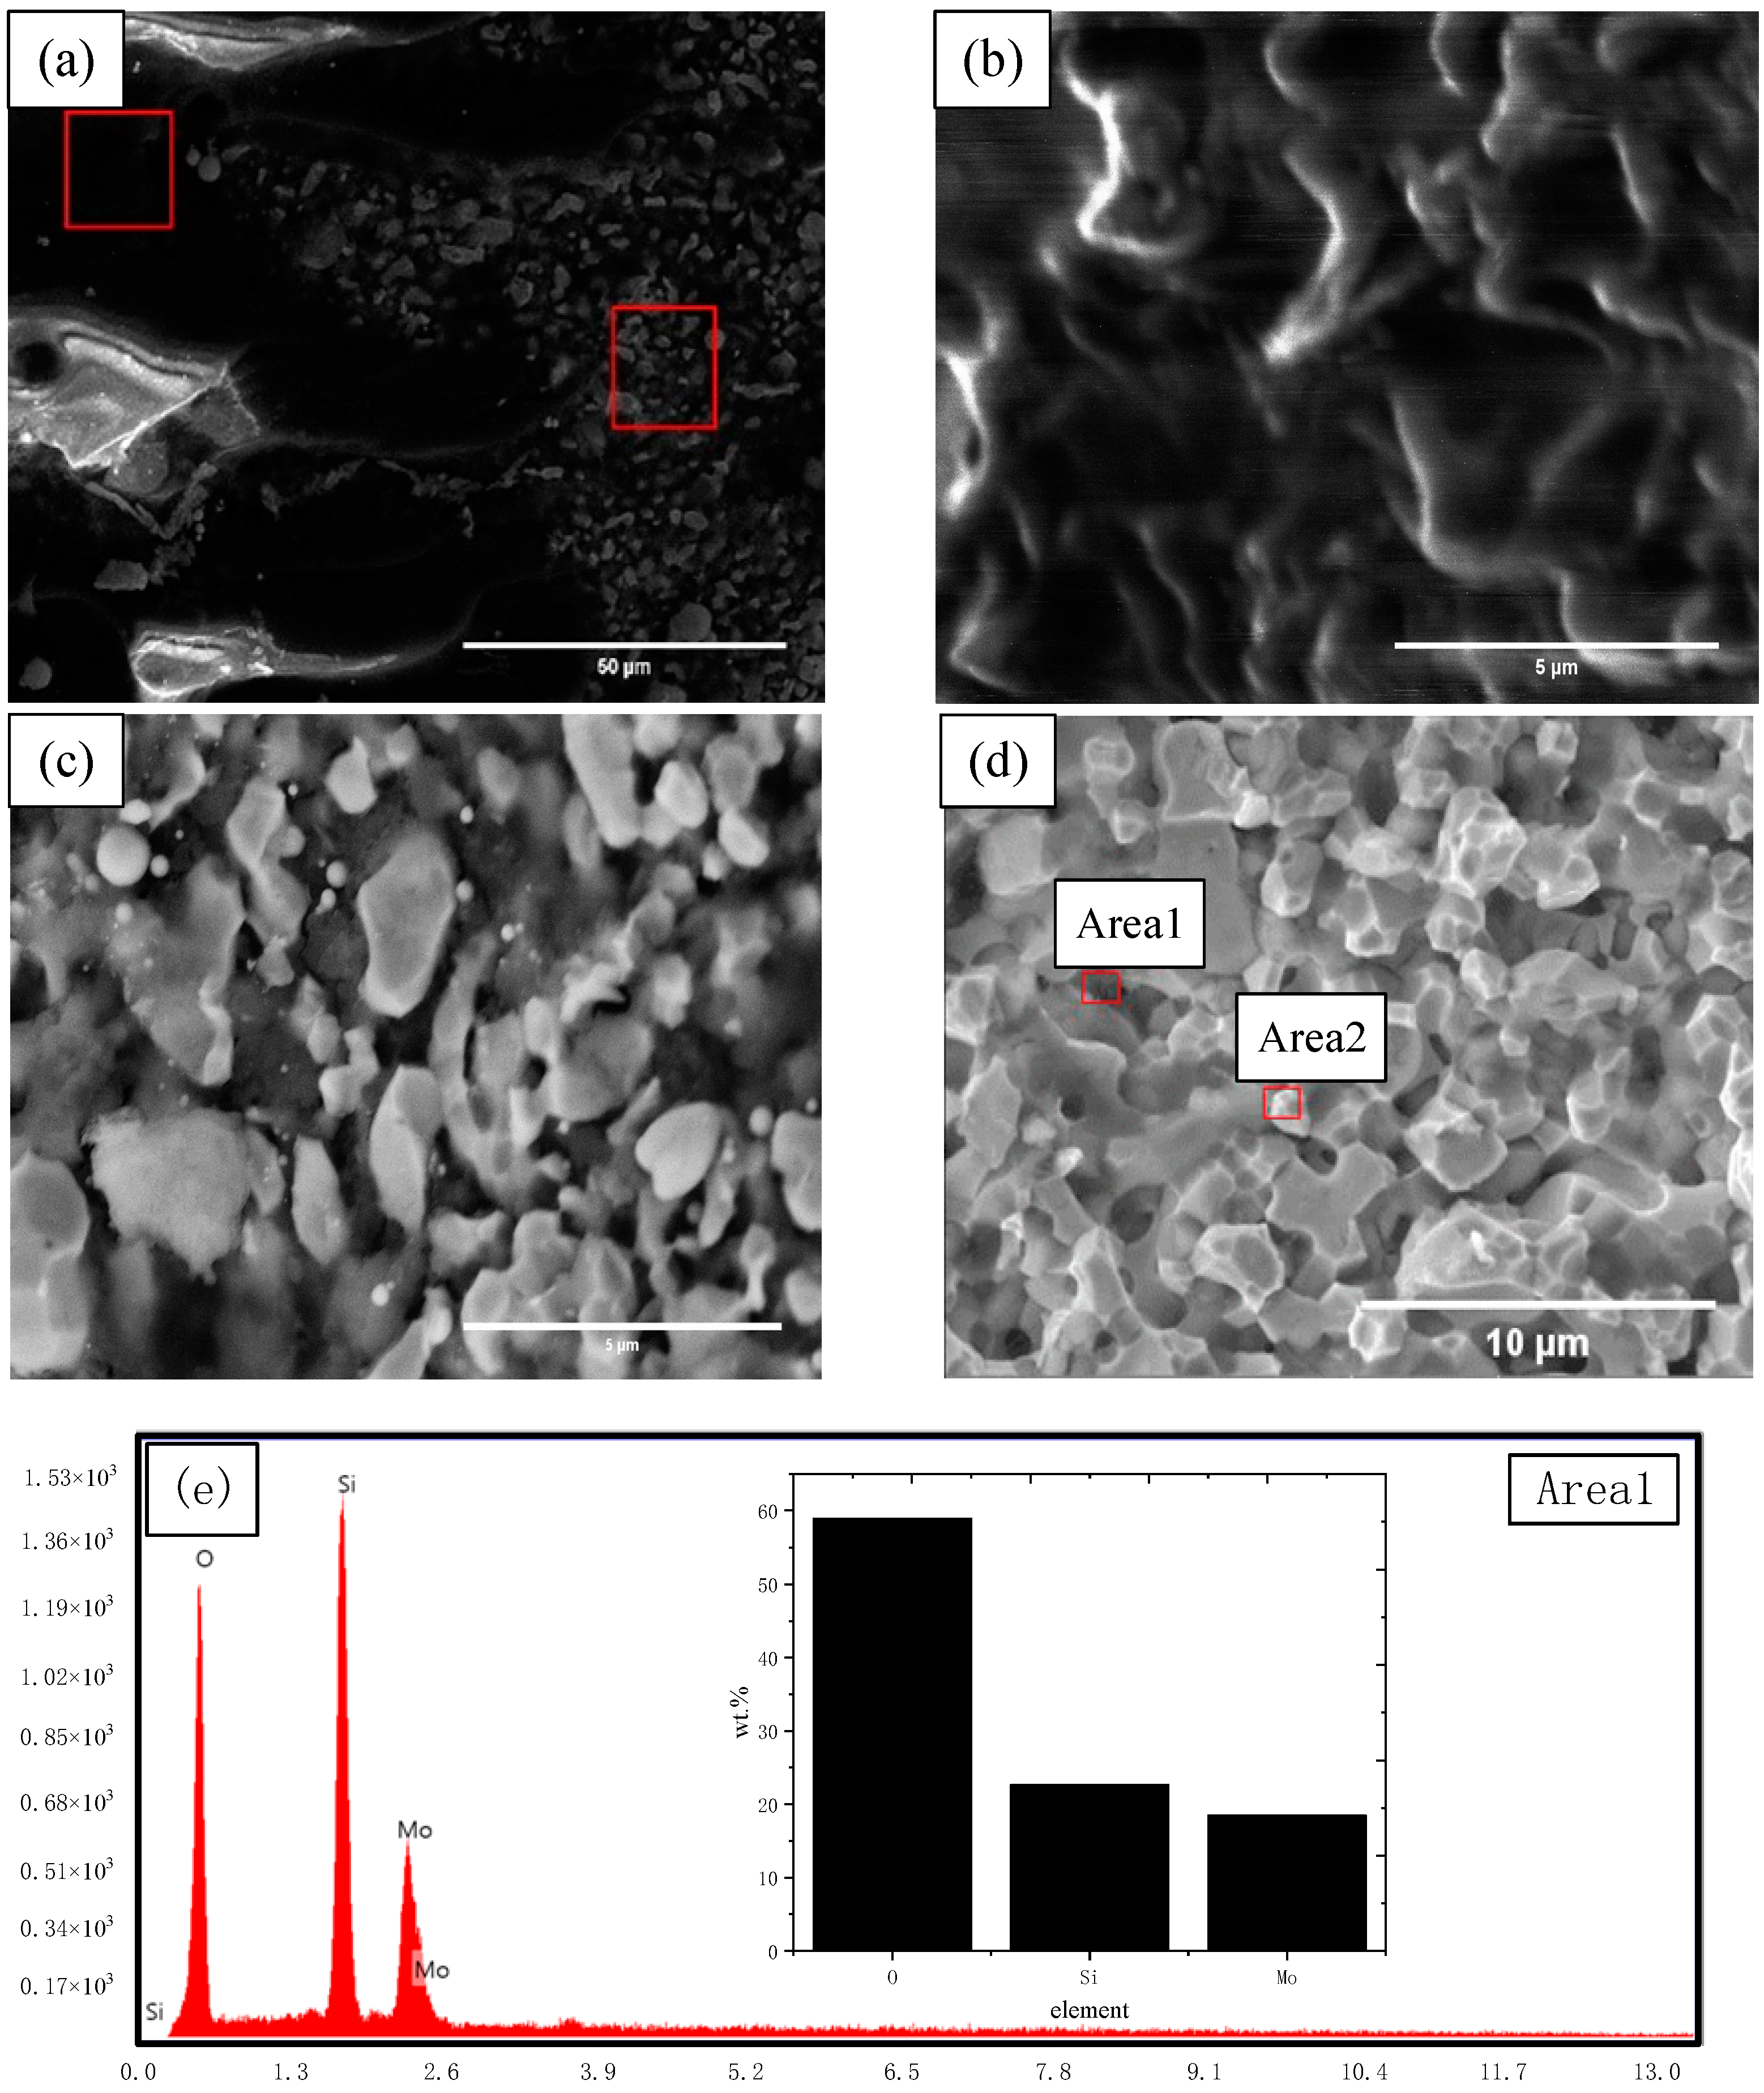
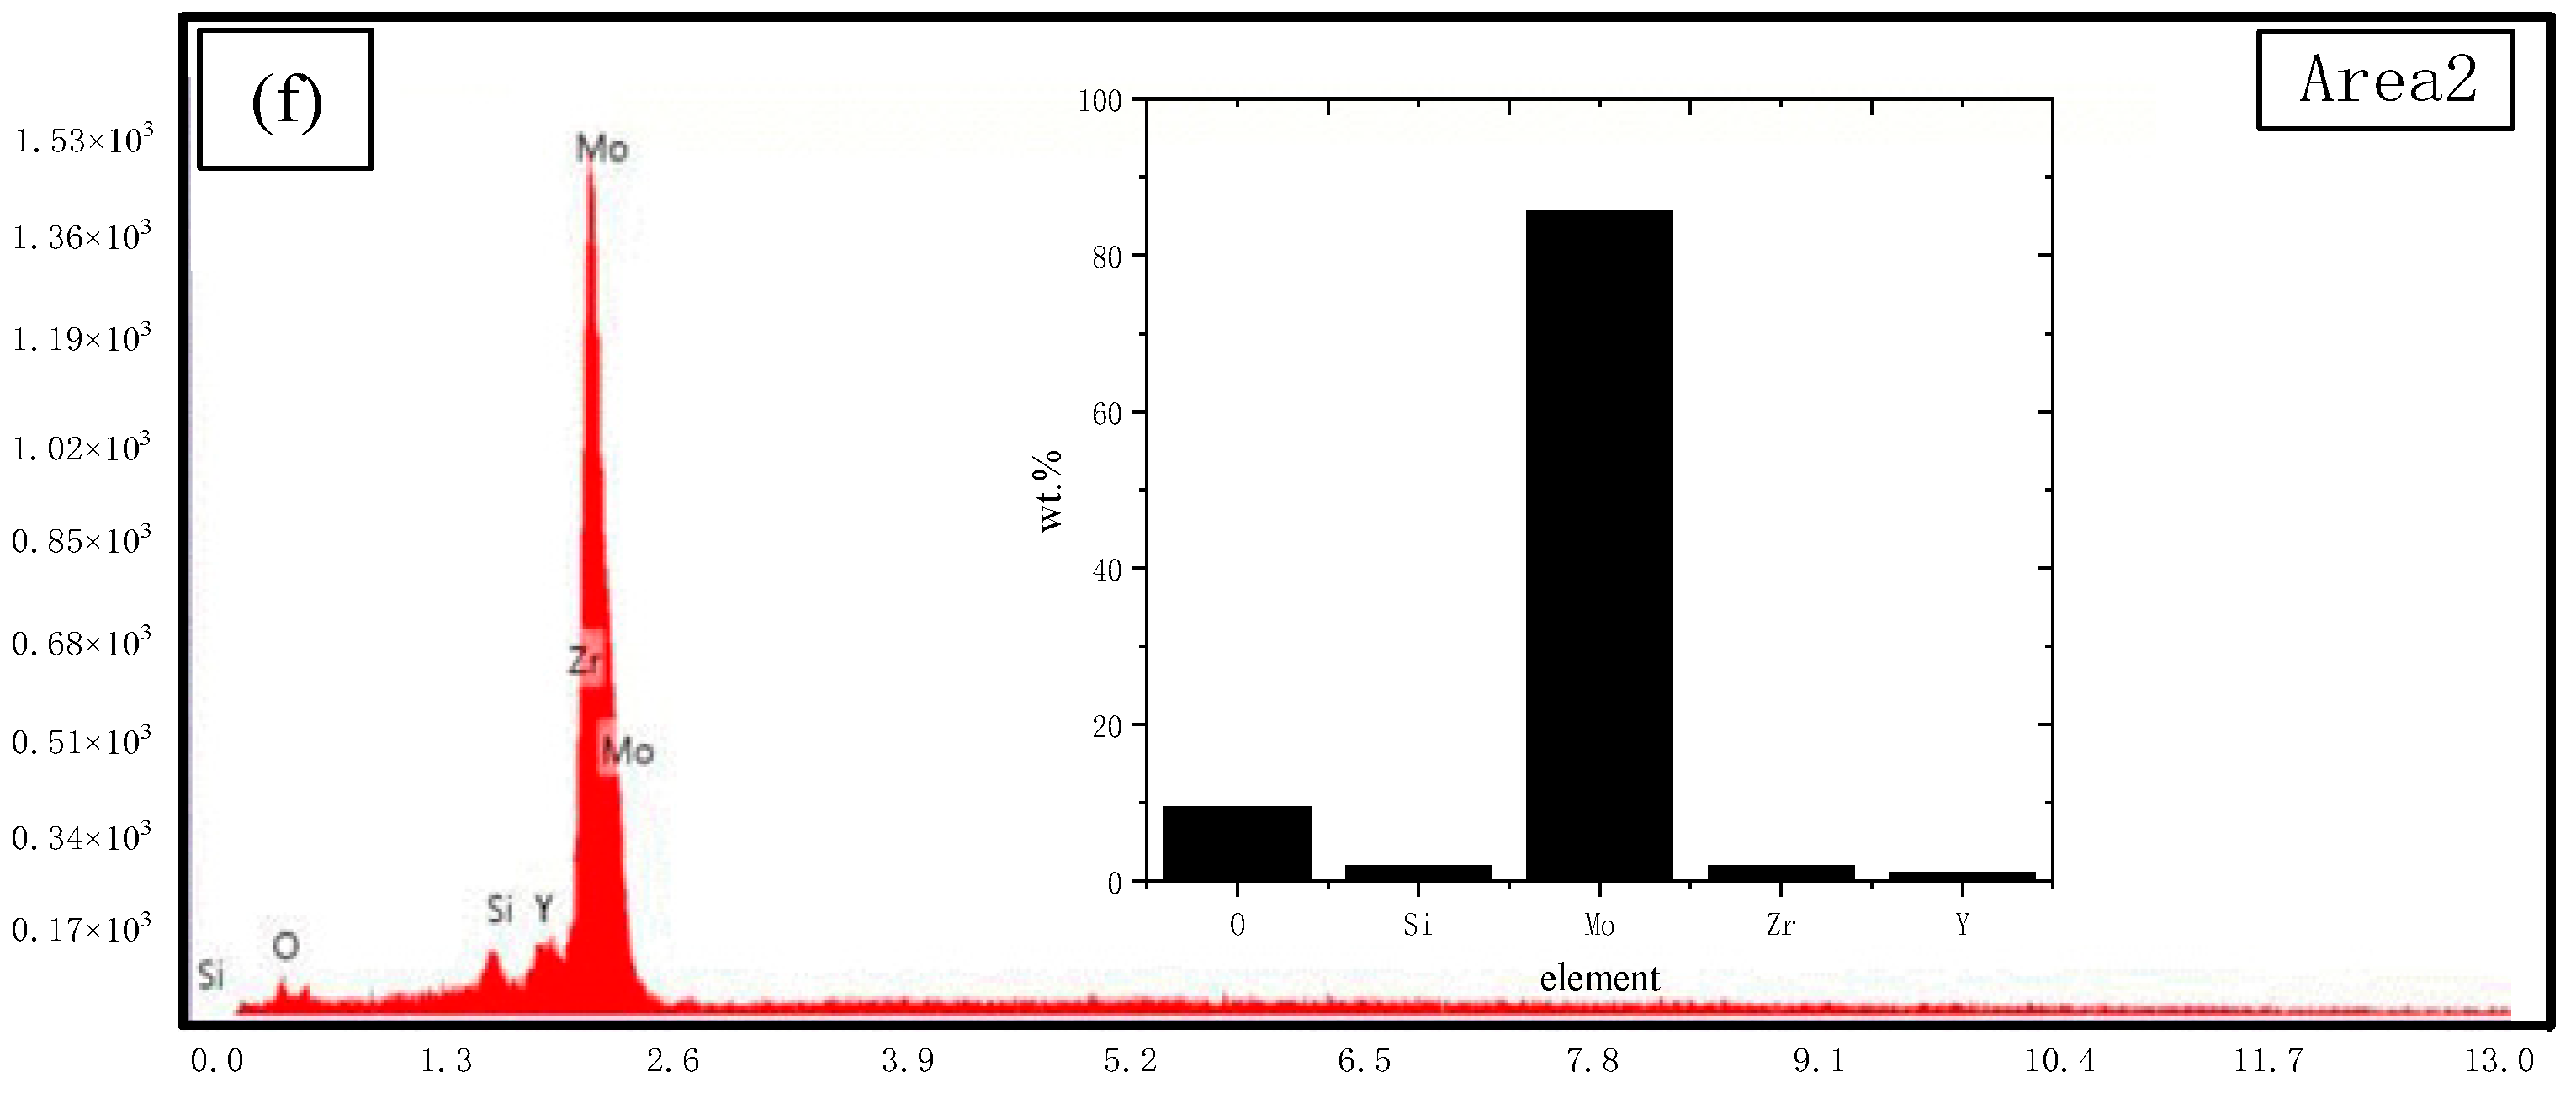
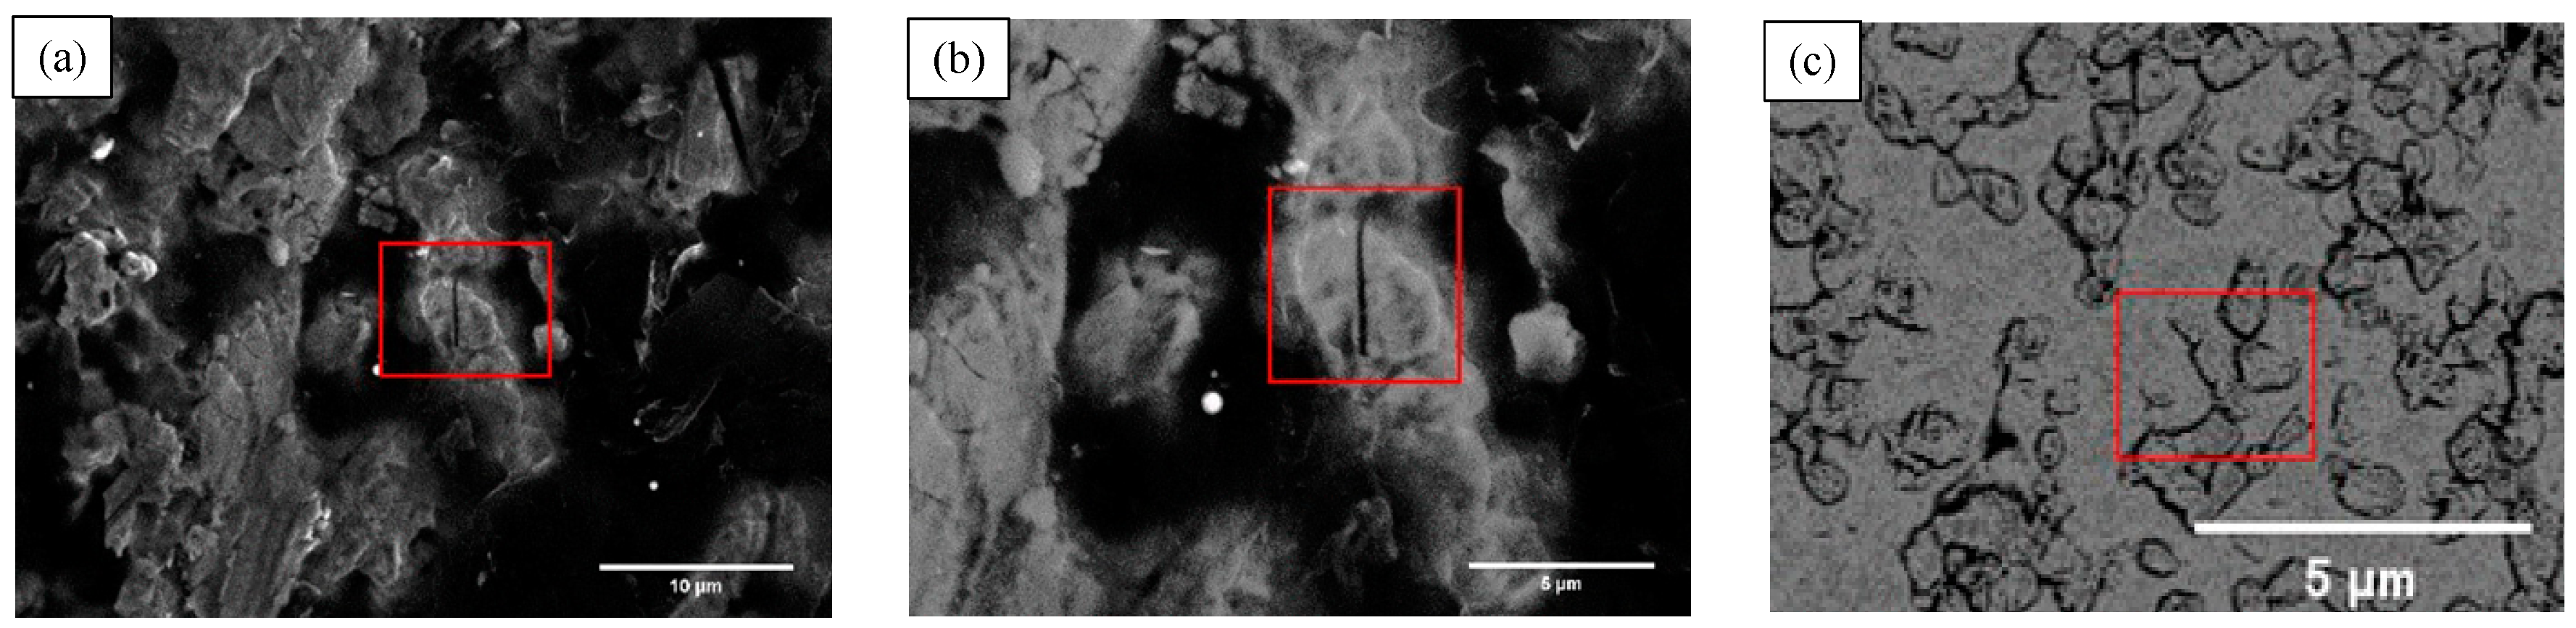
3.2.1. Fracture Toughness and Fracture Surface Features

Table 2 shows the results of the three-point bending test for the fracture toughness value of Mo–3Si–1B–1Zr–1Y2O3 alloy with continuous α-Mo as matrix had fracture toughness average value reaching 13.5 MPa·m1/2. For comparison, the fracture toughness of undoped Mo–Si–B alloy only reached 6.01 MPa·m1/2.
As shown in Figure 4, SEM of the fracture surface described the fracture characteristics of the Mo–3Si–1B–1Zr–1Y2O3 alloy with the mix of crystalline fracture and transgranular fracture as the main fracture type. In Figure 4a, river-like patterns (characteristic of ductile-like fracture) could be seen along the plane, which implied increased ductility. On the contrary, intergranular fracture along grain boundaries (fracture was similar to rock candy) was also discovered at the same time. Fracture type changed from brittle intergranular fracture to ductile cleavage fracture, while undoped molybdenum-silicon-boron alloy only underwent intergranular fracture [13].
In Figure 4e, the silicon element was detected by EDS, indicating that the silicon element was segregated at the grain boundary, and there was also a small amount of oxygen element impurities, which might be unavoidably affected by the doping of oxygen during the ball milling or sintering process. Similarly, in Figure 4f, the presence of the zirconium element and yttrium element was also detected by EDS, as expected, which were mainly distributed at the grain boundaries.

3.2.2. Crack Growth Behavior

Crack trapping can be found as a toughening mechanism in Figure 5. The α-Mo phase was relatively soft, and its existence could improve the fracture toughness of the alloy through crack capture. When the alloy was based on the α-Mo phase, and the intermetallic phase was uniformly distributed in the matrix, then its fracture toughness was the highest. The intrinsic toughness mechanism of the α-Mo phase was very obvious. It acted before the crack tip and improved the inherent toughness. The driving force required to initiate the crack propagation behavior was higher, so the crack was trapped. It can be clearly seen from Figure 5c that cracks could not bypass the continuous and ductile α-Mo phase and be blocked by it. Therefore, continuously distributed α-Mo was critical to its effectiveness against crack growth.

3.3. Oxidation Resistance

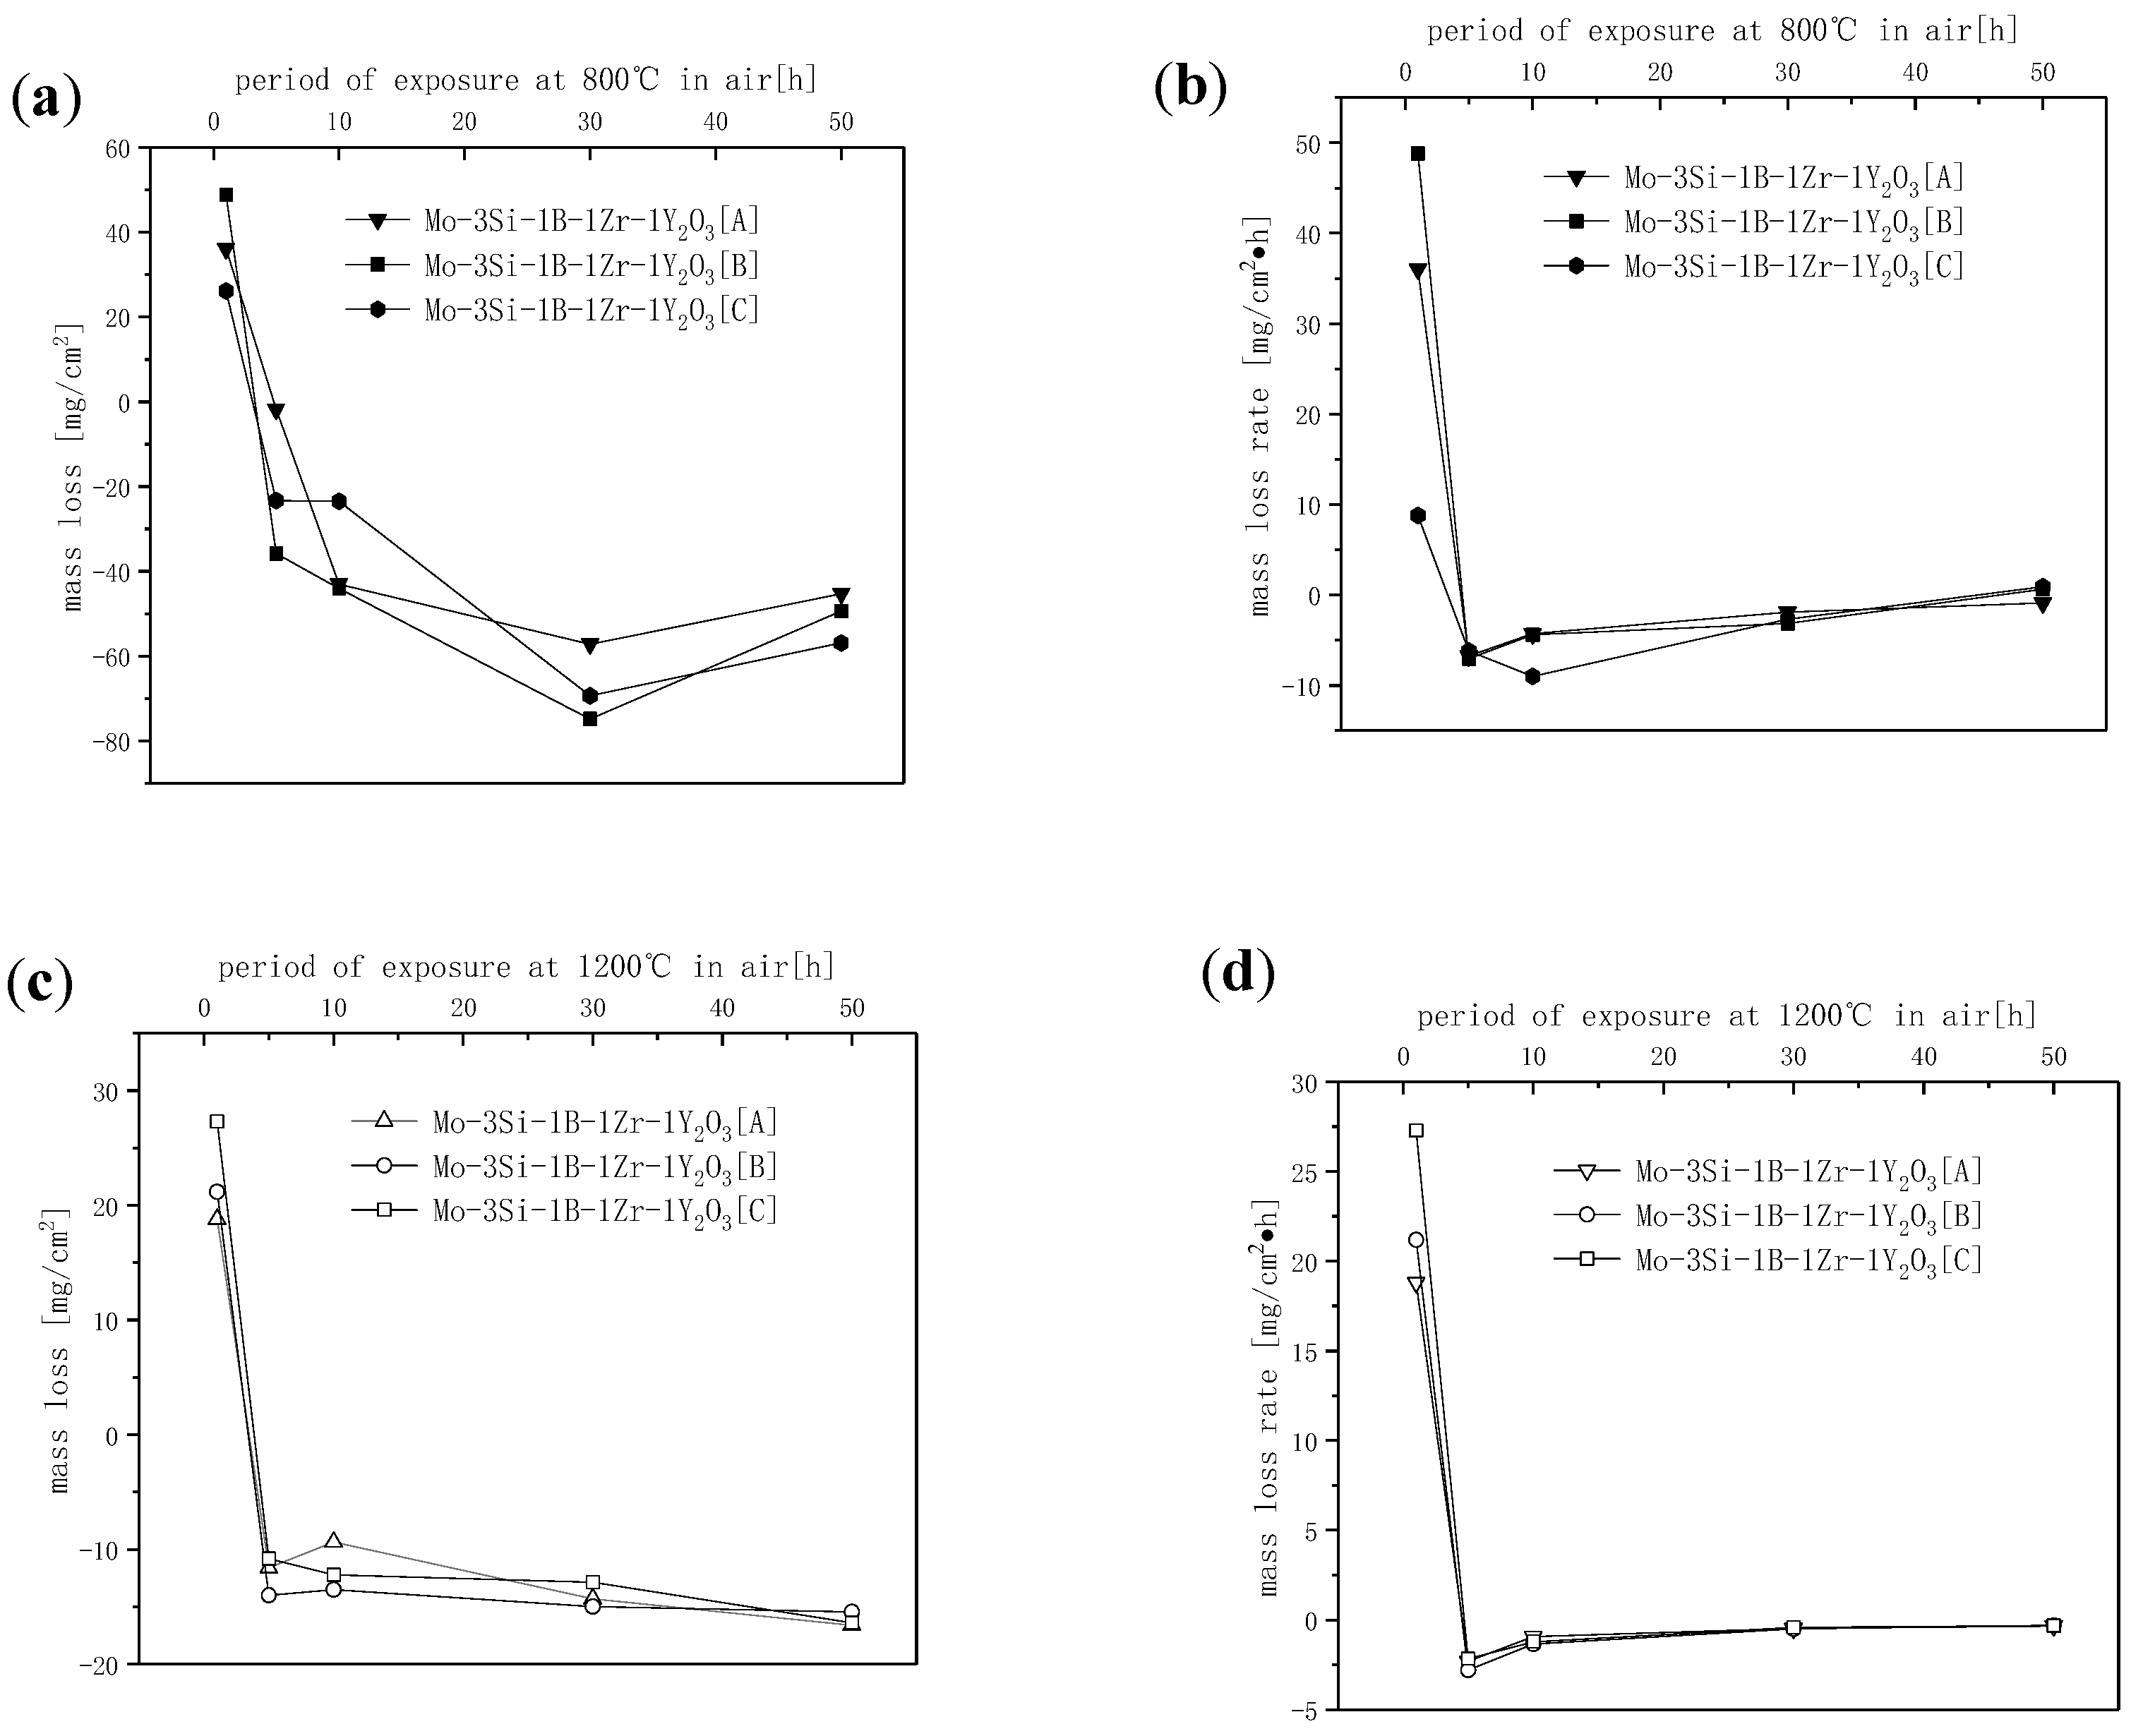
3.3.1. Oxidation Kinetics Process Analysis at 800 and 1200 °C
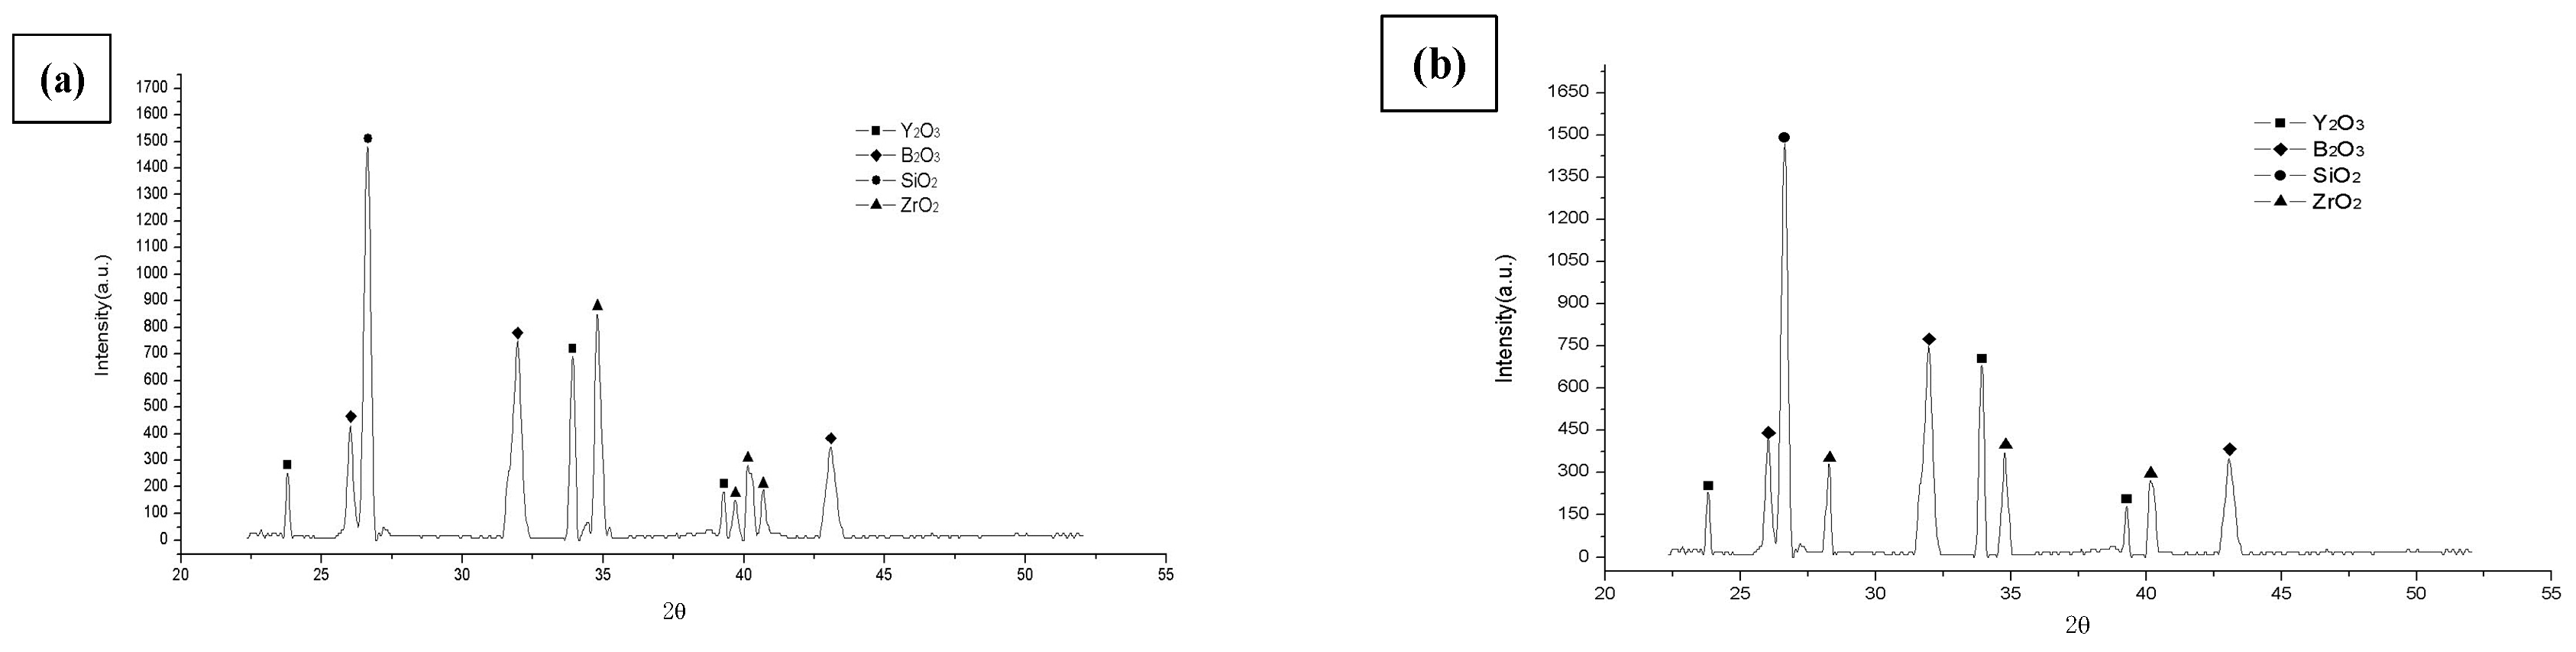
As seen in Figure 6, the cross-section microstructures near the surface exposed at 800 and 1200 °C in the air after 50 h were investigated for the Mo–3Si–1B–1Zr–1Y2O3 alloy. According to M. Krüger’s reports [14], the outermost layer is a borosilicate glass phase, and the intermediate layer of MoO3 and MoO2 is formed beneath the borosilicate glass layer. The interlayer was the α-Mo matrix, which was clearly visible on SEM. The thickness of the intermediate layer at 800 °C reached 30 μm, compared to the intermediate oxide layer at 1200 °C with a thickness of 5 μm in Figure 6a. Obviously, the thickness of the intermediate layer at 1200 °C was significantly thinner than the thickness of the intermediate layer at 800 °C.
Figure 7 shows the comparison and evaluation of the isothermal oxidation response of the Mo–3Si–1B–1Zr–1Y2O3 alloy under laboratory conditions. At 800 °C isothermal oxidation experiment, the weight loss of the attachment was recorded. In the beginning, the Mo–3Si–1B–1Zr–1Y2O3 alloy oxidized sample showed linear weightlessness, but after 5 h of oxidation, the weight of the oxidized sample hardly increased, and it began to experience the stage of oxidative weight loss. But the mass loss of oxidation samples was as low as −50.3 mg/cm2, on average. At the same time, the oxidation rate was as low as −1.03 mg/(cm2·h). As shown in Figure 7c, in order to further explore the high-temperature oxidation resistance of Mo–3Si–1B–1Zr–1Y2O3 alloy, the sample was divided into three pieces, and then an isothermal oxidation experiment was performed at 1200 °C. Markedly, the oxidation rate of Mo–3Si–1B–1Zr–1Y2O3 alloy at 1200 °C was significantly slower compared to Mo–3Si–1B–1Zr–1Y2O3 alloy at 800 °C. At the beginning of oxidation, the mass loss of the sample reached −22 mg/cm2, which exhibited worse linear weight loss. But after 1 h of oxidation, the oxidative weight loss hardly changed and remained at the −2.1 mg/cm2. Moreover, the phenomenon of “pesting” at 800 °C was effectively mitigated. In particular, the oxidation rate of Mo-3Si-1B-1Zr-1Y2O3 at 1200 °C was lower than the oxidation rate at 800 °C.

3.3.2. XRD Results

Figure 8 shows the phase of the oxidized samples, which was obtained by X-ray diffraction detection. Whether at 800 or 1200 °C, obvious SiO2 and B2O3 diffraction peaks were detected. In Figure 8a, a protective borosilicate glass layer containing Y2O3 and ZrO2 was formed on the outer surface, which was marked out in the XRD diffractogram. Furthermore, for the determination of zirconia and yttrium oxide by XRD, it was found that the content of t-ZrO2 was 3%, and the content of m-ZrO2 was 4%. In Figure 8b, X-ray diffraction peaks of ZrO2 and Y2O3 oxide were also detected, but the difference from Figure 8a was that their diffraction peaks had different intensities. It was calculated that t-ZrO2 accounted for 7%. In previous studies, the oxidation performance was very poor of weight loss at 800 °C, which was rarely reported because of its extremely poor “pesting” phenomenon. However, the oxidation weight loss of Mo–3Si–1B alloys with zirconium (1 wt.%) and yttrium oxide (1 wt.%) additives fabricated by vibrating sintering techniques was maintained at about −50.3 mg/cm2, and the oxidation resistance was improved dozens of times. As is known to all, ZrO2 would change from m-ZrO2 to t-ZrO2 at 600–800 °C, and the doped Y2O3 was the stabilizer of zirconia, which inhibited the reverse transformation, that is, t-ZrO2 to m-ZrO2 at 800 °C. It preserved the volume shrinkage (about 5%) and stress changes caused by the transition from m-ZrO2 to t-ZrO2, which improved the fluidity of the glass layer with low viscosity at 800 °C, spread out and covered the cracks and holes, inhibited the evaporation of MoOx and the diffusion of oxygen, and improved the oxidation performance. However, at 1200 °C, ZrO2 all existed in t-ZrO2, and no other phase transitions occurred at this temperature. The viscosity improvement brought by high temperature and the self-healing ability [15,16,17] of Y2O3 to the glass layer made exhibit considerable oxidation performance at 1200 °C.

4. Discussion

In this study, the continuous α-Mo matrix with the intermetallic compounds embedded therein produced by improved powder metallurgy has once again confirmed that it has good mechanical properties and excellent resistance to high-temperature oxidation and can achieve a balance between mechanical properties and oxidation resistance. The addition of zirconium and yttrium elements can refine grains and increase grain density. SEM/EDS and XRD are used as the means of analysis to detect the microstructure and volume fraction in this phase. The results obtained are consistent with the theoretically expected values of Mo–Si–B three-phase diagram at 1850 °C. According to the EDS test in Figure 4, it is found that the Si element segregates on the grain boundary, and the impurity oxygen element is also detected, which is likely due to the oxygen impurity doped in ball milling or sintering. In addition, the presence of zirconium and yttrium is detected in Figure 4f. Zirconium and yttrium atoms compete with harmful silicon atoms at the grain boundaries, weakening the segregation of silicon elements, enhancing the cohesion between grains, and increasing the strength of grain boundaries. What’s more, zirconium and yttrium oxide additions play a significant role in grain refinement since zirconium and yttrium oxide additions act as foreign crystal nuclei, making non-spontaneous nucleation easier. Therefore, it can be found that few pores appear in the microstructure of Mo–3Si–1B–1Zr–1Y2O3 alloy, and its structure size is in the range of 1–2.5 μm. Most of the grain size is in the range of 2–2.5 μm but with some grain sizes up to 4–5 μm. It also can be seen from the fracture section that the grains are very tightly bonded, and there are almost no holes at the triple node of the grains, indicating that the denseness is high. The actual measured density has reached 9.8 g/cm3, which is in line with the expected result.
First, the mechanical properties of Mo–3Si–1B–1Zr–1Y2O3 at room temperature and fracture toughness are discussed here. The results show the fracture toughness of Mo–3Si–1B–1Zr–1Y2O3 with a continuous α-Mo structure reaching 13.5 MPa m1/2. Compared with undoped Mo–3Si–1B alloy [18,19,20], the fracture toughness is much higher than 6.01 MPa m1/2. The result of fracture toughness is greatly affected by the sample specifications. The test results of non-standard samples and standard samples often have a large gap, and the fracture toughness measured by the Vickers indentation method is also affected by factors, such as the type of crack and the loading force; therefore, the results change greatly. The fracture toughness of Mo–3Si–1B–1Zr–1Y2O3 is closely related to its microstructure, and the continuous α-Mo structure has the effect of crack trapping, as shown in Figure 5. Compared to the Mo5SiB2 phase and the Mo3Si phase, the softer α-Mo phase requires more driving force for crack growth [21], but the harder intermetallic compounds around it restrict the α-Mo ductility and reduce the toughness. Furthermore, the zirconium element segregates to the grain boundaries, adsorbing oxygen and carbon atoms, which reduces the repulsive force between grain boundaries, enhances the cohesion of grain boundaries, improves fracture toughness, and inhibits grain growth during operation.
Second, observed from the fracture topography features, for undoped Mo–3Si–1B alloy, the brittle fracture along the crystal grains is the main type of fracture, which can be obtained from a report by Yang [22,23]. EDS of the fracture surface reveals that the content of Si at the grain boundaries is higher. It is due to the solid solution of Si and pure Mo during the mechanized alloy strengthening and the replacement of the larger volume of Mo atoms with the smaller volume of Si atoms, which also explains that the lattice parameters mentioned by M. Krüger will become smaller during the ball milling process [24,25]. The solid solution of Mo greatly increases the strength due to the presence of solid solution atoms, which hinders the movement of dislocations but also reduces the plasticity. As a result, the solid solution phase increases the strength but reduces the toughness. The segregation of free Si atoms at the grain boundaries increases the brittleness, resulting in the inherent toughening mechanism of the ductile α-Mo phase being limited. Thence, the stress is mainly concentrated at the grain boundaries, and the fracture of the alloy appears as a brittle fracture along the grain. Furthermore, Mo–3Si–1B–1Zr–1Y2O3 alloy fracture has both cleavage fracture and crystalline fracture in a mixed manner. This may be caused by uneven loading rates.
Third, Mo–3Si–1B–1Zr–1Y2O3 is subjected to isothermal oxidation experiments at 800 and 1200 °C. The purpose of this experimental design is due to the catastrophic oxidation of Mo–Si–B alloys at moderate temperatures. At 500 to 600 °C, Mo–Si–B alloy will oxidize on the surface to form molybdenum oxide and zirconia, which appear as the weight gain of the sample. MoO3 will volatilize at about 750 °C and cause linear weight loss of the sample. Therefore, Mo–Si–B alloy is poorly oxidized at 800 °C. However, at 650 °C, zirconium transforms from t-ZrO2 (tetragonal crystal structure) to m-ZrO2 (monoclinic crystal structure), and the volume is reduced by 5%, which changes the stress and improves the viscosity. Therefore, the flowability of the borosilicate glass phase increases, which translates linear weight loss into parabolic weight. It is for this reason that the rapid weight loss of the alloy at moderate temperatures is alleviated. The thickness of the MoO3 oxide layer of Mo–3Si–1B–1Zr–1Y2O3 alloy at 800 °C is much thinner than the thickness of the oxide layer of Mo–3Si–1B alloy that has been reported by Schliephake D [26], which is likely due to the addition of Zr element and Y2O3. Similarly, Mo–3Si–1B–1Zr–1Y2O3 shows pretty good high-temperature oxidation resistance at 1200 °C. It can be seen from Figure 7 that in the initial section, it experiences a rapid oxidative weightlessness stage, which is largely due to the volatilization of MoO3. The other reason is due to the small grain size, which makes the Si and B atoms to have shorter diffusion paths on the surface. But it quickly enters the stable stage, and the quality hardly changes. At the same time, the Y2O3 also increases the flowability of the borosilicate glass phase. Through XRD phase detection and calculation, the phase content of the surface of the zirconia is also different at 800 and 1200 °C.

5. Conclusions

In this paper, systematic research on zirconium-doped and yttria-doped molybdenum-silicon-boron alloys produced by improved PM method (vibrating sintering technique) was carried out. Comparative study of microstructure, mechanical performance, and oxidation resistance was realized, and the following conclusions were drawn:
  • Improved PM (vibrating sintering technique) manufacturing process enabled Mo–3Si–1B–1Zr–1Y2O3 alloy to produce fine-grained homogenous microstructures with a continuous α-Mo matrix. It was found that the α-Mo phase accounted for 59%, and Mo5SiB2 and Mo3Si phases accounted for 41%. The fracture toughness value reached an average of 13.5 MPa·m1/2.
  • The fracture surface characteristics were shown as a mixed type of intergranular fracture and transgranular fracture. By EDS analysis, Zr and Y elements were detected at the position of the grain boundaries. On the fracture surface, the crack hindered and terminated in the α-Mo phase.
  • In the temperature oxidation experiment at 800 °C, the Mo–3Si–1B–1Zr–1Y2O3 alloy showed good mid-temperature oxidation resistance, which was due to the transformation of the t-ZrO2 into the m-ZrO2, which caused the volume to shrink, leading to changes in stress and promoting silicon boron glassy phase flow. After 50 h of oxidation, the oxidation weight loss was maintained at about −50.3 mg/cm2. At the same time, the oxidation rate was as low as −1.03 mg/(cm2·h), and the oxidation resistance was improved dozens of times at 800 °C.
  • At 1200 °C, ZrO2 changed into t-ZrO2, and no other phase transitions occurred at this temperature. The viscosity improvement brought by high temperature and the self-healing ability of Y2O3 to the glass layer exhibited considerable oxidation performance at 1200 °C.

Author Contributions

Methodology, C.W.; data curation, Q.L.; writing—original draft, Z.G.; writing—review & editing, L.W.; funding, C.W. All authors have read and agreed to the published version of the manuscript.

Funding

This research was funded by National Natural Science Foundation of China grant number 91860136.

Conflicts of Interest

The authors declare no conflict of interest.

References

  1. Nowotny, H.; Dimakopoulu, E.; Kudielka, H. Untersuchungen in den dreistoffsystemen: Molybdän-silizium-bor, wolfram-silizium-borund in dem system: VSi2-TaSi2. Monatshefte für Chemie und verwandte Teile anderer Wissenschaften 1957, 88, 180–192. [Google Scholar] [CrossRef]
  2. Supatarawanich, V.; Johnson, D.R.; Liu, C.T. Oxidation behavior of multiphase Mo–Si–B alloys. Intermetallics 2004, 12, 721–725. [Google Scholar] [CrossRef]
  3. Behrani, V.; Thom, A.J.; Kramer, M.J.; Akinc, M. Chlorination treatment to improve the oxidation resistance of Nb–Mo–Si–B alloys. Metall. Mater. Trans. A 2005, 36, 609–615. [Google Scholar] [CrossRef]
  4. Kumar, N.K.; Das, J.; Mitra, R. Effect of Zr addition on microstructure, hardness and oxidation behavior of arc-melted and spark plasma sintered multiphase Mo–Si–B alloys. Metall. Mater. Trans. A 2019, 50, 2041–2060. [Google Scholar] [CrossRef]
  5. Behrani, V.; Thom, A.J.; Kramer, M.J.; Akinc, M. Microstructure and oxidation behavior of Nb–Mo–Si–B alloys. Intermetallics 2005, 14, 24–32. [Google Scholar] [CrossRef]
  6. Deng, X.; Zhang, G.; Wang, T.; Ren, S.; Shi, Y.; Bai, Z.; Cao, Q. Microstructure and oxidation resistance of a multiphase Mo-Si-B ceramic coating on Mo substrates deposited by a plasma transferred arc process. Ceram. Int. 2018, 45, 415–423. [Google Scholar] [CrossRef]
  7. Li, W.; Zhang, G.; Wang, S.; Li, B.; Sun, J. Ductility of Mo–12Si–8.5B alloys doped with lanthanum oxide by the liquid-liquid doping method. J. Alloys Compd. 2015, 642, 34–39. [Google Scholar] [CrossRef]
  8. Zhang, G.; He, W.; Li, B.; Zha, Y.; Sun, J. Effect of Si/B ratio on the microstructure and mechanical properties of lanthanum oxide-doped Mo–Si–B alloys. J. Alloys Compd. 2013, 577, 217–221. [Google Scholar] [CrossRef]
  9. Becker, J.; Betke, U.; Hoffmeister, M.; Krüger, M. Density reduction of Mo–Si–B alloys by vanadium alloying. JOM 2018, 70, 2574–2581. [Google Scholar] [CrossRef]
  10. Miyamoto, S.; Yoshimi, K.; Ha, S.H.; Kaneko, T.; Nakamura, J.; Sato, T.; Maruyama, K.; Tu, R.; Goto, T. Phase equilibria, microstructure, and high-temperature strength of TiC-added Mo–Si–B alloys. Metall. Mater. Trans. 2014, 45, 1112–1123. [Google Scholar] [CrossRef]
  11. Jéhanno, P.; Heilmaier, M.; Saage, H.; Heyse, H.; Böning, M.; Kestler, H.; Schneibel, J.H. Super-plasticity of a multiphase refractory Mo-Si-B alloy. Scr. Mater. 2006, 55, 525–528. [Google Scholar] [CrossRef]
  12. Jéhanno, P.; Heilmaier, M.; Kestler, H. Characterization of an industrially processed mo-based silicide alloy. Intermetallics 2004, 12, 1005–1009. [Google Scholar] [CrossRef]
  13. Brindley, K.A.; Priddy, M.W.; Neu, R.W. Integrative materials design of three-phase Mo–Si–B alloys. Integr. Mater. Manuf. Innov. 2019, 8, 1–16. [Google Scholar] [CrossRef]
  14. Hasemann, G.; Ida, S.; Zhu, L.; Iizawa, T.; Yoshimi, K.; Krüger, M. Experimental assessment of the microstructure evolution and liquidus projection in the Mo-rich Mo–Si–B system. Mater. Des. 2020, 185, 108233. [Google Scholar] [CrossRef]
  15. Yang, T.; Guo, X.P. Mechanical alloying behaviors of Mo–Si–B-based alloy from elemental powders under different milling conditions. Rare Met. 2018, 38, 653–664. [Google Scholar] [CrossRef]
  16. Majumdar, S.; Dönges, B.; Gorr, B.; Christ, H.J.; Schliephake, D.; Heilmaier, M. Mechanisms of oxide scale formation on yttrium-alloyed Mo–Si–B containing fine-grained microstructure. Corros. Sci. 2015, 90, 76–88. [Google Scholar] [CrossRef]
  17. Lemberg, J.A.; Ritchie, R.O. Mo–Si–B alloys for ultrahigh-temperature structural applications. Adv. Mater. 2012, 24, 3445–3480. [Google Scholar] [CrossRef]
  18. Lemberg, J.A.; Middlemas, M.R.; Weingärtner, T.; Gludovatz, B.; Cochran, J.K.; Ritchie, R.O. On the fracture toughness of fine-grained Mo-3Si-1B (wt.%) alloys at ambient to elevated (1300 °C) temperatures. Intermetallics 2012, 20, 141–154. [Google Scholar] [CrossRef]
  19. Yang, Y.; Bei, H.; Tiley, J.; George, E.P. Re effects on phase stability and mechanical properties of MoSS+Mo3Si+Mo5SiB2 alloys. J. Alloys Compd. 2013, 556, 32–38. [Google Scholar] [CrossRef]
  20. Makineni, S.K.; Kini, A.R.; Jägle, E.A.; Springer, H.; Raabe, D.; Gault, B. Synthesis and stabilization of a new phase regime in a Mo-Si-B based alloy by laser-based additive manufacturing. Acta Mater. 2018, 151, 31–40. [Google Scholar] [CrossRef]
  21. Zhang, H.; Xu, W.; Xu, Y.; Lu, Z.; Li, D. The thermal-mechanical behavior of WMoNb high-entropy alloy via selective laser melting (SLM): Experiment and simulation. Int. J. Adv. Manuf. Technol. 2018, 96, 461–474. [Google Scholar] [CrossRef]
  22. Guo-jun, Z.; Qian, D.; Hao, K.; Rui-hong, W.; Gang, L.; Jun, S. Microstructure and mechanical properties of lanthanum oxide-doped Mo–12Si–8.5B (at.%) alloys. J. Alloys Compd. 2013, 577, 493–498. [Google Scholar] [CrossRef]
  23. Schmelzer, J.; Rittinghaus, S.K.; Weisheit, A.; Stobik, M.; Paulus, J.; Gruber, K.; Wessel, E.; Heinze, C.; Krügere, M. Printability of gas atomized Mo-Si-B powders by laser metal deposition. Int. J. Refract. Metals Hard Mater. 2019, 78, 123–126. [Google Scholar] [CrossRef]
  24. Krüger, M.; Schmelzer, J.; Smokovych, I.; Barrilao, J.L.; Hasemann, G. Processing of Mo silicide powders as filler particles in polymer-derived ceramic coatings for Mo-Si-B substrates. Powder Technol. 2019, 352, 381–385. [Google Scholar] [CrossRef]
  25. Krüger, M.; Franz, S.; Saage, H.; Heilmaier, M.; Schneibel, J.H.; Jéhanno, P.; Böning, M.; Kestler, H. Mechanically Alloyed Mo-Si-B Alloys with a Continuous α-Mo Matrix and Improved Mechanical Properties. Intermetallics 2008, 16, 933–941. [Google Scholar] [CrossRef]
  26. Schliephake, D.; Azim, M.; von Klinski-Wetzel, K.; Gorr, B.; Christ, H.J.; Bei, H.; George, E.P.; Heilmaier, M. High-temperature creep and oxidation behavior of Mo-Si-B alloys with high Ti contents. Metall. Mater. Trans. A 2014, 45, 1102–1111. [Google Scholar] [CrossRef]
Figure 1. Isothermal section of Mo–Si–B at 1600 °C [1].
Coatings 10 00833 g001
Figure 2. Three-point bending test schematic diagram.
Coatings 10 00833 g002
Figure 3. Microstructure of Mo–3Si–1B–1Zr–1Y2O3 alloy produced by vibrating sintering (a) 500×, SEM; (b) 1000×, SEM; (c) 3000×, SEM; (d) X-ray diffraction pattern of Mo–3Si–1B–1Zr–1Y2O3.
Coatings 10 00833 g003
Figure 4. Mo–3Si–1B–1Zr–1Y2O3 alloy fracture characteristics (a) fracture surface; (b) partial enlargement of the crystalline fracture; (c) partial enlargement of the transgranular fracture; (d) intergranular fracture zone; (e,f) the EDS spectrum on the fracture surface.
Coatings 10 00833 g004aCoatings 10 00833 g004b
Figure 5. Crack induced in the fracture surface of Mo–3Si–1B–1Zr–1Y2O3 alloy: (a) SEM image 3000× magnification; (b) SEM image 6000× magnification; (c) crack propagation via intermetallic phases and crack arrest in an α-Mo phase.
Coatings 10 00833 g005
Figure 6. Oxidation diagram of Mo–3Si–1B–1Zr–1Y2O3 alloy. (a,c) show the cross-section microstructures exposed at 800 °C; (b,d) show the cross-section microstructures exposed at 1200 °C.
Coatings 10 00833 g006
Figure 7. Change of Mo–3Si–1B–1Zr–1Y2O3 alloy mass during 50 h time oxidation: (a,b) show mass loss of Mo–3Si–1B–1Zr–1Y2O3 alloy at 800 °C; (c,d) show mass loss of Mo–3Si–1B–1Zr–1Y2O3 alloy at 1200 °C.
Coatings 10 00833 g007
Figure 8. XRD of Mo–3Si–1B–1Zr–1Y2O3 alloy oxidized at (a) 800 °C (b) 1200 °C.
Coatings 10 00833 g008
Table 1. Phase fraction, calculated from the XRD analysis.
PhasesXRD Calculated
α-Mo59%
Mo3Si31%
Mo5SiB210%
Table 2. Calculated fracture toughness values based on bending tests.
Sample Serial NumberAlloy Composition in wt.%Fracture Toughness (Kq) in MPa·m1/2
AMo–3Si–1B–1Zr–1Y2O312.8
BMo–3Si–1B–1Zr–1Y2O314.1
CMo–3Si–1B–1Zr–1Y2O313.7
DMo–3Si–1B5.91
EMo–3Si–1B6.11

