Article

Effect of Chitosan Coating on PLGA Nanoparticles for Oral Delivery of Thymoquinone: In Vitro, Ex Vivo, and Cancer Cell Line Assessments

1
Department of Pharmaceutics, College of Pharmacy, King Saud University, Riyadh 11451, Saudi Arabia
2
Department of Pharmaceutical Sciences, College of Pharmacy, Almaarefa University, Riyadh 11597, Saudi Arabia
3
Department of Pharmaceutics, School of Pharmaceutical Education and Research, Jamia Hamdard, New Delhi 110062, India
4
Genome Biology Laboratory, Department of Biosciences, Jamia Millia Islamia, New Delhi 110025, India
*
Author to whom correspondence should be addressed.
Coatings 2021, 11(1), 6; https://doi.org/10.3390/coatings11010006
Submission received: 8 November 2020 / Revised: 20 December 2020 / Accepted: 21 December 2020 / Published: 23 December 2020

Abstract

:
In the present study, thymoquinone (TQ)-encapsulated chitosan- (CS)-coated poly(d,l-lactide-co-glycolide) (PLGA) nanoparticles (NPs) were formulated using the emulsion evaporation method. NPs were optimized by using 33-QbD approach for improved efficacy against breast cancer. The optimized thymoquinone loaded chitosan coated Poly (d,l-lactide-co-glycolide) nanoparticles (TQ-CS-PLGA-NPs) were successfully characterized by different in vitro and ex vivo experiments as well as evaluated for cytotoxicity in MDA-MB-231 and MCF-7 cell lines. The surface coating of PLGA-NPs was completed by CS coating and there were no significant changes in particle size and entrapment efficiency (EE) observed. The developed TQ-CS-PLGA-NPs showed particle size, polydispersibility index (PDI), and %EE in the range between 126.03–196.71 nm, 0.118–0.205, and 62.75%–92.17%. The high and prolonged TQ release rate was achieved from TQ-PLGA-NPs and TQ-CS-PLGA-NPs. The optimized TQ-CS-PLGA-NPs showed significantly higher mucoadhesion and intestinal permeation compared to uncoated TQ-PLGA-NPs and TQ suspension. Furthermore, TQ-CS-PLGA-NPs showed statistically enhanced antioxidant potential and cytotoxicity against MDA-MB-231 and MCF-7 cells compared to uncoated TQ-PLGA-NPs and pure TQ. On the basis of the above findings, it may be stated that chitosan-coated TQ-PLGA-NPs represent a great potential for breast cancer management.

1. Introduction

Breast cancer (BC) is the most frequent and deadliest solid tumor among women with over 1.1 million diagnosed cases every year globally. It is a leading cause of cancer deaths with a mortality rate of higher than 1.6% in women globally [1]. Moreover, BC comprises more than 10.4% cases alone among all the cancer incidences in women globally. A dramatic increase in incidences of BC has been reported over the last three decades, due to complex lifestyle and environmental changes. Since the last few decades, various BC treatment strategies have been used in clinics. Among them, conventional chemotherapy is the most successful to date, but its non-selective delivery, serious adverse effects, and multi-drug resistance limit its application [2].
Thymoquinone (TQ: 2-isopropyl-5-methylbenzo-1,4-quinone), a major active constituent of Nigella sativa, is one of the most potent therapeutic molecules used in the treatment of various diseases. At present, TQ is one of the most promising chemotherapeutic drugs used in the treatment of a variety of solid and liquid tumors [3,4]. The reason behind the success of TQ in the treatment of different cancers is the selectivity and therapeutic efficacy against cancer cells and negligible toxicity to normal cells [3]. Despite the promising therapeutic efficacies of TQ, lipophilicity, low aqueous solubility, low oral bioavailability, light and pH sensitivity limit its clinical translation [5].
The development of TQ-encapsulated nanoparticles could emerge as a novel nano platform to overcome the limitations related to the delivery of TQ. Encapsulation of TQ in nanoparticles could increase its solubility, bioavailability, stability in light and different pH of biological systems, therapeutic delivery, and targeting ability to the specific target site. Therefore, the development of a biodegradable, biocompatible, and significantly safe and effective nanoparticle-based drug delivery system is an urgent need for successful cancer therapy [5].
Poly(d,l-lactide-co-glycolide) (PLGA) is an FDA-approved biocompatible and biodegradable synthetic polymer extensively used in the delivery of a variety of chemotherapeutic agents for the management of different solid tumors [6,7,8]. PLGA-nanoparticles (NPs) can enhance aqueous solubility, penetration of drugs from gastrointestinal mucosa, bioavailability, plasma half-life, and therapeutic efficacy of a variety of chemotherapeutic agents. In addition, PLGA-NPs significantly reduce the serious adverse effects by selective targeting of the drug to the target site [8,9]. PLGA produces spherical NPs and negative charge on the surface of NPs, which provides stability to the NPs from hostile pH of the biological system. Furthermore, it releases the encapsulated drugs slowly from the NPs by polymer hydrolysis. However, oral delivery of drugs through PLGA-NPs is still not very successful due to the lack of mucoadhesiveness [10]. Apart from that, the negatively charged surface of PLGA-NPs can obstruct the interaction with intestinal mucosa, which has a negative charge on the surface that results in limited intestinal uptake and bioavailability of encapsulated drugs [10,11].
Chitosan (CS), a natural, non-toxic, biodegradable, and biocompatible cationic polymer, is an extensively used biomaterial for improved oral delivery of a variety of therapeutic drugs due to the unique physicochemical characteristics such as its mucoadhesiveness as well as intestinal permeability enhancing properties. In addition, it has excellent stability in hostile gastrointestinal fluids [12,13]. Surface modification of PLGA-NPs with CS offers various unique advantages such as it provides a positive charge to the NPs, which enhances adhesion of NPs to the intestinal mucosa and also increases the retention on the target site [14]. Therefore, CS coating of PLGA-NPs significantly increases the residence time of NPs at the target site, which leads to enhanced bioavailability of encapsulated drugs, decreases the dose of the drug, reduces dosing frequency, and decreases adverse effects [15].
Therefore, the current study was planned to formulate effective chitosan-coated TQ-PLGA-NPs. The formulation was optimized by using three factors at three levels of Box–Behnken design (BBD). The optimized TQ-CS-PLGA-NPs were further evaluated for in vitro release, mucoadhesion study, and the results compared with uncoated TQ-PLGA-NPs. Finally, antioxidant study and anticancer cell line activity (MDA-MB-231 and MCF-7) were performed to analyze the potential TQ-PLGA-NPs and TQ-CS-PLGA-NPs and free TQ.

2. Materials and Methods

2.1. Materials

Thymoquinone (TQ), chitosan (MW 100,000–300,000), polyvinyl alcohol (PVA, MW 31,000–50,000 Da), TPGS was procured from Sigma-Aldrich, Saint Louis, MO, USA. PLGA (50:50, viscosity 0.8–1.2 dL/g) was provided by Evonik India Pvt Ltd., Mumbai, India, as a gift sample. The experiment was performed with Milli Q water obtained from the laboratory. All other chemicals and reagents used were of AR grade.

2.2. Cell Lines

The cell line study was performed on MDA-MB-231 and MCF-7 breast cell lines. The cells were procured from the National Centre for Cell Science, Pune India. The cells were cultured in streptomycin (100 mg/mL) with Dulbecco’s modified Eagle medium (DMEM), FBS (10%), penicillin 100 U·mL−1 in a specific condition. The cells were subcultured to obtain 80%–90% growth for the experiments.

2.3. Reverse-Phase High-Performance Liquid Chromatography (RP-HPLC) Technique

The RP-HPLC technique was reproduced as per the procedure reported by Gilani et al. [16]. The RP-HPLC system (Waters 2695) connected with a UV detector (Waters 2475 Multi Lambda) was used for the study. The RP-HPLC system consists of a binary pump (model 1525; Milford, CT, USA), and the column used for the study is C18 (150 mm × 3.9 mm × 5 μm). The mobile phase composition water: 2-propanol:methanol (50:45:5 v/v/v) with a flow rate of 1 mL/min was used for the study. The mobile phase was degassed and filtered before use. The injection volume was 20 μL and the detection of the sample was completed at 255 nm. The data acquisition was carried out using Empower software.

2.4. Experimental Design

In the present study, the NPs were optimized by the 33-BBD technique to obtain a robust composition of excipients without undergoing trial and error. The software (Design Expert® 12.0; Stat-Ease Inc., Minneapolis, MN, USA) was used to optimize the prepared NPs (i.e., TQ-CS-PLGA-NPs) [17,18]. The three independent factors used for the study were PLGA (X1; 2%–4%), PVA (X2; 1.5%–2.5%), and sonication time (X3; 2–4 min) as depicted in Table 1. A significant impact of all 3 independent variables was examined on all 3 dependent variables (particle size (PS as Y1 in nm), polydispersibility index (PDI; Y2), and entrapment efficiency (EE; Y3 in %)). The formulation design showed 15 total experimental compositions with three center points, as depicted in Table 2. The point prediction method was used to select the optimized TQ-CS-PLGA-NPs on the basis of minimum particle size (PS), PDI, and maximum EE. The statistical analysis was used to assess the independent variables affecting the responses as well as the interaction between the factors.

2.5. Formulation of TQ-CS-PLGA-NPs

TQ-NPs were formulated by the single-emulsion solvent evaporation technique as per the procedure reported by Abd El Hady et al. [19]. The two different solutions were prepared to formulate TQ-PLGA-NPs. In methylene chloride (organic phase 4 mL), TQ (20 mg), and PLGA (2%–4% w/v, low to high) was dissolved. Separately, the aqueous phase was prepared with the addition of PVA (1.5%–2.5% w/v, low to high), and TPGS (0.25% w/v). The organic solution was transferred into the aqueous solution and sonicated (Hielscher, Ultrasound UP-50H, Teltow, Germany) for 2–4 min (low to high) to obtain a primary emulsion. The organic phase was evaporated with continuous magnetic stirring (Heidolph, IL, USA). The prepared TQ-PLGA-NPs were separated by centrifugation at 10,000 rpm for 1 h followed by washing with water.
Chitosan-coated PLGA nanoparticles were prepared by adding CS (0.1% w/v) in acetic acid (2% v/v) solution to TQ-PLGA-NPs and then incubated for 2 h. Finally, the prepared TQ-CS-PLGA-NPs were reconstituted by centrifugation (Sigma 3K30, Osterode am Harz, Germany) at 10,000 rpm for 1 h and washed three times with Milli Q water. In the end, NPs were lyophilized by adding mannitol (2.5% w/v) as a cryoprotectant for further characterization.

2.6. Characterization

2.6.1. Particle Characterization

The prepared TQ-PLGA-NPs and TQ-CS-PLGA-NPs were characterized for PS, PDI, and zeta potential (ZP). The diluted samples (100-fold) of NPs were measured in a zeta sizer. ZP of optimized NPs was assessed to determine the charge on NPs’ surface [20]. The surface morphology of TQ-PLGA-NPs and TQ-CS-PLGA-NPs was evaluated on TEM (TEM-2100, JEO, Tokyo, Japan) at 160 kV voltage [21]. The samples were coated with phosphotungstic acid and visualized under the microscope at high resolution. The micrographs were captured and visualized with the help of image viewing software.

2.6.2. Entrapment Efficiency

The prepared formulations were evaluated for encapsulation efficiency by estimating the free TQ in the supernatant. The prepared formulations were centrifuged at 10,000 rpm and the supernatant was collected. The unentrapped TQ was diluted further to quantify TQ by UV spectrophotometer at 255 nm. The blank NPs supernatant was used to evaluate the samples [19]. Then, %EE was calculated with the use of the below equation:
% EE = Amount   of   TQ Amount   of   free   TQ Amount   of   TQ     × 100

2.7. In Vitro Gastrointestinal Stability Study

The prepared optimized formulation (TQ-CS-PLGA-NPs) was evaluated for gastrointestinal stability as per the published procedure [22,23]. The stability was assessed in simulated intestinal fluid (SIF) and gastric fluid (SGF). TQ-CS-PLGA-NPs (0.1 mL) were withdrawn and diluted up to 5 mL (1 in 50) in SIF and SGF and incubated at 37 °C. After specific time intervals (0, 2, 4, 8, 12 h), the sample was evaluated for PS, PDI, and EE.

2.8. Colloidal Stability

The colloidal stability of optimized TQ-CS-PLGA-NPs was conducted as per the previously published method with a minor modification [23]. The freeze-dried TQ-CS-PLGA-NPs were stored at 4 °C for 90 days (three months). TQ-CS-PLGA-NPs were taken at the time points of 0, 1, and 3 months, and dispersed in phosphate buffer saline pH 7.4 for determination of PS, PDI, and %EE.

2.9. TQ Release Study

The comparative TQ release study was conducted between TQ-PLGA-NPs, TQ-CS-PLGA-NPs, and TQ suspension (control) in release medium SIF (500 mL, pH 6.8) at 37 °C. Weighed content of prepared NPs (~5 mg of TQ) was placed in the dialysis bag (MW 12,000 D) and dipped into release medium with stirring speed of 100 rpm. At specific time points, the released content (5 mL) was withdrawn and replaced with the same volume. The collected samples were filtered, diluted, and analyzed to quantify TQ content using a UV spectrophotometer at 255 nm. Further, the released data fitted into various kinetic models to analyze the mechanism of TQ release from the NPs [24].

2.10. Mucoadhesion Study

TQ-PLGA-NPs, TQ-CS-PLGA-NPs, and TQ suspension were evaluated for mucoadhesion study to check the adsorption of mucin on the NPs [25]. The mucin solution (1 mg/mL) was prepared and mixed with the prepared formulations in 1:1 ratio. The mixture was incubated at 37 °C for 2 h and then centrifuged at 13,000 rpm for 60 min. The supernatant was taken, diluted appropriately, and analyzed spectrophotometrically at 258 nm to calculate the free mucin content. The formula used to calculate is given below [26].
Mucoadhesive   efficiency = C 0 C f C 0 × 100
where C0 = initial mucin content and Cf = free mucin content.

2.11. Antioxidant Activity

The activity performed for TQ-PLGA-NPs, TQ-CS-PLGA-NPs, and TQ suspension to check the antioxidant activity was the reported procedure with a slight modification [27]. The stock solution (10 mg/mL) was prepared for all three samples in ethanol and further diluted to make 25–300 µg/mL concentration range. All the samples (500 µL) were taken and transferred to DPPH solution (0.02% in ethanol). The samples were shaken for complete reaction and placed in the dark at 25 °C for 1 h. The reaction took place between violet color DPPH and antioxidants. The violet color of the solution turns colorless after the completion of the reaction. Similarly, this experiment was repeated for placebo NPs. The samples were examined spectrophotometrically at 517 nm, and calculation was completed using the formula:
Radical   Scavenging   % = Absorbance   of   control Absorbance   of   test Absorbance   of   control × 100

2.12. Cell Viability Assay

MTT assay of TQ-PLGA-NPs, TQ-CS-PLGA-NPs, and TQ suspension was performed to check the cell viability [28]. This test works on the mechanism of the formation of yellow tetrazolium salt to insoluble purple formazan crystals [29]. Both MDA-MB-231 and MCF-7 cells were seeded 24 h before the study. The cell counts 1 × 10⁵/well were taken for the study, and a different concentration of each sample was incubated for 24 h and 48 h, respectively. After that, the cells were incubated with MTT (20 µL, 5 mg/mL in PBS) in fresh medium for 4 h under CO2 incubator. The formed formazan crystal was solubilized in DMSO (150 µL/well). The absorbance was noted at 570 nm on a microplate reader.

2.13. Intestinal Permeation Study

The permeation experiment of TQ-PLGA-NPs, TQ-CS-PLGA-NPs, and TQ suspension was conducted to determine the amount of drug permeated at specific times. The study was performed on the goat intestine by the reported procedure with slight modification [30,31]. The fresh goat intestine was collected from the local slaughterhouse at an abattoir in a sterile beaker and washed with Kreb’s solution to remove the food residues. The formulations (~5 mg of TQ) were carefully placed in the intestinal sac, and both ends were ligated tightly. The samples were placed in a beaker containing Kreb’s solution (250 mL) and regularly oxygenated with 95% oxygen using an aerator. The released content (2 mL) was taken at a specific time point and replaced with the same volume. The samples were filtered, diluted, and quantified by using the RP-HPLC technique at 255 nm [16]. The permeation flux and apparent permeability coefficient (APC; Papp) were determined for the formulations by the following equation:
APC = Permeation   flux Surface   area × Initial   TQ   content cm / min

2.14. Statistical Analysis

Experiments were conducted 3 times, and their findings were represented as average ± SD. The statistical analysis was performed with GraphPad prism (version 7). Furthermore, the data were analyzed statistically using ANOVA and Tukey’s test with the help of GraphPad Prism, version 7. The data were considered statistically significant when p < 0.05.

3. Results and Discussion

3.1. Optimization

The developed TQ-CS-PLGA-NPs were statistically optimized with 33-BBD. The impact of independent variables (X1, X2, and X3) on the dependent variables (Y1, Y2, and Y3) was evaluated by 3D response surface plot (Figure 1), and contour plot (Figure 2). The polynomial equations obtained from the software were used to assess the individual, as well as the combined, impact of all three independent variables. The quadratic model is commonly used for studying the major impact because this model uses the selected variables individually, as well as combinedly.
The independent variables PLGA (%, X1); PVA (%, X2) and ST (%, X3) were taken at three levels (low (−1), medium (0), and high (+1)) to optimize TQ-CS-PLGA-NPs as shown in Table 1. The concentration ranges taken to develop TQ-CS-PLGA-NPs were PLGA (X1) as 2% (−1) to 4% (+1), PVA (X2) as 1.25% (−1) to 2.5% (+1) and ST 2 min (−1) to 4 min (+1). The BBD represented 15 formulations with three center points to analyze any errors in the results of the same three compositions. The minimal PS (Y1) was observed to be 126.03 nm (F9), and the maximal PS was observed to be 196.71 nm (F1). The PDI (Y2) was obtained in the range of 0.118 (F12) to 0.205 (F3), and the %EE (Y3) was obtained in the range 62.75% (F9) to 92.17% (F1). The results obtained from the experiment, i.e., actual value, were observed to be much closer to the predicted value, as represented in Table 2.

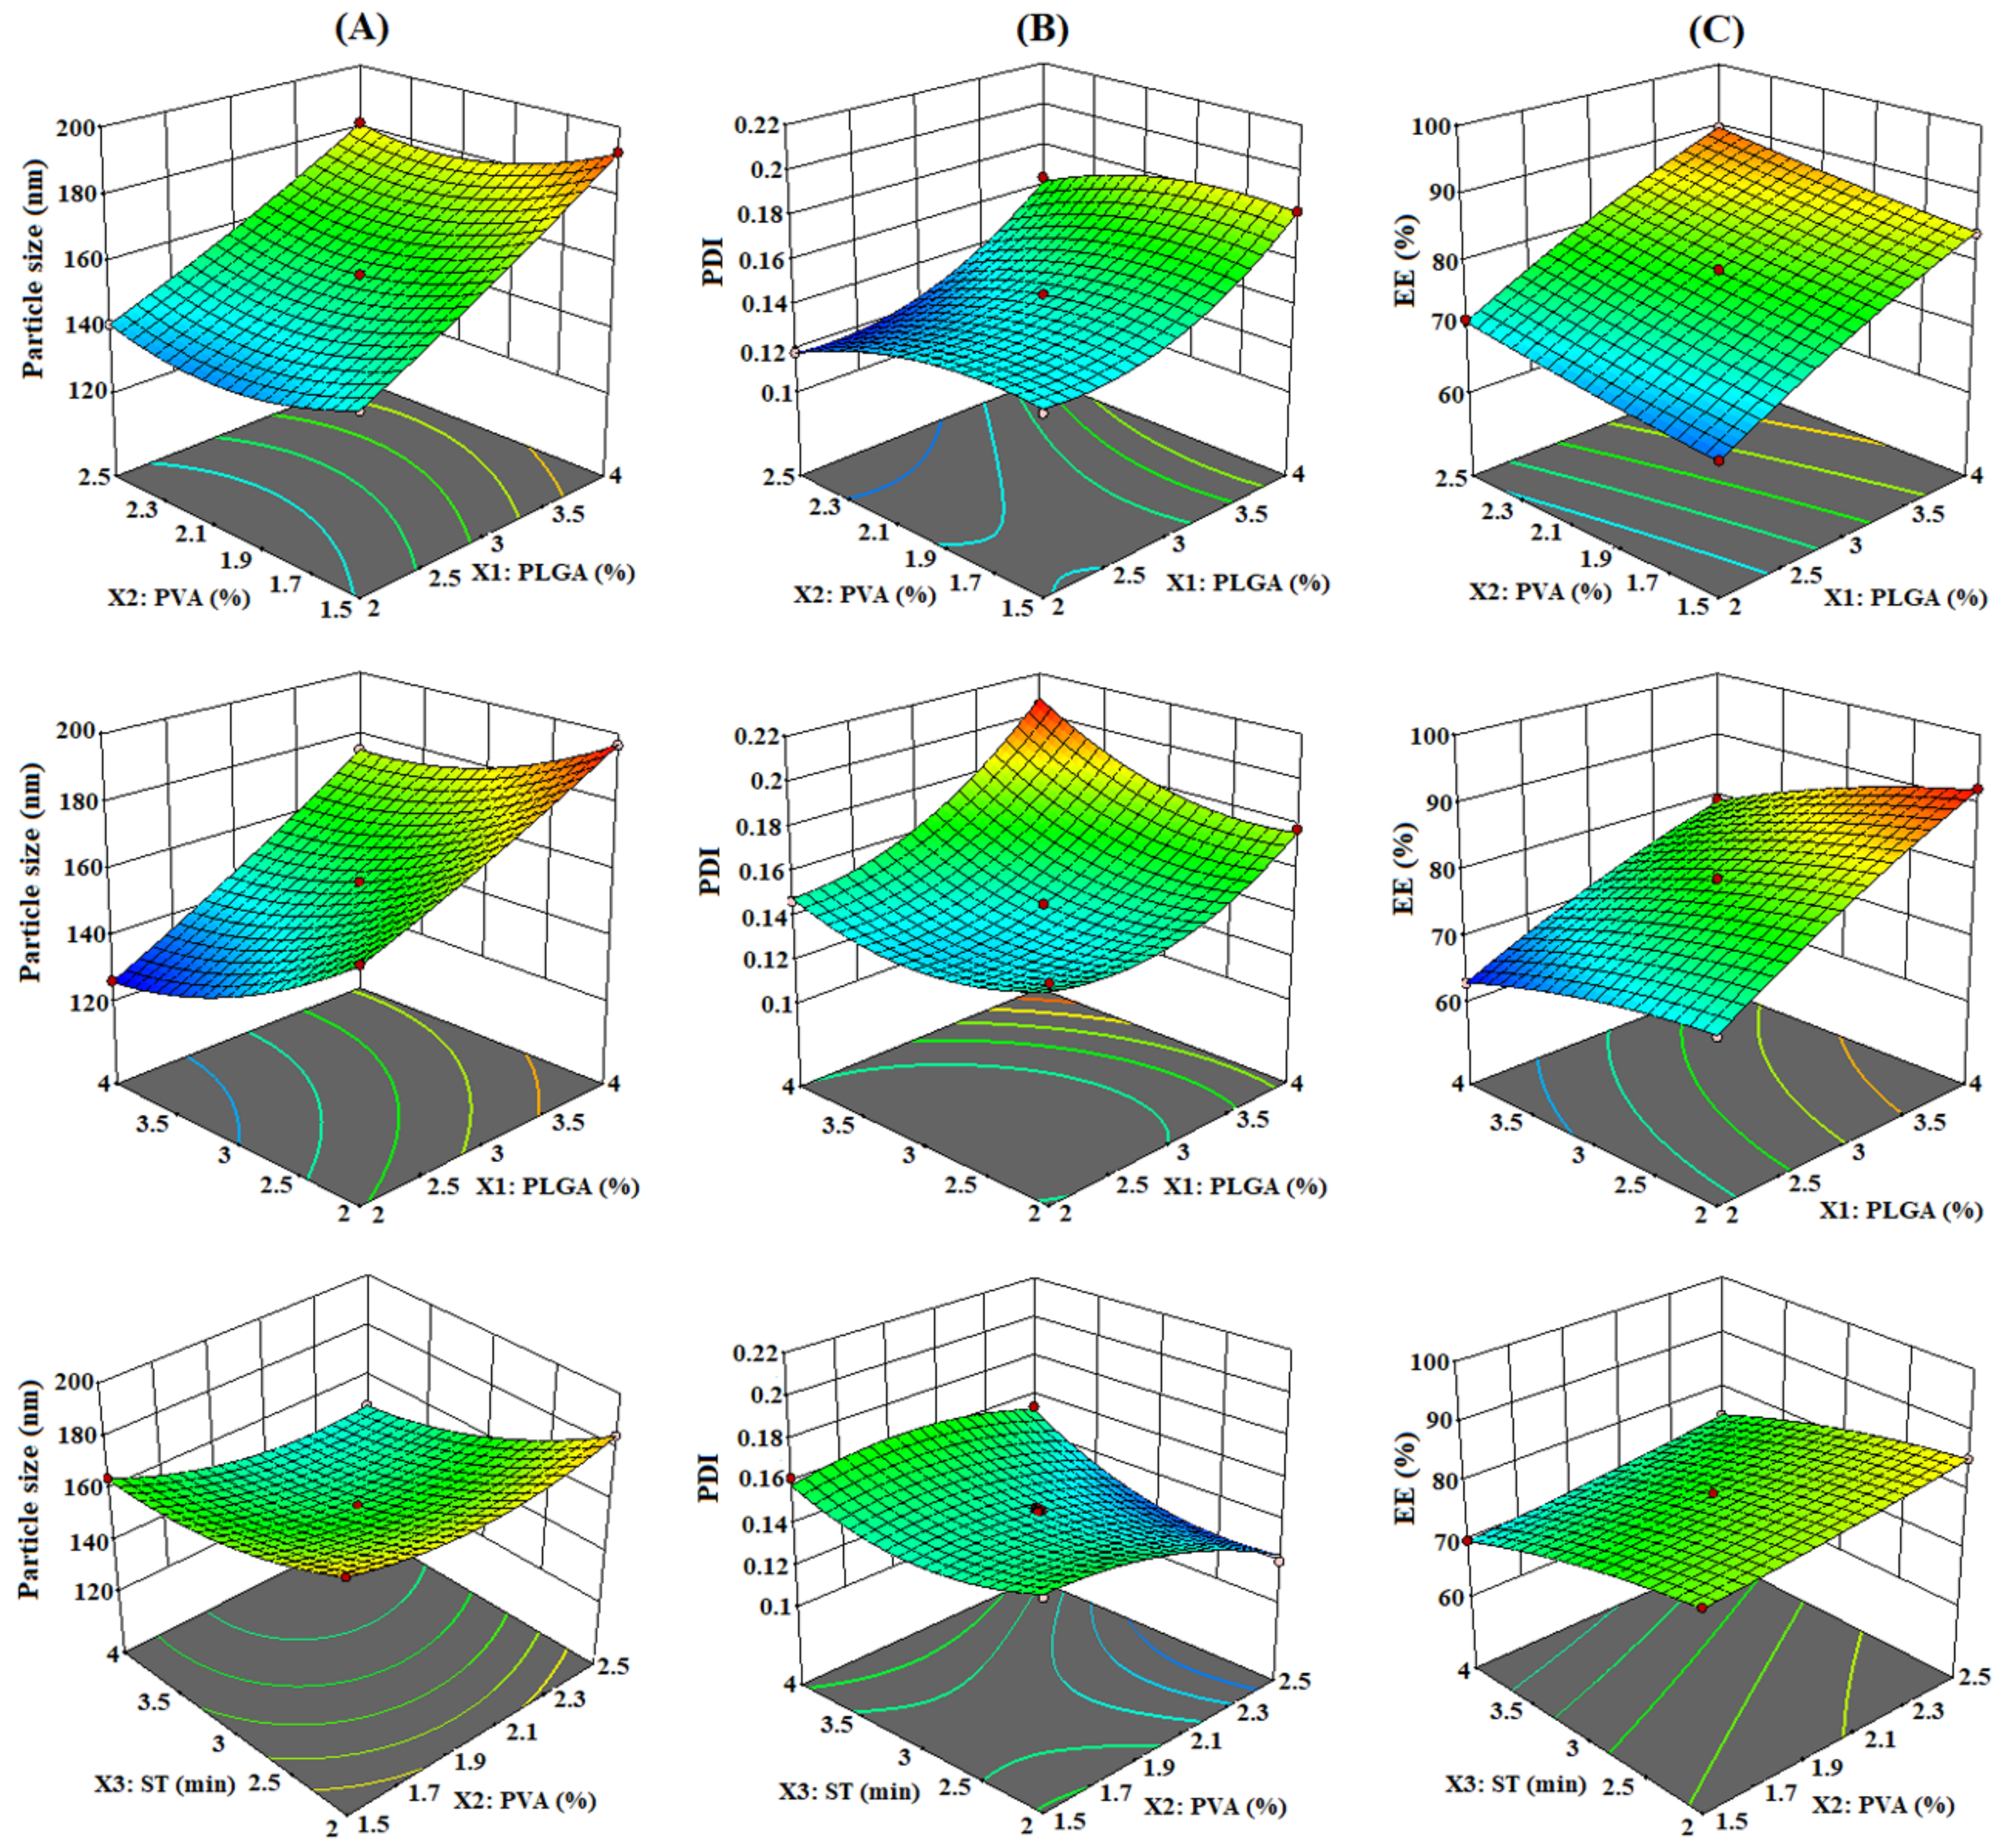
3.1.1. Effect of PLGA (X1), PVA (X2), and ST (X3) on PS (Y1)

The polynomial equation indicating the relationship between the factors on PS (Y1) is presented as follows:
Particle   size   Y 1 = + 158.38   +   21.42 X 1   4.09 X 2   14.12 X 3   1.54 X 1 X 2 +   3.21 X 1 X 3   4.25 X 2 X 3 +   1.50 X 1 2 +   7.37 X 2 2 +   6.60 X 3 2
The impact of all the three independent variables (X1, X2, and X3) has been illustrated in the 3D plot (Figure 1A) and contour plot (Figure 2A). As per the polynomial equation and Figure 1A and Figure 2A, a considerable impact of each independent variable on PS (Y1) can be observed. Gradual increment in the PS was observed with the increase in PLGA (X1) concentration. Higher polymer concentration increases the viscosity of the formulation, which leads to the enhancement of PS [32]. In addition, high viscosity decreases the diffusion of the drug from NPs, which is another factor for enhanced PS [33]. The variable PVA (X2) showed a strong negative impact on the PS. Increment in the concentration of PVA from 1.5% to 2.5% significantly (p < 0.05) decreased the PS. PVA is a surfactant and stabilizer that helps in the emulsification of polymer in the aqueous phase and prevents aggregation of NPs [34]. Another probable elucidation for such reduction in the PS might occur from ST (X3), which has a direct and strong negative impact on PS, which is an essential step for reduction in PS during the development of TQ-CS-PLGA-NPs [35].

3.1.2. Effect of PLGA (X1), PVA (X2), and ST (X3) on PDI (Y2)

The polynomial equation indicating the relationship between the factors on PDI (Y2) is presented as follows:
Polydispersity   index   Y 2 = + 0.145   +   0.0215 X 1   0.0104 X 2 +   0.0074 X 3 +   0.0005 X 1 X 2 +   0.0085 X 1 X 3 +   0.0073 X 2 X 3 +   0.0141 X 1 2   0.0086 X 2 2 +   0.0119 X 3 2
The impact of all the three independent variables (X1, X2, and X3) has been illustrated in the 3D plot (Figure 1B) and contour plot (Figure 2B). As per the polynomial equation and Figure 1B and Figure 2B, a considerable impact of each independent variable on PDI (Y2) was observed. As the concentration of PLGA (X1) increased, PDI also increased insignificantly. In other words, a very little positive impact was noticed with an increment in PLGA concentration. Moreover, PVA (X2) showed a strong negative impact on the PDI. The surfactants decreased the interfacial tension between the aqueous and organic phase and led to the development of uniform primary emulsion during the development of CS-PLGA-NPs [36]. The third variable, ST (X3), is further responsible for a significant increment in the PDI.

3.1.3. Effect of PLGA (X1), PVA (X2), and ST (X3) on EE (Y3)

The polynomial equation indicating the relationship between the factors on %EE (Y3) is presented as follows:
Entrapment   efficiency   Y 3 =   + 79.46   +   9.32 X 1 +   2.53 X 2   5.25 X 3 +   0.1 X 1 X 2   1.24 X 1 X 3 +   0.0925 X 2 X 3   1.13 X 1 2 +   0.3304 X 2 2   1.29 X 3 2
The impact of all the three independent variables (X1, X2, and X3) has been illustrated in the 3D plot (Figure 1C) and contour plot (Figure 2C). As per the polynomial equation and Figure 1C and Figure 2C, a considerable impact of each independent variable on PDI (Y2) was observed. Gradual increment in the %EE was observed with the increase in PLGA (X1) concentration. The impact of a polymer depended on the miscibility of the drug in the organic phase as well as the polymer–drug interaction. Furthermore, the maximum solubility of drugs in the polymer solution is due to its better emulsification properties [20,36]. Similarly, an increment in the PVA (X2) concentration gradually improved the %EE. The concentration of PVA concentration led to an increase in the tendency of the drug to become entrapped in the polymeric matrix, which resulted in improved %EE [37,38]. Furthermore, an increase in ST (X3) decreased %EE significantly due to the reduction in PS.

3.1.4. Optimization by Point Prediction

The optimized TQ-CS-PLGA-NPs were selected on the criteria of small PS, PDI, and high EE among 15 compositions, upon “trading off” different responses (Y1, Y2, and Y3) using the numerical desirability function. As per our criteria of low particle size, PDI, and high encapsulation efficiency, the selected optimized formulation has shown a desirability value closer to one and this indicates that the method is strong (Table 3). The ideal desirability range exists between 0 and 1. A value closer to zero means the method is not strong and a value closer to one means the method is strong [39]. Minimization of the particle is desired for the delivery systems because of the higher surface area available for dissolution and drug absorption. There are many pieces of literature that have reported a significant increase in solubility and dissolution with reduced particle size. According to the Noyes–Whitney equation, the reduction in particle size leads to a significant increase in the dissolution rate of the drug, which in turn can lead to substantial increases in the bioavailability [40]. The optimized formulation composition (TQ-CS-PLGA-NPs) prepared with PLGA (X1; 3%), PVA (X2; 2%), and ST (X3; 3 min) exhibited the particle size of 152.36 ± 5.74 nm, PDI of 0.133 ± 0.014, and EE of 77.56% ± 5.48%, respectively. It was further used for in vitro characterization and cell line study. The software examined an analysis of variance (ANOVA) for all three responses (Y1, Y2, and Y3), and the obtained data indicated that the quadratic model was well fitted (Table 3). Figure 3 represents the quantitative comparison of the responses of the experimental values with the predicted values.

3.2. Characterization

3.2.1. Particle Characterization

The PS, PDI, and ZP of the optimized TQ-CS-PLGA-NPs were observed to be 152.36 ± 5.74 nm, 0.133 ± 0.014, and +12.24 ± 2.32 mV, respectively (Figure 4A,B), while uncoated TQ-PLGA-NPs showed the PS of 141.64 ± 6.56 nm, PDI of 0.142 ± 0.012, and ZP of –16.42 ± 3.21 mV, respectively. The small PS and PDI of NPs are two of the crucial properties for improved oral delivery. The low PDI indicates the remarkable homogeneity of NPs. An insignificant increase in PS was noticed while developing TQ-CS-PLGA-NPs due to the CS coating. Furthermore, the CS coating leads to positive ZP from the negative ZP because of the cationic nature of CS, which was used as a coating agent to provide cohesiveness to the NPs (Figure 4B). Coating of NPs with CS is a well-established technique to improve oral delivery of drugs [41]. TEM also confirmed that the PS of uncoated PLGA-NPs is found to be smaller than TQ-CS-PLGA-NPs (Figure 4C,D).

3.2.2. Entrapment Efficiency (%EE)

TQ-CS-PLGA-NPs showed significantly higher %EE compared to uncoated TQ-PLGA-NPs due to coating with CS. The optimized TQ-CS-PLGA-NPs and uncoated TQ-PLGA-NPs showed an encapsulation efficiency of 77.56% ± 5.48% and 70.78% ± 62%, respectively. An acceptable %EE is due to the typical polymeric matrix of NPs. Coating with CS forms a layer around the NPs and inhibits the diffusion of TQ from the CS-PLGA-NPs.

3.3. In Vitro Gastrointestinal Stability Study

The potential impact of SGF and SIF on the stability of TQ-CS-PLGA-NPs is depicted in Figure 5A,B. The results of the stability study of TQ-CS-PLGA-NPs in SIF demonstrated excellent stability with insignificant (p > 0.05) fluctuations in PS, PDI, and %EE (Figure 5A). However, slightly greater changes in PS, PDI, and %EE were observed in SGF after 12 h (Figure 5B). In CS-PLGA-NPs, TQ could be continuously released or accumulated in the intestine region of gastrointestinal tract, which might lead to an increase in epithelial permeability [42].

3.4. Colloidal Stability

After 3 months of storage at 4 °C, the visual clarity and phase separation of TQ-CS-PLGA-NPs did not change significantly. The PS, PDI, and EE of TQ-CS-PLGA-NPs are depicted in Figure 5C. The only insignificant increases in PS and PDI were increases from 152.36 ± 5.74 nm to 177.84 ± 10.96 nm and 0.133 ± 0.014 to 0.138 ± 0.029, respectively, while the %EE was still higher than 70% and was still in an acceptable range. These results indicate that the TQ-CS-PLGA-NPs are capable of maintaining good physical stability at 4 °C for 3 months.

3.5. TQ Release Study

The release profiles of TQ from different formulations are depicted in Figure 6A. Both of the NPs, i.e., TQ-CS-PLGA-NPs, as well as TQ-PLGA-NPs, revealed a biphasic release. Significantly rapid release in 4 h after that, a sustained TQ release up to 24 h were observed. The rapid TQ release in the initial 4 h could be because of the faster dissolution of TQ adsorbed on the NPs’ surface [43]. The sustained release after 4 h to 24 h was due to the TQ encapsulated in the inner core of the polymeric matrix, which was released slowly by slow diffusion. Furthermore, TQ-CS-PLGA-NPs showed a much-delayed TQ release in comparison with uncoated TQ-PLGA-NPs due to the coating of NPs with CS, possibly because of the protection of the drug from desorption and diffusion [44]. The release of TQ from the TQ suspension was found to be only 27.345% ± 5.56% after 24 h of study. This can be explained by the fact that TQ is a water-insoluble drug and its dissolution is limited due to poor solubility [26]. The nanoparticulate delivery systems have reported the enhanced solubility and dissolution of poorly soluble drugs [5]. The release study was performed in identical conditions and due to the poor solubility of TQ, its release was limited.
The mechanism of TQ release was analyzed by fitting the data into the different release kinetic models, and different graphical representations are depicted in Figure 6B. The Korsmeyer–Peppas model showed the highest correlation coefficient (R2 = 0.9605). Therefore, the Korsmeyer–Peppas kinetic model was considered as the best-fitted model to explain the kinetics of TQ release from CS-PLGA-NPs. Moreover, the exponent “n” of release mechanism from the Korsmeyer–Peppas kinetic model was calculated and the value was found 0.282, which demonstrates the Fickian diffusion mechanism from CS-PLGA-NPs.

3.6. Mucoadhesion Study

As expected, TQ-CS-PLGS-NPs revealed the highest mucoadhesive efficiency (62.58% ± 2.42%) compared to TQ-PLGA-NPs (18.74% ± 3.28%) and TQ suspension (12.64% ± 2.36%). The coating of NPs with CS provided a significantly higher binding efficiency to mucin because of the electrostatic interactions between the positive charged CS and negatively charged mucin. Furthermore, hydrogen bonding as well as hydrophobic interactions between CS and mucin are also responsible for improved binding efficiency [45]. The higher mucoadhesive nature of NPs also proved a long gastrointestinal residence time.

3.7. Antioxidant Activity

DPPH is utilized to assess the antioxidant potential of a variety of drugs and drug delivery systems [46]. The DPPH changes the color to violet when it reacts with proton donor groups. Figure 7 represents the comparative antioxidant activity of TQ-CS-PLGA-NPs, TQ-PLGA-NPs, and pure TQ. The antioxidant potential of all the samples is directly dependent upon the TQ concentration. As the concentration of TQ increases, the antioxidant potential of TQ-CS-PLGA-NPs, TQ-PLGA-NPs, and pure TQ also increases statistically. TQ-CS-PLGA-NPs showed a maximum activity of 96.24% ± 6.78%, while TQ-PLGA-NPs and pure TQ depicted 81.58% ± 5.78% and 69.26% ± 4.84%, respectively. As per the observation, TQ-CS-PLGA-NPs represented statistically (p < 0.05) elevated antioxidant activity in comparison to both uncoated TQ-PLGA-NPs and pure TQ. However, uncoated TQ-PLGA-NPs also showed excellent antioxidant activity compared to pure TQ. The higher antioxidant activity achieved by TQ-CS-PLGA-NPs and TQ-PLGA-NPs was due to the higher solubility of TQ in PLGA, CS, and TPGS present in the NPs.

3.8. Cell Viability Assay

The potential outcomes of the cytotoxicity study in MDA-MB-231 and MCF-7 cells are represented in Figure 8, which clearly demonstrates that TQ-CS-PLGA-NPs and TQ-PLGA-NPs showed statistically higher concentrations and time-dependent cytotoxicity compared to pure TQ at 24 h and 48 h of study. The IC50 value of TQ-CS-PLGA-NPs, TQ-PLGA-NPs, and pure TQ was found to be 4.36 µM, 5.42 µM, and 8.24 µM, respectively, after 24 h of treatment against MDA-MB-231 cells (Figure 8A). After 48 h of treatment, the IC50 value of TQ-CS-PLGA-NPs, TQ-PLGA-NPs, and pure TQ was found to be 3.12 µM, 4.26 µM, and 6.58 µM, respectively (Figure 8B). The IC50 value of the TQ-CS-PLGA-NPs, TQ-PLGA-NPs, and pure TQ was found to be 52.54 µM, 58.16 µM, and 63.78 µM, respectively, after 24 h of treatment in MCF-7 cells (Figure 8C). After 48 h of treatment, the IC50 value of TQ-CS-PLGA-NPs, TQ-PLGA-NPs, and pure TQ was found to be 47.72 µM, 49.94 µM, and 54.67 µM, respectively (Figure 8D). As per the MTT assay results, a much better result was found in TQ-CS-PLGA-NP-treated cells. This can be explained by the fact that the CS-PLGA-NPs revealed significantly higher delayed TQ release compared to TQ-PLGA-NPs, which produces an excellent cellular response [47]. Among the two cancerous cell lines used in the study, the obtained IC50 values indicated that TQ-CS-PLGA-NPs and TQ-PLGA-NPs were most potent towards both tested cell lines. Our results are corroborated by a previously published report [48].

3.9. Ex Vivo Intestinal Permeation Study

Figure 9A,B clearly reveal that a significantly higher quantity of TQ permeated and transported through the intestinal sac from optimized TQ-CS-PLGA-NPs and TQ-PLGA-NPs in comparison to TQ suspension. As per our findings, TQ-CS-PLGA-NPs exhibited about 1.92- and 3.15-fold higher P app compared to TQ-PLGA-NPs and TQ suspension. The reason for the enhancement in P app was due to the presence of TPGS in the NPs as an excipient, which is a potent P-glycoprotein efflux pump inhibitor that was present on the mucous membrane of GIT [49]. Furthermore, the mucoadhesive nature of TQ-CS-PLGA-NPs also led to the disruption and/or modulation of tightness in the tight junctions of the gastrointestinal mucosa. Due to the positive charge due to coating with CS, NPs interact with negatively charged gastrointestinal mucosa that leads to the opening of tight junctions. Therefore, a significantly higher quantity of drug permeated across the mucosa [26].

4. Conclusions

TQ-CS-PLGA-NPs were fabricated successfully for improved TQ delivery and efficacy against breast cancer cells. The PS and PDI of the developed TQ-CS-PLGA-NPs were satisfactory, and the %EE of TQ in the NPs was observed to be greater than 78%. The TQ-CS-PLGA-NPs showed excellent gastrointestinal as well as colloidal stability. The TEM micrograph showed a spherical shape with uniform particle distribution and smooth surface. The CS coating provided modulation in TQ release from the NPs and exhibited a sustained release profile up to 24 h. The TQ-CS-PLGA-NPs showed significantly higher antioxidant activity compared to TQ-PLGA-NPs and pure TQ. Furthermore, TQ-CS-PLGA-NPs exhibited much higher intestinal permeation compared to the uncoated TQ-PLGA-NPs and pure TQ suspension. Therefore, our developed TQ-CS-PLGA-NPs represents an excellent mucoadhesive nanoformulation to combat the challenges of TQ for improved delivery and in vitro efficacy against breast cancer.

Author Contributions

Conceptualization, S.S.I. and S.A.; methodology, S.S.I., K.U.F. and M.R.; software, M.R.; validation, S.S.I. and M.R.; formal analysis, W.M.; investigation, S.S.I. and S.A.; data curation, S.S.I., M.R. and K.U.F.; writing—original draft preparation, S.S.I. and M.R.; writing—review and editing, M.K., W.M. and M.M.A.R.; visualization, M.M.A.R. and S.A.; supervision, S.A. and M.M.A.R.; project administration, S.A. and S.S.I.; funding acquisition, S.A. All authors have read and agreed to the published version of the manuscript.

Funding

Deputyship for Research and Innovation, “Ministry of Education” in Saudi Arabia (project number IFKSURG-1438-013).

Data Availability Statement

Data is contained within the article.

Acknowledgments

The authors extend their appreciation to the Deputyship for Research and Innovation, “Ministry of Education” in Saudi Arabia for funding this research work through the project number IFKSURG-1438-013.

Conflicts of Interest

The authors declare no conflict of interest.

References

  1. Francies, F.Z.; Hull, R.; Khanyile, R.; Dlamini, Z. Breast cancer in low-middle income countries: Abnormality in splicing and lack of targeted treatment options. Am. J. Cancer Res. 2020, 10, 1568–1591. [Google Scholar] [PubMed]
  2. Rizwanullah, M.; Alam, M.; Harshita; Mir, S.R.; Rizvi, M.M.A.; Amin, S. Polymer-lipid hybrid nanoparticles: A next-generation nanocarrier for targeted treatment of solid tumors. Curr. Pharm. Des. 2020, 26, 1206–1215. [Google Scholar] [CrossRef] [PubMed]
  3. Elmowafy, M.; Samy, A.; Raslan, M.A.; Salama, A.; Said, R.A.; Abdelaziz, A.E.; El-Eraky, W.; El Awdan, S.; Viitala, T. Enhancement of bioavailability and pharmacodynamic effects of thymoquinone via nanostructured lipid carrier (NLC) formulation. AAPS PharmSciTech. 2016, 17, 663–672. [Google Scholar] [CrossRef] [PubMed]
  4. Khan, M.A.; Tania, M.; Fu, S.; Fu, J. Thymoquinone, as an anticancer molecule: From basic research to clinical investigation. Oncotarget 2017, 8, 51907–51919. [Google Scholar] [CrossRef] [PubMed] [Green Version]
  5. Ballout, F.; Habli, Z.; Rahal, O.N.; Fatfat, M.; Gali-Muhtasib, H. Thymoquinone-based nanotechnology for cancer therapy: Promises and challenges. Drug Discov. Today 2018, 23, 1089–1098. [Google Scholar] [CrossRef]
  6. Khan, F.A.; Rizwanullah, M.; Perwez, A.; Ahmad, M.Z.; Ahmad, J. Polymeric Nanomedicines in Treatment of Breast Cancer: Review of Contemporary Research. Front. Anti-Cancer Drug Discov. 2020, 11, 36–66. [Google Scholar]
  7. Danhier, F.; Ansorena, E.; Silva, J.M.; Coco, R.; Le Breton, A.; Préat, V. PLGA-based nanoparticles: An overview of biomedical applications. J. Control. Release 2012, 161, 505–522. [Google Scholar] [CrossRef]
  8. Rezvantalab, S.; Drude, N.I.; Moraveji, M.K.; Güvener, N.; Koons, E.K.; Shi, Y.; Lammers, T.; Kiessling, F. PLGA-Based Nanoparticles in Cancer Treatment. Front. Pharmacol. 2018, 9, 1260. [Google Scholar] [CrossRef] [Green Version]
  9. Kumar, G.; Shafiq, N.; Malhotra, S. Drug-loaded PLGA nanoparticles for oral administration: Fundamental issues and challenges ahead. Crit. Rev. Ther. Drug Carrier Syst. 2012, 29, 149–182. [Google Scholar] [CrossRef] [PubMed]
  10. Chen, H.; Xie, L.Q.; Qin, J.; Jia, Y.; Cai, X.; Nan, W.; Yang, W.; Lv, F.; Zhang, Q.Q. Surface modification of PLGA nanoparticles with biotinylated chitosan for the sustained in vitro release and the enhanced cytotoxicity of epirubicin. Colloids Surf. B Biointerfaces 2016, 138, 1–9. [Google Scholar] [CrossRef] [PubMed]
  11. Zhang, X.; Sun, M.; Zheng, A.; Cao, D.; Bi, Y.; Sun, J. Preparation and characterization of insulin loaded bioadhesive PLGA nanoparticles for oral administration. Eur. J. Pharm. Sci. 2012, 45, 632–638. [Google Scholar] [CrossRef] [PubMed]
  12. Wang, Y.; Li, P.; Kong, L. Chitosan modified PLGA nanoparticles with versatile surface for improved drug delivery. AAPS PharmSciTech. 2013, 14, 585–592. [Google Scholar] [CrossRef] [PubMed] [Green Version]
  13. Alqahtani, S.; Simon, L.; Astete, C.E.; Alayoubi, A.; Sylvester, P.W.; Nazzal, S.; Shen, Y.; Xu, Z.; Kaddoumi, A.; Sabliov, C.M. Cellular uptake, antioxidant and antiproliferative activity of entrapped α-tocopherol and γ-tocotrienol in poly(lactic-co-glycolic) acid (PLGA) and chitosan covered PLGA nanoparticles(PLGA-Chi). J. Colloid. Interface Sci. 2015, 445, 243–251. [Google Scholar] [CrossRef] [PubMed]
  14. Lima, I.A.; Khalil, N.M.; Tominaga, T.T.; Lechanteur, A.; Sarmento, B.; Mainardes, R.M. Mucoadhesive chitosan-coated PLGA nanoparticles for oral delivery of ferulic acid. Artif. Cells Nanomed. Biotechnol. 2018, 46, 993–1002. [Google Scholar] [CrossRef] [Green Version]
  15. Chuah, L.H.; Billa, N.; Roberts, C.J.; Burley, J.C.; Manickam, S. Curcumincontaining chitosan nanoparticles as a potential mucoadhesive delivery system to the colon. Pharm. Dev. Technol. 2013, 18, 591–599. [Google Scholar] [CrossRef]
  16. Gilani, S.J.; Imam, S.S.; Ahmed, A.; Chauhan, S.; Mirza, M.A.; Taleuzzaman, M. Formulation and evaluation of thymoquinone niosomes: Application of developed and validated RP-HPLC method in delivery system. Drug Dev. Ind. Pharm. 2019, 4, 1799–1806. [Google Scholar] [CrossRef]
  17. Rizwanullah, M.; Amin, S.; Ahmad, J. Improved pharmacokinetics and antihyperlipidemic efficacy of rosuvastatin-loaded nanostructured lipid carriers. J. Drug Target. 2017, 25, 58–74. [Google Scholar] [CrossRef]
  18. Khatoon, K.; Rizwanullah, M.; Amin, S.; Mir, S.R.; Akhter, S. Cilnidipine loaded transfersomes for transdermal application: Formulation optimization, in-vitro and in-vivo study. J. Drug Deliv. Sci. Tech. 2019, 54, 101303. [Google Scholar] [CrossRef]
  19. Abd El Hady, W.E.; Mohamed, E.A.; Soliman, O.A.; El-Sabbagh, H.M. In vitro–in vivo evaluation of chitosan-PLGA nanoparticles for potentiated gastric retention and anti-ulcer activity of diosmin. Int. J. Nanomed. 2019, 14, 7191–7213. [Google Scholar] [CrossRef] [Green Version]
  20. Shahab, M.S.; Rizwanullah, M.; Alshehri, S.; Imam, S.S. Optimization to development of chitosan decorated polycaprolactone nanoparticles for improved ocular delivery of dorzolamide: In vitro, ex vivo and toxicity assessments. Int. J. Biol. Macromol. 2020, 163, 2392–2404. [Google Scholar] [CrossRef]
  21. Saifi, Z.; Rizwanullah, M.; Mir, S.R.; Amin, S. Bilosomes nanocarriers for improved oral bioavailability of acyclovir: A complete characterization through in vitro, ex-vivo and in vivo assessment. J. Drug Deliv. Sci. Tech. 2020, 57, 101634. [Google Scholar] [CrossRef]
  22. Kaithwas, V.; Dora, C.P.; Kushwah, V.; Jain, S. Nanostructured lipid carriers of olmesartan medoxomil with enhanced oral bioavailability. Colloids Surf. B Biointerfaces 2017, 154, 10–20. [Google Scholar] [CrossRef] [PubMed]
  23. Dalmoro, A.; Bochicchio, S.; Nasibullin, S.F.; Bertoncin, P.; Lamberti, G.; Barba, A.A.; Moustafine, R.I. Polymer-lipid hybrid nanoparticles as enhanced indomethacin delivery systems. Eur. J. Pharm. Sci. 2018, 121, 16–28. [Google Scholar] [CrossRef] [PubMed]
  24. Soni, K.; Rizwanullah, M.; Kohli, K. Development and optimization of sulforaphane-loaded nanostructured lipid carriers by the Box-Behnken design for improved oral efficacy against cancer: In vitro, ex vivo and in vivo assessments. Artif. Cells Nanomed. Biotechnol. 2018, 46, 15–31. [Google Scholar] [CrossRef] [PubMed] [Green Version]
  25. Filipović-Grčić, J.; Škalko-Basnet, N.; Jalšienjak, I. Mucoadhesive chitosan-coated liposomes: Characteristics and stability. J. Microencapsul. 2001, 18, 3–12. [Google Scholar] [CrossRef] [PubMed]
  26. Fakhria, A.; Gilani, S.J.; Imam, S.S. Formulation of thymoquinone loaded chitosan nano vesicles: In-vitro evaluation and in-vivo anti-hyperlipidemic assessment. J. Drug Deliv. Sci. Technol. 2019, 50, 339–346. [Google Scholar] [CrossRef]
  27. Imam, S.S.; Alshehri, S.; Alzahrani, T.A.; Hussain, A.; Altamimi, M.A. Formulation and Evaluation of Supramolecular Food-Grade Piperine HP β CD and TPGS Complex: Dissolution, Physicochemical Characterization, Molecular Docking, In Vitro Antioxidant Activity, and Antimicrobial Assessment. Molecules 2020, 25, 4716. [Google Scholar] [CrossRef]
  28. Khan, M.A.; Zafaryab, M.; Mehdi, S.H.; Quadri, J.; Rizvi, M.M. Characterization and carboplatin loaded chitosan nanoparticles for the chemotherapy against breast cancer in vitro studies. Int. J. Biol. Macromol. 2017, 97, 115–122. [Google Scholar] [CrossRef]
  29. Al-Joudi, F.S.; Alias, I.Z.; Samsudin, A.R. The effects of chemotherapeutic drugs on viabilty, apoptosis, and survivin expression in MCF-7 cells. Acta Histochem. Cytochem. 2005, 38, 323–330. [Google Scholar] [CrossRef] [Green Version]
  30. Jahangir, M.A.; Khan, R.; Imam, S.S. Formulation of sitagliptin-loaded oral polymeric nano scaffold: Process parameters evaluation and enhanced anti-diabetic performance. Artif. Cells Nanomed. Biotechnol. 2018, 46, 66–78. [Google Scholar] [CrossRef] [Green Version]
  31. Barkat, M.A.; Rizwanullah, M.; Beg, S.; Pottoo, F.H.; Siddiqui, S.; Ahmad, F.J. Paclitaxel-loaded nanolipidic carriers with improved oral bioavailability and anticancer activity against human liver carcinoma. AAPS PharmSciTech. 2019, 20, 87. [Google Scholar]
  32. Lepeltier, E.; Bourgaux, C.; Couvreur, P. Nanoprecipitation and the “Ouzo effect”: Application to drug delivery devices. Adv. Drug Deliv. Rev. 2014, 71, 86–97. [Google Scholar] [CrossRef] [PubMed]
  33. Tavares, M.R.; de Menezes, L.R.; Dutra Filho, J.C.; Cabral, L.M.; Tavares, M.I. Surface-coated polycaprolactone nanoparticles with pharmaceutical application: Structural and molecular mobility evaluation by TD-NMR. Polym. Test. 2017, 60, 39–48. [Google Scholar] [CrossRef]
  34. Zafar, A.; Khan, N.; Alruwaili, N.K.; Bukhari, S.N.; Alsuwayt, B.; Afzal, M.; Akhtar, S.; Yasir, M.; Elmowafy, M.; Shalaby, K.; et al. Improvement of Ocular Efficacy of Levofloxacin by Bioadhesive Chitosan Coated PLGA Nanoparticles: Box-behnken Design, In-vitro Characterization, Antibacterial Evaluation and Scintigraphy Study. Iran. J. Pharm. Res. 2020, 19, 292–311. [Google Scholar]
  35. Mishra, A.; Imam, S.S.; Aqil, M.; Ahad, A.; Sultana, Y.; Ameeduzzafar; Ali, A. Carvedilolnano lipid carriers: Formulation, characterization and in-vivo evaluation. Drug Deliv. 2016, 23, 1486–1494. [Google Scholar] [CrossRef] [Green Version]
  36. Khan, N.; Khanna, K.; Bhatnagar, A.; Ahmad, F.J.; Ali, A. Chitosan coated PLGA nanoparticles amplify the ocular hypotensive effect of forskolin: Statistical design, characterization and in vivo studies. Int. J. Biol. Macromol. 2018, 116, 648–663. [Google Scholar] [CrossRef] [PubMed]
  37. Sharma, N.; Madan, P.; Lin, S. Effect of process and formulation variables on the preparation of parenteral paclitaxel-loaded biodegradable polymeric nanoparticles: A cosurfactant study. Asian J. Pharm. Sci. 2016, 11, 404–416. [Google Scholar] [CrossRef] [Green Version]
  38. Sathyamoorthy, N.; Magharla, D.; Chintamaneni, P.; Vankayalu, S. Optimization of paclitaxel loaded poly (ε-caprolactone) nanoparticles using Box Behnken design. Beni-Suef Univ. J. Basic Appl. Sci. 2017, 6, 362–373. [Google Scholar] [CrossRef]
  39. Shah, M.; Pathak, K. Development and Statistical Optimization of Solid Lipid Nanoparticles of Simvastatin by Using 2(3) Full-Factorial Design. AAPS PharmSciTech. 2010, 11, 489–496. [Google Scholar] [CrossRef] [Green Version]
  40. Liu, D.; Pan, H.; He, F.; Wang, X.; Li, J.; Yang, X.; Pan, W. Effect of particle size on oral absorption of carvedilol nanosuspensions: In vitro and in vivo evaluation. Int. J. Nanomedicine 2015, 10, 6425–6434. [Google Scholar] [CrossRef] [Green Version]
  41. Lu, B.; Lv, X.; Le, Y. Chitosan-modified PLGA nanoparticles for control-released drug delivery. Polymers 2019, 11, 304. [Google Scholar] [CrossRef] [PubMed] [Green Version]
  42. Simoes, S.; Figueiras, A.; Veiga, F.; Concheiro, A.; Alvarez-Lorenzo, C. Polymeric micelles for oral drug administration enabling locoregional and systemic treatments. Expert Opin. Drug Deliv. 2014, 12, 297–318. [Google Scholar] [CrossRef] [PubMed]
  43. Anwer, M.K.; Mohammad, M.; Ezzeldin, E.; Fatima, F.; Alalaiwe, A.; Iqbal, M. Preparation of sustained release apremilast-loaded PLGAnanoparticles: In vitro characterization and in vivo pharmacokinetic study in rats. Int. J. Nanomed. 2019, 14, 1587–1595. [Google Scholar] [CrossRef] [PubMed] [Green Version]
  44. Kim, B.S.; Kim, C.S.; Lee, K.M. The intracellular uptake ability of chitosan-coated poly (d,l-lactideco-glycolide) nanoparticles. Arch. Pharm. Res. 2008, 31, 1050–1054. [Google Scholar] [CrossRef]
  45. Sogias, I.A.; Williams, A.C.; Khutoryanskiy, V.V. Why is chitosan mucoadhesive? Biomacromolecules 2008, 9, 1837–1842. [Google Scholar] [CrossRef]
  46. Zarai, Z.; Boujelbene, E.; Ben Salem, N.; Gargouri, Y.; Sayari, A. Antioxidant and antimicrobial activities of various solvent extracts, piperine and piperic acid from Piper nigrum. LWT Food Sci. Technol. 2013, 50, 634–641. [Google Scholar] [CrossRef]
  47. Chronopoulou, L.; Massimi, M.; Giardi, M.F.; Cametti, C.; Devirgiliis, L.C.; Dentini, M.; Palocci, C. Chitosan coated PLGA nanoparticles: A sustained drug release strategy for cell cultures. Colloids Surf. B Biointerfaces 2013, 103, 310–317. [Google Scholar] [CrossRef]
  48. Ng, W.K.; Yazan, L.S.; Yap, L.H.; Wan Nor Hafiza, W.A.G.; How, C.W.; Abdullah, R. Thymoquinone-loaded nanostructured lipid carrier exhibited cytotoxicity towards breast cancer cell lines (MDA-MB-231 and MCF-7) and cervical cancer cell lines (HeLa and SiHa). Biomed. Res. Int. 2015, 2015, 263131. [Google Scholar] [CrossRef] [Green Version]
  49. Ahmad, J.; Mir, S.R.; Kohli, K.; Chuttani, K.; Mishra, A.K.; Panda, A.K.; Amin, S. Solid-nanoemulsion preconcentrate for oral delivery of paclitaxel: Formulation design, biodistribution, and γ-scintigraphy imaging. Biomed. Res. Int. 2014, 2014, 984756. [Google Scholar] [CrossRef] [Green Version]
Figure 1. Response surface plots showing the influence of PLGA (X1), PVA (X2), and ST (X3) on response parameters: (A) PS (Y1), (B) PDI (Y2), and (C). EE (Y3) of TQ-CS-PLGA-NPs.
Coatings 11 00006 g001
Figure 2. Contour response surface plots showing the influence of PLGA (X1), PVA (X2), and ST (X3) on response parameters: (A) PS (Y1), (B) PDI (Y2), and (C) EE (Y3) of TQ-CS-PLGA-NPs.
Coatings 11 00006 g002
Figure 3. Actual and predicted graph showing linear correlation (A) PS, (B) PDI, (C) EE.
Coatings 11 00006 g003
Figure 4. (A,B). Image showing (A) particle size and particle size distribution, (B) zeta potential of optimized TQ-CS-PLGA-NPs and TQ-PLGA-NPs. (C,D). TEM analysis of (C) optimized TQ-PLGA-NPs, and (D) TQ-CS-PLGA-NPs.
Coatings 11 00006 g004
Figure 5. (AC). Bar graphs showing (A) in vitro gastrointestinal stability study of TQ-CS-PLGA-NPs in SGF, (B) SIF, (C) colloidal stability of TQ-CS-PLGA-NPs. Results are expressed as percentage mean ± SD (n = 3).
Coatings 11 00006 g005
Figure 6. (A) Comparative in vitro release profiles of TQ-PLGA-NPs and TQ-CS-PLGA-NPs. Results are expressed as percentage mean ± SD (n = 3). (B) In vitro release kinetics model to evaluate the mechanism of drug release from TQ-CS-PLGA-NPs.
Coatings 11 00006 g006
Figure 7. Comparative antioxidant activity of TQ-CS-PLGA-NPs, TQ-PLGA-NPs, and pure thymoquinone (TQ). Results are expressed as percentage mean ± SD (n = 3). * and ** represent significant and highly significant difference to different groups.
Coatings 11 00006 g007
Figure 8. Comparative cytotoxicity study of TQ-Cs-PLGA-NPs, TQ-PLGA-NPs, and pure TQ against (A) MDA-MB-231 cells after 24 h; (B) MDA-MB-231 cells after 48 h; (C) MCF-7 cells after 24 h; (D) MCF-7 cells after 48 h. Results are expressed as percentage mean ± SD (n = 3), * and ** represent significant and highly significant difference to different groups.
Coatings 11 00006 g008
Figure 9. Ex vivo intestinal permeation study result showing: (A) cumulative amount of drug permeated (μg) vs. time, (B) cumulative drug transported (μg cm−2) vs. time.
Coatings 11 00006 g009
Table 1. Various independent and dependent variables used in the Box–Behnken design for the preparation of TQ-CS-PLGA-NPs.
Independent VariablesLevels UsedDependent Variables
LowMediumHigh
X1 = PLGA concentration (%)234Y1 = Particle size (nm)
X2 = PVA concentration (%)1.522.5Y2 = Polydispersity index
X3 = Sonication time (min)234Y3 = Entrapment efficiency (%)
Table 2. Observed Box–Behnken experimental runs of TQ-CS-PLGA-NPs with their actual and predicted experimental values of Y1, Y2, and Y3.
RunsIndependent VariablesDependent Variables
X1X2X3Y1Y2Y3
ActualPredictedActualPredictedActualPredicted
F1422196.71196.910.1780.17692.1792.03
F2323156.94156.480.1390.14578.2378.64
F3424174.84175.10.2050.20879.3479.05
F441.53192.59192.40.1820.18184.2184.54
F532.52184.65184.720.120.12385.3285.36
F6323153.46156.480.1360.14578.8478.64
F742.53181.42181.150.1640.16289.6989.79
F831.52184.42184.410.1570.15880.6880.49
F9224126.03125.830.1470.14862.7562.89
F1031.54164.74164.670.1620.15869.8569.81
F1132.54147.98147.990.1540.15274.8675.05
F1222.53141.19141.380.1180.11871.2770.94
F1321.53146.21146.480.1380.13966.1966.09
F14323157.42156.480.1480.14578.8478.64
F15222160.74160.480.1540.1570.6270.91
X1 = concentration of poly(d,l-lactide-co-glycolide) (PLGA) (%); X2 = concentration of PVA (%); X3 = sonication time (min); Y1 = particle size (nm); Y2 = polydispersity index; Y3 = entrapment efficiency (%).
Table 3. Summary of the regression analysis for responses Y1, Y2, and Y3 for fitting data to different models.
ModelR2Adjusted R2Predicted R2SDDesirability
Response (Y1) 0.987
Linear0.92150.90010.86666.47
2F10.94250.89930.83936.49
Quadratic0.99990.99980.99880.2965
Response (Y2)
Linear0.70020.61840.39380.01390.932
2F10.77030.59800.47240.0143
Quadratic0.99170.97670.86710.0034
Response (Y3) 0.973
Linear0.98170.97670.96491.28
2F10.98810.97910.95321.21
Quadratic0.99920.99780.99120.39
Y1 = particle size (nm); Y2 = polydispersity index; Y3 = entrapment efficiency (%); R2 = coefficient of correlation.
Publisher’s Note: MDPI stays neutral with regard to jurisdictional claims in published maps and institutional affiliations.

