Article

Anti-Reflection Coatings on 3D-Printed Components

1
Interdisciplinary Photonics Laboratories, Faculty of Engineering and Information Technology, University of Technology Sydney, Sydney, NSW 2007, Australia
2
School of Chemistry, University of Sydney, Sydney, NSW 2006, Australia
3
Helia Photonics Ltd., Livingston EH54 7EJ, UK
4
Protospace, Faculty of Engineering and Information Technology, University of Technology Sydney, Sydney, NSW 2007, Australia
5
Mechanical and Mechatronic Engineering Laboratories, Faculty of Engineering and Information Technology, University of Technology Sydney, Sydney, NSW 2007, Australia
*
Author to whom correspondence should be addressed.
Coatings 2021, 11(12), 1519; https://doi.org/10.3390/coatings11121519
Submission received: 11 November 2021 / Revised: 1 December 2021 / Accepted: 1 December 2021 / Published: 10 December 2021
(This article belongs to the Topic Inorganic Thin Film Materials)

Abstract

:
The use of anti-reflection coatings on 3D-printed components to reduce both Fresnel reflections and scattering is explored. Two similar photo-initiated acrylic commercial material structures, known as Standard Clear (SC: T~60% @ λ = 800 nm) and VeroClear (VC: T~90% @ λ = 800 nm), used specifically for optical components, are examined. The refractive indices for slab samples~(5 × 5 × 0.7) cm are measured at λ = 650 nm and averaged over the slab area: n(SC)~(1.49 ± 0.04) and n(VC)~(1.42 ± 0.03). Within experimental error, novel Shore D mapping is used to show hardness distribution across the surface flats, with VC slightly harder than SC, where VC = 85.9 ± 0.3 and SC = 84.4 ± 1.3, indicating uniform hardness. A TiO2/MgF2 anti-reflection twin-layer coating is deposited onto one side of an unpolished SC slab and binds well, passing standard peeling and humidity tests. Shore hardness increases to SCCOATED = 87.5 ± 1.5. It is found to reduce the measured Fresnel reflection and surface scatter by~65% without requiring major polishing, paving the way for lower-cost high-quality optics. The demonstration of successful anti-reflection coatings will benefit all 3D-printed component finishes, permitting viable film deposition more broadly.

Graphical Abstract

1. Introduction

Three-dimensional printing of objects of varying shape for different purposes is widespread, spanning many material systems. These plastics and polymers are broadly accessible and even within specific end-use applications also have a broad commercial options. For example, optical components are increasingly widespread and include lenses [1,2], prisms [3,4], microfluidics [5,6], medical phantoms [7], light pipes [8,9,10] and splitters [11] and optical fibres [10,12,13,14]. A remarkable number of materials are being adapted for 3D printing, including high-temperature silica glass where additional post-sintering is necessary. However, plastic and plastic optics are of great interest for lightweight and low-cost applications. In optics, these may be lenses for smartphones, multimode filaments for computer links or optical components for drones. The method of additive manufacturing is equally diverse, spanning direct thermal melting and processing associated with fused deposition modelling (FDM) or fused filament fabrication (FFF) through selective laser-based sintering (SLS) to photo-initiated reactions involved with direct light projection (DLP). Amongst these, the latter offers high-resolution printing of higher-quality plastic optics which are of broader interest where portability and electromagnetic immunity is of concern. These applications require high-quality optics for imaging and laser projection often in the visible and near-IR. Unfortunately, for many of these applications, exhaustive post-processing such as polishing of the components is needed to reduce surface scattering by reducing roughness to nanometer scale [15]. An alternative approach is the use of lacquers to smooth over the roughness—the quality of effort here is suitable for aesthetic reasons but not much more. Neither method removes Fresnel reflections for filters and lenses, for example—these problems extend to all 3D-printed materials where, even for photopolymerized systems, surface finish is an issue. Here, we focus on optics to demonstrate the value of anti-reflection coatings in reducing Fresnel reflections and surface roughness scattering and show that this is sufficiently effective for relaxing the standard post-processing in SLA-based 3D printing used to smoothen surface finishes. Two commercially available products for optical-based 3D printing are considered. Good surface finishes continue to be a challenge impacting additive manufacturing’s competitiveness against other manufacturing approaches such as injection molding.

2. Materials, Methods and Results

2.1. Standard Clear and VeroClear Materials

Additive manufacturing (AM), or 3D printing, differs from conventional manufacturing in a number of ways, including the distribution of properties from an often translational approach (1- or 2D typically) to printing as well as a need to balance processing conditions to ensure reproducible production parameters. This flexibility gives rise to another trait: variable fabrication conditions that generate variable properties. For example, readily accessible commercial 3D printing resins suitable for printing clear components are Formlabs Standard Clear (SC–RGD720) and Stratasys VeroClear (VC–RGD810) [16]. Both have similar photosensitive agents to enable polymerization in the near-UV region and, when polymerized, are likely chemically similar to polymethylmethacrylate (PMMA), traditionally used in plastic optics such as optical fibres [17]. Whilst the material compositions are proprietary, the latter is likely to be fluorinated to increase transparency and reduce oxidation. Depending on the processing conditions, properties such as hardness and refractive index can vary between and across samples.
Figure 1 shows typical SC and VC slab samples. The SC sample was printed using a Form 2 SLA priner (galvanometer guided laser λ = 405 nm, P = 250 mW and z res~25 μm, Formlabs, Somerville, MA, USA), cleaned in isopropyl alcohol for 10 min before fully curing under a UV LED lamp (λ = 405 nm). The sample shows signs of oxidation (yellowing or browning), something that gives rise to increased attenuation. This can be reduced or eliminated in an inert atmosphere or through fluorination.
The VC samples were printed by the PolyJet printer (J750, Stratys, Eden Prairie, MN, USA), where a layer of photopolymer was sprayed onto a surface using an array of printhead nozzles, enabling high-resolution layers (16 μm) to be optically flash-cured by a UV LED lamp (proprietary, but VeroClear absorbs both ~λ = 380 and 405 nm [18], Stratys, Eden Prairie, MN, USA) as the material came out in a desired pattern. Thus, it differs substantially in approach but otherwise a similar photopolymerisation mechanism is involved.
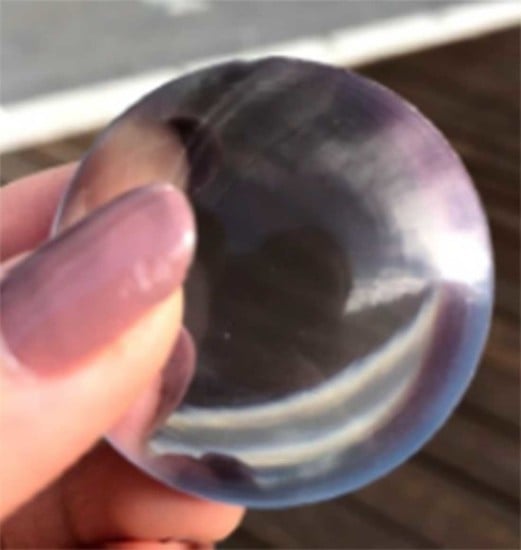
Polishing is found to be more onerous for the SC samples than the VC and this translates to the quality of optics. A high-quality convex lens made with VC is also shown in Figure 1e—it does not suffer the same degree of scattering observed with SC after polishing, but this required some effort and remains suboptimal.

2.2. Transmission Spectra

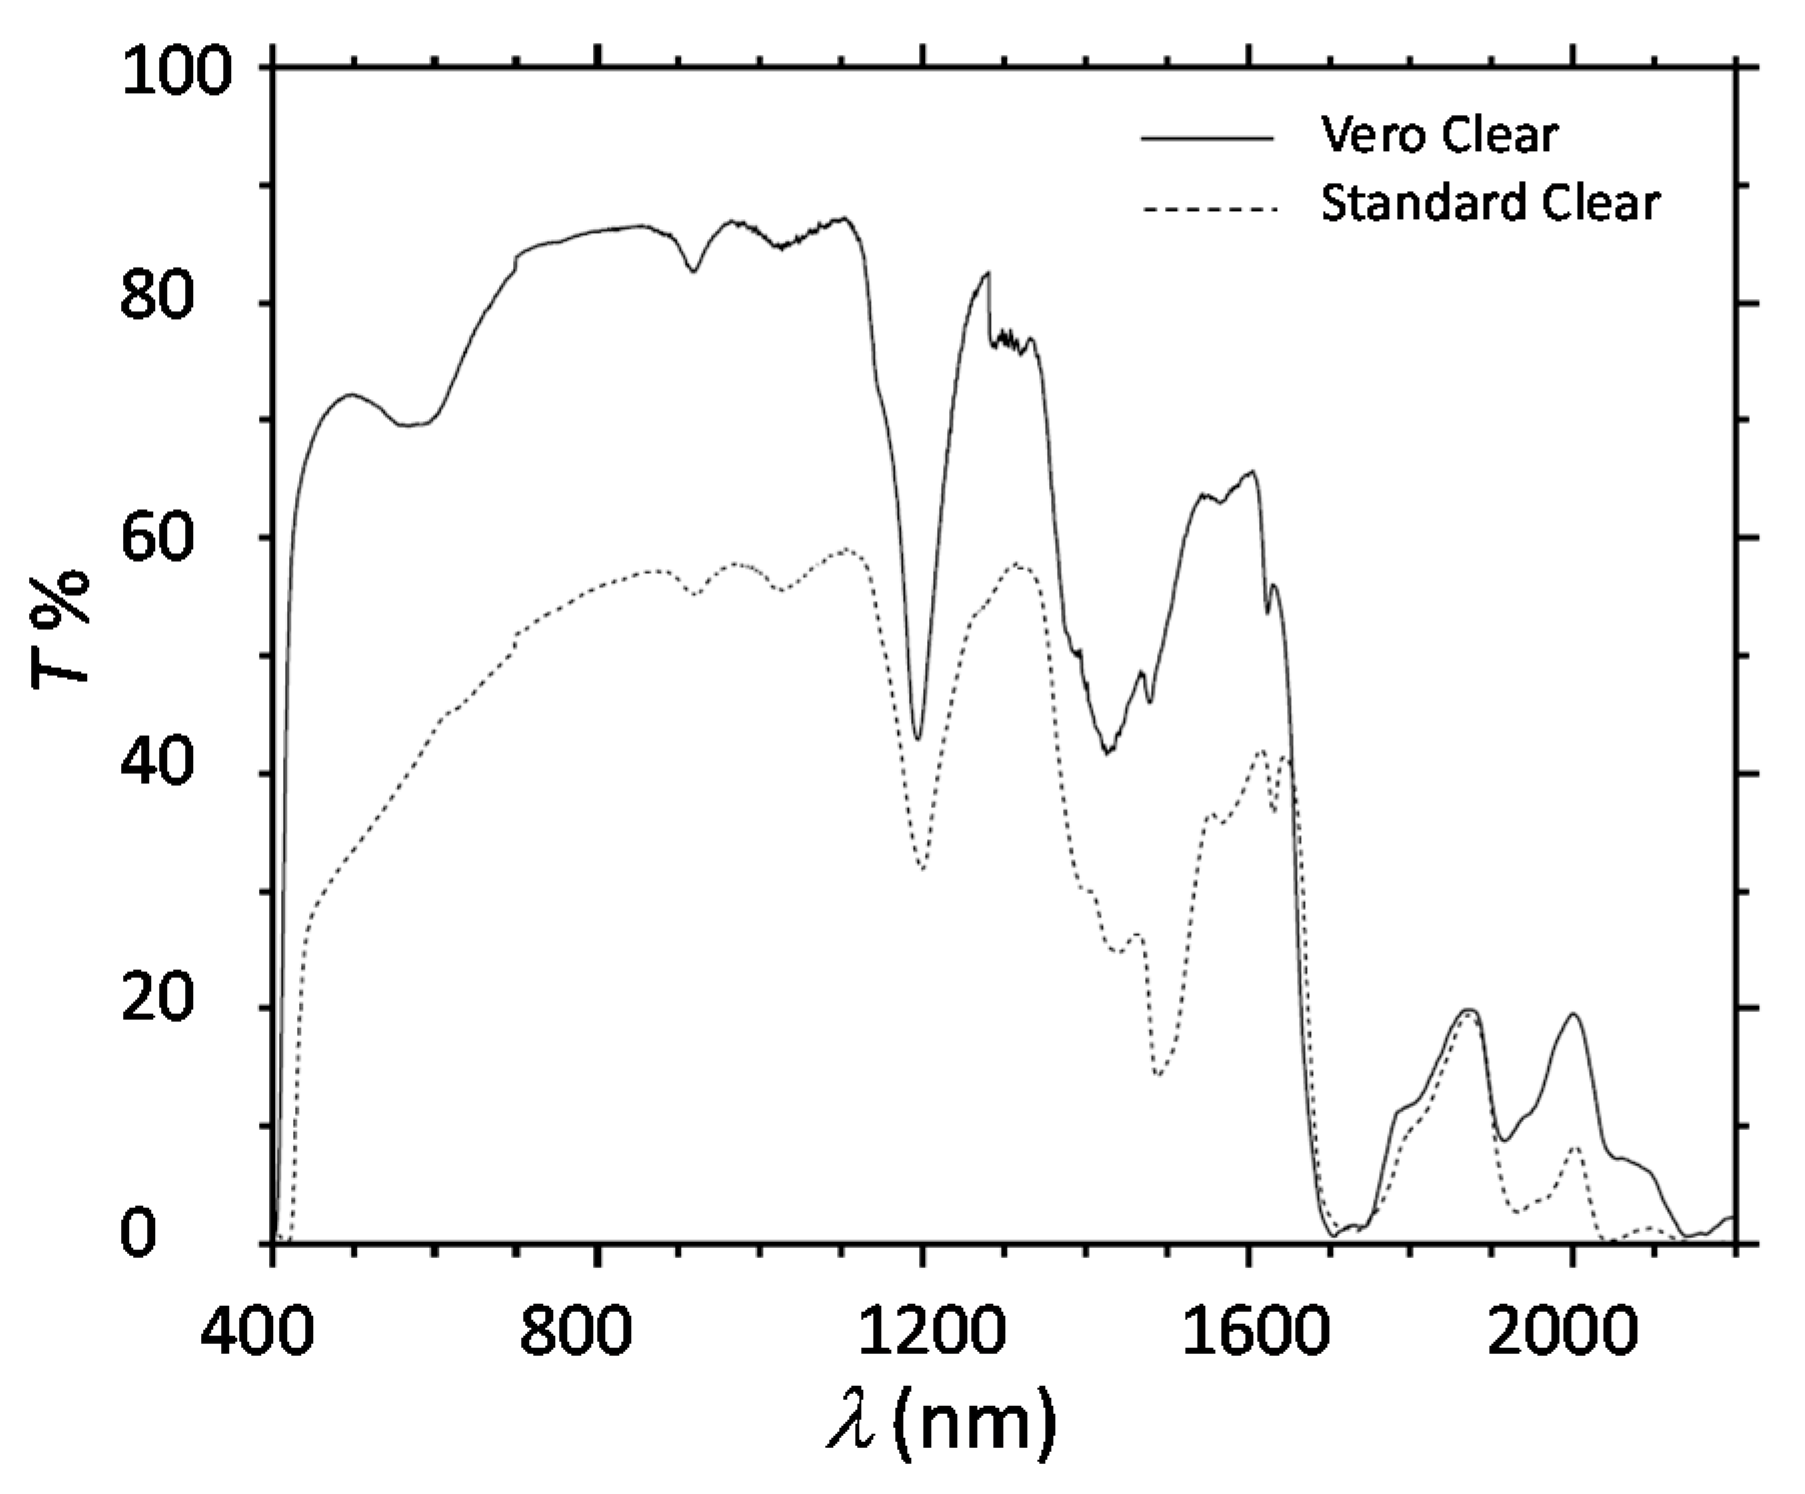
Figure 2 shows the measured transmission of these materials. The near-IR performance λ~800 nm is approaching a transmittance T = 85%–90% for VC and the UV band-edge is shifted to shorter wavelengths. The background drop arises from Fresnel reflections and scattering, higher for SC, in addition to the internal absorption at near-IR bands. Further, the shorter wavelength in the VC where C–H overtones would be expected is most noticeable at λ~1500 nm, suggesting an added improvement in transmission at this telecom-relevant window. These shifts are consistent with fluorination where the C–H bonds are replaced with C–F bonds in the VC. The new dip seen at λ~570 nm arises from interference as light reflected from the back surface increases. Other than these, the profiles appear identical between SC and VC, suggesting similar acrylate systems.

2.3. Refractive Index

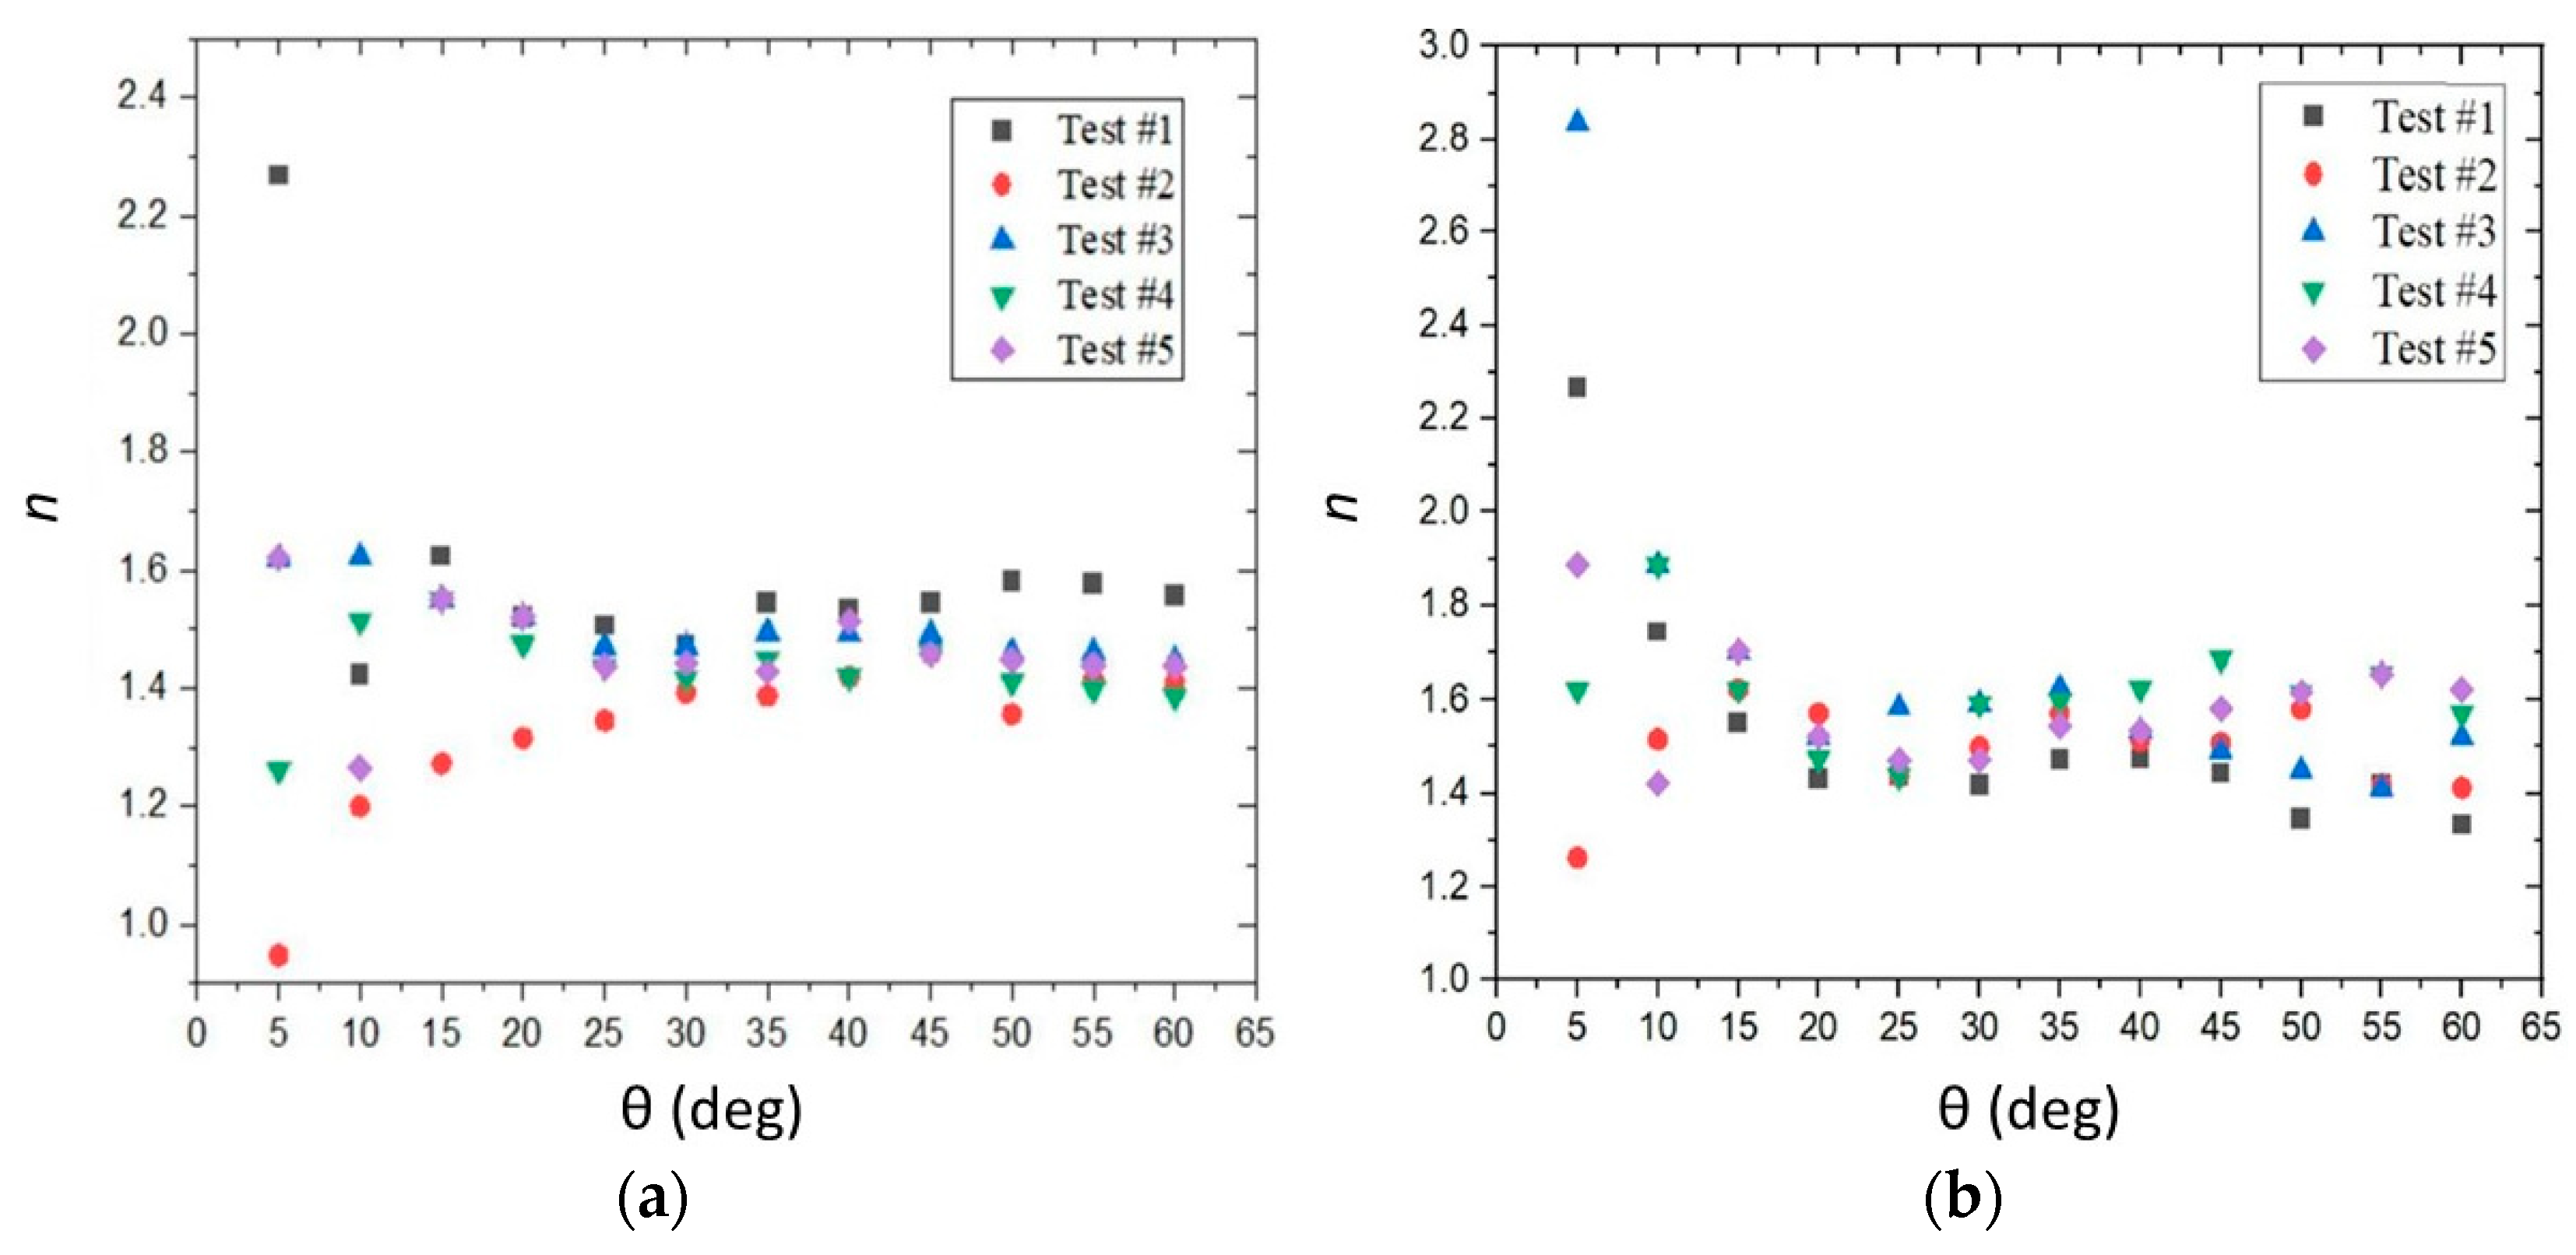
Unfortunately, as for many proprietary materials, suppliers will not provide chemical structures nor some key properties such as refractive indices. On the other hand, these properties can vary with processing conditions such as different local temperatures and different cooling rates. For example, there have been reports of the measured refractive index of VC ranging from n(VC) = 1.47 to 1.52 at λ = 650 nm [5,6], suggesting that either measurements vary or 3D printing processing conditions vary over a considerable span. The most common method is direct measurement of orthogonal reflections from a surface, but this often varies because of alignment reasons and small angular variations and requires significant care in the laboratory or within a calibrated spectrophotometer. To reduce the potential error, and noting we are dealing with optical materials, we have taken multiple measurements at different angles and used a parallel two-beam approach, taking the angular Fresnel reflections of a low-cost laser diode (λ = 650 nm) at different angles from both the front and back end of the surfaces (Figure 3a) and calculating the index from the spatial separation of the two beams so that they are less dependent on environmental variation. The refractive index is related to the angles through Snell’s law: n1sinθ1 = n2sinθ2, where θ = tan−1((d/2)/t), noting the notation in Figure 3b. Example data obtained are shown in Figure 4.
Under similar writing conditions, the refractive index, n, is calculated for each of the two samples used in this work at λ~650 nm, a diode wavelength, from Fresnel reflection measurements and found to be n(SC) = 1.49 ± 0.04 and n(VC) = 1.42 ± 0.03. It is notable that we observed significant variation in the refractive index between differing samples of printed VC ranging from 1.39 to 1.46, reflecting actual material variability during printing. This fabrication variability can also account for the large values reported in the literature. Our value for VC, lower than SC under the same conditions, is lower still suggesting a more rapid photopolymerisation. The reduced refractive index of VC supports the presence of fluorination and is consistent with the shift to shorter wavelengths seen in Figure 2. In addition to polymerisation rates, it is well-known that the index will decrease with increasing fluorine content because of fluorine’s large electronegativity [19]—the large drop we measure suggests the concentration [F] is in excess of 20 wt.%.

2.4. Hardness Maps

Paradoxically, the fluorinated polymers can often be denser—accordingly, we mapped Shore D over the samples for VC and SC, with the latter both uncoated and coated, taking the average with uniformity reflected in the size of error. A slightly higher hardness for VC than SC was obtained: D(VC) = 85.9 ± 0.2 and D(SC) = 84.4 ± 0.5, consistent with fluorination. However, this variation may fall within differences between printer approaches used: scanning with a laser versus flash curing with a UV lamp. Whilst more costly, thanks in part to its hardness, fluorinated polymers tend to have robust chemical inertness to acids, bases and solvents as well as high resistance to oxidation (no browning) and aging, making them attractive materials for optical components. Mapping the hardness shows both materials are relatively uniform (Figure 5), reflected in the error.
A mapping approach to various properties using point measurement methods is extremely useful for additive manufacturing—by comparison, classical four-point bending and breaking, for example, produces a single value that cannot be used to make such maps. Shore hardness is a simple example of a point measurement that is directly related to the elastic coefficients of a material and which can be measured at different locations. Maps show this distribution, a measure of homogeneity in the x,y plane of the material that can be extended to 3D profiling, on a surface and in this case have detected an outlier potentially arising from post-cutting of the sample. More broadly, given that a key advantage of additive manufacturing is the ability to tailor the profile of material along spatial dimensions (arbitrarily, if one wishes), mapping of mechanical and other properties becomes essential to capture and assess this. Whilst more costly, thanks in part to its hardness, fluorinated polymers tend to have robust chemical inertness to acids, bases and solvents as well as high resistance to oxidation (no browning) and aging, making them attractive materials for optical components.

2.5. Anti-Reflection Coatings

To reduce Fresnel reflections from the slab component interfaces, illustrated in Figure 6, anti-reflection coatings were considered. Ideally, they would have robust attachment to the surfaces. Here, we demonstrate the deposition of an anti-reflection coating on one side of a slab to assess how well these can perform.
For robust attachment, the rougher, unpolished SC sample was selected for a twin-layer deposition. A high-index TiO2 layer (n~2.418 @ λ~680 nm) was used, subsequently coated over with MgF2, creating a lower index layer (n~1.377 @ λ~680 nm). TiO2 creates an anti-reflection film that strongly absorbs UV light and is highly transparent to the visible and near-infrared light [20]. These properties make TiO2/MgF2 one of the most widely used anti-reflection coating materials to minimise significant loss of optical power. Given the high refractive index of TiO2, it was combined with low refractive index films such as MgF2. MgF2 layers offer a rugged, hard film that works well at shorter wavelengths [21] and adheres strongly to oxides such as TiO2. Generally, MgF2 is the most common single-layer anti-reflection coating used on high-index media. The thickness of the layers was adjusted to suppress reflections (t(TiO2) = 130 nm, t(MgF2) = 79 nm at λ~680 nm).
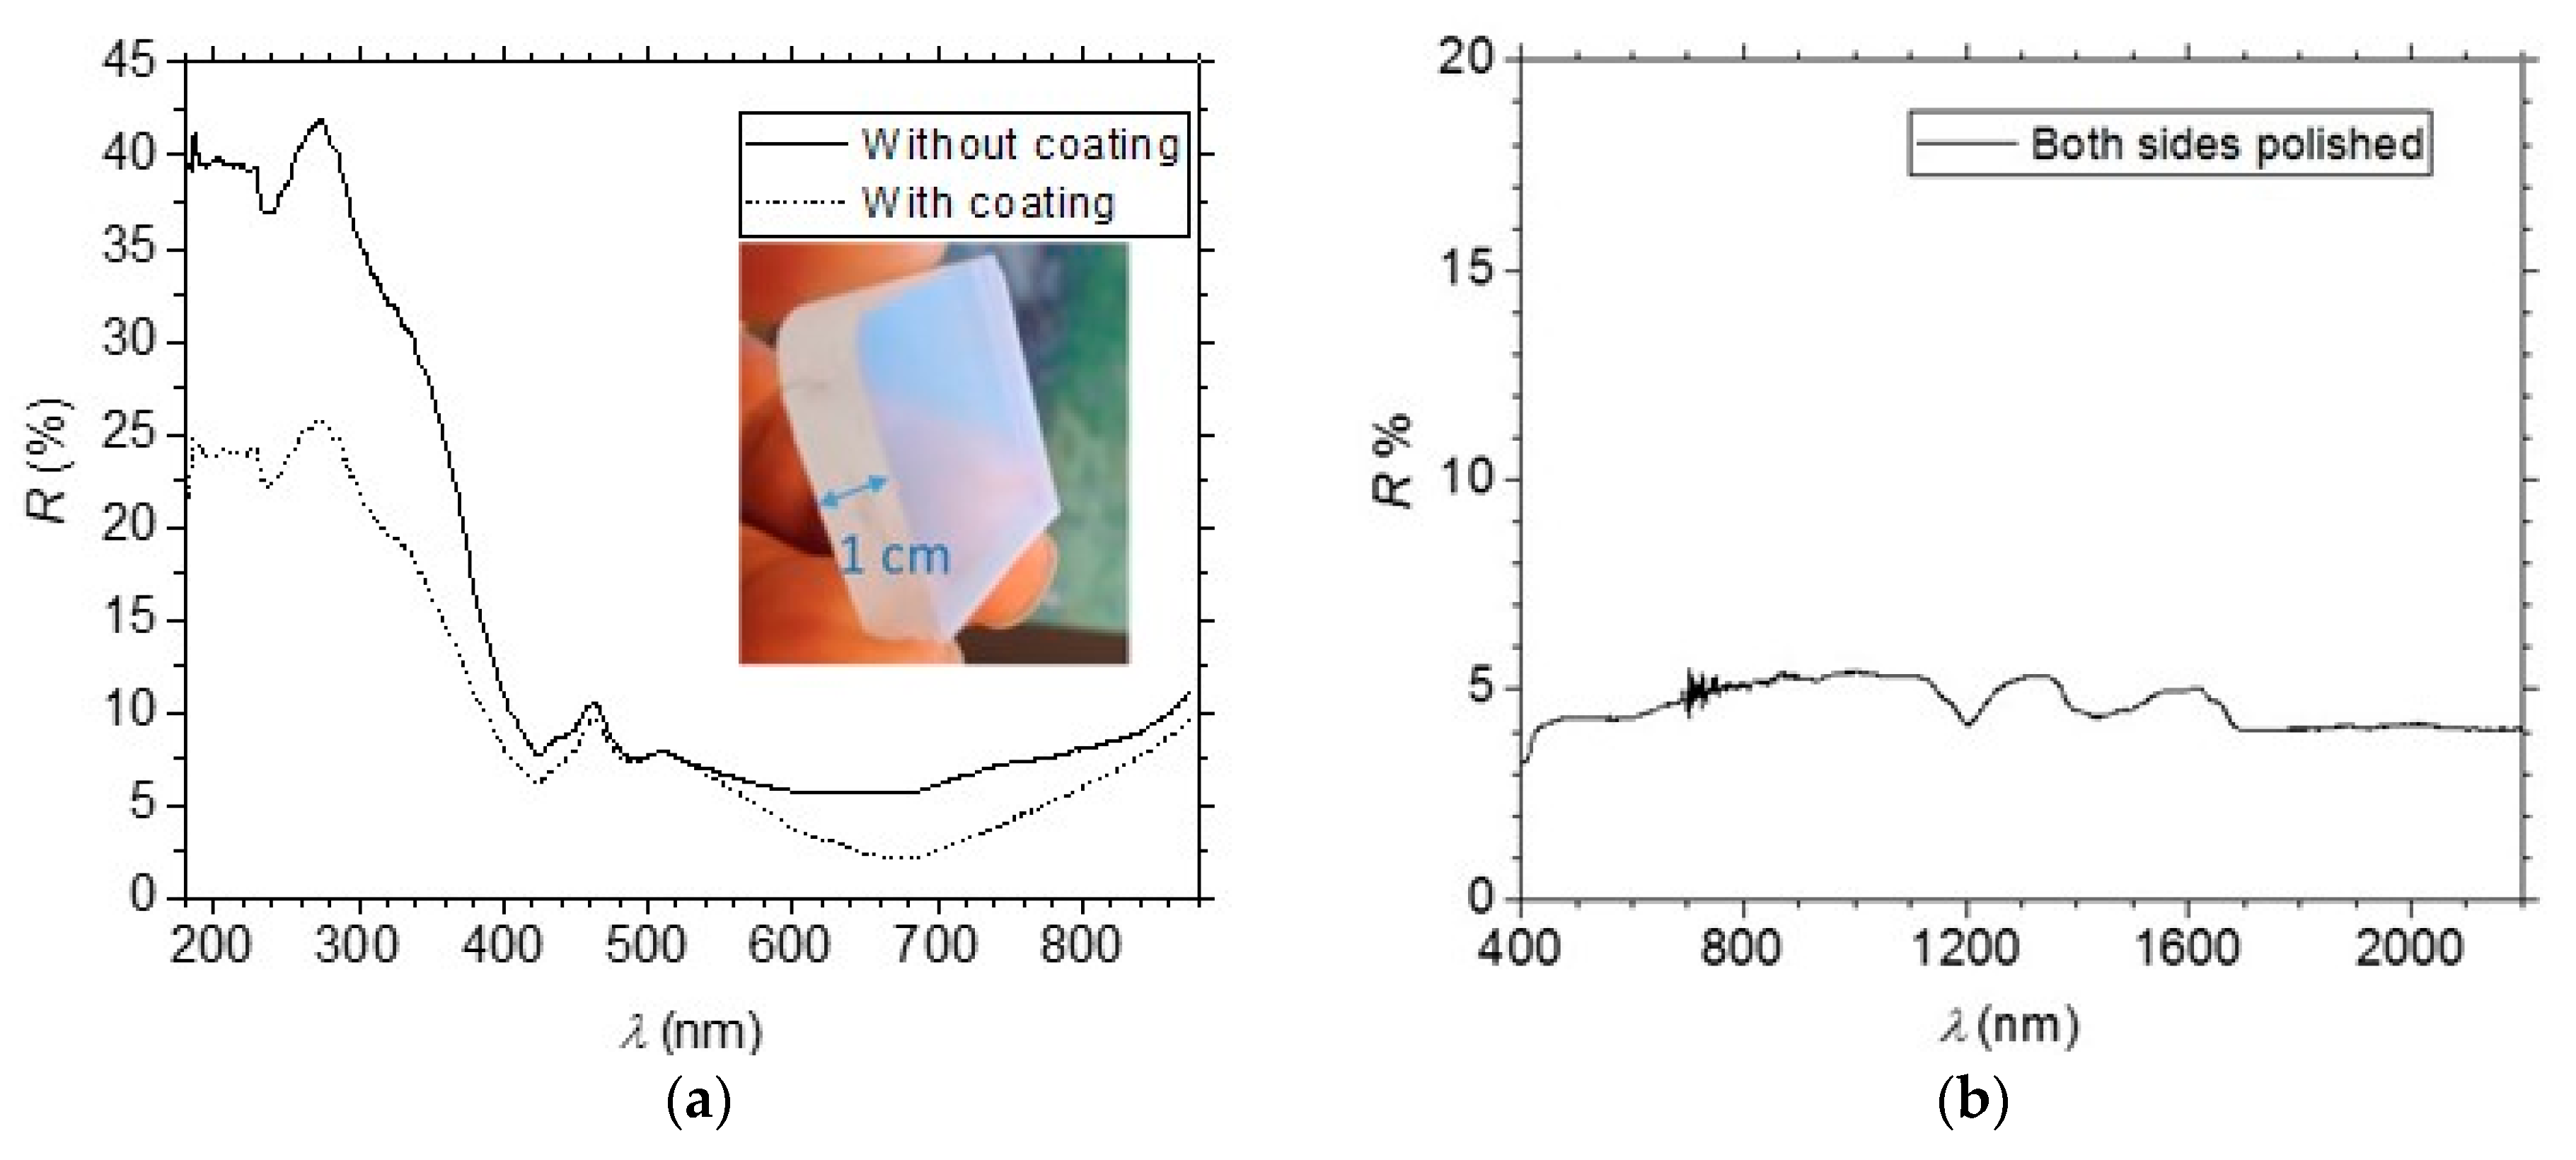
These coatings were deposited by a room temperature, ion-assisted electron beam. The TiO2 starting material is Ti3O5 e-beam evaporated onto the samples at a rate of 2 Å/s and densified at 2.75 A at 100 V with argon ion assist and 30 sccm O2 backfill to retain stoichiometry, and the MgF2 is unassisted during deposition at 7 Å/s. Adjusting the arrival energy and surface mobility can improve the adhesion, density and grain structure of the deposited film on the material of choice. The inset of Figure 7a shows the sample with deposited film—the film is optimised for orthogonal incidence and so appears white away from this condition.

2.6. Surface Profiles

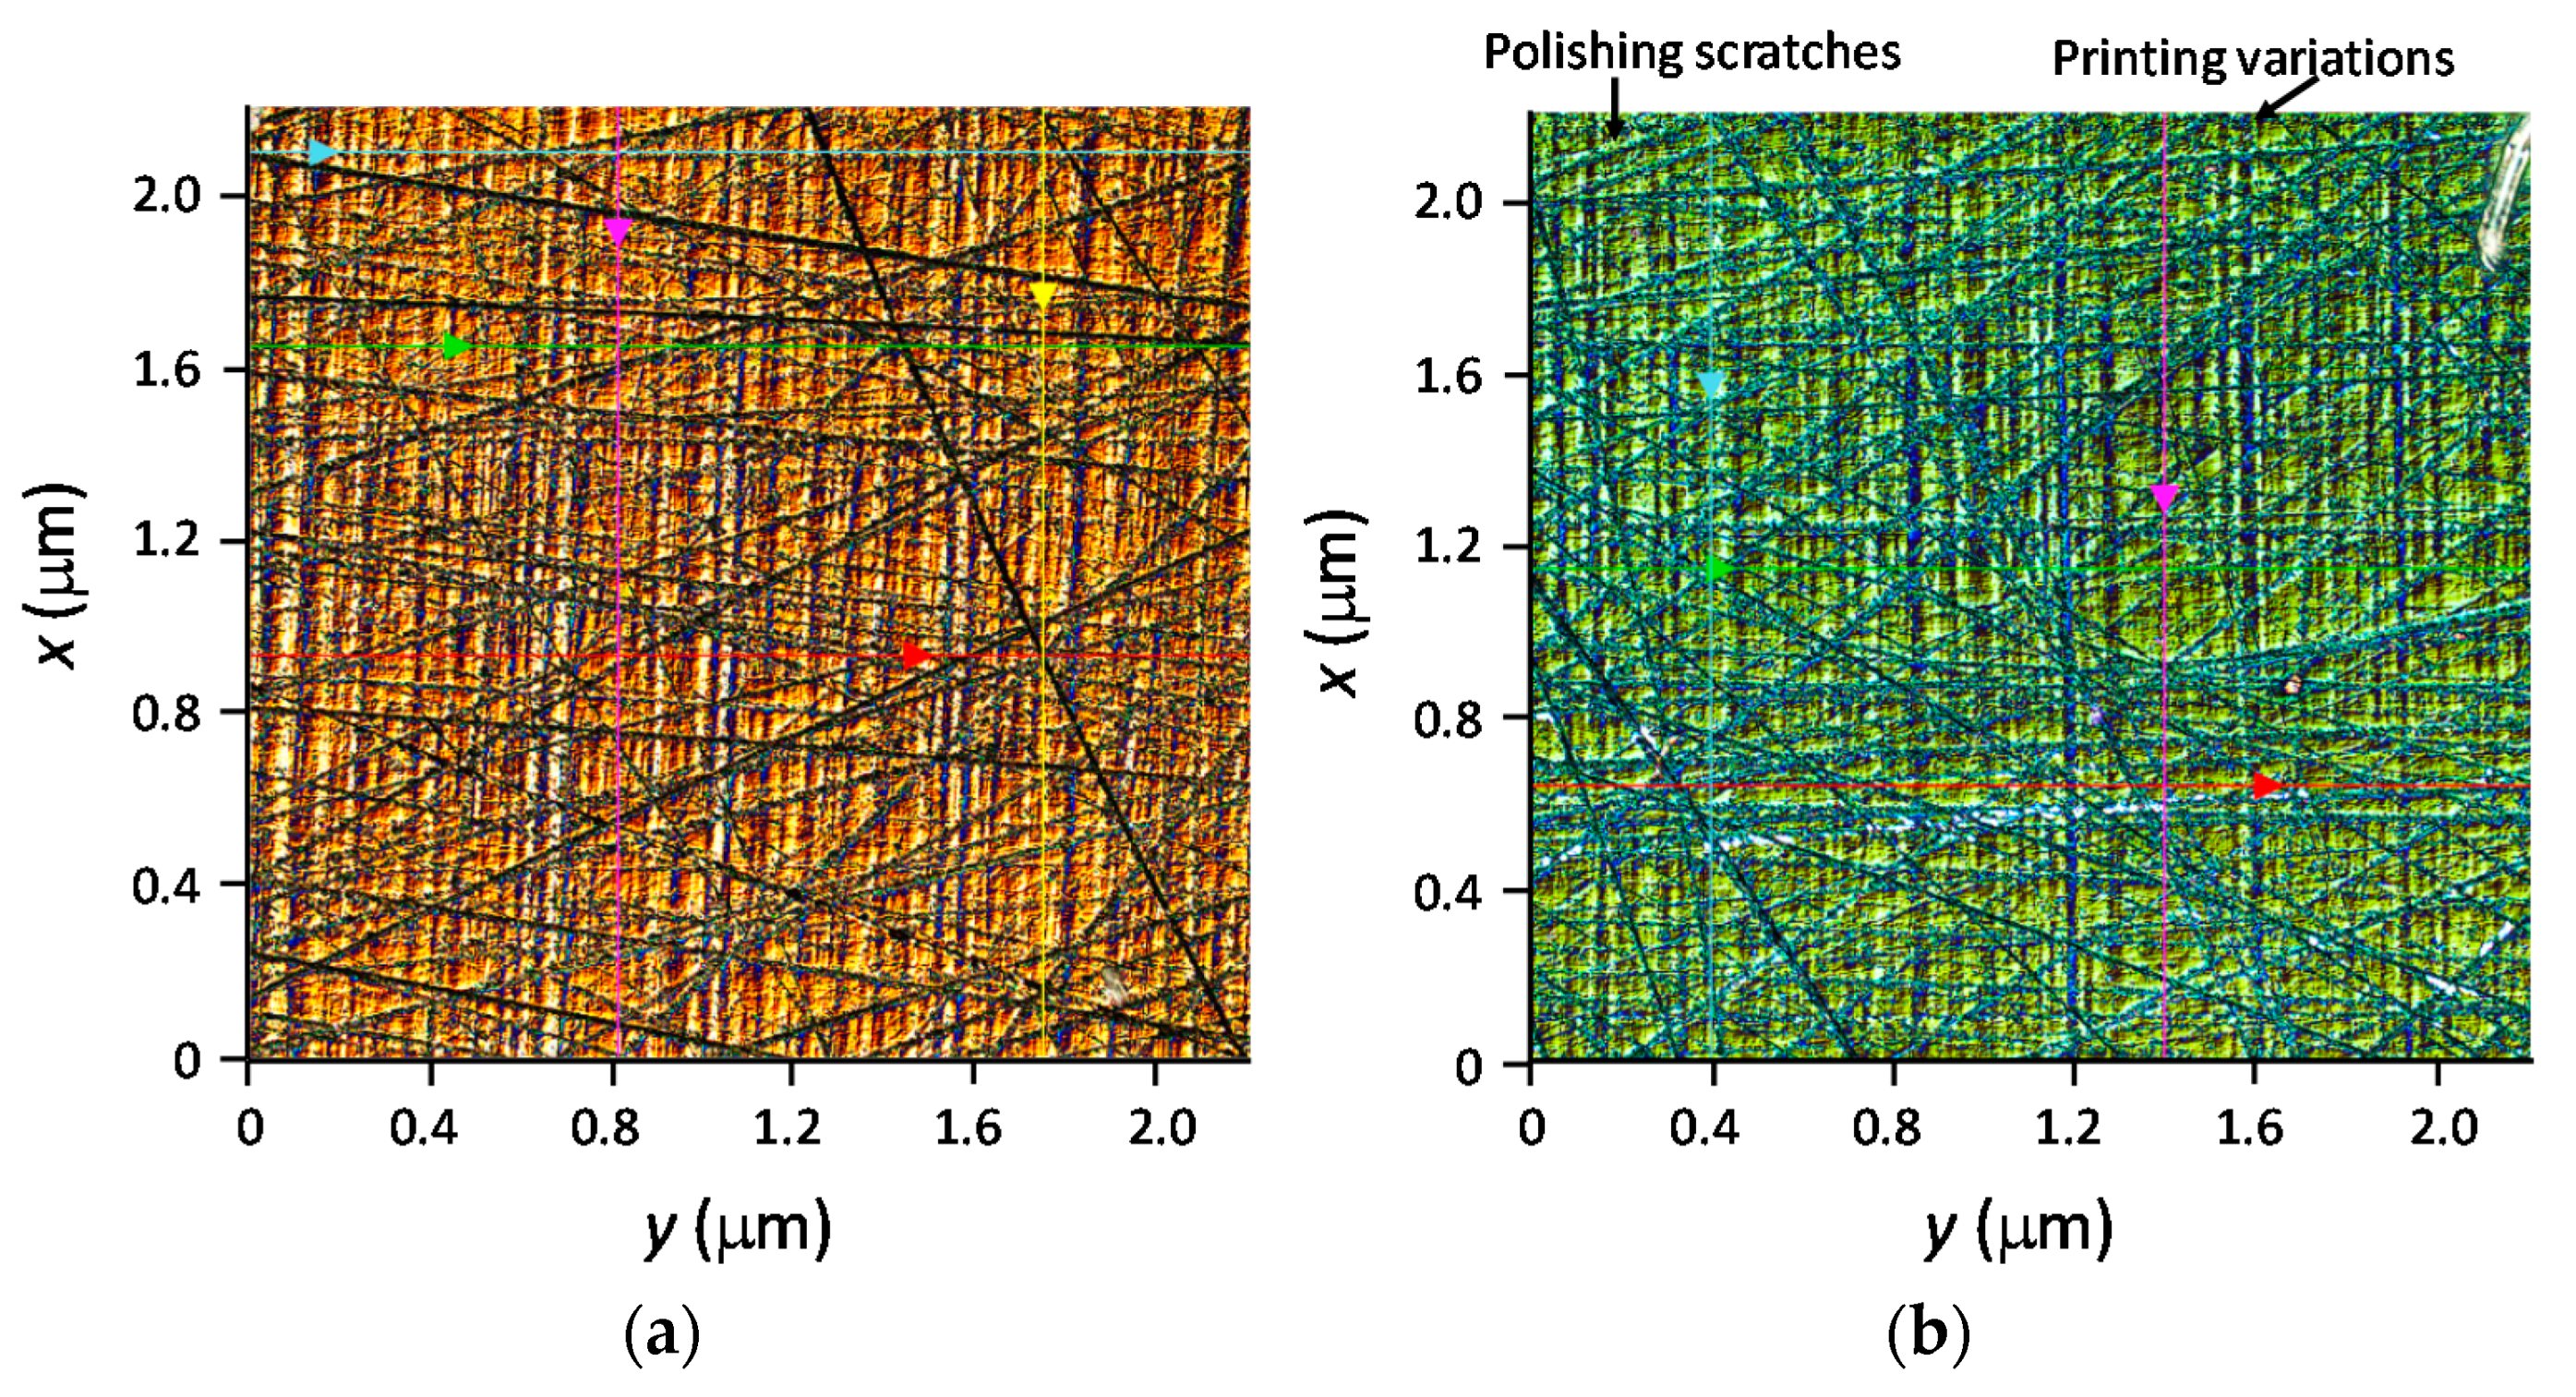
In order to assess quality of the finishes from before and after coating, surface metrology was undertaken using an Olympus LEXT OLS5000 confocal laser scanning microscope system (lateral resolution~120 nm, repeatability~30 nm, accuracy~150 nm and height measurement noise~1 nm, Olympus, Hamburg, Germany). Figure 8 shows the 2D surface profile maps for both uncoated and coated SC samples using a ×20 objective on the microscope. What can be observed are two distinct features—polishing introduces scratches that are difficult to avoid mechanically, but more importantly, there is a local periodic variation aligned on axes that arises from the printing scanning (See Figure 1c). It is not able to be fully removed by polishing. These two features combined will contribute to remaining scattering losses of any optical element. To measure and compare surface roughness between uncoated and coated samples, several line scans were taken across and along the profiles to minimise the contribution from these features. After coating, it appears there was a small decrease in surface roughness, from Ra = 0.170 to 0.153, mindful that these numbers partially fall within error uncertainty.

2.7. Coating Performance

Coating tests were carried out to assess performance. These included adhesion and humidity assessment. An LT-90 adhesion test (where standardized cellophane tape is pulled off at 90° to the surface) [22] was performed, which was passed, showing no signs of peeling. A standard saturated humidity assessment (95%–100% relative humidity at 60 °C for 24 h) was performed, with no measurable spectral shift or visual deterioration. These results indicate that the layers are well-adhered to the SC substrate.
Ceramic oxides such as ZnO and MgF2 are mechanically characterised using diamond-shaped indentation methods such as the Vickers and Knoop constants [23]. Whilst Shore hardness uses a round tip indentation so direct comparison of values is not straightforward, it is possible—Shore A measurements have been used to characterise hardness of softer rubbers doped with different concentrations of ZnO [24]. The system here is instead a composite of hard plastic coated with thin layers of ceramic oxides, making them amenable to Shore D measurements.
Hardness is of interest in this work since it equates with durability and potentially higher optical damage thresholds—the coating protects the layers from oxidation (browning), reduces surface defect optical interactions and potentially compresses the polymer to raise its damage threshold, all essential aspects for increasing operational performance and longevity of the components in harsh environments. Consequently, Shore D hardness testing was repeated to see if the adherence was reflected as a localized strain-induced compression on the surface, hypothesizing that this would typically characterise well-attached film layers. The testing against the uncoated sample produced similar results to those shown in Figure 5b. The durometer reading for the coated sample (Figure 5c) revealed a significantly higher value D(SC)coated~88.1 ± 1.6 consistent with improved composite hardness at the interface between polymer and dielectric coatings. The outlier at the corner can be explained by noting that this corner is where the two cuts of this piece were made, relaxing the film structure. The results demonstrate that adding a coating layer to the SC sample improves its hardness, surpassing that of VC and therefore potentially negating some of its advantages over SC.

2.8. Fresnel Reflections

For comparison, without a coating, VC has a measured R~4.7% at λ = 680 nm after polishing (shown in Figure 7b). The flat spectral response makes VC attractive for broadband components. If we assumed these surface reflections are close to those for SC, then at least 0.9% of the SC measured component can be attributed to scattering. At other wavelengths in Figure 7, the reduction is much larger compared to VC. Given the clarity and flatness of the VC signal to a first approximation, the reflected values from front and back are similar at all wavelengths.
Overall, the measured data will be slightly higher at the front surface than at the back since the latter is attenuated by the front surface. To a first approximation, the scatter will be reduced significantly by effectively smoothing the surface with a coating. The component drop at the front surface of the SC sample can be estimated from a simply derived quadratic model that takes into account the reflections and scatter from the back (Figure 6):
          x 2 2 x + ( R A + R B ) m e a s = 0
The reflected/scattered light from the front surface was calculated to be RA = x = 2.84% without the coating and 1% with the coating. This is a drop of~65% in both Fresnel reflections and scattered light with the applied coating. If the scattering loss is approximately half that for each surface, then 2/3 of the Fresnel reflections will be reduced. For comparison, the measured reduction is approaching those obtained with single-layer coatings of MgF2 on BK7 glass, which has a refractive index in the vicinity of SC [25]. Both the wavelength and the values can be adjusted by controlling the coating thickness and potentially the number of layers used.

3. Discussion and Conclusions

We have successfully demonstrated the deposition of a robust anti-reflection coating on a 3D-printed optical element without significant polishing, paving the way for low-loss optical components produced by additive manufacturing. With just a single bilayer of TiO2 and MgF2, more than 66% suppression of reflections is obtained at a desired wavelength with scope for much greater improvement. This coating reduced Fresnel reflections and appeared to reduce surface scattering arising from average roughness, Ra, suggesting that the use of coatings also helps potentially relax the need for painstaking polishing processes where nano-scale surface roughness needs to be reached. Consistent with these results is a significant improvement in SC Shore D hardness with the coatings, surpassing that of VC alone. Other film designs using additional layers to customise more complex multilayer films, as are conducted on standard optics, can be employed to create broadband anti-reflection coatings, high efficiency reflectors and bandpass filters.
The material used is a commercial acrylate which has a chemical structure that is proprietary but stated to be similar to an acrylate with high optical clearance such as polymethyl macrylate (PMMA). The spectral data along with reduced index and increased hardness suggest strongly that the higher-transparency version VeroClear is a fluorinated polymer, a material that will, in addition to improved optical transparency, also have greater chemical robustness than the standard version. By optimising fluorination, further improvements in transmission and other properties are expected. Nevertheless, whilst VC will have a higher and broader transmission than SC, the anti-reflection and anti-roughness coating at λ = 680 nm allows excellent, targeted performance from the Standard Clear material. This is advantageous because avoiding fluorination and reducing the need for polishing offers a low-cost route to high-quality 3D-printed plastic optics. More broadly, the use of anti-reflection coatings to reduce roughness and Fresnel reflections is a viable alternative with potential advantages in relaxing post-processing approaches for 3D-printed finishes. We have also identified the importance of property mapping of AM materials given the increased tailoring of properties space—Shore mapping was used to assess both uniformity and hardness of the materials used here, and surface profiling allowed an assessment of roughness and equally the observation of the effect of a scanning fabrication approach, as well as limits in mechanical polishing. Surface profiling further highlighted these issues, showing scratches introduced by conventional polishing. The addition of a coating has improved overall hardness for the SC case, over that of the VC case, suggesting that a coating can offer an alternative to fluorination for improved mechanical and potentially optical endurance.

Author Contributions

Conceptualization, J.C.; methodology, J.C., C.C.; validation, M.D., M.L., C.C., J.Z. and J.C.; formal analysis, M.D., J.C., C.C., M.L.; investigation, M.D., C.C., J.C., D.d.L.; resources, J.C., C.C., D.d.L., J.Z.; data curation, D.d.L.; writing—J.C., M.D., C.C.; writing—review and editing, J.C., C.C., D.d.L., M.L., J.Z.; supervision, J.C.; project administration, J.C., C.C. All authors have read and agreed to the published version of the manuscript.

Funding

Private funding supporting the work reported here is acknowledged.

Institutional Review Board Statement

Not applicable.

Informed Consent Statement

Not applicable.

Data Availability Statement

Not applicable.

Acknowledgments

M. Dayao and M. Logozzo acknowledge lab assistance from support staff at UTS.

Conflicts of Interest

The authors declare no conflict of interest.

References

  1. Heinrich, H.; Rank, M. 3D Printing of Optics; Spotlight, SL39; SPIE: Washington, DC, USA, 2018; 42p, ISBN 9781510619982. [Google Scholar]
  2. Assefa, B.G.; Pekkarinen, M.; Partanen, H.; Biskop, J.; Turunen, J.; Saarinen, J. Imaging-quality 3D-printed centimeter-scale lens. Opt. Express 2019, 27, 12630–12637. [Google Scholar] [CrossRef] [PubMed]
  3. Canning, J.; Cook, K. 3D printing, photonics and the IoT. In Proceedings of the Conference on Lasers and Electro-Optics/Pacific Rim 2018, Optical Society of American, Hong Kong, China, 29 July–3 August 2018; p. F1B-1. [Google Scholar]
  4. Lertvachirapaiboon, C.; Baba, A.; Shinbo, K.; Kato, K. Dual-mode surface plasmon resonance sensor chip using a grating 3D-printed prism. Anal. Chim. Acta 2021, 1147, 23–29. [Google Scholar] [CrossRef] [PubMed]
  5. Wolfe, D.; Goossen, W.W. Evaluation of 3D printed optofluidic smart glass prototypes. Opt. Express 2018, 26, A85–A98. [Google Scholar] [CrossRef] [PubMed]
  6. Gross, B.C.; Anderson, K.B.; Meisel, J.E.; McNitt, M.I.; Spence, D.M. Polymer Coatings in 3D-Printed Fluidic Device Channels for Improved Cellular Adherence Prior to Electrical Lysis. Anal. Chem. 2015, 87, 6335–6341. [Google Scholar] [CrossRef] [PubMed] [Green Version]
  7. Ho, W.H.; Tshimanga, J.J.; Ngoeppe, M.N.; Jermy, M.C.; Geodhegan, P.H. Evaluation of a desktop 3D printed rigid refractive-indexed-matched flow phantom for PIV measurements on cerebral aneurysms. Cardiovasc. Eng. Technol. 2019, 11, 14–23. [Google Scholar] [CrossRef] [Green Version]
  8. Available online: https://www.stratasys.com/explore/blog/2015/3d-printed-led-light-pipesZ (accessed on 10 November 2021).
  9. Hossain Md, A.; Canning, J.; Yu, Z. Fluorescence-based quality assurance of olive oils using an endoscopy smart mobile spectrofluorometer. IEEE Sens. J. 2020, 20, 4156–4163. [Google Scholar] [CrossRef]
  10. Canning, J.; Hossain, M.A.; Han, C.; Chartier, L.; Cook, K.; Athanaze, T. Drawing optical fibres from 3D printers. Opt. Lett. 2016, 41, 5551–5554. [Google Scholar] [CrossRef] [PubMed]
  11. Prajzler, V.; Kulha, P.; Knietel, M.; Enser, H. Large core plastic planar optical splitter fabricated by 3D printing technology. Opt. Commun. 2017, 400, 38–42. [Google Scholar] [CrossRef]
  12. Cook, K.; Canning, J.; Leon-Saval, S.; Redi, Z.; Hossain, M.; Comatti, J.-E.; Luo, Y.; Peng, G.-D. Air-structured optical fibre drawn from a 3D-printed optical preform. Opt. Lett. 2015, 40, 3966–3999. [Google Scholar] [CrossRef] [PubMed] [Green Version]
  13. Cook, K.; Balle, G.; Canning, J.; Chartier, L.; Athanze, T.; Hossain, M.A.; Han, C.; Comatti, J.-E.; Luo, Y.; Peng, G.-D. Step-index optical fibre drawn from 3D printed preforms. Opt. Lett. 2016, 41, 4554–4557. [Google Scholar] [CrossRef] [PubMed]
  14. Chu, Y.; Fu, X.; Luo, Y.; Canning, J.; Tian, Y.; Cook, K.; Zhang, J.; Peng, G.-D. Silica optical fibre drawn from 3D printed preforms. Opt. Lett. 2019, 44, 5358–5361. [Google Scholar] [CrossRef] [PubMed]
  15. Vaidya, N.; Solgaard, O. 3d printed optics with nanometer scale surface roughness. Microsys. Nanoeng. 2018, 4, 18. [Google Scholar] [CrossRef] [PubMed]
  16. Available online: https://www.stratasys.com/materials/search/veroclear (accessed on 10 November 2021).
  17. Bhowmik, K.; Peng, G.D. Polymer Optical Fibers. In Handbook of Optical Fibers; Peng, G.D., Ed.; Springer: Singapore, 2019. [Google Scholar]
  18. Bennet, J.; Measuring, U.V. Curing parameters of commercial photopolymers used in additive manufacturing. Addit. Manuf. 2017, 18, 203–212. [Google Scholar]
  19. Miyasaka, M.; Koike, N.; Fujiwara, Y.; Kudo, H.; Nishikubo, T. Synthesis of hyperbranched fluorinated polymers with controllable refractive indices. Polymer J. 2011, 43, 325–329. [Google Scholar] [CrossRef] [Green Version]
  20. Sun, X.; Xu, X.; Tu, J.; Yan, P.; Song, G.; Zhang, L.; Zhang, W. Research status of antireflection film based on TiO2. Mater. Sci. Eng. 2019, 490, 022074. [Google Scholar] [CrossRef]
  21. Dumas, L.; Quesnel, E.; Pierre, F.; Bertin, F. Optical properties of magnesium fluoride thin films produced by argon ion-beam assisted deposition. J. Vac. Sci. Technol. 2002, 20, 102. [Google Scholar] [CrossRef]
  22. Hausner, M. Specifications and Standards for Optical Coating Durability; SPIE Spotlight: Washington, DC, USA, 2019. [Google Scholar] [CrossRef]
  23. Chicot, D.; Tricoteaux, A. Mechanical properties of ceramics by indentation: Principle and applications. In Ceramic Materials; Wunderlich, W., Ed.; InTech: London, UK, 2010; Chapter 7. [Google Scholar]
  24. Habeeb, S.A.; Alobad, Z.K.; Albozahid, M.A. Effect of zinc oxide loading levels on the cure characteristics, mechanical and aging properties of the epdm rubber. J. Mechan. Eng. Tech. 2018, 9, 133–141. [Google Scholar]
  25. Available online: https://www.komachine.com/en/companies/millenium-optical-system/products/43463-Single-Layer-Magnesium-Fluoride-(MgF2)/ (accessed on 10 November 2021).
Figure 1. Slabs of t~1 cm thickness (ad) of transparent Standard Clear (SC) resin without (a) and with (b) manual polishing and VeroClear (VC) resin without (c) and with (d) polishing. Slight browning of the SC sample is observed, partially removed by polishing, suggesting surface oxidation occurred during printing. By fluorinating such polymers, this oxidation and subsequent scatter can be largely avoided; alternatively, an inert atmosphere or vacuum can be introduced. A typical convex lens made of C is shown in (e) where significant surface Fresnel reflections are seen.
Coatings 11 01519 g001
Figure 2. Measured transmission spectra of polished SC and VC slabs in the VIS/NIR. The similar UV band-edge (below λ = 420 nm) corresponds to the 405 nm absorption of the photo-initiator that polymerises the material. The absorption bands associated with C–H stretches (λ~1200, 1500 and 1900 nm) are all shifted to shorter wavelengths for the VC sample, consistent with fluorination. The dip observed around λ~570 nm is probably an interference fringe from the slab arising from back reflection from the back surface, consistent with the significantly improved transmission.
Coatings 11 01519 g002
Figure 3. Optical setup (a) for measuring refractive index. Using equation in (b), angles are worked out and the refractive index calculated using Snell’s law. By taking the front, IF, and back, IB, reflections and measuring distance between front and back reflected rays, d, as a function of a number of angles, θ1 and θ2, error in calculating n from Snell’s equation, potentially arising from positional inaccuracy during alignment and non-parallel surfaces, can be reduced by taking single measurements.
Coatings 11 01519 g003
Figure 4. Refractive index, n, for (a) VC and (b) SC extracted five times in different places over the material as a function of calculated angle, θ. When the experiment works as it should, the profile is flat over the central angular region, quickly allowing an assessment of quality of measurement with meaningful error arising from its distribution. When the experiment is not well-aligned or the flats are not parallel, the flatness window quickly narrows. Importantly, measuring at 0° reveals how sensitive the measurement is when performing simple orthogonal measurements, providing a reason for significant variation in the literature. It likely arises from accurate differing alignment and beam discernment, including when passing through a splitter.
Coatings 11 01519 g004
Figure 5. Shore D maps of (a) VC, (b) SC and (c) anti-reflection-coated SC. The scales for the latter are zoomed in, as the piece was cut from the original SC sample. Average values of several measurements were measured over the samples approximately 1 cm apart. The average deviation for each measurement is ±0.5. Despite this size, the VC sample has a detectable higher value compared to SC, consistent with increased hardness after fluorination. On the other hand, the coated SC sample has a measurement significantly higher than VC.
Coatings 11 01519 g005
Figure 6. Schematic illustration of normalised Fresnel reflections from the front and back faces of the slabs, where x = y/(1 − x) if reflection is assumed identical at both faces. Differences in expected intensity are represented by x and y.
Coatings 11 01519 g006
Figure 7. (a) Measured reflection of SC sample with and without anti-reflection coating of TiO2/MgF2. Inset image shows the sample with the coating—the thin film looks opaque away from orthogonal incidence. Significant suppression of Fresnel reflections are observed, including below the band-edge in the UV. The maximum observed drop is~λ = 680 nm at the red/near IR edge. Inset shows the coated sample; (b) Measured VIS-NIR reflection after both sides of the VC sample were polished, demonstrating significant scattered light as function of wavelength without a coating in the SC sample. The VC reflection is close to wavelength-independent except where some absorption (C–F) within the sample occurs.
Coatings 11 01519 g007
Figure 8. Surface profile maps over an area A~5 μm2: (a) sample SC before coating and (b) after coating. The almost regular vertical lines are from printing whilst the haphazard solid lines are scratches arising from polishing. The colour line scans are where cross-sectional profiles at various places were taken. From these, the average roughness, Ra, was calculated to be, before coating, Ra(BC) = (0.170 ± 0.037) μm and after coating, Ra(AC) = (0.153 ± 0.016) μm.
Coatings 11 01519 g008
Publisher’s Note: MDPI stays neutral with regard to jurisdictional claims in published maps and institutional affiliations.