Article

Study on the Influence and Law of Waterproof System Design Factors on the Typical Stress of Bridge Deck Pavement

1
School of Highway, Chang’an University, Xi’an 710000, China
2
Shandong Transportation Institute, Jinan 250000, China
*
Author to whom correspondence should be addressed.
Coatings 2021, 11(12), 1540; https://doi.org/10.3390/coatings11121540
Submission received: 22 November 2021 / Revised: 9 December 2021 / Accepted: 11 December 2021 / Published: 14 December 2021
(This article belongs to the Collection Pavement Surface Coatings)

Abstract

:
To improve the structural design rationality of cement concrete bridge deck pavement systems and reduce diseases such as interlayer displacement and rutting in the early stage of bridge deck use, this paper studies the influence and law of the coupling effect of various factors of the waterproof system on the typical stress of bridge deck pavement and determines the best structure combination for the bridge deck pavement structure. A finite element model was established by using commercial software to simulate the mechanical response of different types of waterproof bonding layer, waterproof leveling layer, and impervious structure layer under different parameters. The simulation results show that when the thickness of the pavement layer was 8 cm, the maximum shear stress of the pavement layer occurred in the middle of the wearing course and the junction between layers. When the pavement layers were continuous, the maximum strain of the waterproof bonding layer with the “rubber asphalt + protective plate” structure in the transverse and longitudinal directions was the largest. When the waterproof leveling layer was cement concrete, the structure bore a large amount of stress and easily produced cracks, resulting in water damage. High-density water-based asphalt concrete with a low permeability coefficient can reduce the interlayer shear stress and effectively ensure the interlayer bonding effect. On this basis, the following bridge deck pavement structure was proposed: waterproof system + multifunctional waterproof layer + load-bearing structure layer + surface functional layer.

1. Introduction

In the transportation industry, an asphalt mixture is often used as the pavement material of cement concrete bridge decks [1]. In recent years, with the increase in the number of heavy-duty vehicles and the normalization of overloaded and overweight vehicles, bridge deck pavement systems have become prone to water damage, such as a loose surface during use due to internal shear deformation resulting in water infiltration [2,3,4,5,6,7]. The selection of bridge deck pavement materials and a reasonable structure design significantly affects the service life and performance of bridge deck pavement systems [8].
The service performance and construction performance of the materials used in the bridge deck pavement have a vital impact on the service performance during the service period [9,10]. Jin et al. [11] analyzed the cost, construction difficulty, environmental protection, and other factors of four materials by using an analytic hierarchy process (AHP). They found that SBS-modified asphalt is the most suitable waterproof bonding layer for diatomite rubber–granular asphalt mixture bridge decks in seasonal frozen soil areas. In addition, the performance of the asphalt mixture is greatly affected by temperature. When studying the performance of bridge deck pavement, the influence of temperature should be considered [12]. Xu et al. [13] studied the bond strength under the combination of load and temperature and found that the performance of the adhesive layer decreased significantly with the increase in temperature. These scholars considered the influence of the vehicle and the external temperature on the waterproof adhesive layer, but did not consider other problems with bridge deck pavement and asphalt mixture pavement. Han et al. [14] established a wheel–pavement coupling system considering temperature changes to simulate the mechanical response relationship between an actual wheel and the pavement. Sun et al. [15] explored the damage behavior of asphalt pavement on different scales during a change in the temperature field using the finite element method based on the mesostructure. They confirmed that the temperature field has an essential impact on the initiation of damage to the asphalt pavement. It is still essential to study the waterproof bonding layer material systematically and deeply and select a waterproof bonding layer material that is suitable for the actual highway and bridge engineering requirements.
Many scholars have studied the failure mechanism of bridge deck pavement and proposed various solutions to relevant problems, which provide a basis for research on bridge deck pavement [16,17]. Yoon et al. [18] improved the evaluation method of the bridge deck pavement and established a bridge evaluation standard based on empirical data and actual measurements. Elsamty et al. [19] analyzed the factors that influence bridge deck pavement cracking, proposed a set of early cracking mechanisms of concrete bridge deck pavement, and verified the correctness of the cracking mechanisms. Chen et al. [20] summarized the crack distribution behaviors of bridge deck pavement by using a multi-scale evaluation method and compared the advantages and disadvantages of the traditional and multi-scale models. The feasibility of applying a multi-scale model to bridge deck pavement was verified. In addition to the selection and use of materials, mechanical analysis and structural design also play important roles in understanding the mechanical properties and improving the performances of bridge deck pavement [21]. The use of finite element software to model and calculate the mechanical responses of bridge deck pavement can effectively solve many practical engineering problems. In stress analysis, cracking and interface bonding are key problems to be considered [22]. Walter et al. [23] studied the cracking mode of a Portland cement concrete (PCC) overlay on a steel bridge using a cracking model. The results showed that longitudinal cracking along the bridge axis occurred after transverse cracking occurred at the top. Xu [24] established three-dimensional finite element models of a T-beam bridge and a box girder bridge under a moving traffic load. A rubber pad was designed to “absorb” the bending stress in the finite element model. For calculating the mechanical responses of bridge deck pavement, the finite element method considering structural and material characteristics is effective [25,26]. Gong et al. [27] studied the mechanical responses of concrete deck asphalt pavement under complex load conditions through three-dimensional finite element modeling. They found that the temperature field had the most significant impact on the damage to the deck pavement, followed by the driving speed and the radius of curvature. Wang et al. [28] conducted field tests on the pavement of sea-crossing bridges by combining static and dynamic methods and proposed reasonable suggestions for the thickness and modulus of the pavement. Ma et al. [29] studied the interlayer adhesion between the bridge deck and asphalt pavement, determined the interlayer adhesion by the quasi-static finite element method, and found that the interlayer adhesion met the application requirements. Cheng et al. [30] established a viscoelastic model of bridge deck pavement. They studied the effects of moving and periodic loads on the mechanical responses of the bridge deck pavement based on finite element software. Most researchers pay attention to the structural layer itself, rarely consider the influence of the material’s permeability and the waterproof leveling layer’s structure on the interlayer stress, and do not give a clear recommended value. In addition, few researchers have used the finite element method to study the void water pressure of bridge deck pavement structures. A scientific, reasonable, economical, and reliable bridge design and control system is the critical problem we must solve for the bridge, transportation, and other engineering technology of the future.
The combination design of the bridge deck pavement structure and research on waterproof bonding materials are essential parts of the whole bridge design system and current research challenges. Based on this, this study established a finite element model of bridge deck pavement by using ANSYS software, analyzed and calculated the influence law of different interlayer connection states, load characteristics, pavement thicknesses, and moduli of four kinds of waterproof bonding layers on the typical stress of bridge deck pavement, and compared the stress states of two kinds of waterproof leveling layers. Finally, COMSOL software was used to calculate and analyze the influence law of the impermeable structural layer of eight pavement structure combinations on the interlayer mechanical state. This provides a theoretical basis for developing a new waterproof system and bridge deck pavement structure under heavy traffic conditions in seasonal freezing areas.

2. Establishment of the Finite Element Model

2.1. Numerical Simulation Calculation

Finite element models with beam heights of 570 and 500 mm were established. To avoid the hourglass phenomenon of the concrete beams during the numerical simulations, fully integrated c3d8 solid elements were adopted for the concrete beam bodies and t3d2 truss elements were adopted for the reinforcements. In this model, the bond-slip characteristics between the concrete and reinforcement were not considered. The reinforcement was embedded in the concrete by an embedding method such that the reinforcement and concrete shared the external load. Simply supported constraints were adopted. That is, one end constrained the translation and rotation in the X-, Y-, and Z-directions, and one end constrained the translation and rotation in the X- and Y-directions. When simulating the ultimate bearing capacity of a beam and slab system, linear displacement loading was adopted to account for the nonlinearity of the concrete material and ensure convergence of the model. The finite element model of the test beam and reinforcement skeleton is shown in Figure 1. The basic calculation parameters are shown in Table 1.

2.2. Loading Test of the Cement Concrete Beam with Pavement

The bending capacity test of the beam was performed using a servo loading system for quarter-point loading, and the load was transmitted to the test beam through the distribution beam. During the test, the clear span of the beam was 7.96 m, the pure bending section in the middle of the span was 2.0 m, and the support was hinged. Displacement sensors were arranged at the middle and quarter points of the beam span and on the left and right sides of the supports at both ends. A concrete strain gauge was attached to the surface of the web plate in the middle of the beam span, the concrete of the bottom plate protective layer at the tensile reinforcement in the middle of the span was chiseled, and a reinforcement strain gauge was installed. A Dh3819 wireless communication static strain test system collected the displacement and strain. The loading mode, measuring point layout, and photographs of the loading system of the reinforced-concrete hollow-slab beam are shown in Figure 2 and Figure 3.

2.3. Validation of the Applicability of the Finite Element Model for Mechanical Analysis

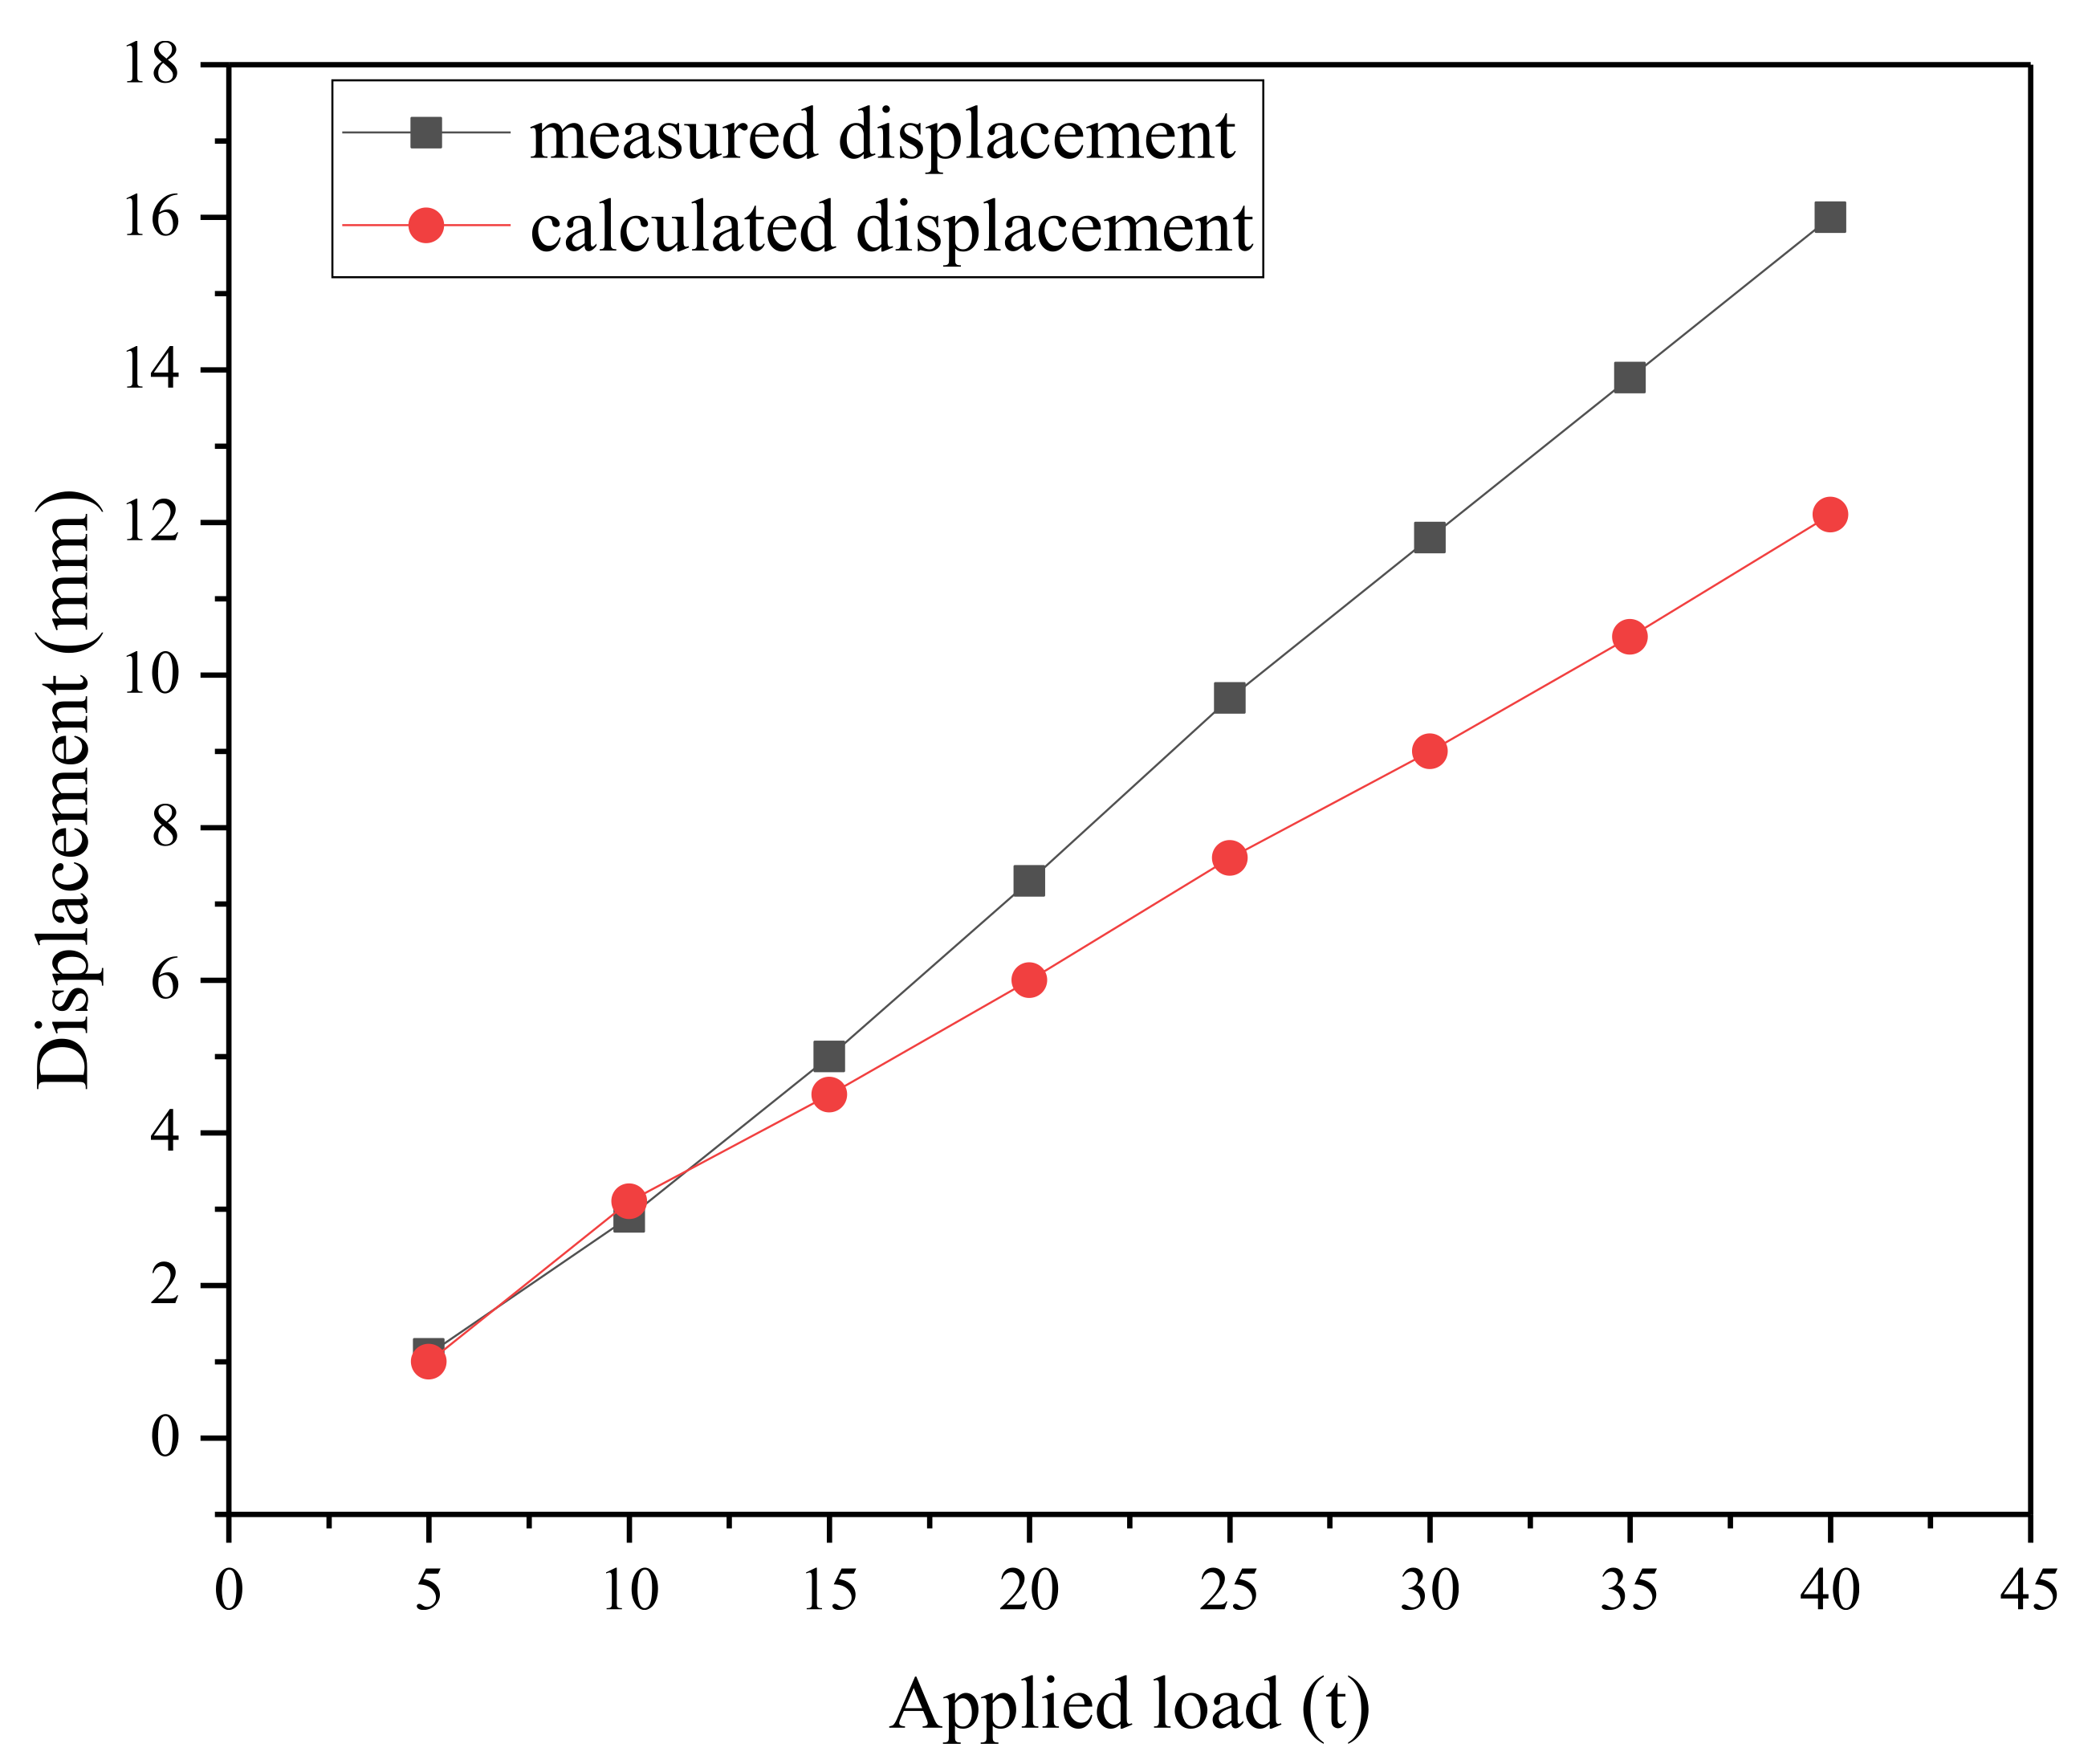
Based on the calculation results of the established finite element model and the actual loading test data, the deflection versus displacement curves at one half of the mid-span was plotted as shown in Figure 4. The inconsistency between the measured boundary constraints and the software constraints led to slight differences in the final results. In the experiment, the end constraints simply restricted the vertical displacements at both beam ends but not displacements in other directions. However, the configuration in the simulation used simply supported beams, and, thus, the constraints were stricter than those in the experiment.
The measured value was basically consistent with the simulation value during the initial loading process. At the beginning of the loading process, the force borne by the beam was small, and the boundary conditions had little effect on the overall deflection of the beam. With the increase in the load, there were slight discrepancies between the measured and simulated values. Generally, the measured values were greater than the simulated values, but the maximum difference was within 3 mm. This showed that the results obtained by the simulations reflected the actual stress situation. The load used in the calculation in this paper is the standard axle load of 100 kN. When the applied load is less than 15 t, the measured value and the calculated value agree better, indicating that the results simulated by the software can reflect the real stress situation, and the finite element model is applicable.

3. Influence of Different Parameters of the Waterproof Adhesive Layer on Pavement Stress

3.1. Influence of Waterproof Layer Modulus on Interlayer Shear Stress

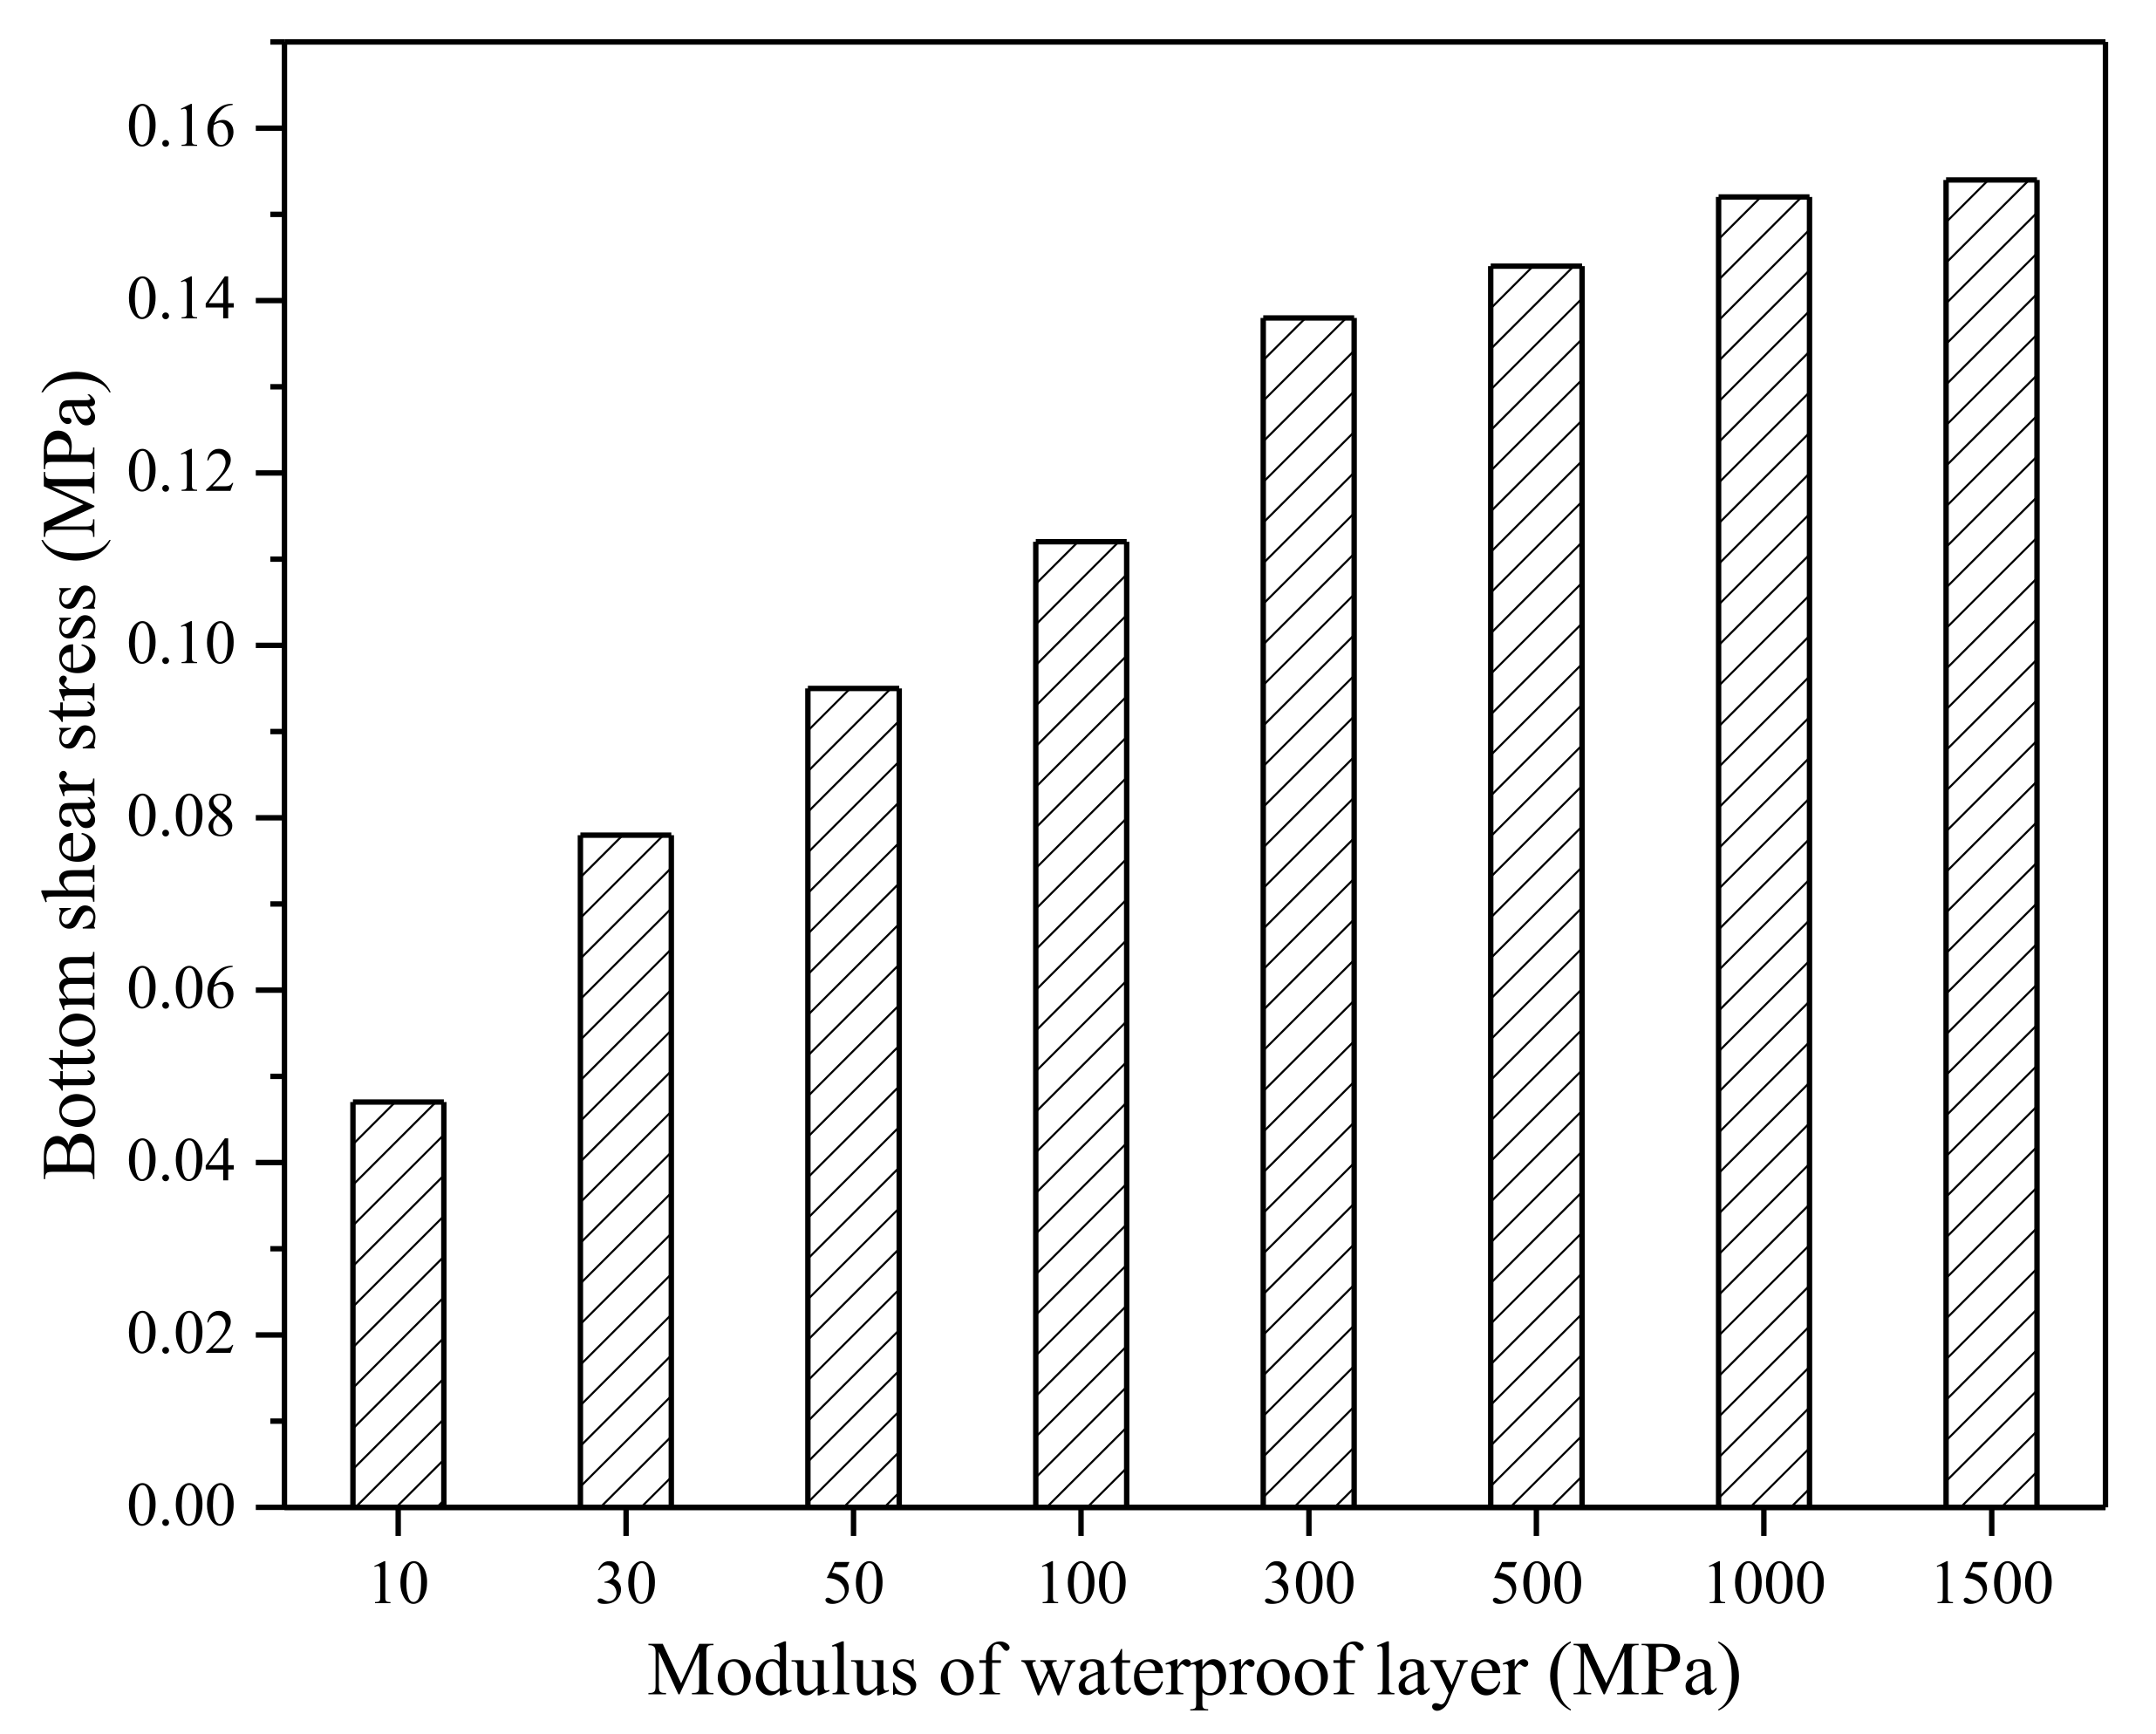
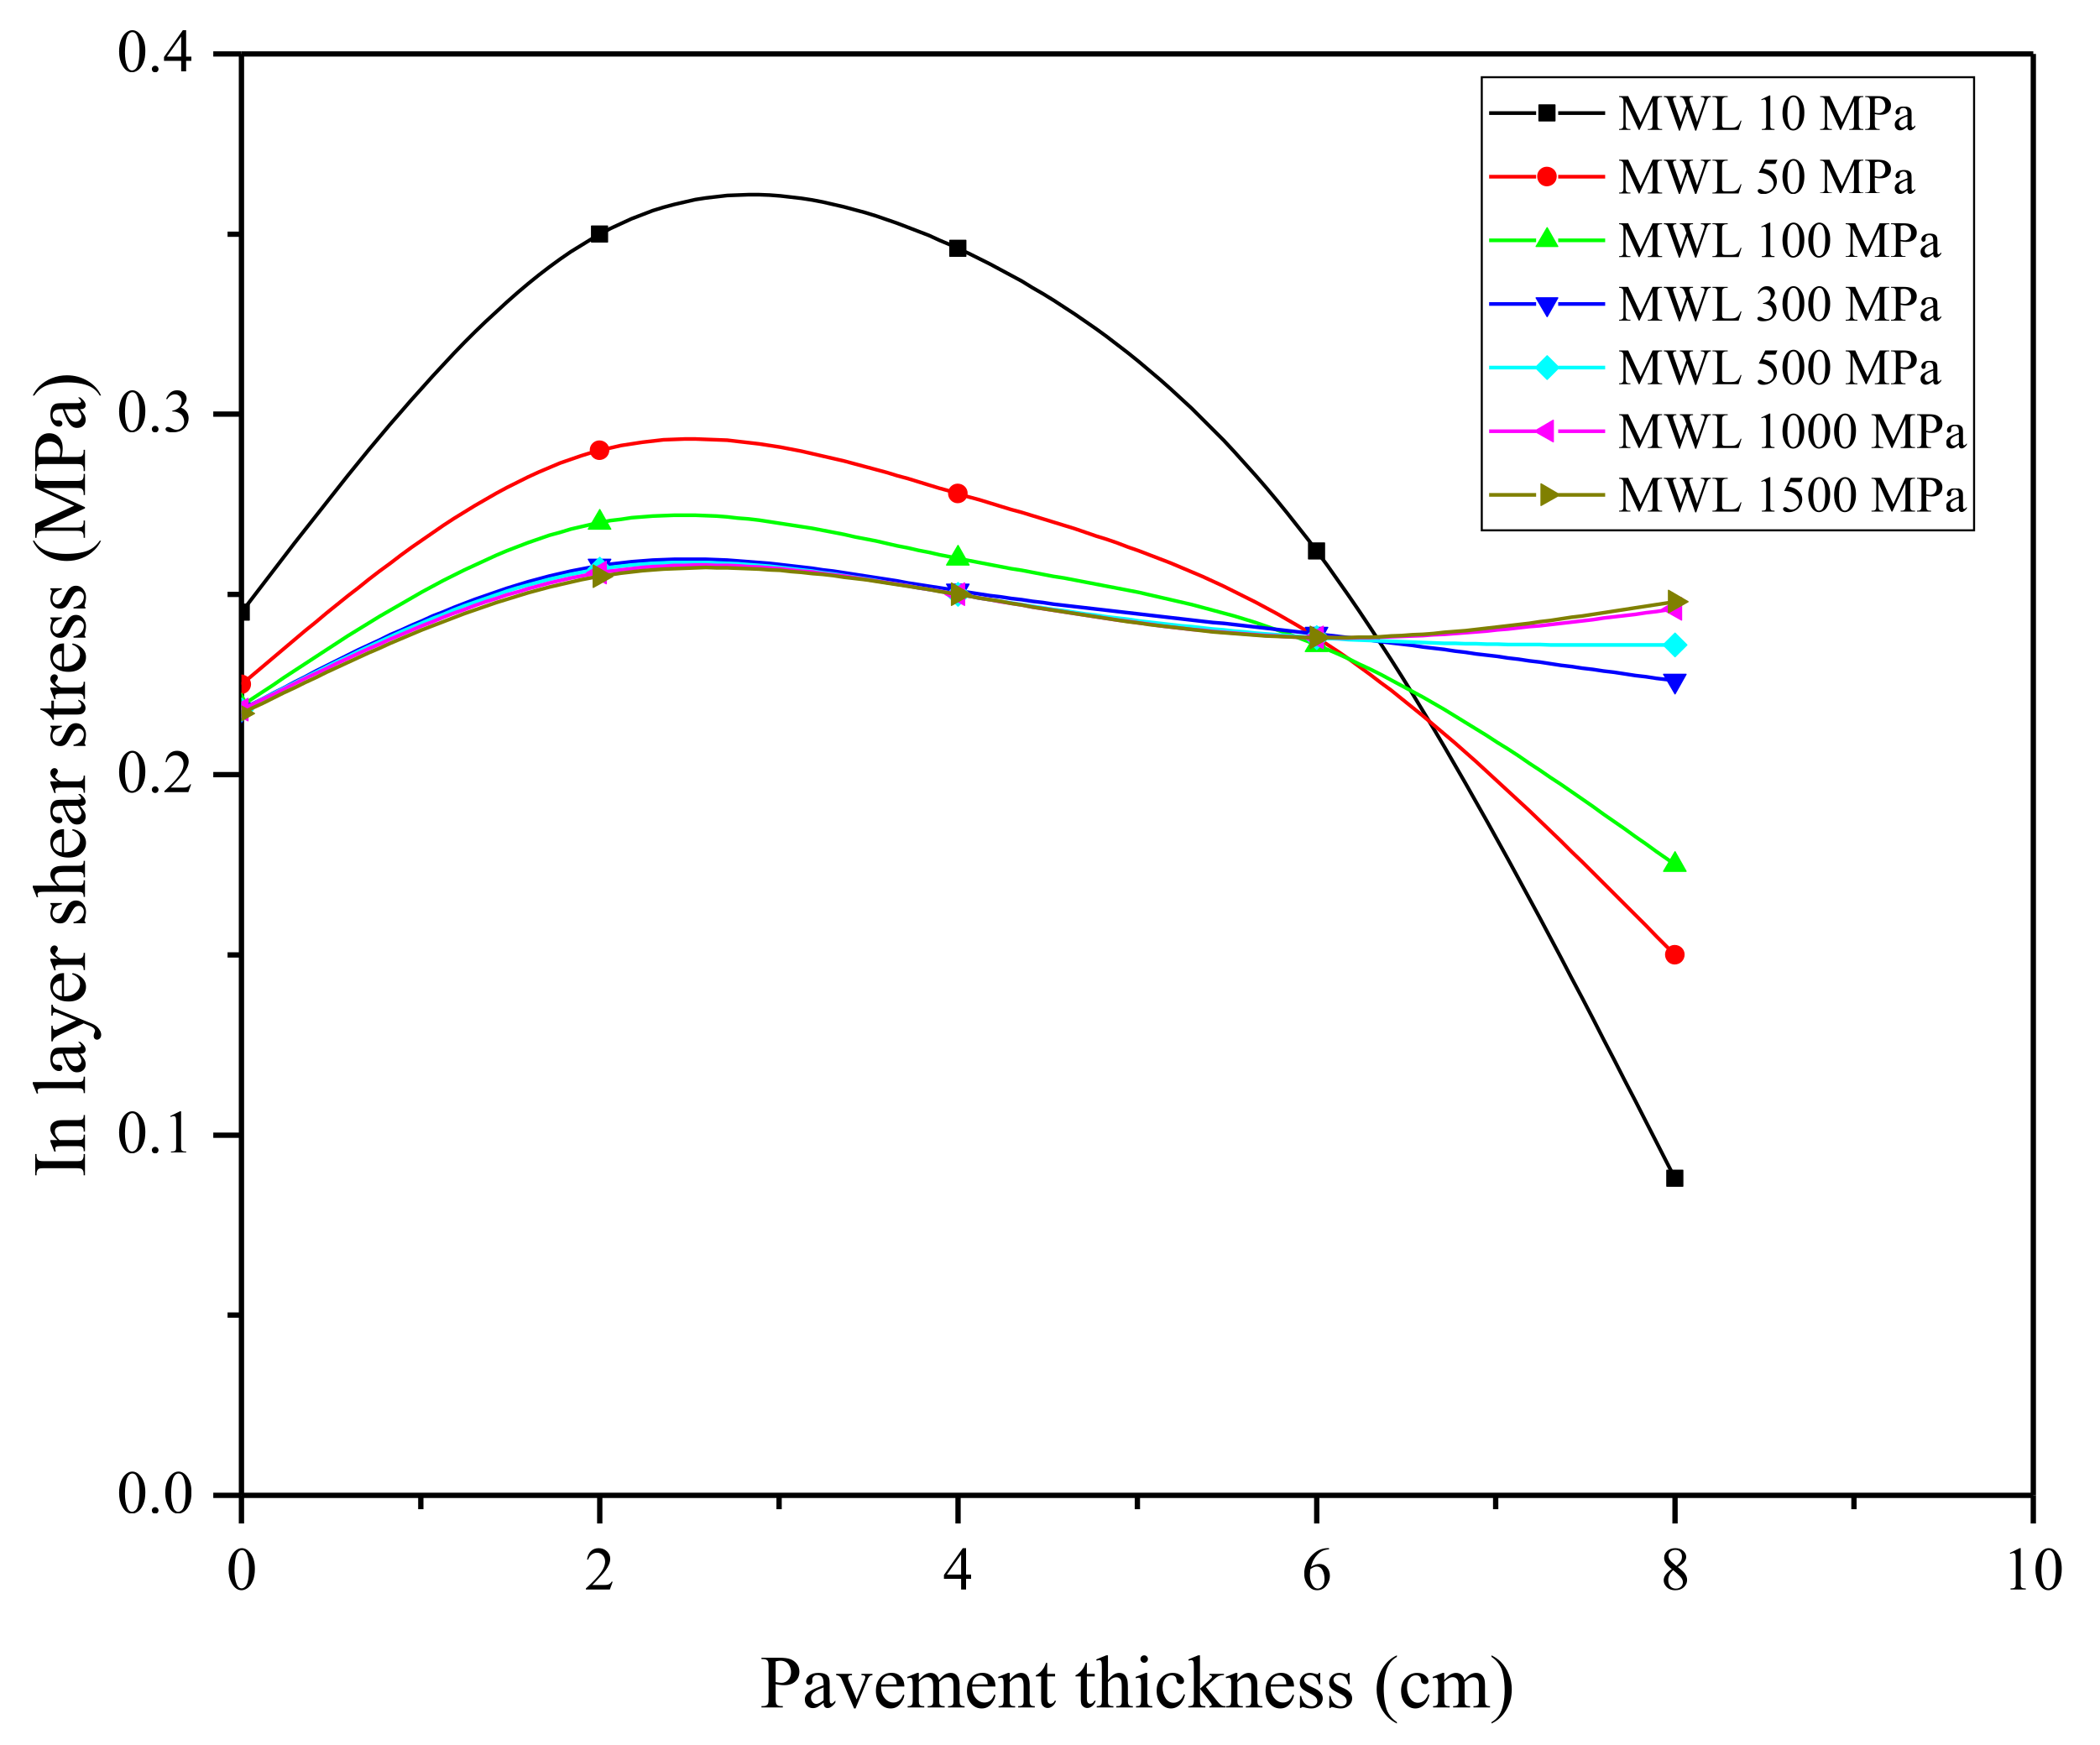
Due to the high stiffness of the concrete bridge deck, the influence range of the wheel load and its interaction are negligible. In the simulations, combined with the computer performance and calculation efficiency requirements, the plane size was set to 1 m (transverse bridge direction) × 3 m (longitudinal bridge direction) for the rectangular deck pavement structure system. The results of the empirical calculation meet the calculation accuracy requirements. In the model, the upper and lower surfaces were free and the surrounding boundaries perpendicular to the surface were completely fixed. The simulation model used three-dimensional eight-node hexahedral solid elements, and the maximum side length of the element was 40 mm. The calculation model is shown in Figure 5. The model adopts the standard double-circular uniformly distributed load in the pavement design. The wheel load radius was 10.65 cm, the vertical pressure was 0.707 MPa, and a certain horizontal force coefficient was considered. The influence of the waterproof layer modulus on the shear stress is shown in Figure 6 and Figure 7.
Figure 6 shows that the change in the modulus of the bonding layer had little impact on the maximum shear stress of the pavement layer, but it had a significant impact on the maximum shear stress of the bonding layer itself. In particular, when the modulus of the bonding layer changed from 10 to 50 MPa, the maximum shear stress of the bonding layer increased by 95.5%, and the impact decreased with the increase in the modulus of the bonding layer. When the modulus of the bonding layer changed from 50 to 300 MPa, the impact decreased to 48.0%. When the modulus of the adhesive layer changed from 300 to 1500 MPa, this effect decreased to 13.7% and gradually tended to a stable value.
Figure 7 shows that when the total thickness of the pavement layer was 8 cm, the shear stress in the pavement layer increased first and then decreased with the increase in the depth. The maximum shear stress occurred between 2 cm and 4 cm, that is, the middle of the wearing course and the junction between layers, which would create higher requirements for the high-temperature shear resistance and interlayer stability of the upper pavement layer. The amount of shear stress decreased with the increase in the waterproof layer modulus. When the modulus was 10 MPa, the internal shear stress was the highest. At the same depth, the internal shear stress of pavement with a modulus greater than 300 MPa decreased significantly. Still, the bottom shear stress of the pavement layer increased relatively.

3.2. Influence of Waterproof Layer Type and Parameters on Interlayer Stability

A standard axle load and a heavy load were selected for the simulation. The standard axle load was a double-wheel single-axle load of 100 kN, and the grounding pressure was 0.7 MPa. The heavy load was a double-wheel single-axle load of 250 kN, and the grounding pressure was 1.4 MPa. The modulus at 40 °C was selected for the calculation.
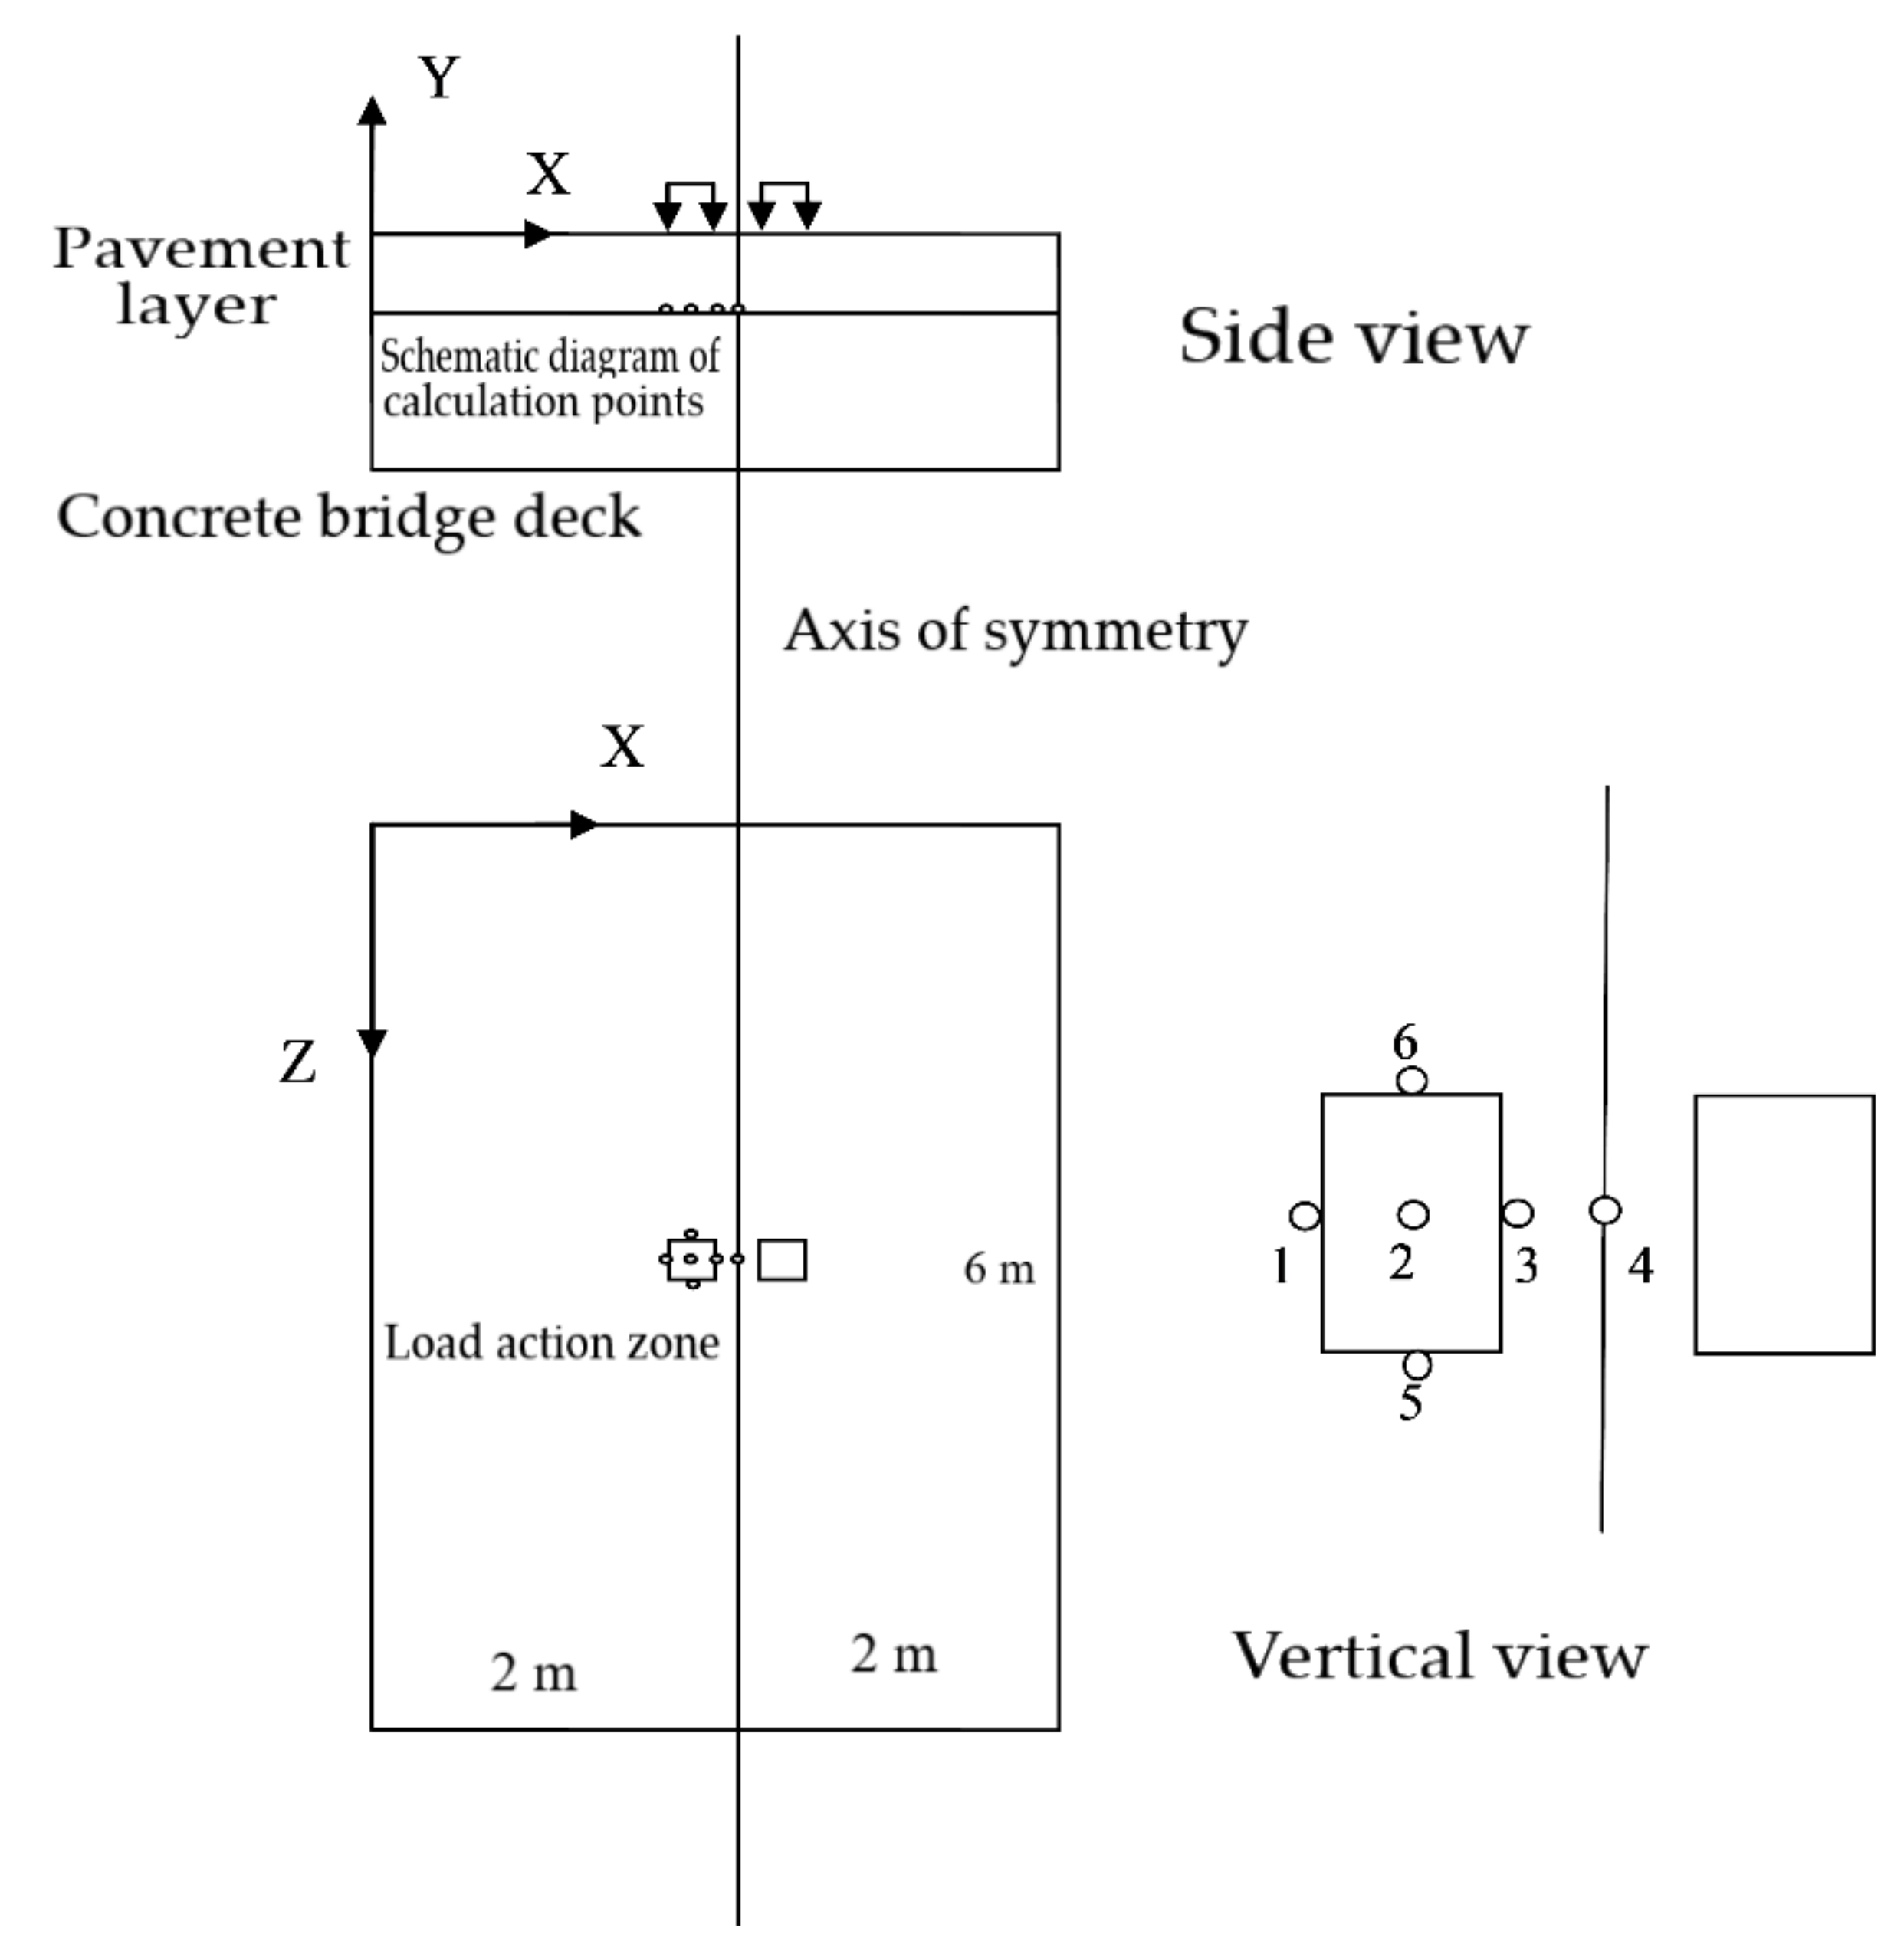
A rectangular bridge deck pavement structure system with a plane size of 4 m (transverse bridge direction) × 6 m (longitudinal bridge direction) was selected for the simulation. The upper and lower surfaces were free, the boundary in the forward direction of the vehicle was completely fixed, and the lateral boundary was free. The finite element model (using symmetry, the finite element model was half of the actual model) and the model diagram are shown in Figure 8. The calculation model used three-dimensional eight-node hexahedral solid elements, and the element size was 2–20 cm. Four different types of waterproof system structures were analyzed. The specific structures and parameters are shown in Table 2.
Six specific load positions were selected for the simulation:
(1) The middle of the outer edge of the single wheel at the bottom of the pavement;
(2) The center of the single wheel at the bottom of the pavement;
(3) The middle of the inner edge of the single wheel at the bottom of the pavement;
(4) The centers of the two wheels at the bottom of the pavement;
(5) The front end of the single-wheel center at the bottom of the pavement; and
(6) The rear end of the single-wheel center at the bottom of the pavement.
Figure 9 shows the load layout diagram of the double-wheel set.
The state of the interlayer was divided into two states: smooth and continuous. For Structure 2, the waterproof layer was hot-rubber-modified asphalt with a high viscosity, and a diluted asphalt primer was used to connect the well to the bridge deck. Therefore, the rubber asphalt layer was assumed to not be damaged. Since the total thickness of the waterproof layer and protective plate was 0.86 cm, it needed to be analyzed as a separate layer. It was assumed that the change in the interlayer conditions occurred between the rubber asphalt and the bridge deck. That is, a possible failure occurred in the asphalt concrete layer. Therefore, the bottom of the asphalt concrete layer (the upper surface of the protective layer) was selected as the calculation position. We analyzed situations in which the braking was not considered and the braking force was 0.5 times the axle load.

3.2.1. Calculation and Analysis of Stability between Waterproof Layers

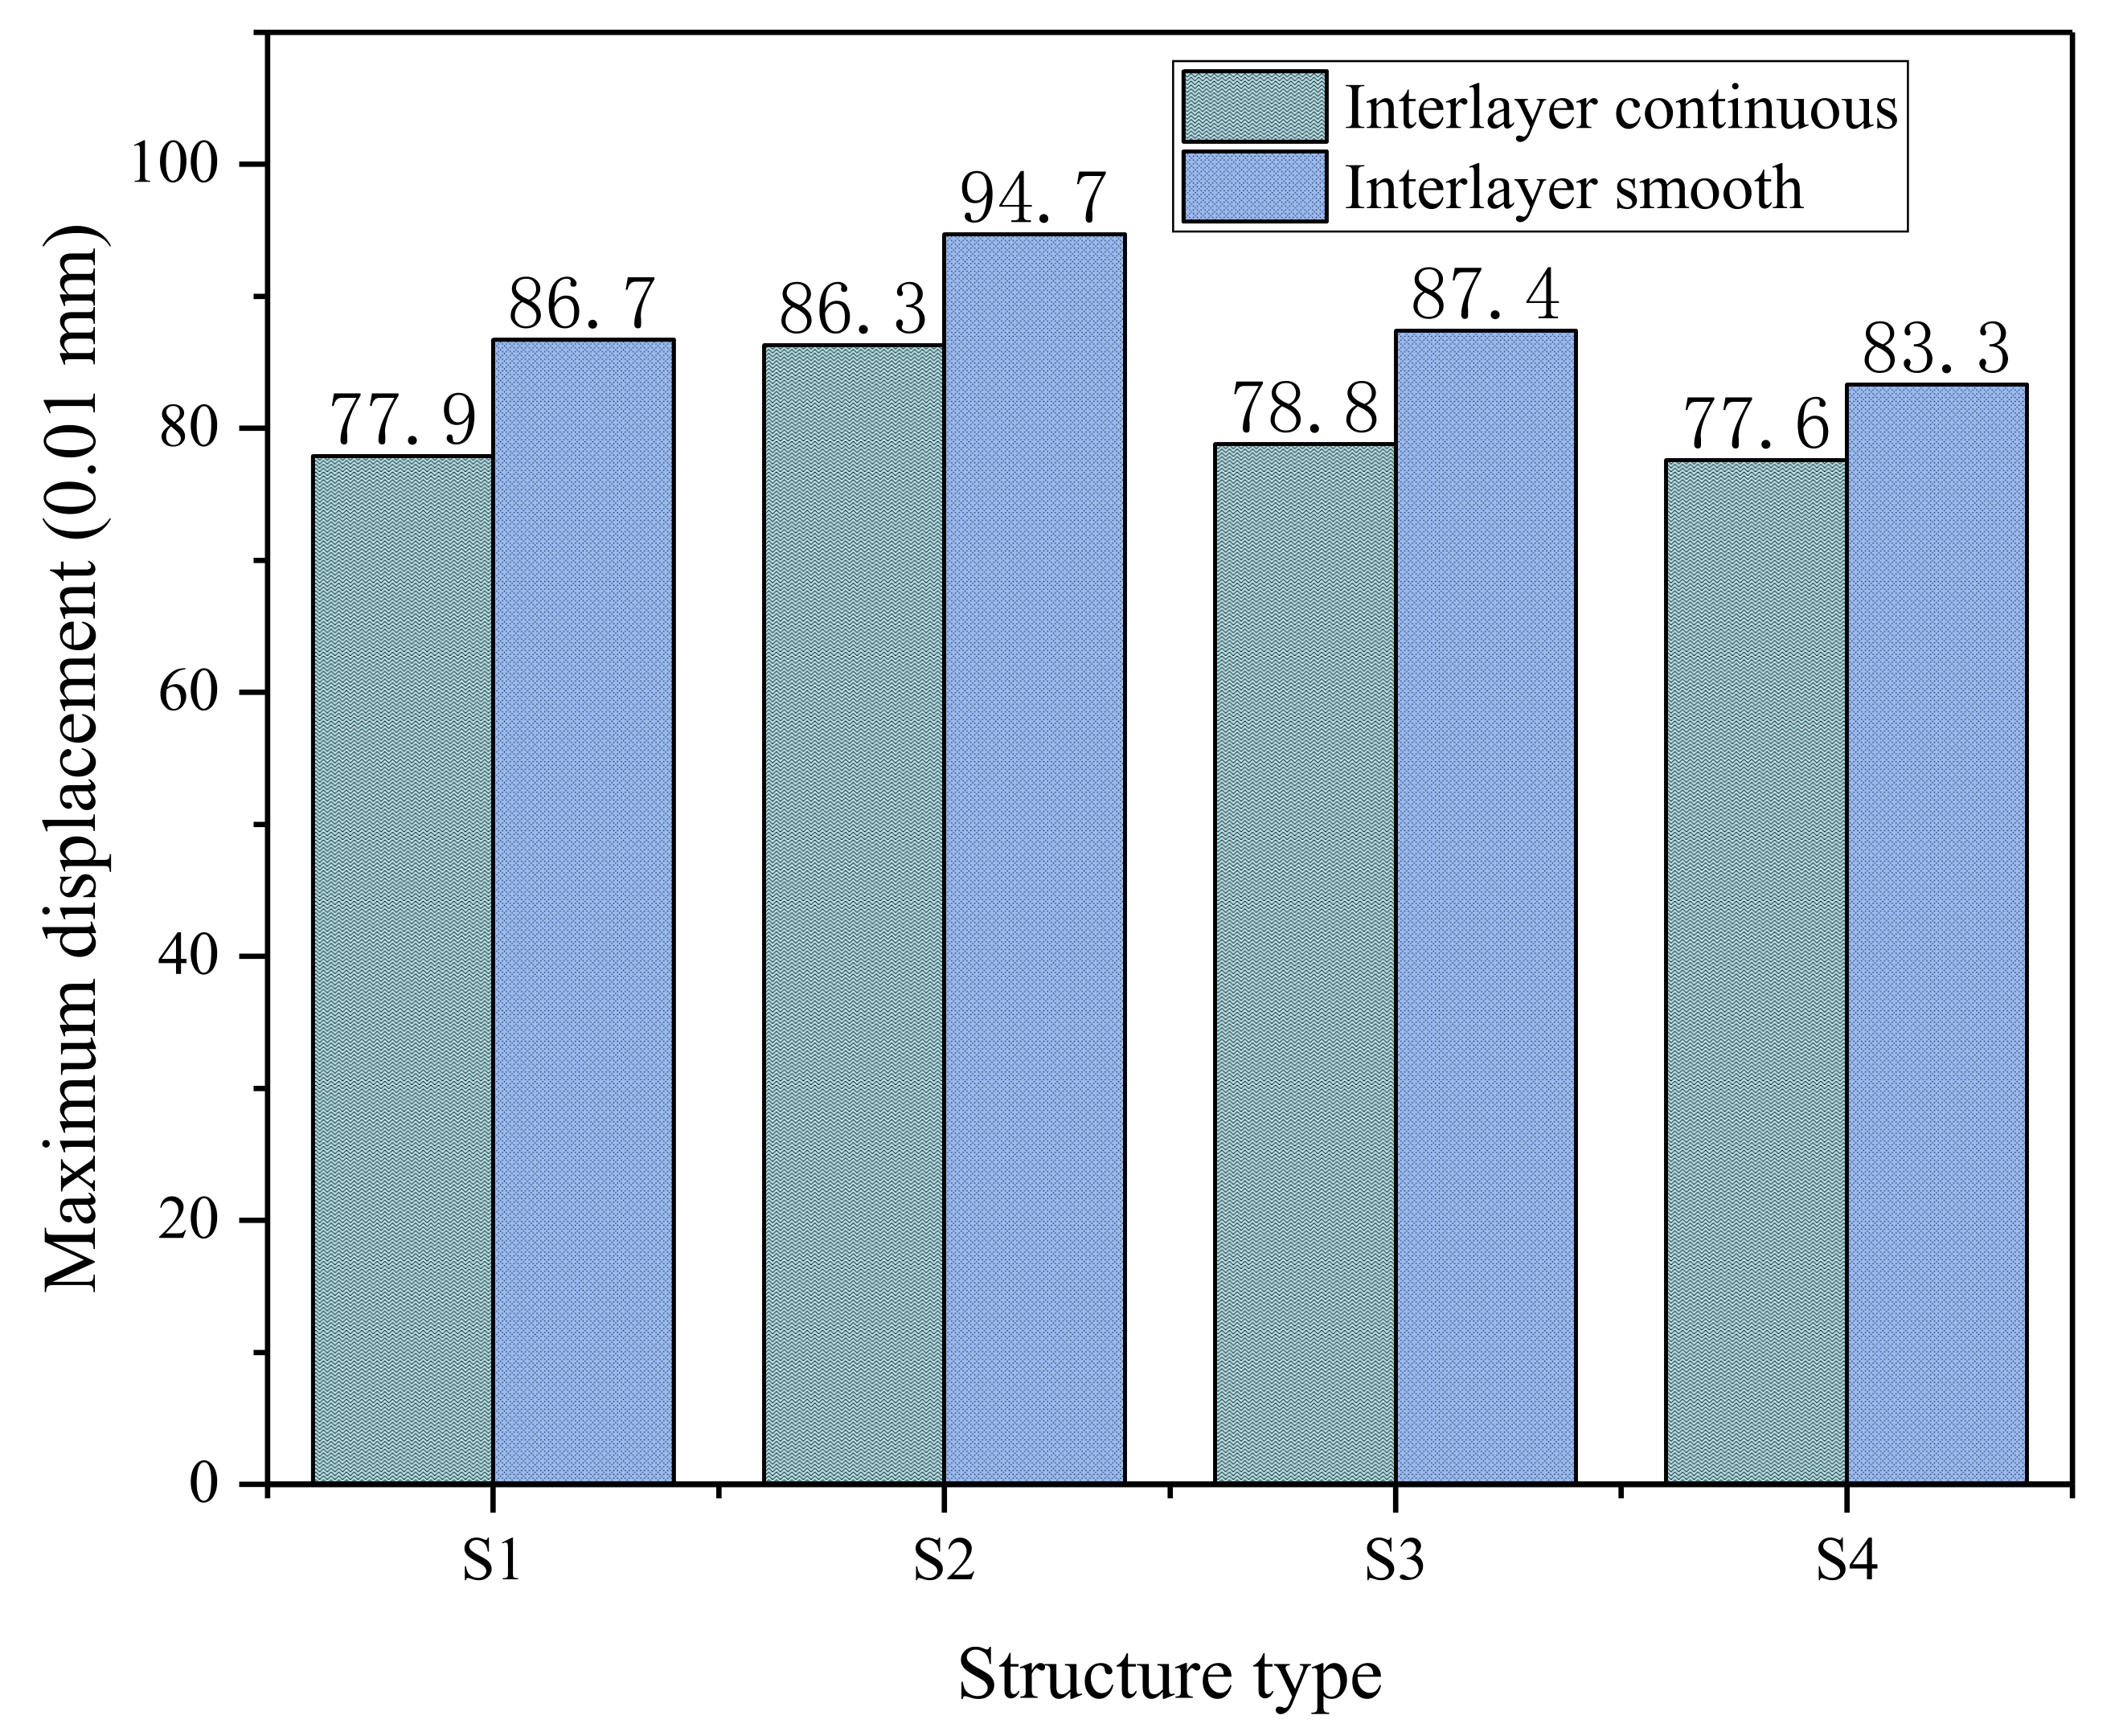
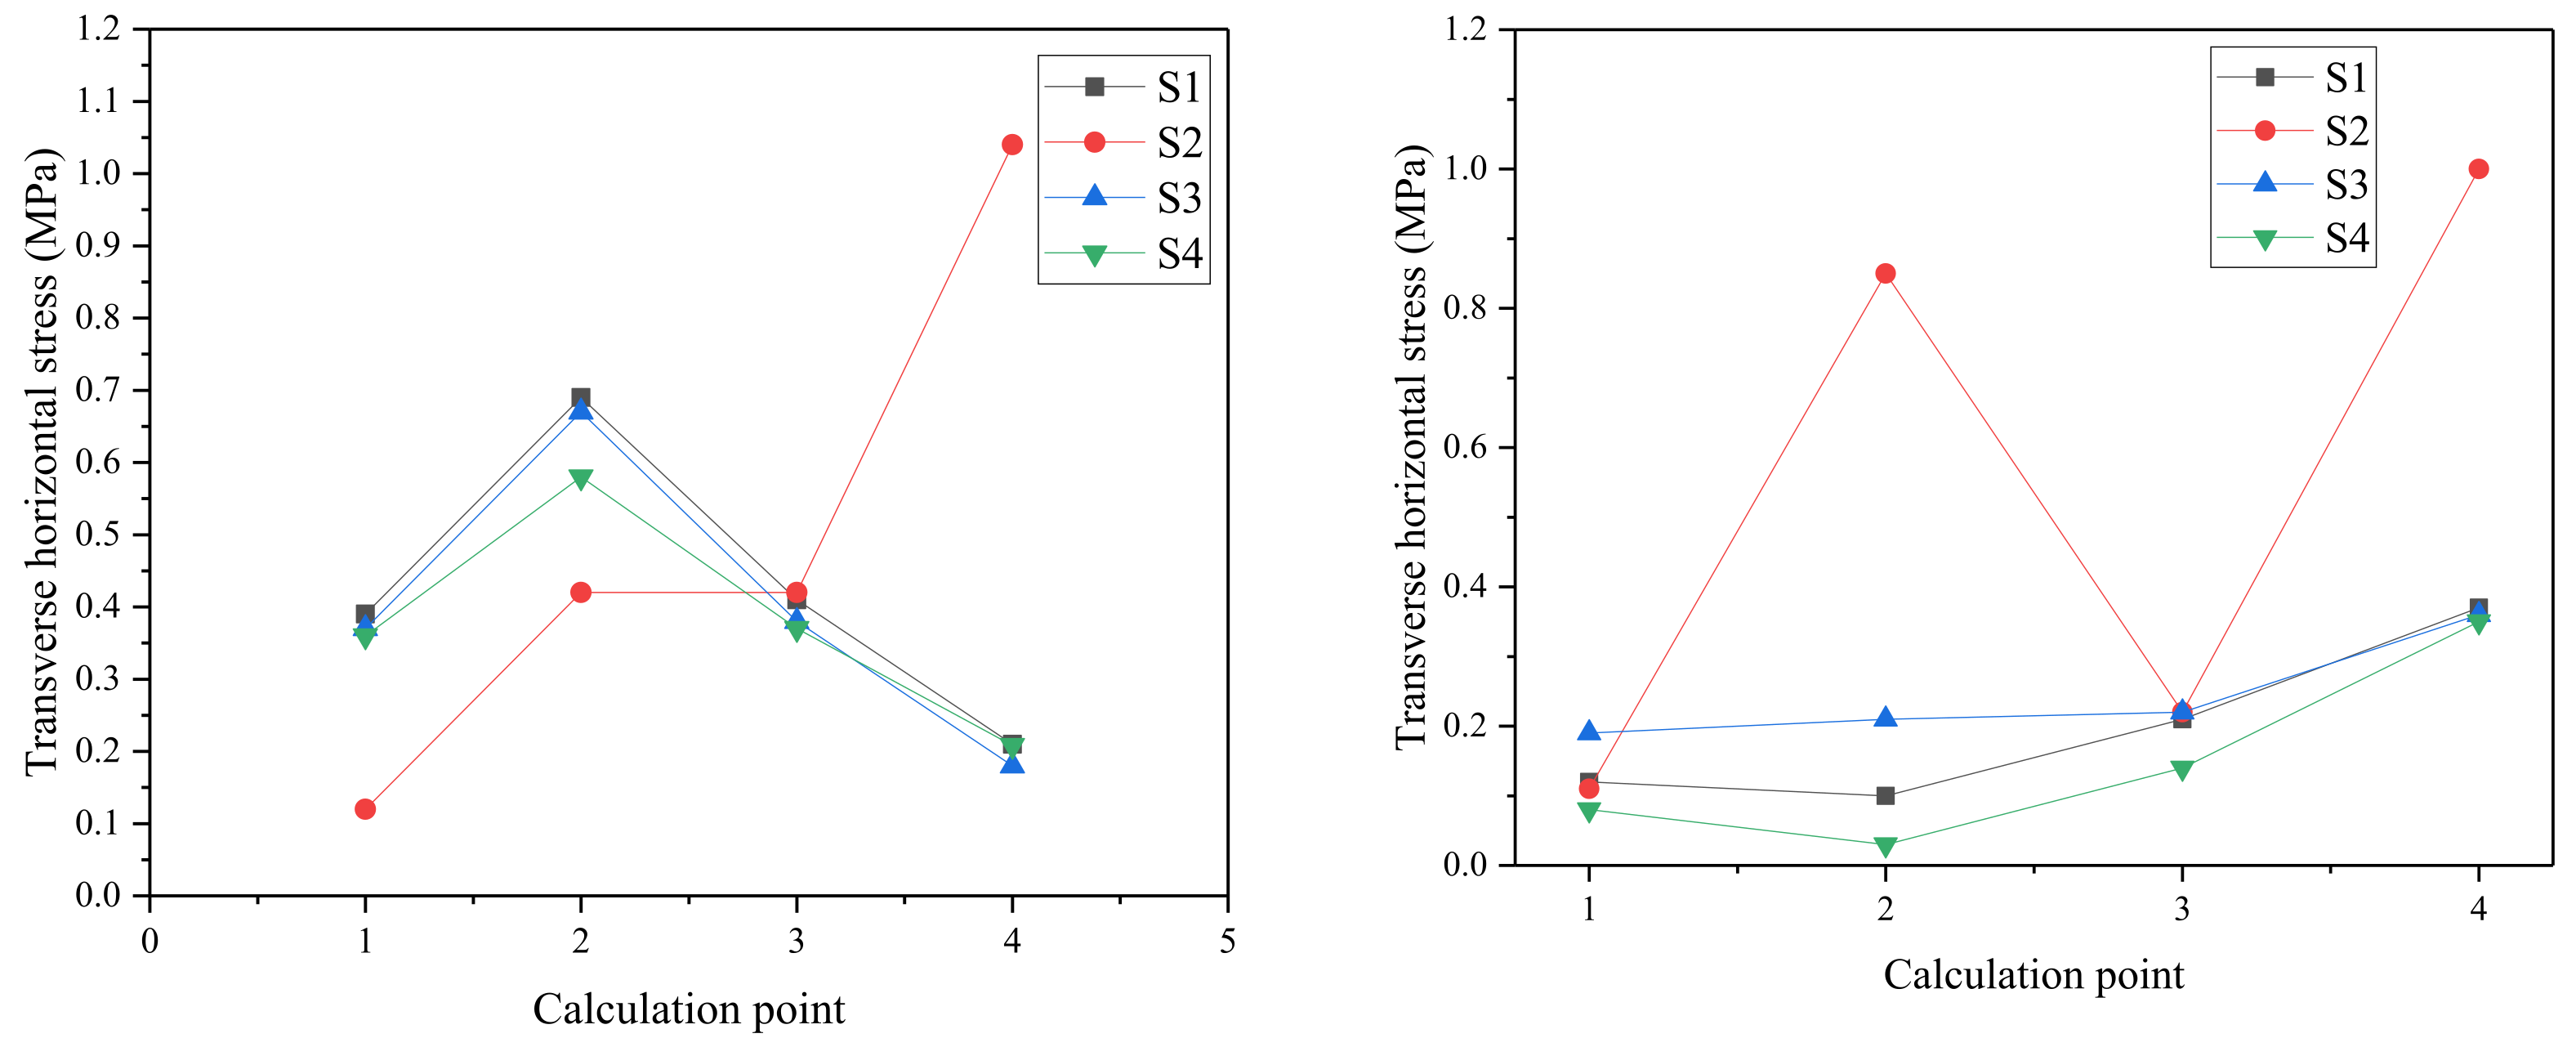
The maximum displacements of the pavement layers of the four structures, with continuous and smooth layers, were determined as shown in Figure 10. The maximum displacement value refers to the elastic deformation of the pavement layer under a load. With smooth and continuous states between the layers, the maximum displacement values of the four structures were in the order of Structure 2 > Structure 3 > Structure 1 > Structure 4. Elastic deformation is the reflection of the modulus of the pavement mixture. Due to the large modulus of the bridge deck, it provided sufficient support to the asphalt pavement. Therefore, the maximum vertical displacement is only a reference index for the service performance of the pavement. We focused more on the plastic cumulative deformation under the pavement load at high temperatures. The horizontal stresses at each calculation point in different directions were calculated under different interlayer states at the bottom of the pavement layer as shown in Figure 11.
When the interlayer was smooth and continuous, the horizontal stress of the transverse bridge of Structure 2 underwent significant variations in the horizontal direction. The stresses at the center under the wheel and the centers of the two wheels were the largest. The stress changes of other structures were similar, and the stresses were in the following order: Structure 3 > Structure 1 > Structure 4. Under the two states of continuous and smooth interlayers, the maximum horizontal stress at the bottom of the pavement layer along the bridge appeared at the center of the single wheel. In the continuous state, the horizontal stress of Structure 2 was the smallest. When the connection between the waterproof layer of Structure 2 and the bottom of the pavement layer failed, the horizontal stress increased to twice the original value.
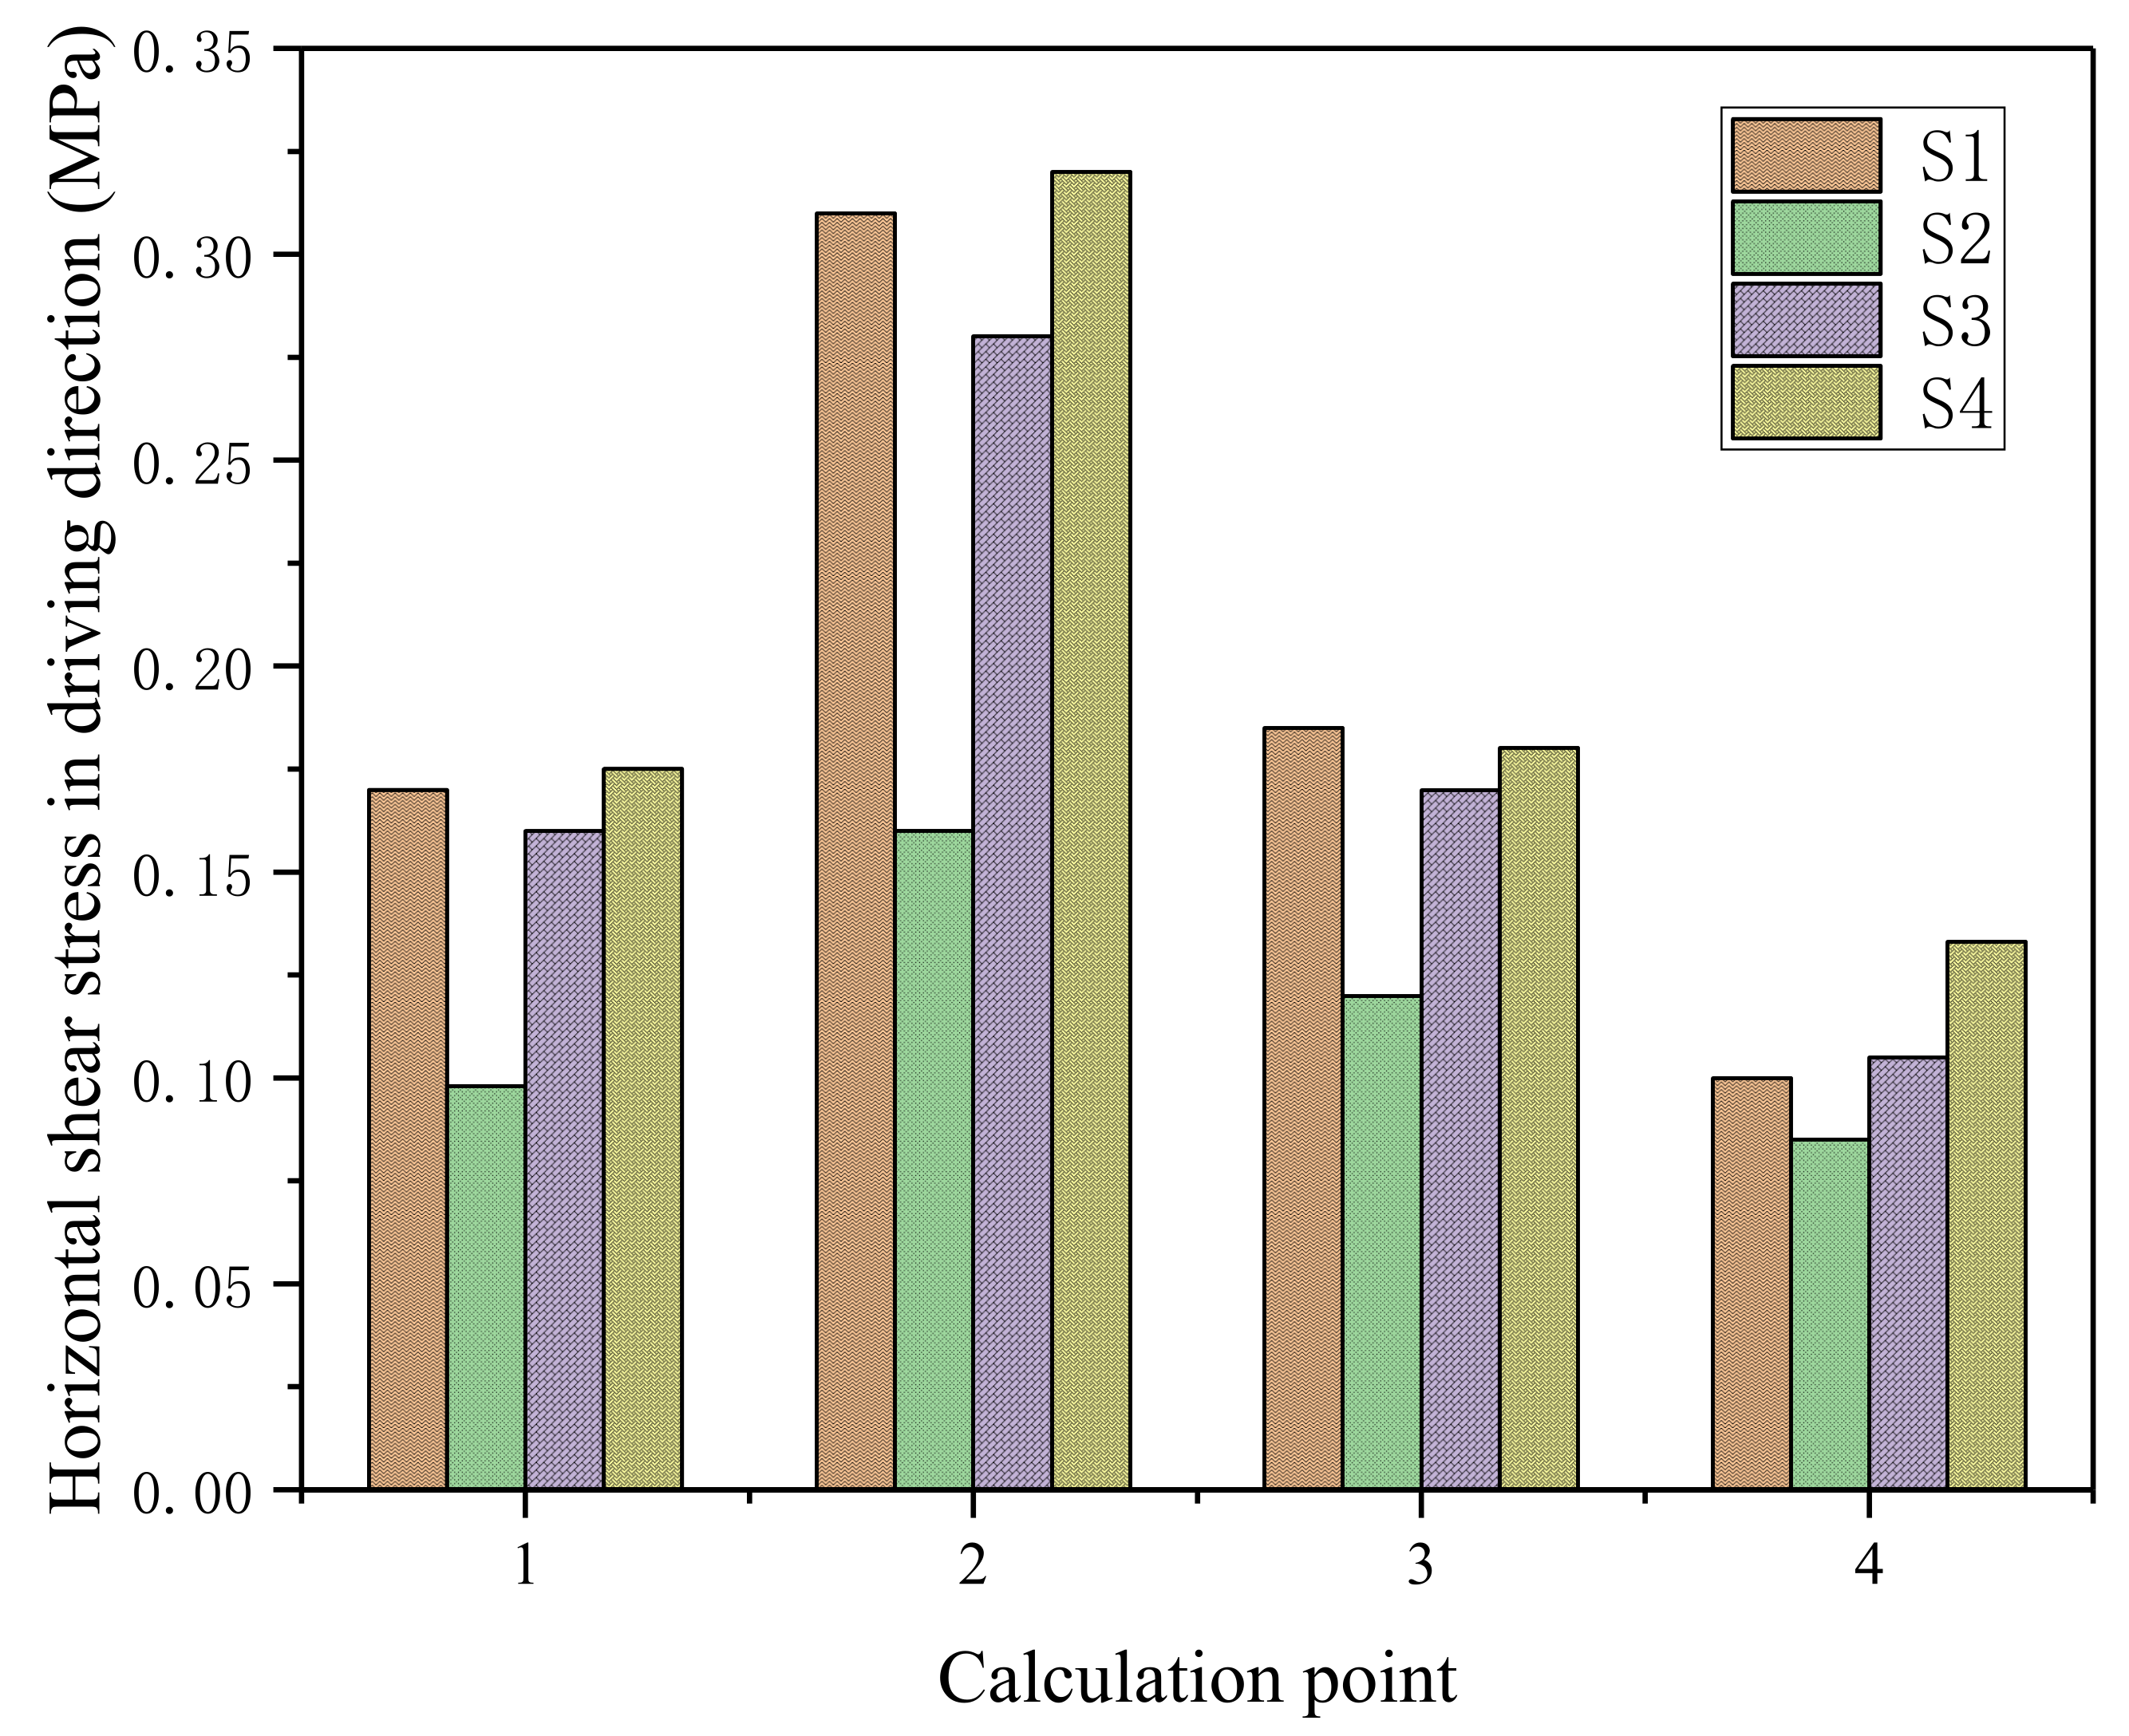
The model was used to calculate the horizontal shear stress at each point along the bridge to the bottom of the layer as shown in Figure 12. The maximum horizontal shear stress at the bottom of the pavement layer appeared at calculation point 2, and the shear stresses were in the order of Structure 4 > Structure 1 > Structure 3 > Structure 2. In this paper, it is considered that the magnitude of the shear stress reflects the requirements for the shear resistance between layers. The closer the moduli of the pavement structure and the bridge deck, the stronger the integrity and the higher the load transfer capacity. As a result, the requirements for the treatment of the bottom bonding would be higher.
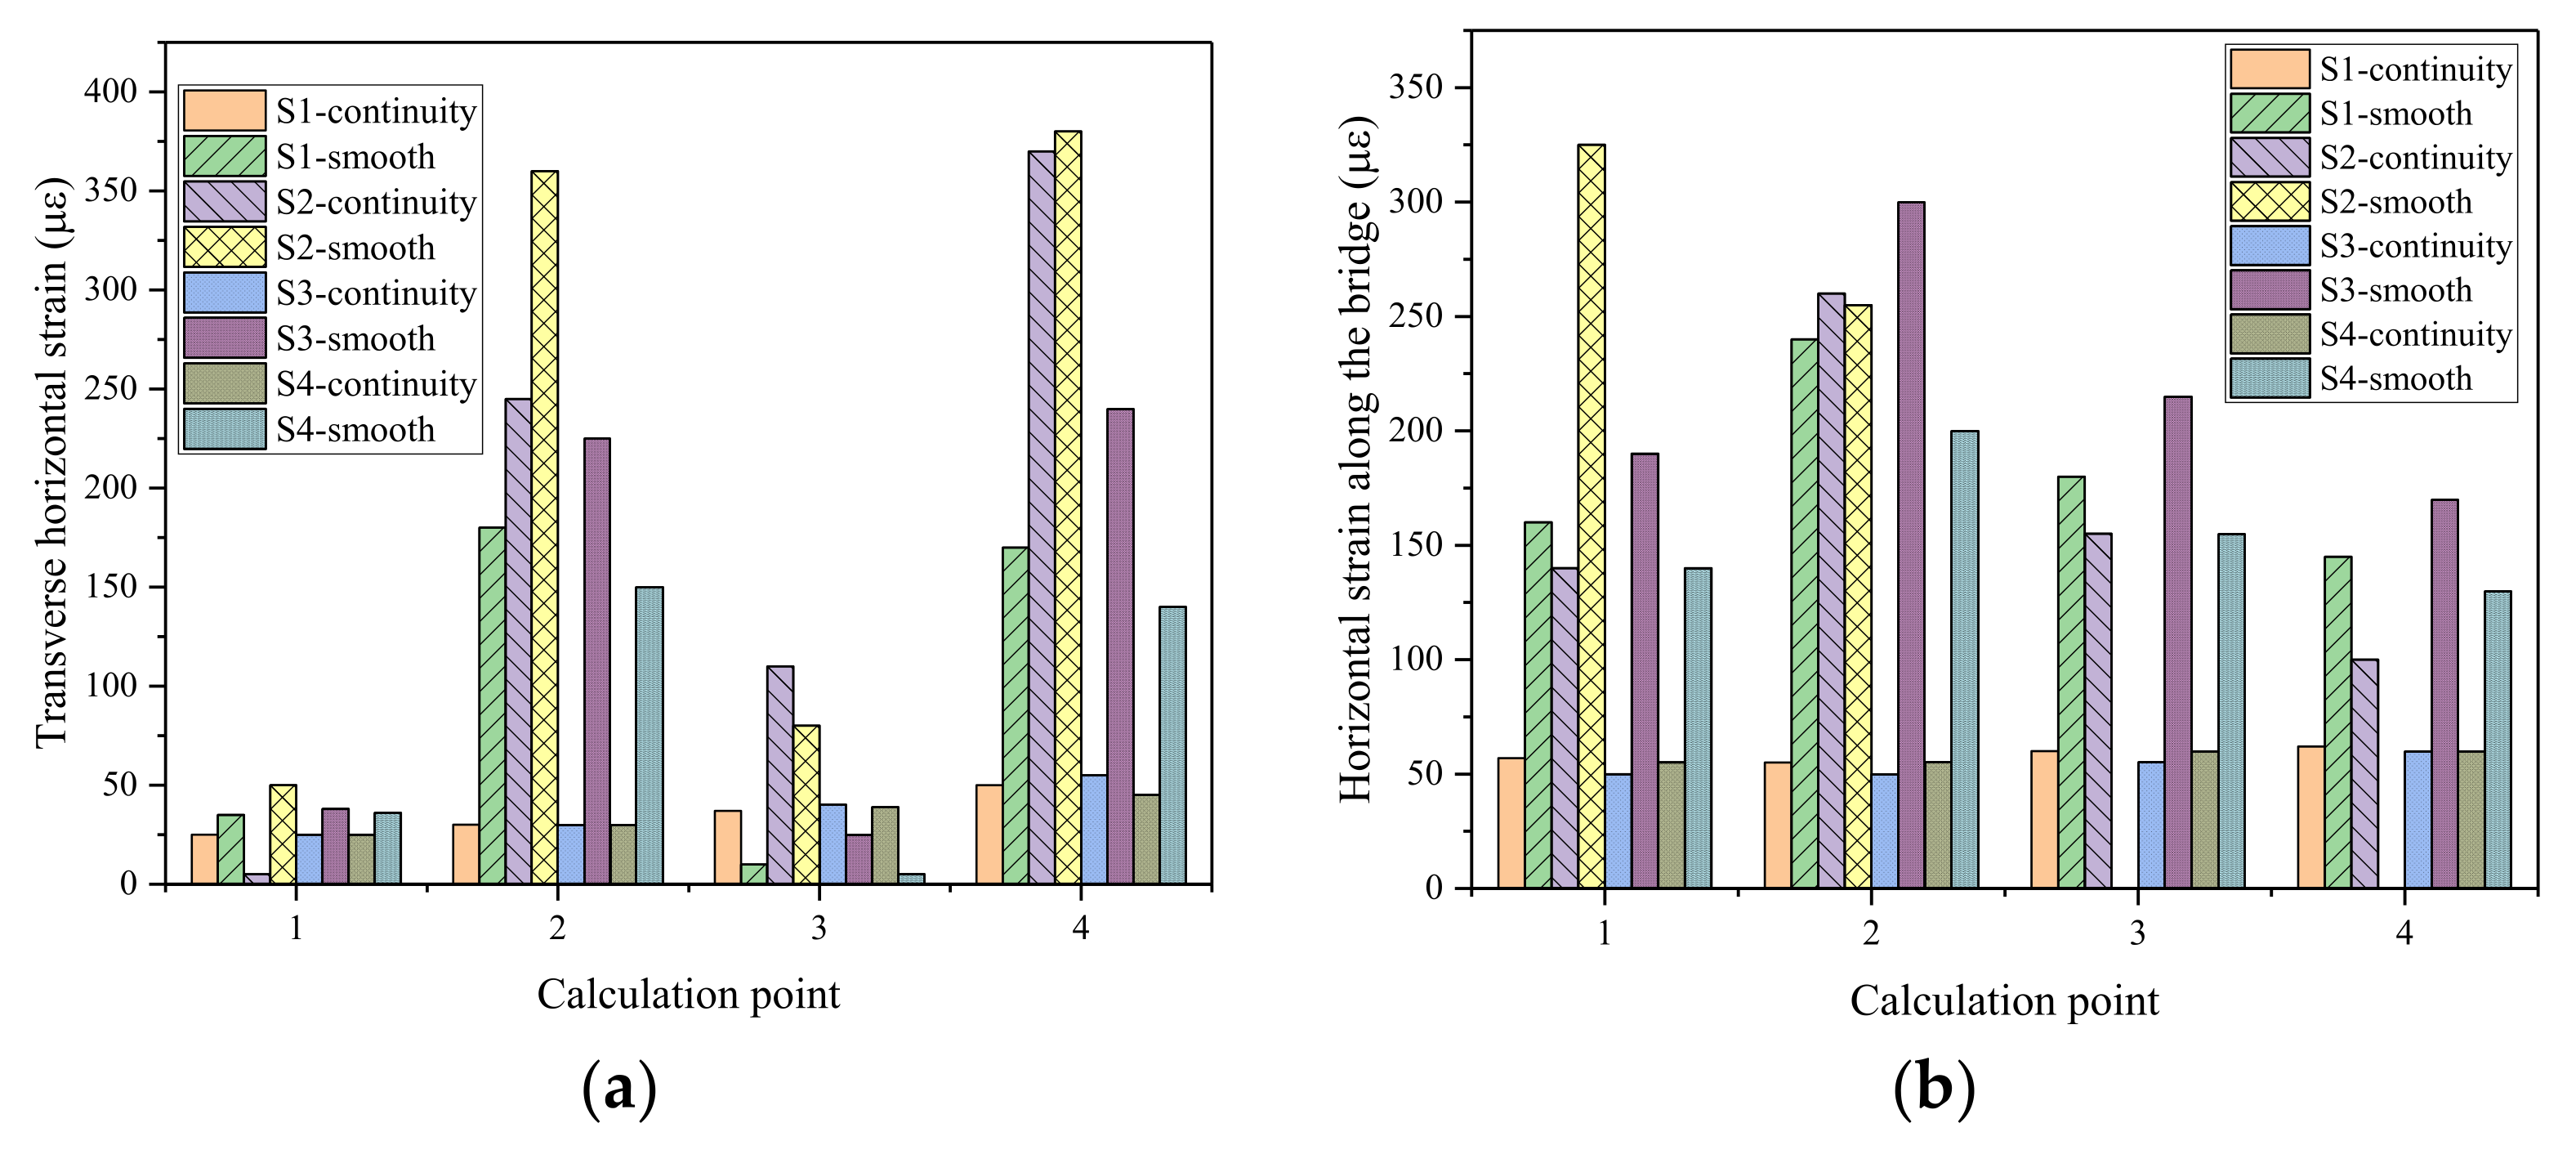
Figure 13 shows the horizontal strain distributions of the pavement structures with continuous and smooth states between layers. The horizontal strain represents the probability of horizontal creep of the pavement under a load. When the interlayer connection state transitioned from continuous to smooth, the horizontal strain at the bottom of the layer increased gradually. When the layers were continuous, the maximum horizontal strain in the transverse bridge direction occurred at the fourth calculation point of Structure 2, that is, at the center of the two wheels, up to 370 με. The maximum horizontal strain along the bridge direction occurred at the second calculation point of Structure 2, that is, at the wheel center, up to 298 με. The horizontal strain of the other three structures in a continuous state was less than 100 με. The main reason was that the modulus of the pavement determined the horizontal deformation at the bottom of the asphalt pavement. The smaller the ratio of the elastic modulus of the cement concrete slab to the modulus of the asphalt concrete pavement (defined as the modulus ratio coefficient n, dimensionless) was, the better the bonding between the bridge deck and the pavement became. The stronger the combined effect of the two was, the lower the load stress was in each component of the pavement system. When the waterproof layer had a certain thickness, the waterproof layer was considered to be a single layer. Under the same horizontal shear stress, the greater the difference between the modulus ratio of the waterproof layer and cement concrete slab, the greater the probability of interlayer dislocation.

3.2.2. Calculation and Analysis of the Interlayer Stability of Pavement with Different Interlayer Connection States and Load Characteristics

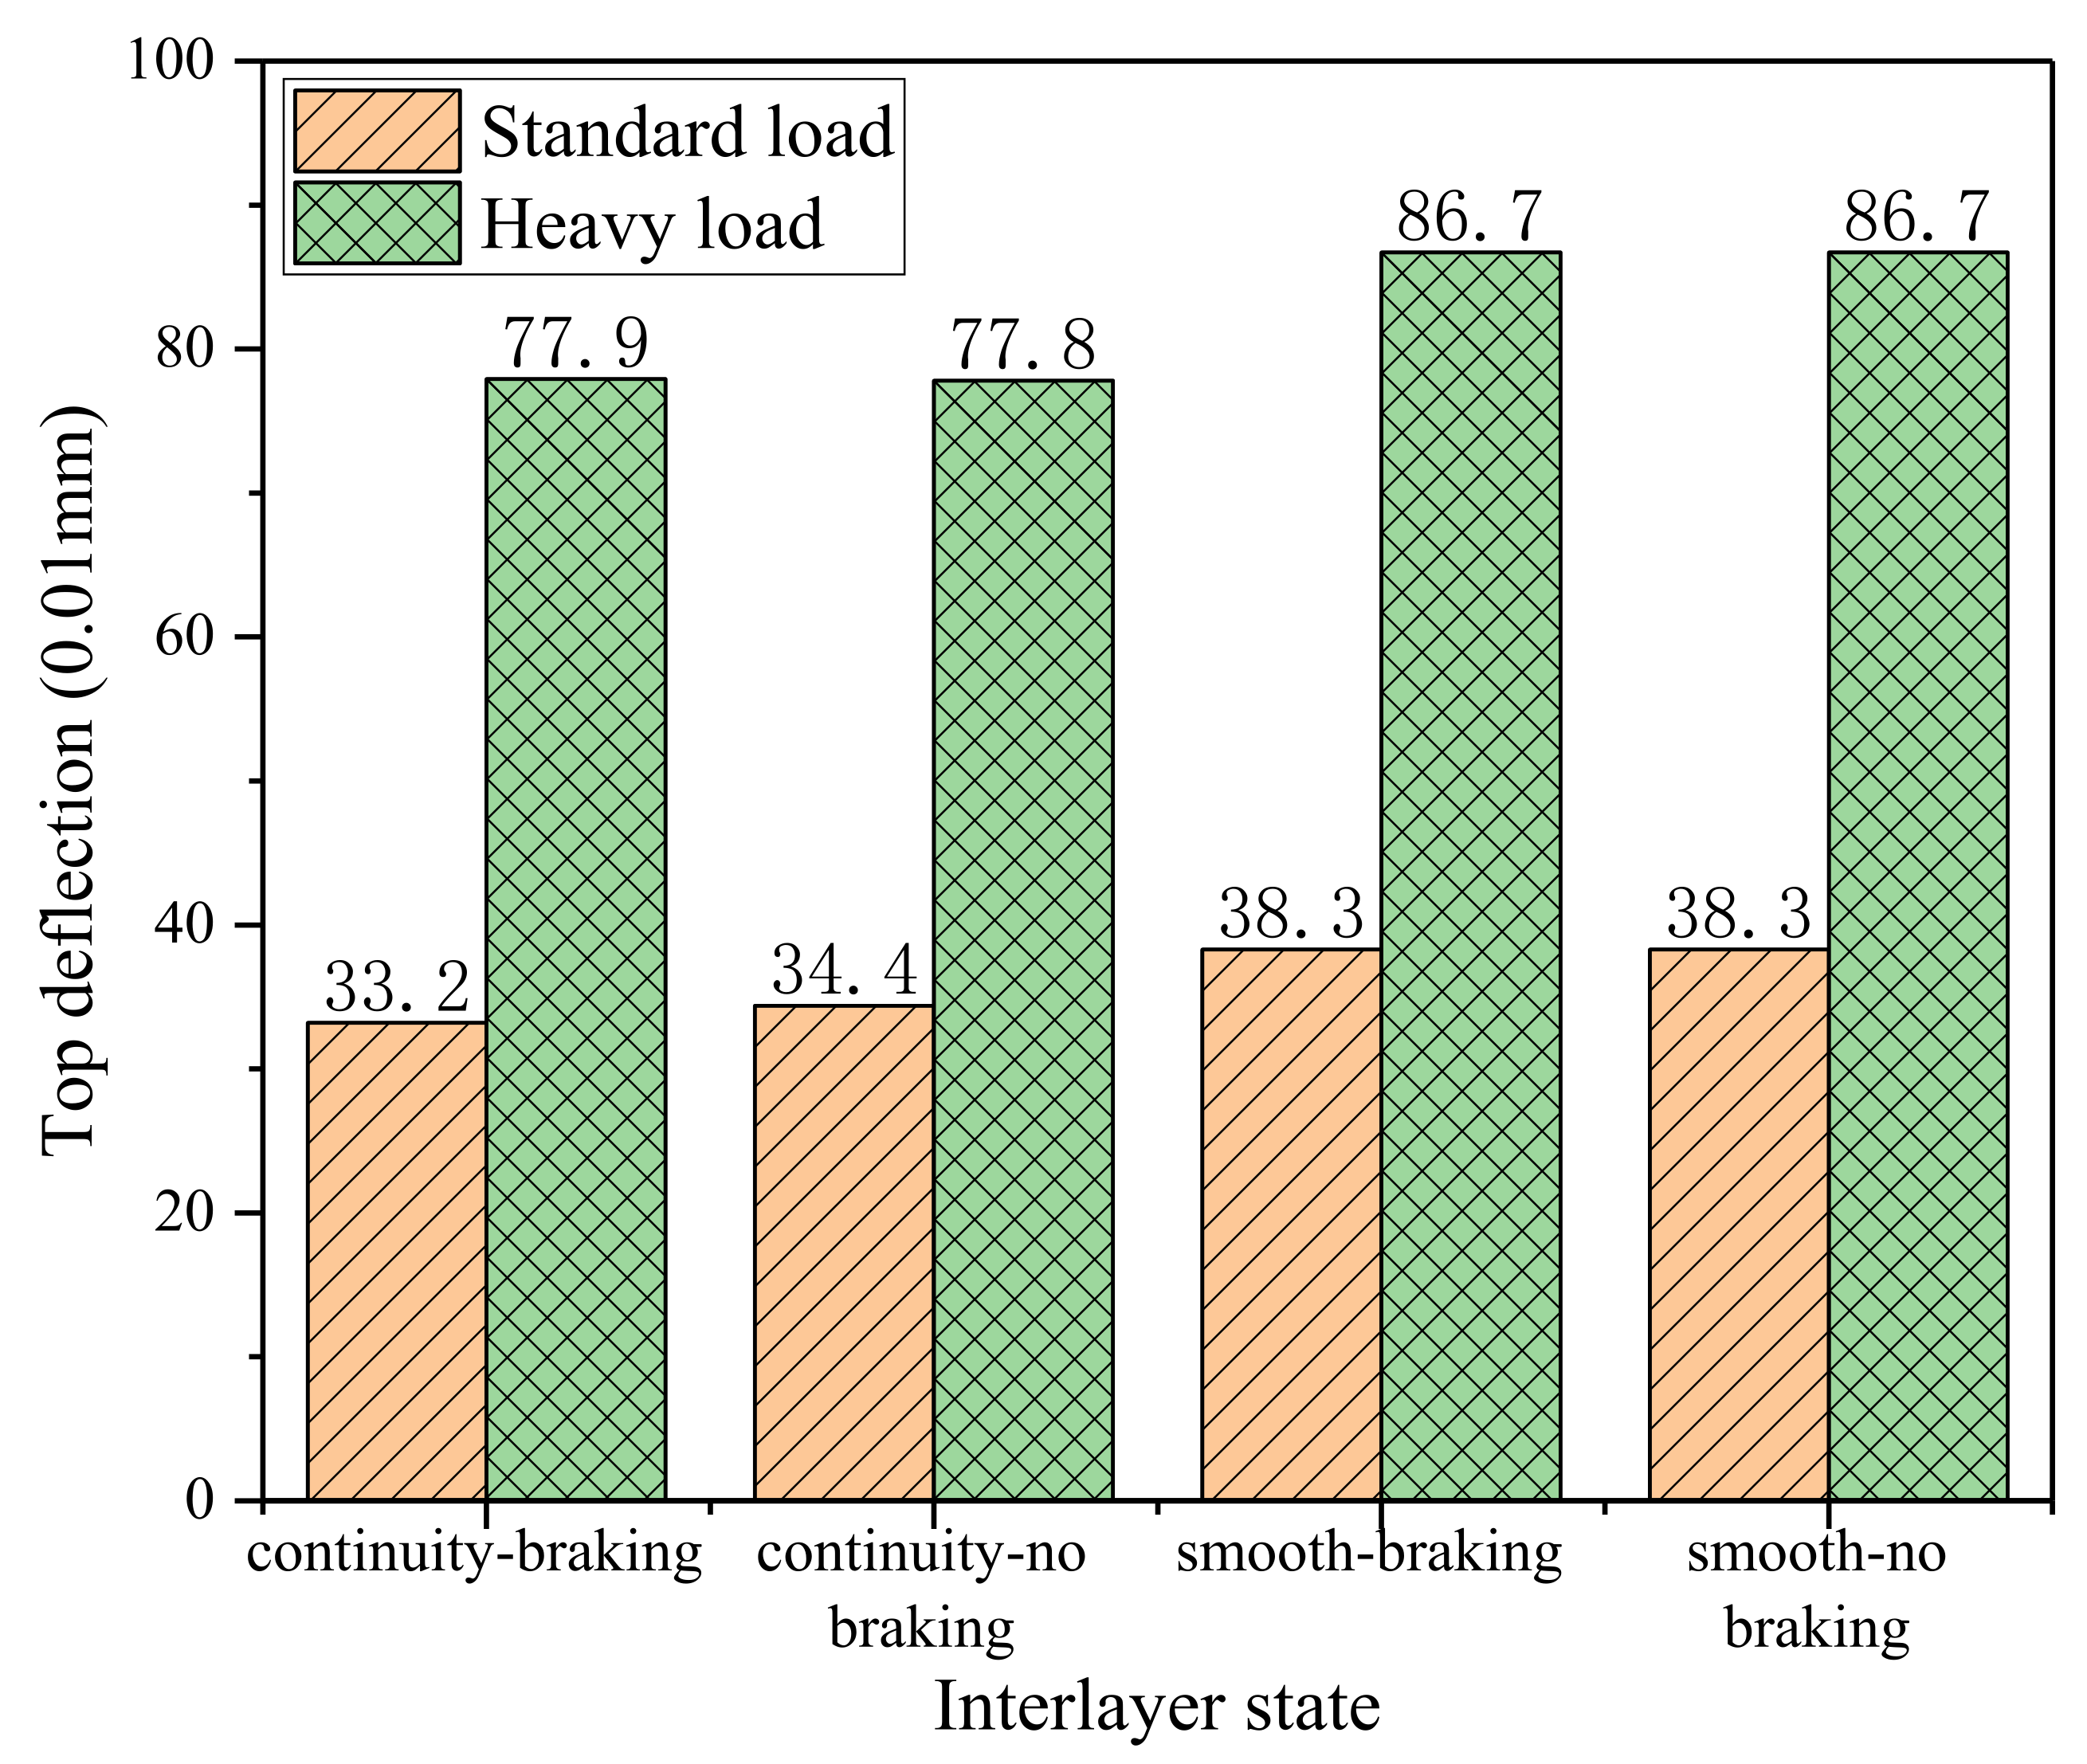
The finite element model was used to calculate the stress–strain states of different load characteristics, different interlayer contact states, and different interlayer bonding states when the pavement thickness was 8 cm. Figure 14 shows the deflection of the pavement top surface under different interlayer contact states when the axle load was standard and heavy. The load impacted the overall deformation of the beam and the slab. Under a heavy load, the deflection value of the top surface increased to twice the original value, and the interlayer connection and braking state had little impact.
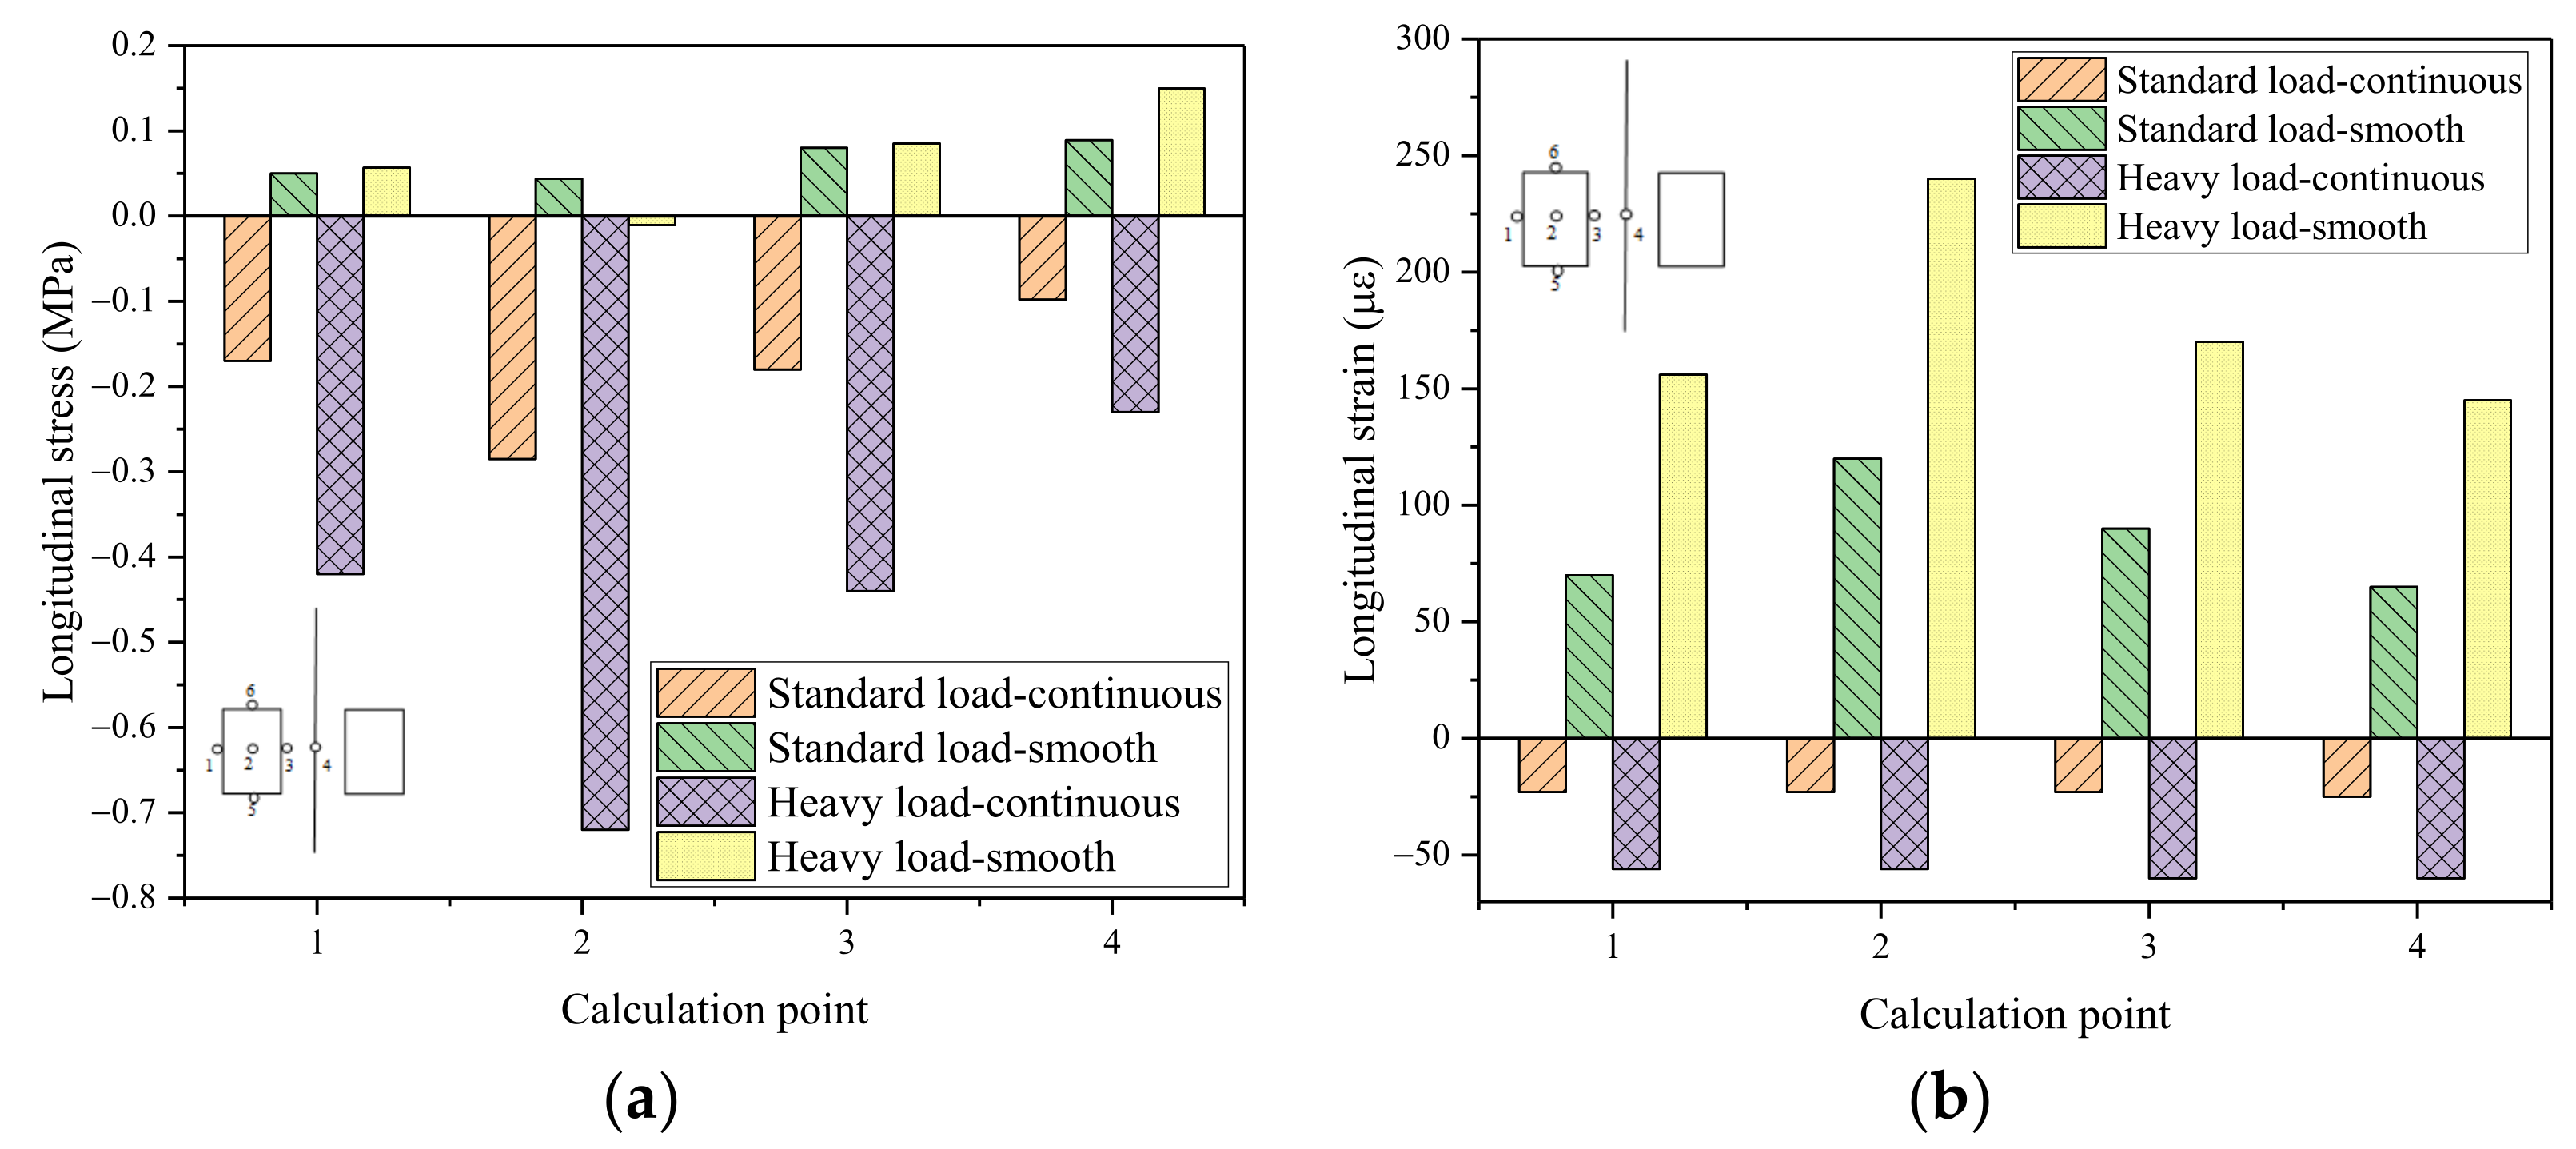
Figure 15 shows the changes in the stress along the bridge and the strain across the bridge at each calculation point under the two contact states of continuous and smooth interlayers. In the continuous interlayer state, compressive stress formed along the bridge direction, and the maximum value appeared under the wheel. In the smooth state, tensile stress formed, and the maximum value appeared between the two wheels. The load characteristics significantly affected the compressive stress along the bridge, which increased 2.5 times under a heavy load but had no significant effect on the tensile stress, which was mainly related to the braking force. The stress–strain states at the same point were similar, but the ranges of the increase and decrease in the relative value of the same type were different. However, the ranges of the increase and decrease in the relative value of the same type were poor.
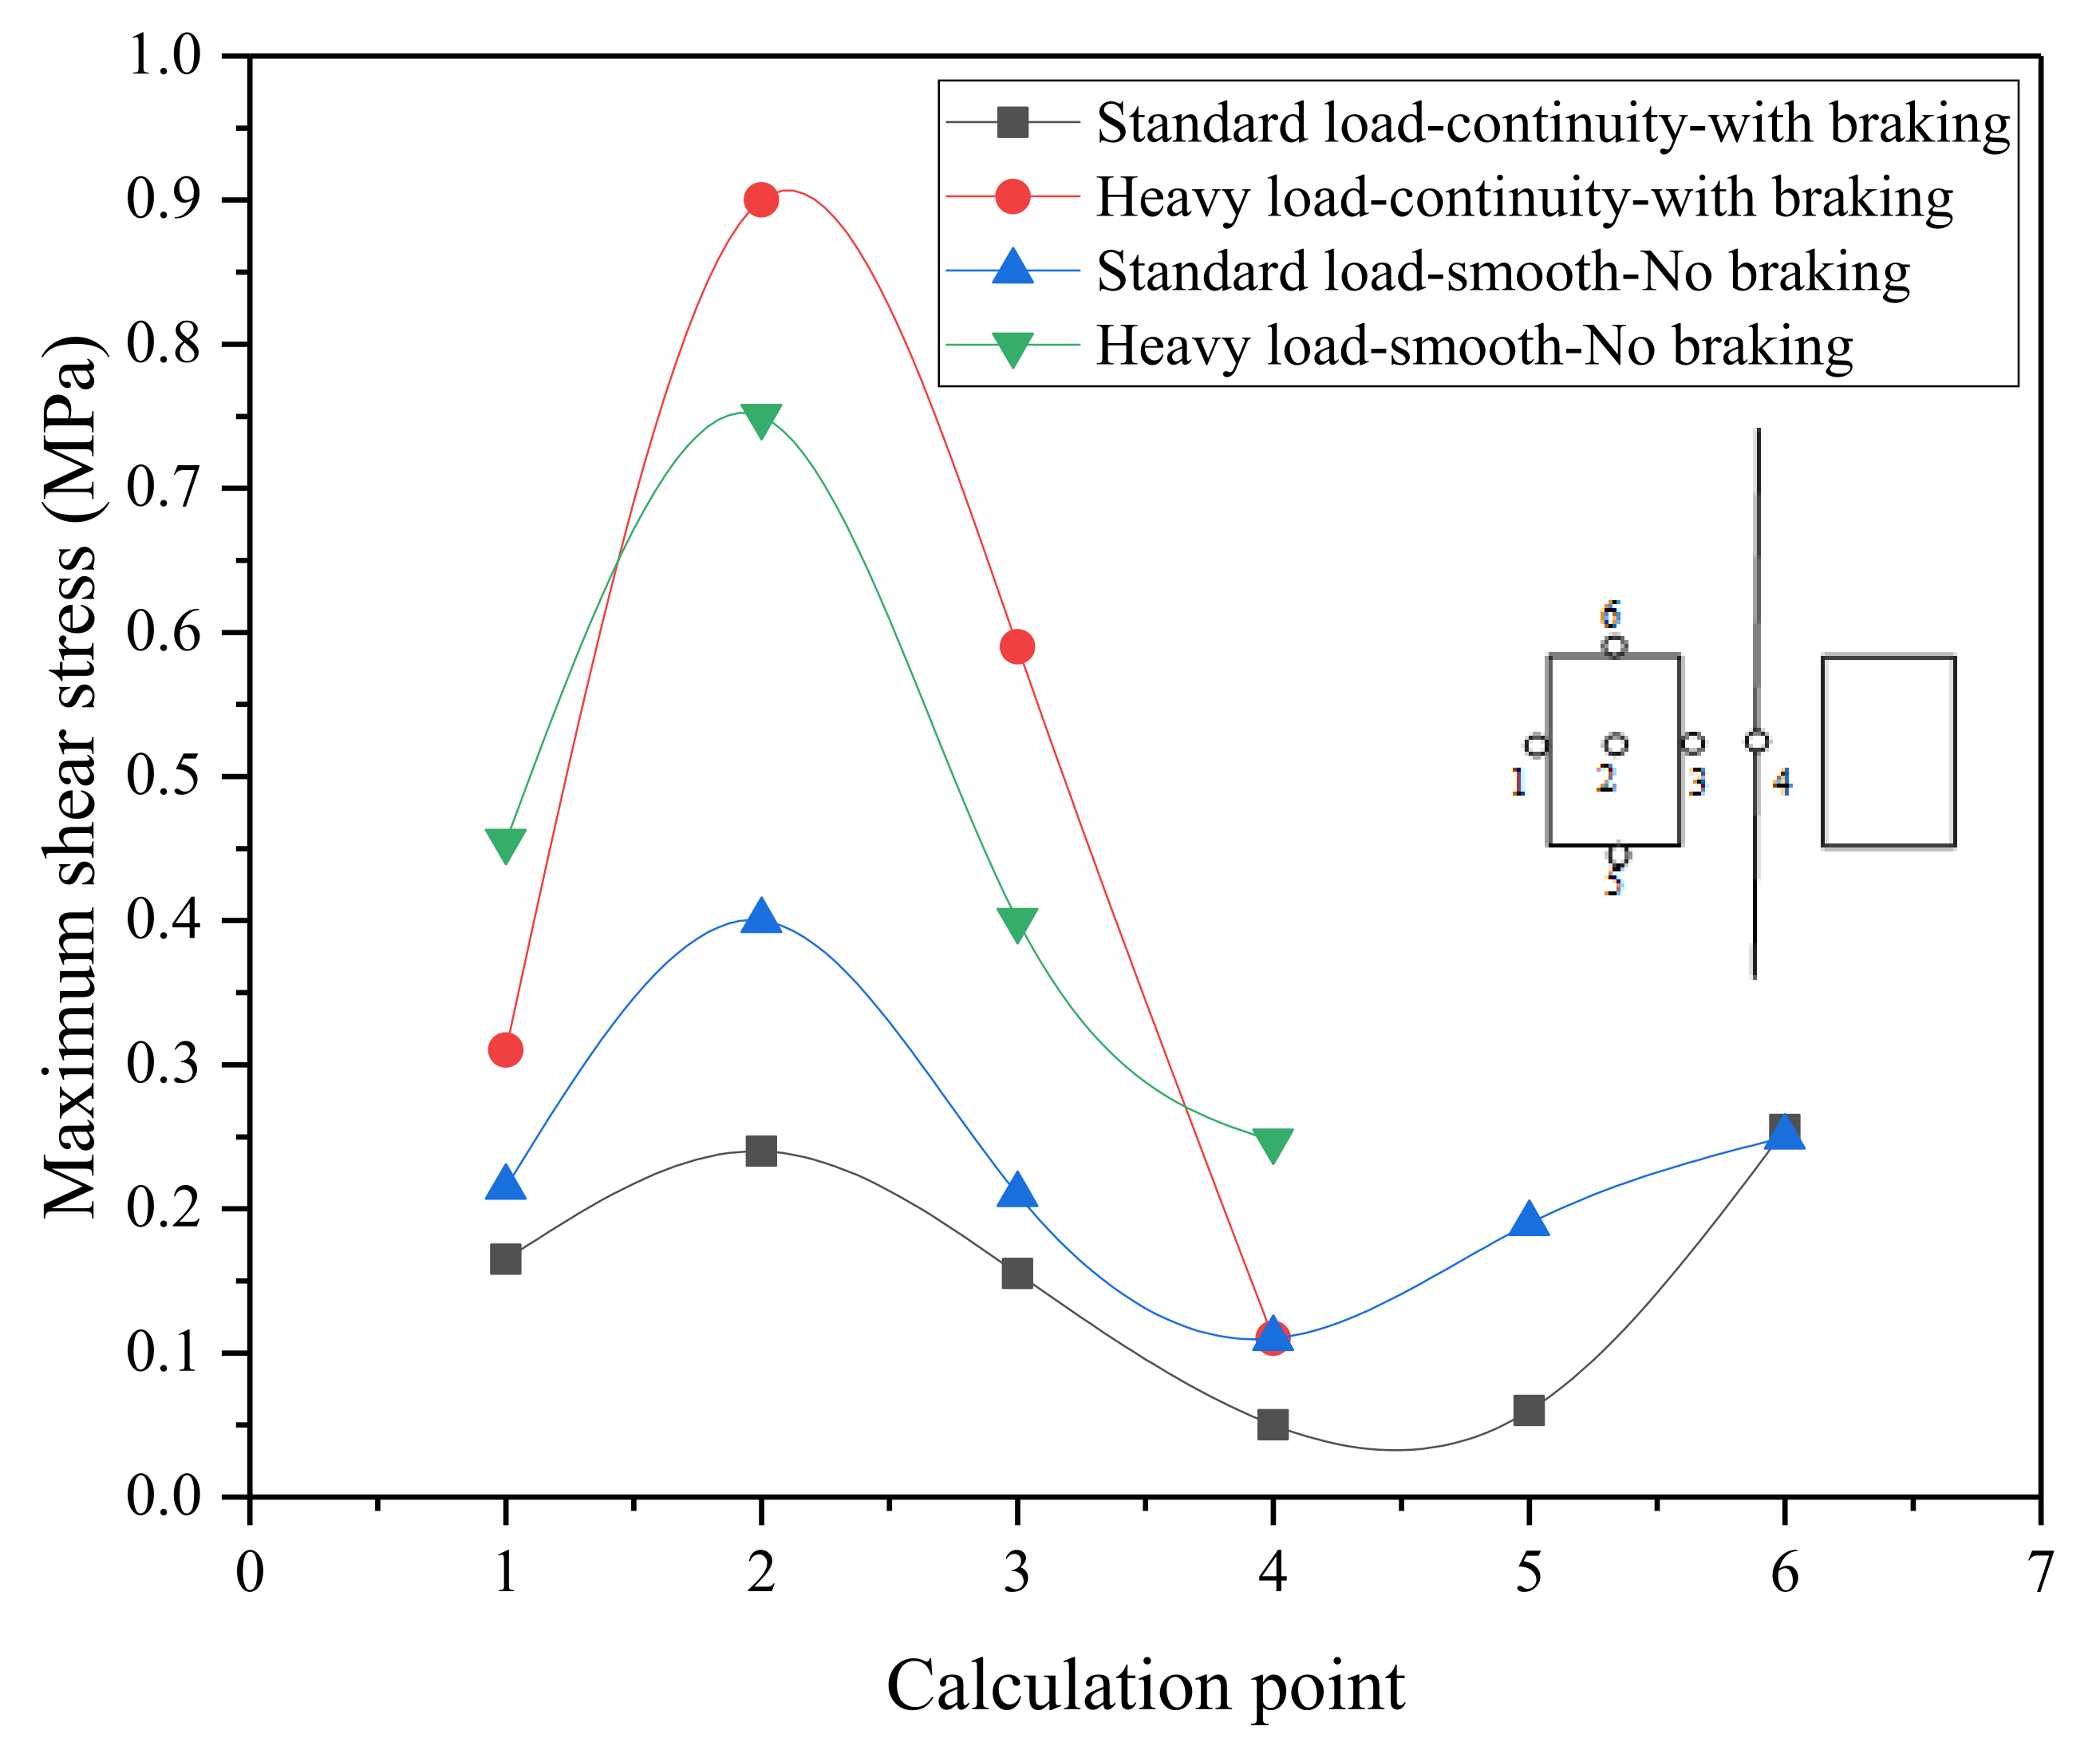
Figure 16 shows the results of the maximum shear stress at each point for different interlayer connection states and load characteristics. The maximum shear stress appeared at the lower center of the single wheel. Under a standard load, when the continuous state changed to a smooth state, the stress state increased by 60%, and under a heavy load, the stress state increased by 20%. Under continuous and smooth conditions, the shear stress under a heavy load was four and two times higher than that under a standard load, respectively.

3.2.3. Calculation and Analysis of Interlayer Stability under Variable Thickness Conditions

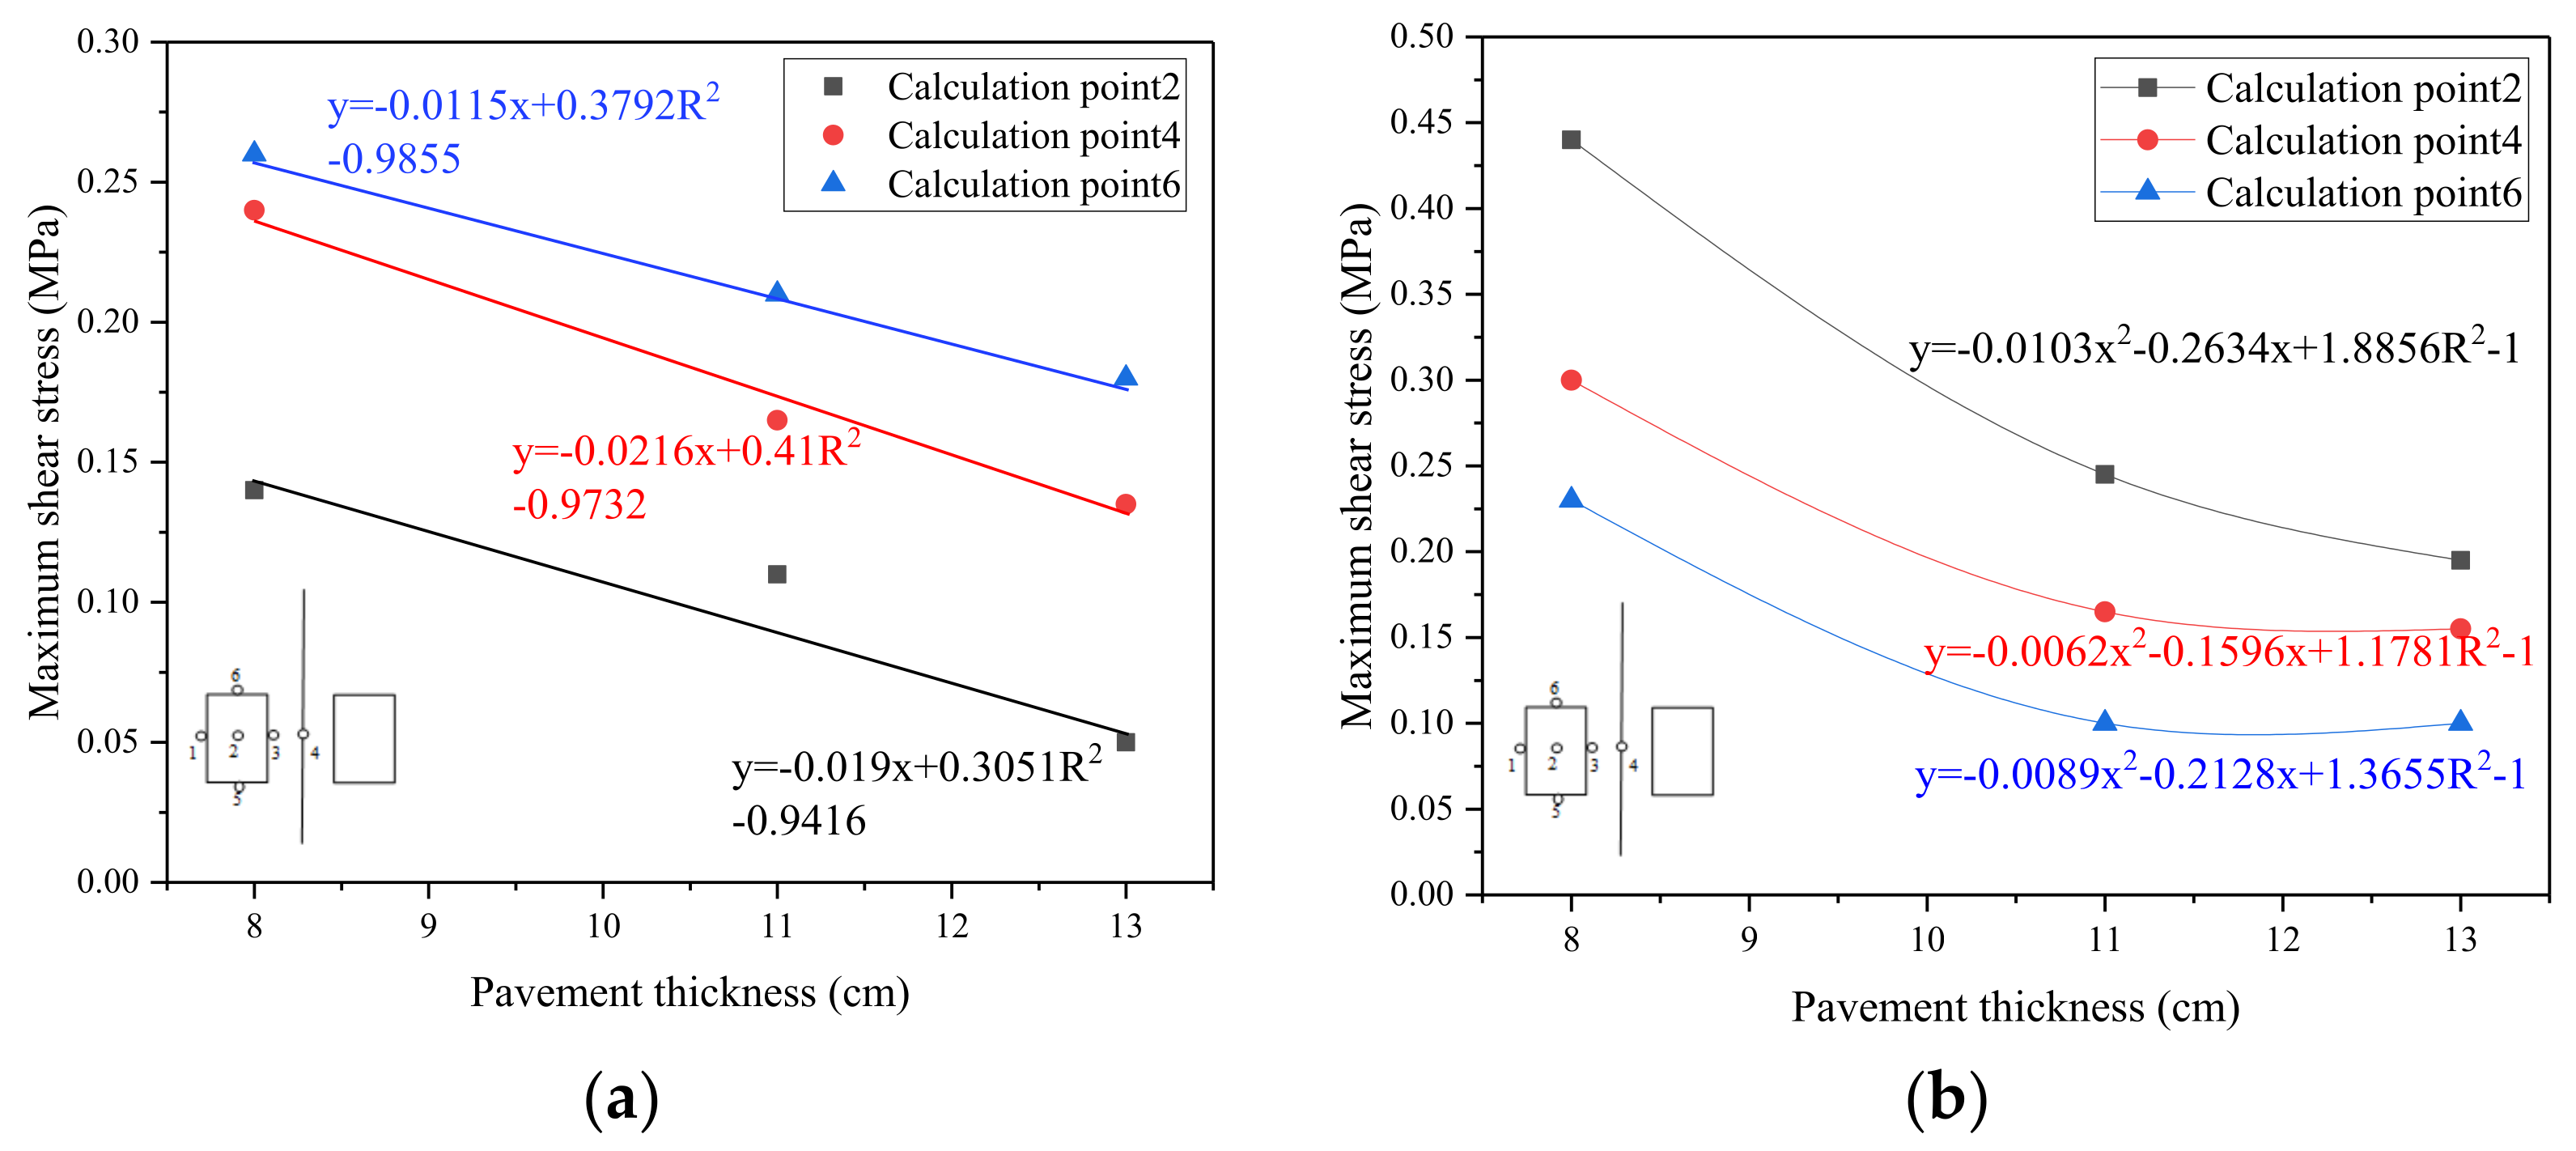
The established finite element model was used to calculate the maximum shear stress along the bridge at different points when the pavement thickness was 8, 11, and 13 cm as shown in Figure 17.
As shown in Figure 17a,b, the maximum shear stress of both structures decreased with the increase in thickness. The maximum shear stress of Structure 1 decreased linearly with the increase in thickness, and the position of the maximum shear stress of each thickness occurred at point 6. The maximum shear stress of Structure 2 decreased nonlinearly with the increase in thickness, and the decreasing range decreased with the increase in thickness. These results show that an increase in the pavement’s thickness can effectively reduce the maximum shear stress of the pavement. Under the same thickness, the maximum shear stress at each point of Structure 2 is greater than that of Structure 1, indicating that the structural combination of “asphalt mortar + SMA-13” has better shear resistance than that of “rubber asphalt + protective plate + SMA-13”. The structural design of “asphalt mortar + SMA-13” can better adapt to the impact of heavy traffic.
As shown in Figure 17c,d, the maximum along-bridge shear stress of Structure 1 and Structure 2 occurred at point 6, and the stress direction of point 5 changed accordingly. With the increase in thickness, the second point, that is, the center under the wheel, had a large amount of attenuation. Under the thickness of 11–13 cm, the stresses basically coincided. This phenomenon indicates that there was a limit to the pavement’s thickness. The internal stress will not change significantly after the thickness increases to a fixed value.

4. Influence of the Waterproof Leveling Layer on the Stress of Pavement

A cement concrete beam section with a length of 6 m, a width of 11 m, and a height of 2.5 m was selected for analysis. The extreme tension of the bridge deck pavement was selected as the basis for the pavement design. The maximum negative bending moment obtained in the bridge structure calculation was located in the root area of the bridge tower. Thus, it was assumed that the maximum reverse deflection of the beam section with a length of 6 m was 1 mm.
Two pavement structure schemes were adopted to analyze the stress state of each pavement layer. Structure 1 was a 6 cm cement concrete leveling layer + 5 cm coarse grain asphalt concrete + 4 cm medium grain asphalt concrete. Structure 2 was 5 cm anti-fatigue asphalt concrete + 6 cm coarse grain asphalt concrete + 4 cm medium grain asphalt concrete. In the initial stage of Structure 1, because the cement concrete layer’s cement slurry was well bonded to the bridge deck, the interlayer was assumed to be completely continuous. There was no treatment between the asphalt concrete layer and the leveling layer, which was assumed to be completely smooth. Complete continuity was assumed between the asphalt concrete layers. Structure 2 was considered to examine the bonding treatment between layers, and each layer was assumed to be completely continuous. In addition, both sides of the concrete box girder were in a free state, and all degrees of freedom were constrained at both ends.
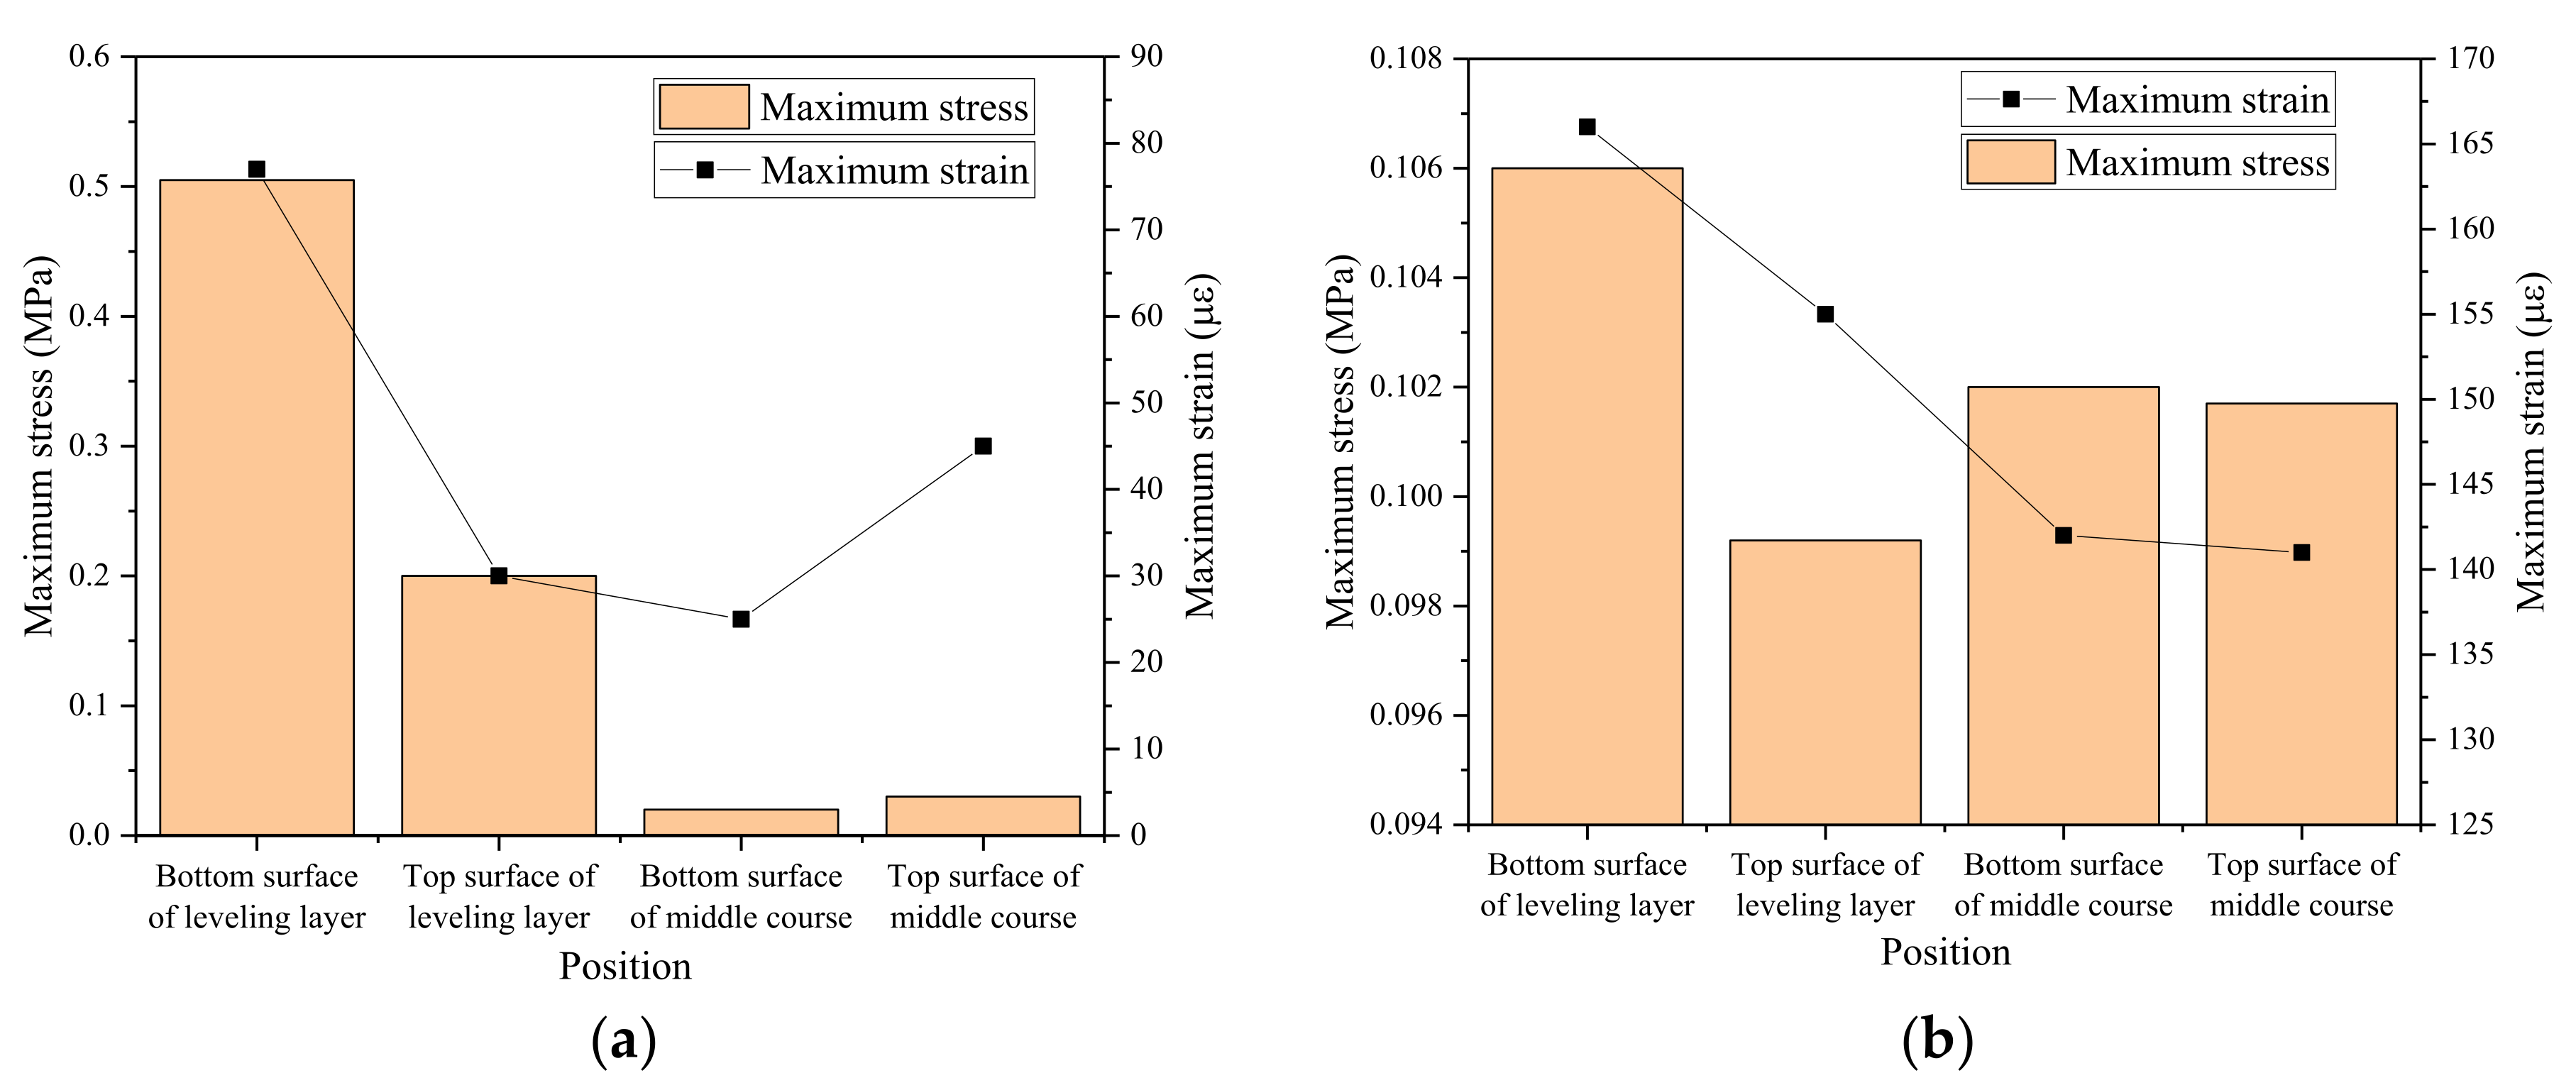
The calculation results of the two pavement structures are shown in Figure 18, which shows the maximum stress and strain of each structural layer. The maximum tensile stress and maximum shear stress of the cement concrete leveling layer of Structure 1 were much greater than those of the lower layer of Structure 2. The tensile and shear strains of the asphalt concrete layer of Structure 2 were large. In Structure 1, due to the high strength of the leveling layer, it bore large tensile and shear stresses, and the upper asphalt concrete layer bore less stress.

5. Influence of the Impermeable Structural Layer on the Stress of Pavement

Biot deduced a three-dimensional consolidation equation that accurately reflects the relationship between void pressure dissipation and soil skeleton deformation from the basic equation of a continuous medium in 1840 and established the Biot consolidation theory. Based on this theory, we used the COMSOL finite element software to establish a model of the bridge deck pavement structure for numerical analysis.

5.1. COMSOL Finite Element Pore Water Pressure Verification

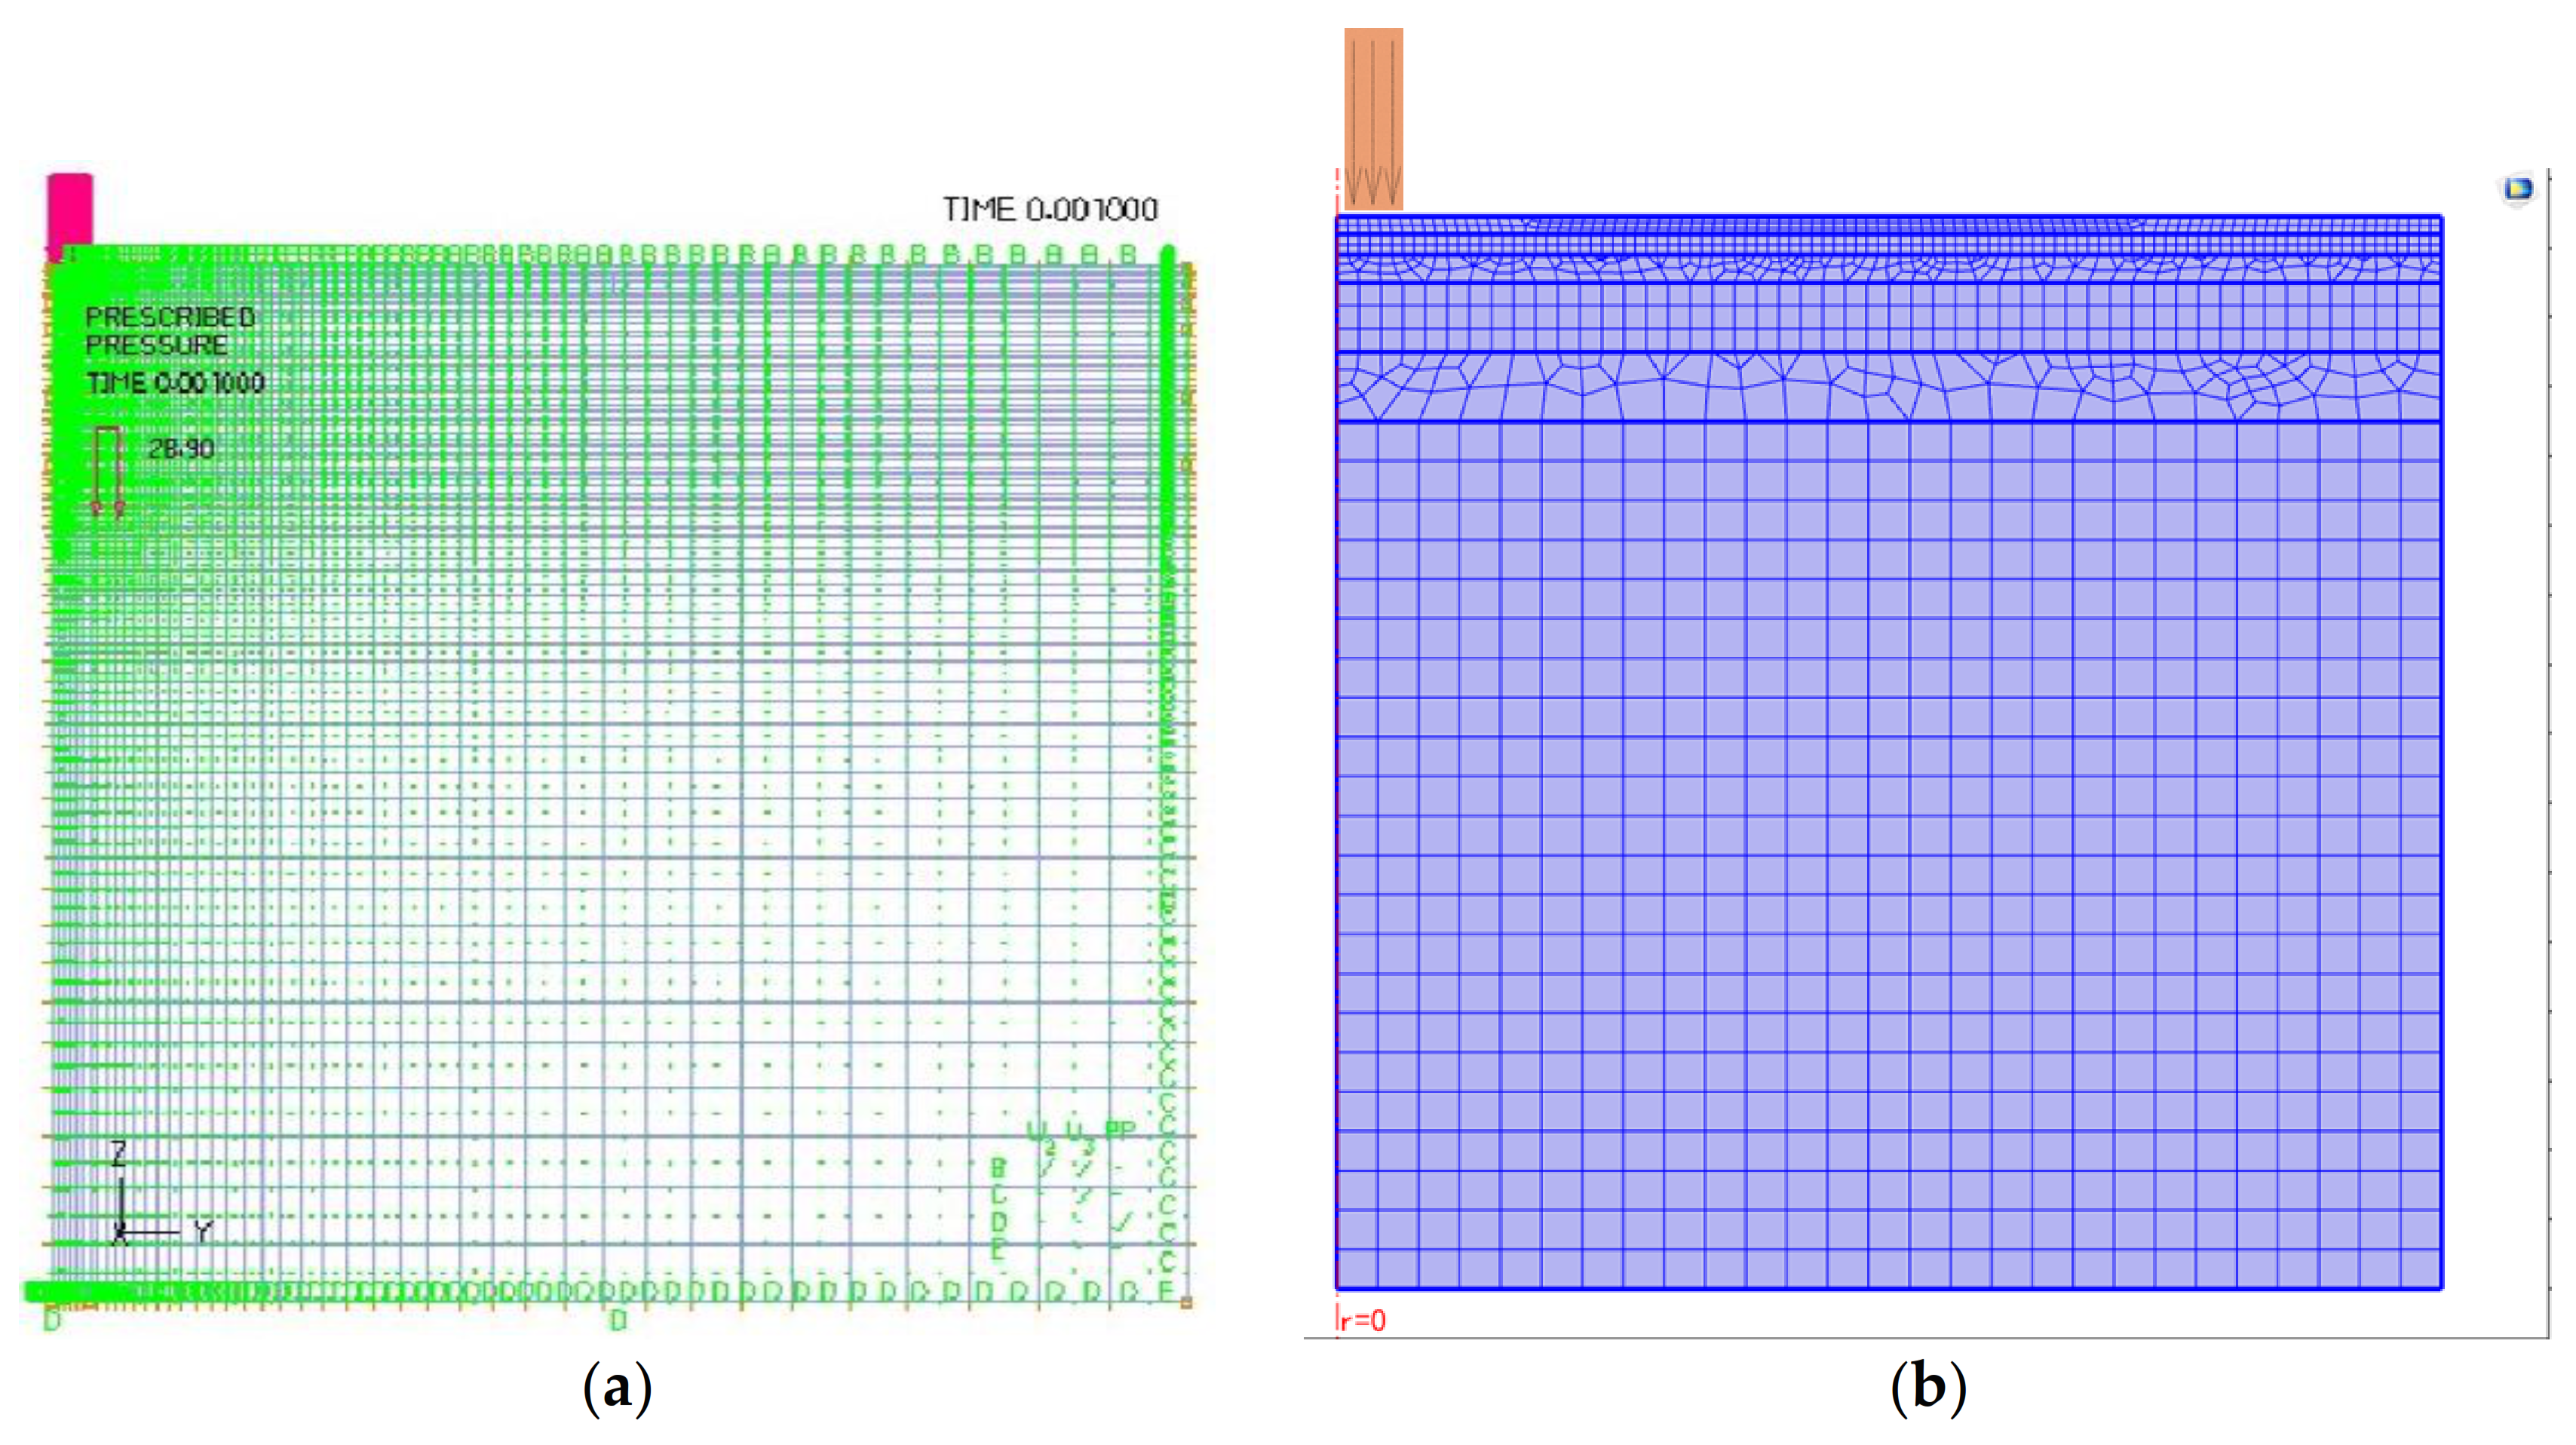
The two-dimensional axisymmetric model was constructed using COMSOL software, and the calculated results were compared with Dong’s results obtained with ADINA software [31] to verify the reliability of the software. The finite element model is shown in Figure 19.
The pore water pressure was calculated using a two-dimensional axisymmetric model in the COMSOL finite element software. It was assumed that the pavement was composed of fully saturated porous two-phase medium materials. The solid phase was the road surface and base material, and the liquid phase was water. The right boundary of the solid phase was radially fixed and vertically free. The bottom boundary was fixed axially and radially. The liquid phase was impermeable at the load position and bottom boundary. The other boundaries were permeable. The calculation results are shown in Figure 20.
It can be seen from Figure 20 that the calculation results of the two methods are basically the same, and the most unfavorable position of pore water pressure also appears in the middle and lower layers. At t = 0.038 s, the maximum pore water pressure calculated by ADINA is 327 kpa, and the maximum pore water pressure calculated by COMSOL is 330 kPa. Although there is a gap between the values, the pore water pressure calculated by COMSOL is more accurate and can better reflect the actual pore water pressure.

5.2. Study on the Influence of the Material Permeability of Each Structural Layer on the Stress of Pavement

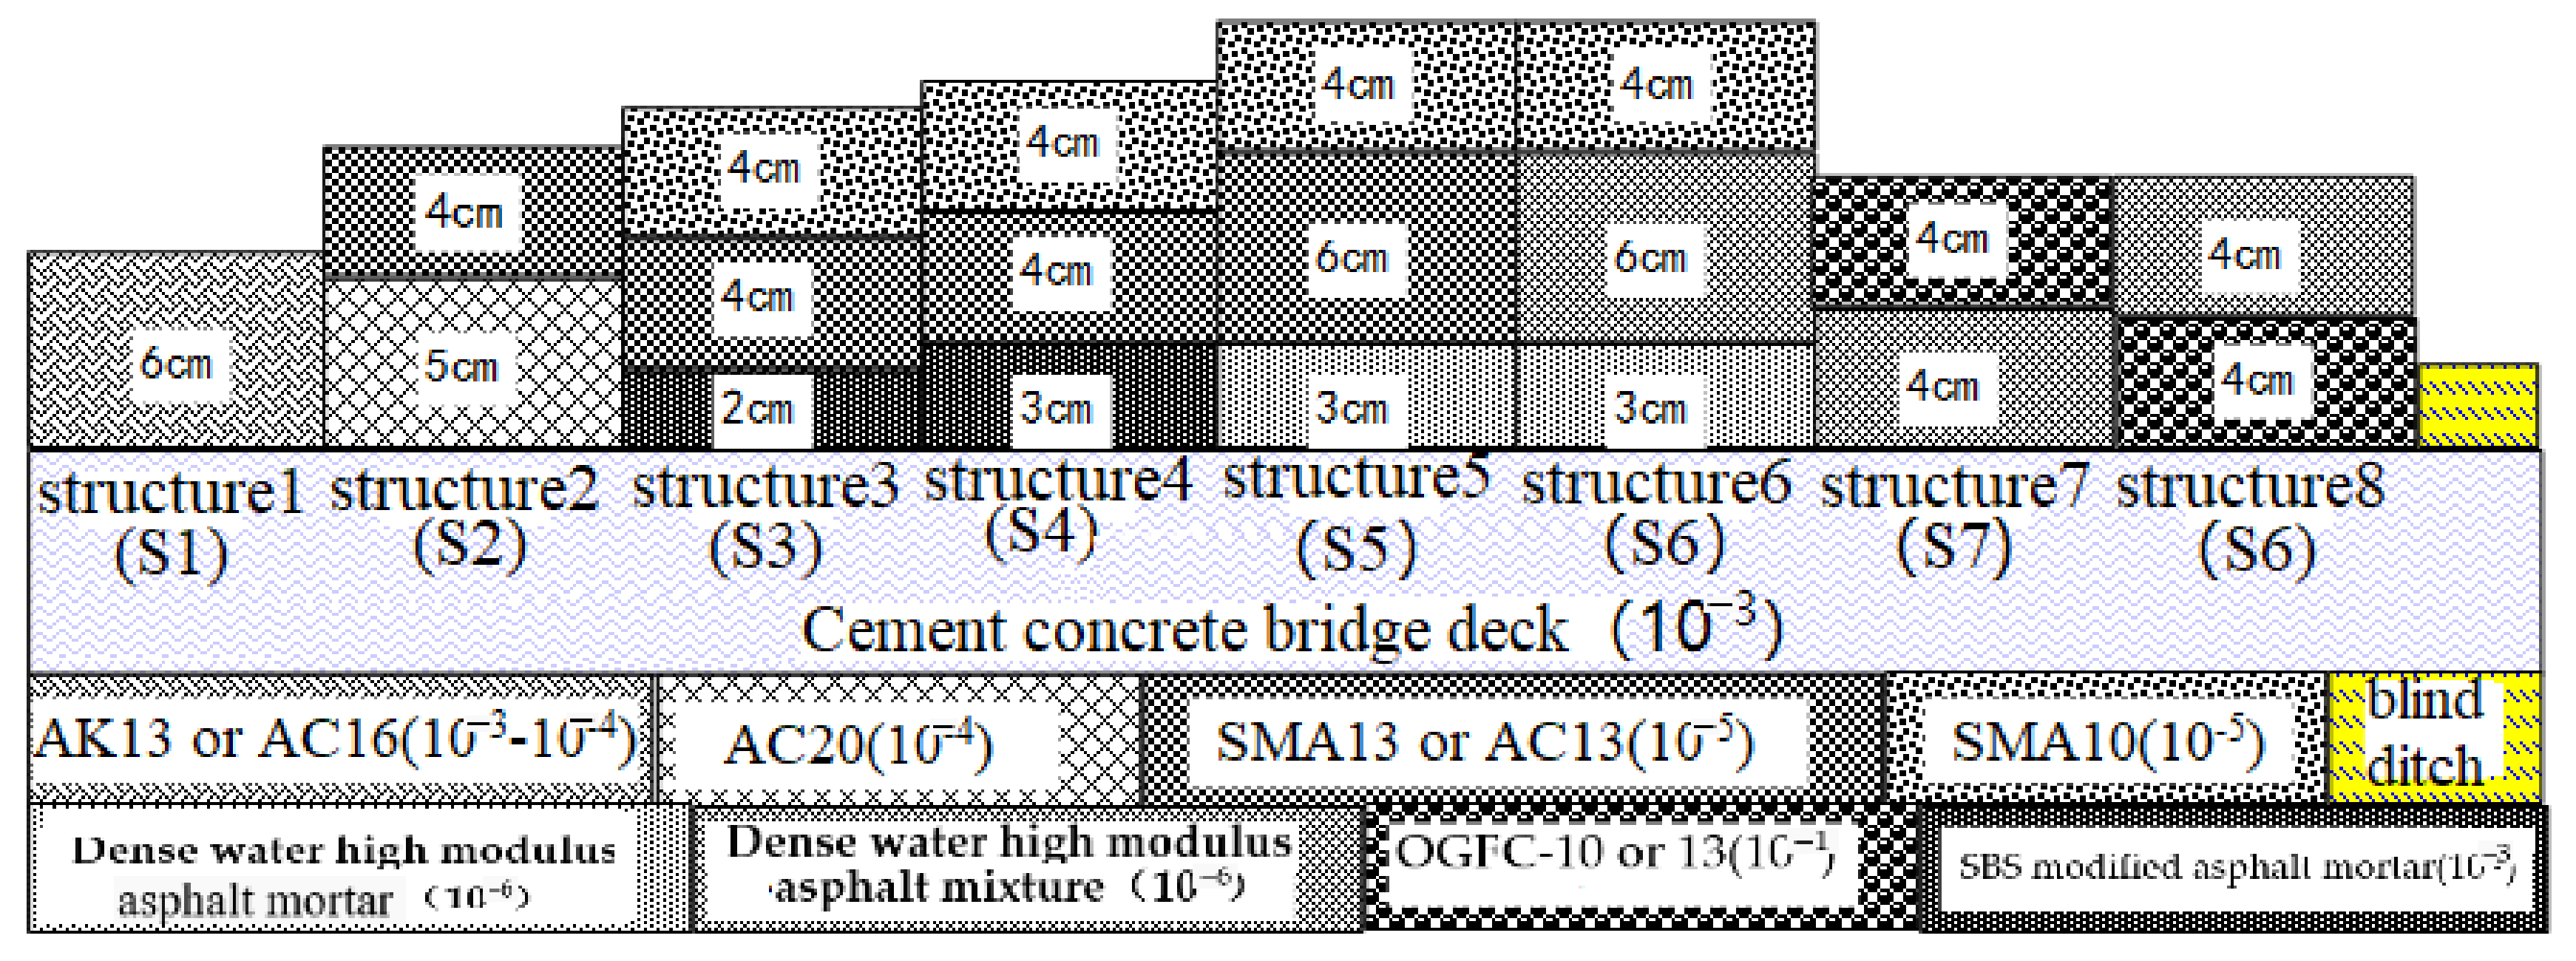
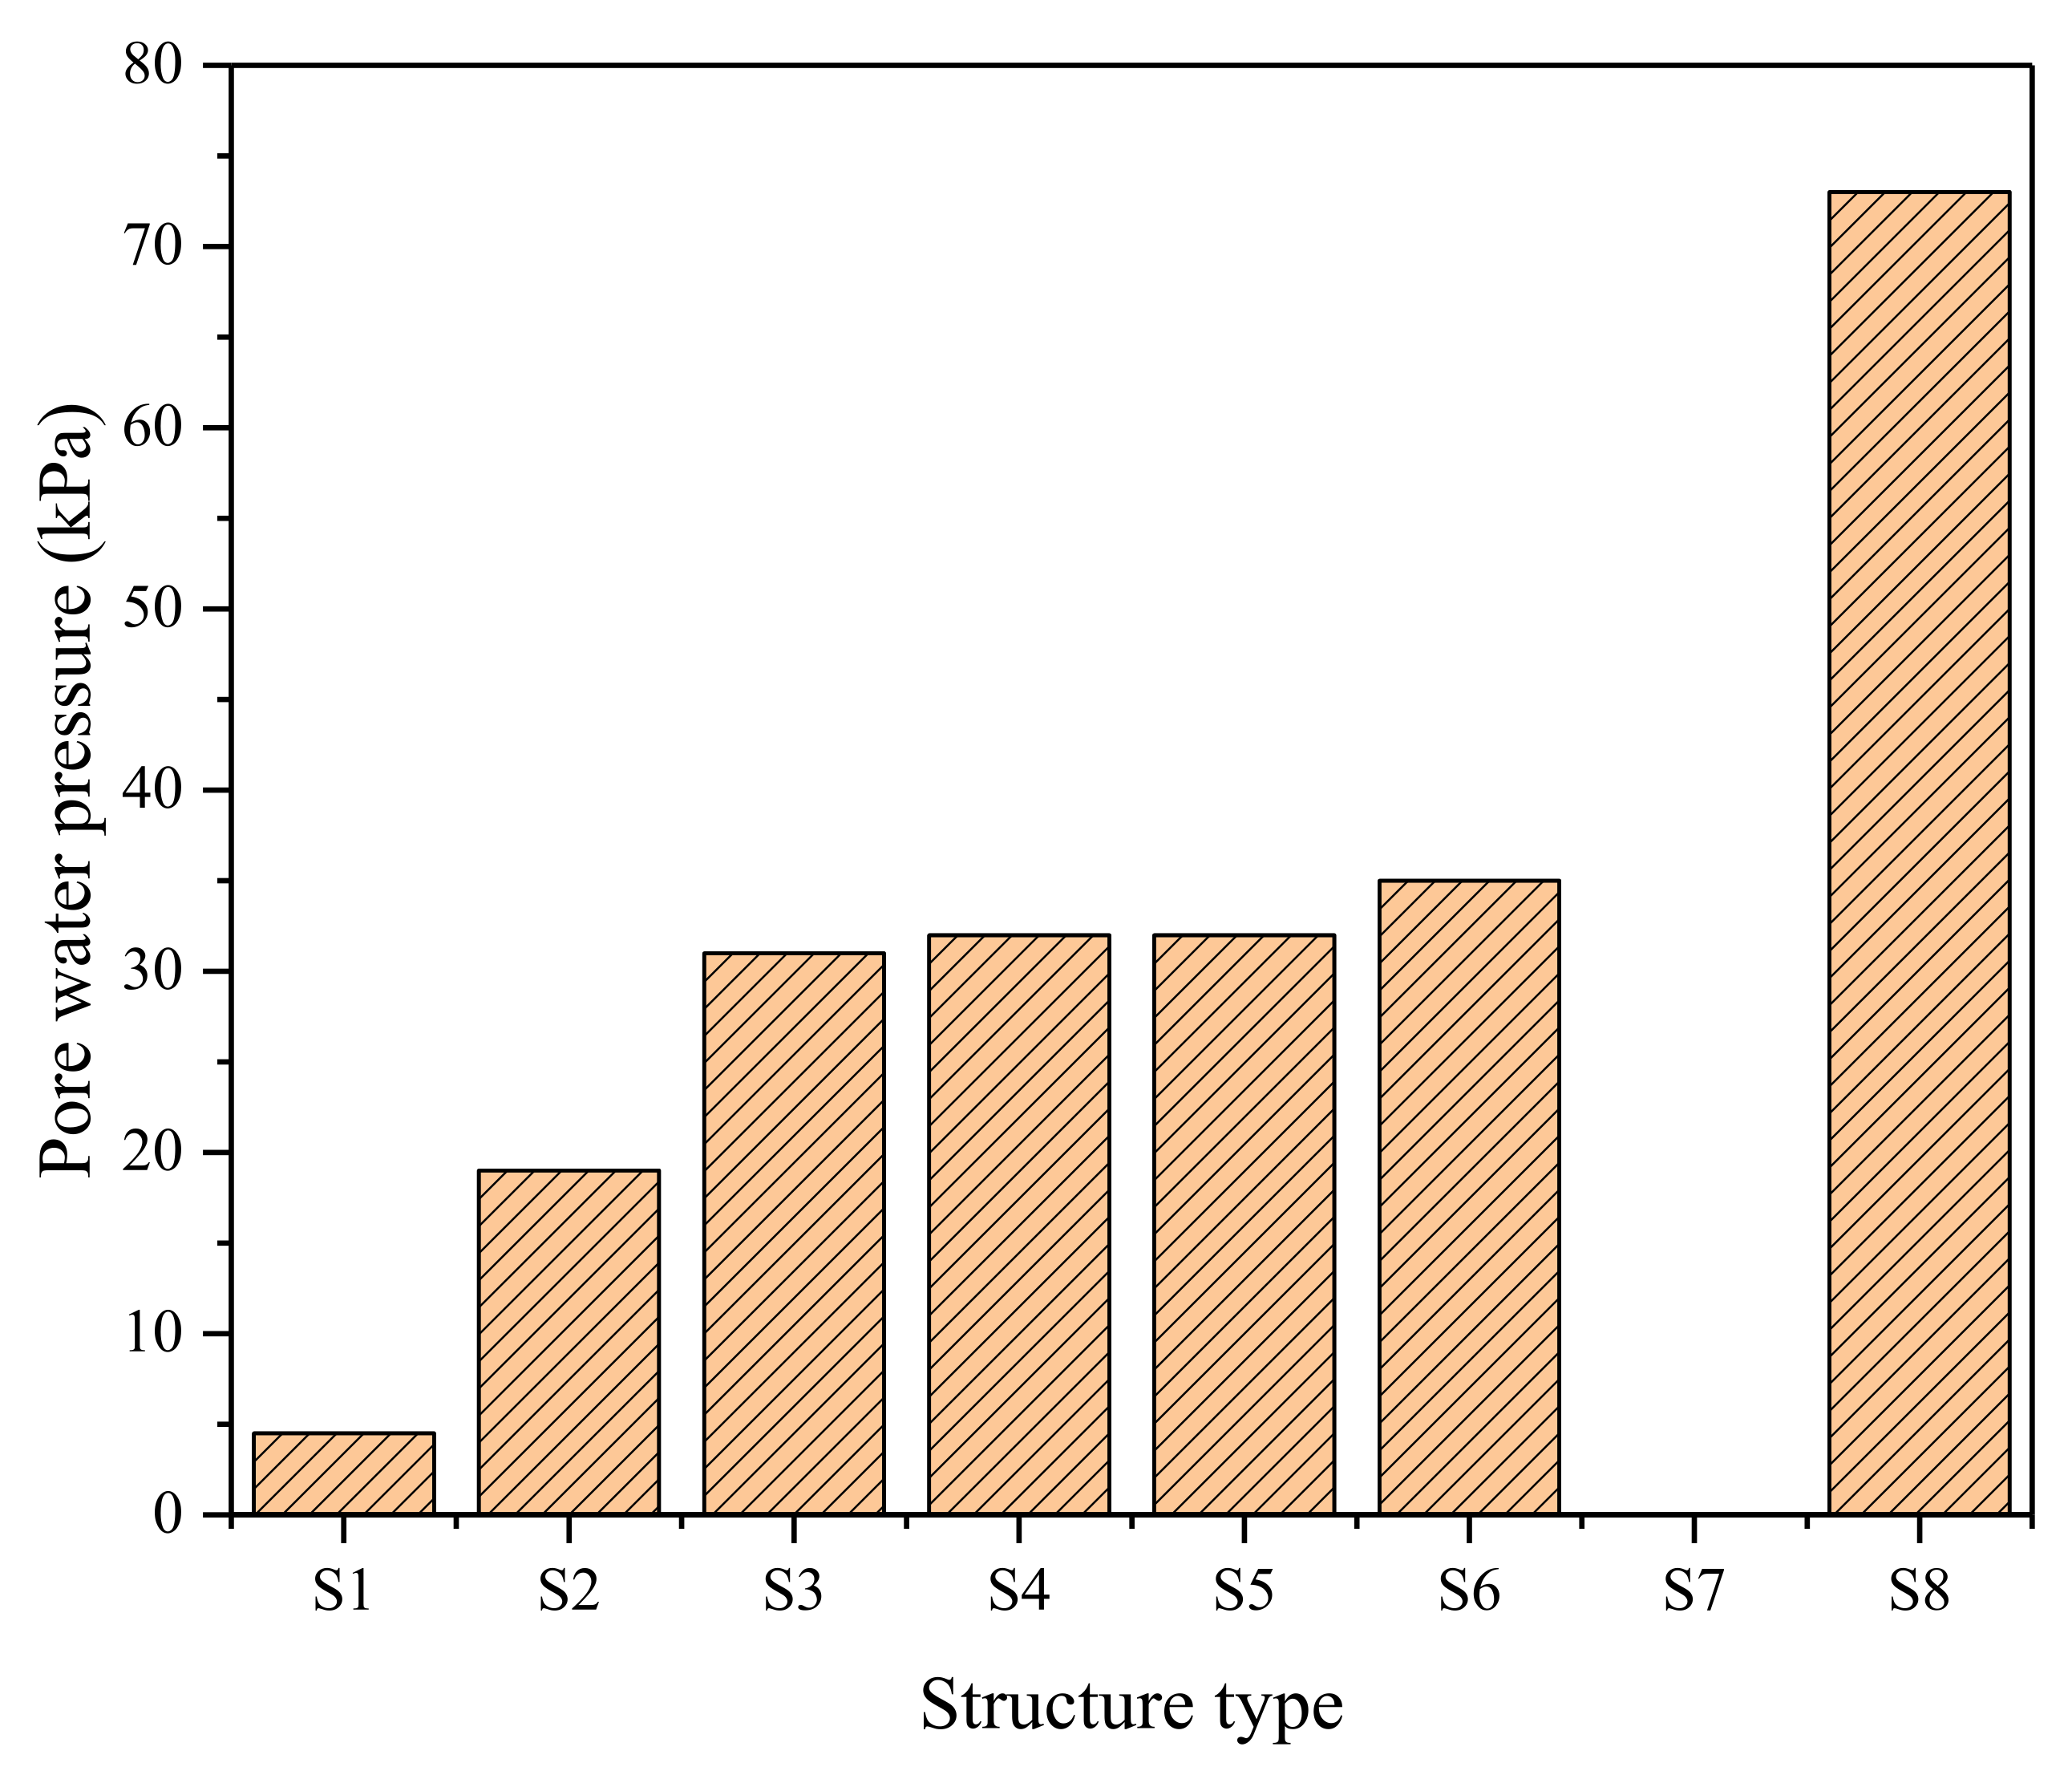
The model size and mesh division of the finite element software were the same as those described in Section 3.2. The fluid boundary conditions were as follows: the load position and lower boundary were impenetrable, and the others were permeable. Eight different types of bridge deck pavement structure were analyzed. The specific structures and parameters are shown in Figure 21 and Table 3, respectively. Figure 22 shows the surface pore water pressure at the center of the wheel with different structures calculated by the finite element model.
Since dynamic parameters were used in this analysis and the corresponding dynamic load model was not adjusted by the load, the finite element simulation results were only used to compare the pore water pressures of different structures qualitatively. Figure 22 shows the following. First, the pore water pressure had a slight relationship with the thickness and modulus combination of the structural layer, mainly related to the permeability coefficient of the material and the combination of upper and lower layers. For example, the thicknesses of the structural layers of Structures 7 and 8 were less than those of Structures 2–6, but there was a significant difference in the pore water pressure. Second, the thicknesses of the structural layers of Structures 3–5 were similar. The main difference was the permeability coefficient between the bearing layer and bottom layer. Therefore, there was a slight difference in the surface pore water pressure, and the influence of the interlayer water pressure should be analyzed thoroughly. Third, the comparison of Structures 7 and 8 shows that the pavement was set according to the “upper drainage and lower watertight” from top to bottom, which is beneficial for alleviating the pore water pressure of the pavement.
The maximum shear stresses of the eight structures under different conditions were calculated, and the results are shown in Table 4. The interlayer shear stress was significantly reduced when the structural layer thickness and permeability coefficient were increased. The shear stress between the middle and lower layers of Structure 6 was reduced to a very small value, effectively ensuring the interlayer connection effect. This would be beneficial for improving the pavement’s overall performance by combining pavement layers of different materials and structures and considering the optimized combination of the modulus and permeability coefficient.

5.3. Influence of Structural Layers on the Dynamic Water Pressure Resistance of Pavement

5.3.1. Pore Water Pressure Distribution

The finite element model was used to calculate the positive and negative pore water pressure distributions under uniaxial load action for one, two, and three impermeable structure layers as shown in Figure 23 and Figure 24. The most unfavorable position of the pore water pressure of the single- and three-layer bridge deck pavement occurred in the upper part of the pavement. This position appeared on the pavement surface for the single-layer bridge deck pavement. For the three-layer bridge deck pavement, this position appeared on the upper part of the upper layer. The most unfavorable position of the pore water pressure of the two-layer bridge deck pavement appeared in the upper part of the lower layer.

5.3.2. First Principal Stress Distribution

The COMSOL finite element model was used to calculate the first principal stress distribution under uniaxial load action for one, two, and three impermeable structure layers as shown in Figure 25. For the different deck pavement structures, the maximum value of the first principal stress occurred at the upper part of the pavement near 0.1 m from the load edge.

5.3.3. Shear Stress Distribution

The COMSOL finite element model was used to calculate the shear stress distribution under uniaxial load action when the number of impermeable structure layers was one, two, and three as shown in Figure 26. For single-deck pavement, the maximum shear stress occurred in the middle of the pavement directly below the load. For double-deck pavement, the maximum shear stress occurred in the middle of the pavement directly below the load. For the three-layer bridge deck pavement, the maximum shear stress occurred at the junction of the middle and upper layers directly below the load.
In summary, from the hydrodynamic pressure analysis results of single-layer, double-layer, and three-layer bridge deck pavement, the most unfavorable position of the pore water pressure of the single-layer bridge deck pavement ran through the whole thickness of the pavement. The occurrence of water damage will cause damage to the whole structure. The most unfavorable position of the pore water pressure in the double-deck pavement depended on the permeability coefficient, and the maximum pore water pressure occurred in the layer with a small permeability coefficient. The maximum value of the first principal stress of the single-deck pavement occurred on the pavement’s surface at the right edge of the load. The maximum value of the first principal stress of the double-layer and three-layer bridge deck pavement occurred at the bottom of the layer below the right edge of the load. The maximum shear stress of the single-deck pavement appeared in the middle of the pavement directly below the load. The layers for the different structural combinations of the double-deck pavement were different. The maximum shear stress of the three-layer bridge deck pavement appeared in the middle of the upper layer directly below the load. If water damage to the bridge deck pavement occurred, to perform later maintenance, the three-layer bridge deck pavement combination would be most suitable as the structural combination scheme.
The complete bridge deck pavement should be a multi-channel, dense water system combined with fortification and drainage. The functions of each layer from the top to the bottom of the pavement complement each other to increase the waterproof insurance coefficient, which not only meets the waterproof design life requirements but also ensures the long-term service performance of the pavement. Based on this, four kinds of waterproofing systems are recommended: (1) special hot-spread SBS/rubber-modified asphalt for bridge deck waterproofing + 0.4% ready-mixed gravel + asphalt mortar + modified emulsified asphalt; (2) diluted asphalt primer + special hot-applied rubber asphalt for bridge deck waterproofing + protective plate + modified emulsified asphalt; (3) special hot-construction-poured asphalt concrete for bridge deck waterproofing; and (4) a special cold-construction-reinforced polymer-modified asphalt coating for bridge deck waterproofing.

6. Conclusions

Aiming to study the bridge deck pavement structures in the frozen areas of North China, combined with the concept of multi-level waterproofing in the bridge deck pavement structure’s design, this paper studied the influence law of various factors, such as waterproof layer modulus, waterproof system structure type, and material permeability, on the typical stress of bridge deck pavement under four kinds of waterproof bonding layers, two kinds of waterproof leveling layers, and eight kinds of structural combinations of the pavement structure. The main conclusions are as follows:
(1)
When the thickness of the pavement layer was 8 cm, the maximum shear stress of the pavement layer occurs at 2 cm and 4 cm, that is, the middle of the wearing course and the connection between layers, which suggests that an upper pavement layer with sufficient high-temperature shear resistance should be selected as the load-bearing structural layer in the structural design.
(2)
When the paving layers are continuous, the difference between the elastic modulus of the waterproof bonding layer structure of “rubber asphalt + protective plate” and the modulus of the cement concrete slab is the largest, and the maximum horizontal strain in the transverse bridge direction and longitudinal bridge direction is 370 με and 298 με, respectively, The horizontal strain of the other three structures in the continuous state is less than 100 με. This shows that, to ensure that the load stress and strain remain stable in the pavement system, the ratio of the elastic modulus of the waterproof bonding layer material to the elastic modulus of the cement concrete slab should be considered in the structural design.
(3)
The greater the thickness of the structural layer and the smaller the permeability coefficient, the lower the interlayer shear stress. Compared with other structural combinations, the shear stress between the middle and lower layers of Structure 6 was reduced to 0.04 kPa. Therefore, the use of high-density water-based asphalt concrete with a low permeability coefficient can reduce the shear stress between layers, which could more effectively ensure the connection effect between layers.
Through the analysis of the typical stress of bridge deck pavement, it was found that research on the combination waterproof system + multi-functional waterproof layer + load-bearing structure layer + surface functional layer is of great significance to adjusting the thickness of the pavement layer, improving the watertightness of the pavement layer, mitigating the shear stress damage caused by a low modulus, and ensuring the service performance of bridge deck pavement.

Author Contributions

Methodology, J.F. and A.S.; software, J.F.; writing—original draft preparation, J.F. and H.Z.; writing—review and editing, A.S. and H.Z.; funding acquisition, J.F. All authors have read and agreed to the published version of the manuscript.

Funding

This research was funded by Science and Technology Projects of the Inner Mongolia Department of Transportation (Contract number: NJ-2013-30).

Institutional Review Board Statement

Not applicable.

Informed Consent Statement

Not applicable.

Data Availability Statement

The data that support the findings of this study are available from the corresponding author upon reasonable request.

Conflicts of Interest

The authors declare no conflict of interest. The funders had no role in the design of the study; in the collection, analyses, or interpretation of data; in the writing of the manuscript; or in the decision to publish the results.

Nomenclature

ACAsphalt concrete
NRatio of the modulus of the asphalt mixture to the modulus of the cement concrete (dimensionless)
HThickness of the structural layer
SMAStone matrix asphalt
S1Structure 1
S2Structure 2
S3Structure 3
S4Structure 4
XTransverse bridge direction
YAlong bridge direction
ZVertical bridge deck direction

References

  1. White, D.; Montani, R. Thin-bonded polymer concrete overlays for exposed concrete bridge deck protection and maintenance. Spec. Publ. 1997, 169, 99–106. [Google Scholar]
  2. Silfwerbrand, J.; Paulsson, J. Better bonding of bridge deck overlays. Concr. Int. 1998, 20, 56–61. [Google Scholar]
  3. Nabar, S.; Mendis, P. Experience with epoxy polymer concrete bridge deck thin overlays in service for over 10 years. Spec. Publ. 1997, 169, 1–17. [Google Scholar]
  4. Günther, G.; Bild, S.; Sedlacek, G. Durability of asphaltic pavements on orthotropic decks of steel bridges. J. Constr. Steel Res. 1987, 7, 85–106. [Google Scholar] [CrossRef]
  5. Olard, F.; Héritier, B.; Loup, F.; Krafft, S. New French standard test method for the design of surfacings on steel deck bridges: Case study of the Millau Viaduct. Road Mater. Pavement Des. 2005, 6, 515–531. [Google Scholar] [CrossRef]
  6. Xiao, F.; Amirkhanian, S.; Juang, C.H. Rutting resistance of rubberized asphalt concrete pavements containing reclaimed asphalt pavement mixtures. J. Mater. Civ. Eng. 2007, 19, 475–483. [Google Scholar] [CrossRef] [Green Version]
  7. Park, H.M.; Choi, J.Y.; Lee, H.J.; Hwang, E.Y. Performance evaluation of a high durability asphalt binder and a high durability asphalt mixture for bridge deck pavements. Constr. Build. Mater. 2009, 23, 219–225. [Google Scholar] [CrossRef]
  8. Zhang, K.; Luo, Y. Interlaminar performance of waterproof and cohesive materials for concrete bridge deck under specific test conditions. J. Mater. Civ. Eng. 2018, 30, 04018161. [Google Scholar] [CrossRef]
  9. Cheraghian, G.; Wistuba, M.P. Ultraviolet aging study on bitumen modified by a composite of clay and fumed silica nanoparticles. Sci. Rep. 2020, 10, 11216. [Google Scholar] [CrossRef]
  10. Liu, Y.; Wu, J.; Chen, J. Mechanical properties of a waterproofing adhesive layer used on concrete bridges under heavy traffic and temperature loading. Int. J. Adhes. Adhes. 2014, 48, 102–109. [Google Scholar] [CrossRef]
  11. Jin, W.; Zhao, Y.; Wang, W.; He, F. Performance evaluation and optimization of waterproof adhesive layer for concrete bridge deck in seasonal frozen region using AHP. Adv. Mater. Sci. Eng. 2021, 2021, 1–12. [Google Scholar] [CrossRef]
  12. Cheraghian, G.; Falchetto, A.C.; You, Z.; Chen, S.; Kim, Y.S.; Westerhoff, J.; Moon, K.H.; Wistuba, M.P. Warm mix asphalt: An up to date review. J. Clean. Prod. 2020, 268, 122128. [Google Scholar] [CrossRef]
  13. Xu, Q.; Zhou, Q.; Medina, C.; Chang, G.K.; Rozycki, D.K. Experimental and numerical analysis of a waterproofing adhesive layer used on concrete-bridge decks. Int. J. Adhes. Adhes. 2009, 29, 525–534. [Google Scholar] [CrossRef]
  14. Han, D.; Zhu, G.; Hu, H.; Li, L. Dynamic simulation analysis of the tire-pavement system considering temperature fields. Constr. Build. Mater. 2018, 171, 261–272. [Google Scholar] [CrossRef]
  15. Sun, Y.; Du, C.; Gong, H.; Li, Y.; Chen, J. Effect of temperature field on damage initiation in asphalt pavement: A microstructure-based multiscale finite element method. Mech. Mater. 2020, 144, 103367. [Google Scholar] [CrossRef]
  16. Zhang, H.; Mao, Q.; Zhu, Z.; Zhang, Z.; Pan, Y.; Wan, J.; Zhou, C.; Qian, J. Experimental study on service performance of epoxy asphalt steel deck pavement of cable stayed bridge. Case Stud. Constr. Mater. 2020, 13, e00392. [Google Scholar] [CrossRef]
  17. Zhang, H.; Gao, P.; Pan, Y.; Li, K.; Zhang, Z.; Geng, F. Development of cold-mix high-toughness resin and experimental research into its performance in a steel deck pavement. Constr. Build. Mater. 2020, 235, 117427. [Google Scholar] [CrossRef]
  18. Yoon, Y.; Hastak, M. Condition improvement measurement using the condition evaluation criteria of concrete bridge decks. J. Transp. Eng. 2016, 142, 04016054. [Google Scholar] [CrossRef]
  19. ElSafty, A.; Graeff, M.K.; El-Gharib, G.; Abdel-Mohti, A.; Jackson, N.M. Analysis, prediction, and case studies of early-age cracking in bridge decks. Int. J. Adv. Struct. Eng. (IJASE) 2016, 8, 193–212. [Google Scholar] [CrossRef] [Green Version]
  20. Chen, L.; Qian, Z.; Wang, J. Multiscale numerical modeling of steel bridge deck pavements considering vehicle–pavement interaction. Int. J. Geomech. 2016, 16, B4015002. [Google Scholar] [CrossRef]
  21. Seible, F.; Latham, C. Horizontal load transfer in structural concrete bridge deck overlays. J. Struct. Eng. 1990, 116, 2691–2710. [Google Scholar] [CrossRef]
  22. Tang, F.-F. Overlay for concrete segmental box-girder bridges. J. Bridge Eng. 2000, 5, 311–321. [Google Scholar] [CrossRef]
  23. Walter, R.; Olesen, J.F.; Stang, H.; Vejrum, T. Analysis of an orthotropic deck stiffened with a cement-based overlay. J. Bridge Eng. 2007, 12, 350–363. [Google Scholar] [CrossRef] [Green Version]
  24. Xu, Q.; Sun, Z.; Wang, H.; Shen, A. Laboratory testing material property and FE modeling structural response of PAM-modified concrete overlay on bridges. J. Bridge Eng. 2009, 14, 26–35. [Google Scholar] [CrossRef]
  25. Liu, H.; Li, Y.; Zhang, Q.; Hao, P. Deformation characteristic and mechanism of blisters in cement concrete bridge deck pavement. Constr. Build. Mater. 2018, 172, 358–369. [Google Scholar] [CrossRef]
  26. Farreras-Alcover, I.; Chryssanthopoulos, M.K.; Andersen, J.E. Data-based models for fatigue reliability of orthotropic steel bridge decks based on temperature, traffic and strain monitoring. Int. J. Fatigue 2017, 95, 104–119. [Google Scholar] [CrossRef]
  27. Gong, M.; Zhou, B.; Chen, J.; Sun, Y. Mechanical response analysis of asphalt pavement on concrete curved slope bridge deck based on complex mechanical system and temperature field. Constr. Build. Mater. 2021, 276, 122206. [Google Scholar] [CrossRef]
  28. Wang, L.; Hou, Y.; Zhang, L.; Liu, G. A combined static-and-dynamics mechanics analysis on the bridge deck pavement. J. Clean. Prod. 2017, 166, 209–220. [Google Scholar] [CrossRef]
  29. Ma, H.; Zhang, Z.; Ding, B.; Tu, X. Investigation on the adhesive characteristics of Engineered Cementitious Composites (ECC) to steel bridge deck. Constr. Build. Mater. 2018, 191, 679–691. [Google Scholar] [CrossRef]
  30. Cheng, H.; Liu, L.; Sun, L. Critical response analysis of steel deck pavement based on viscoelastic finite element model. Int. J. Pavement Eng. 2021, 22, 307–318. [Google Scholar] [CrossRef]
  31. Dong, Z. Study on Dynamic Response of Asphalt Pavement; Science Press: Beijing, China, 2014; Volume 102–109. [Google Scholar]
Figure 1. Finite element model.
Coatings 11 01540 g001
Figure 2. Loading mode and measurement point layout of the test beam (unit: cm).
Coatings 11 01540 g002
Figure 3. Loading test photographs.
Coatings 11 01540 g003
Figure 4. Comparison between actual and calculated displacements.
Coatings 11 01540 g004
Figure 5. Finite element calculation model: (a) side view of the pavement structure calculation model; and (b) the finite element solid model.
Coatings 11 01540 g005
Figure 6. Relationship between the bottom shear stress of the pavement layer and the modulus of the waterproof layer (MWL).
Coatings 11 01540 g006
Figure 7. Variation in the internal shear stress of the pavement and the modulus of the waterproof layer.
Coatings 11 01540 g007
Figure 8. Finite element solid model.
Coatings 11 01540 g008
Figure 9. Schematic diagram of the calculation model’s size and load layout.
Coatings 11 01540 g009
Figure 10. Calculation of the maximum displacement of the pavement structure for different interlayer states.
Coatings 11 01540 g010
Figure 11. Horizontal stress at each calculation point in each direction under different interlayer conditions at the bottom of the pavement layer: (a) transverse bridge direction, continuous state between layers; (b) transverse bridge direction, interlayer smooth state; (c) longitudinal bridge direction, interlayer continuous state; and (d) longitudinal bridge direction, interlayer continuous state.
Coatings 11 01540 g011aCoatings 11 01540 g011b
Figure 12. Horizontal shear stress along the bridge direction at the bottom of the pavement layer.
Coatings 11 01540 g012
Figure 13. Horizontal strain distribution of the pavement structure with continuous and smooth states between layers: (a) transverse bridge direction; and (b) longitudinal bridge direction.
Coatings 11 01540 g013
Figure 14. Top surface deflection of the paving layer under different interlayer contact states.
Coatings 11 01540 g014
Figure 15. Changes in stress and strain at each calculation point under different interlayer contact states: (a) stress variation along the bridge at each calculation point in different interlayer contact states; and (b) transverse bridge strain at each calculation point under different interlayer contact conditions.
Coatings 11 01540 g015
Figure 16. Influence of interlayer connection state and load characteristics on maximum shear stress.
Coatings 11 01540 g016
Figure 17. Effect of structural layer thickness on the shear stress at each point: (a) maximum shear stress (standard load, continuous, Structure 1), (b) maximum shear stress (standard load, continuous, Structure 2), (c) shear stress along the bridge (standard load, continuous, Structure 1), and (d) shear stress along the bridge (standard load, continuous, Structure 2).
Coatings 11 01540 g017aCoatings 11 01540 g017b
Figure 18. Maximum stress and maximum strain of each layer of the two structures: (a) Structure 1; and (b) Structure 2.
Coatings 11 01540 g018
Figure 19. ADINA and COMSOL finite element models: (a) the ADINA finite element model; and (b) the COMSOL finite element model.
Coatings 11 01540 g019
Figure 20. The calculation results: (a) nephogram of the pore water pressure variation along the depth direction calculated by ADINA; and (b) nephogram of the pore water pressure variation along the depth direction calculated by COMSOL.
Coatings 11 01540 g020
Figure 21. Schematic diagram comparing different structural combination designs. Note: the design permeability coefficient of the mixture is shown in brackets with the unit of cm/s. Blind drainage ditches were set at the outer edge of the pavement structure.
Coatings 11 01540 g021
Figure 22. Comparison of the surface pore water pressure at the lower center of each structural wheel (standard load, continuous, no braking).
Coatings 11 01540 g022
Figure 23. Distribution of positive pore water pressure under uniaxial action: (a) single-layer structure; (b) double-layer structure; and (c) three-layer structure.
Coatings 11 01540 g023
Figure 24. Distribution of negative pore water pressure under uniaxial action: (a) single-layer structure; (b) double-layer structure; and (c) three-layer structure.
Coatings 11 01540 g024
Figure 25. Distribution of the first principal stress under uniaxial action: (a) single-layer structure; (b) double-layer structure; and (c) three-layer structure.
Coatings 11 01540 g025
Figure 26. Distribution of shear stress under uniaxial action: (a) single-layer structure; (b) double-layer structure; and (c) three-layer structure.
Coatings 11 01540 g026
Table 1. Basic calculation parameters.
Calculation ParametersAsphalt Concrete Modulus (MPa)Asphalt Concrete ThicknessAsphalt Concrete Thickness (cm)Cement Concrete Modulus (Mpa)Poisson’s Ratio of Cement ConcreteModulus of Waterproof Layer (Mpa)Poisson’s Ratio of Waterproof LayerThickness of Waterproof Layer (mm)
Value15000.25835,0000.1510–15000.33
Table 2. Modulus parameters of pavement materials for the calculation.
ProjectMaterial TypeThickness of Structural Layer/cmModulus Value/MPaPoisson’s Ratio
Structure 1 (S1)SMA-13625150.25
Asphalt mortar219880.3
Hot SBS-modified asphalt + ready mixed macadam0.12--
Cement concrete slab2250,0000.15
Structure 2 (S2)SMA-137.225150.25
Rubber-modified asphalt + protective board0.8850.35
Cement concrete slab2250,0000.15
Structure 3 (S3)SMA-13525150.25
Cast asphalt concrete313080.3
Cement concrete slab2250,0000.15
Structure 4 (S4)SMA-13825150.25
Waterproof coating0.12–0.15--
Cement concrete slab2250,0000.15
Table 3. Design parameters.
Serial NumberMixture TypeModulus/HzPoisson’s Ratio
1(AC-16, AK-13)18000.25
2Cement concrete bridge deck50,0000.15
3SMA-13, AC-1325150.25
4AC-2032000.25
5SMA-1022000.25
6SMA-1325150.25
7SBS-modified asphalt mortar19880.30
8Dense high-modulus asphalt mortar41000.25
9OGFC-10 (13) 15000.30
10Dense high-modulus asphalt mixture41000.25
Table 4. Maximum shear stress combinations under different structural combinations.
Maximum Shear Stress between Layers/kPa (Standard Load, Continuous, No Braking)
Structure 1h (cm)06
Without water3331
With water3232
Structure 2h (cm)049
Without water435027
With water424528
Structure 3h (cm)04810
Without water511304129
With water491203829
Structure 4h (cm)04811
Without water56524631
With water54474230
Structure 5h (cm)041013
Without water55514234
With water53474133
Structure 6h (cm)041013
Without water455.70.020.04
With water4540.010.05
Structure 7h (cm)048
Without water324728
With water324729
Structure 8h (cm)048
Without water826628
With water745328
Publisher’s Note: MDPI stays neutral with regard to jurisdictional claims in published maps and institutional affiliations.