Article

Computational Simulations of Nanoconfined Argon Film through Adsorption–Desorption in a Uniform Slit Pore

1
Department of Mechanical and Aerospace Engineering, The George Washington University, Washington, DC 20052, USA
2
Energy and Environment Science & Technology, Idaho National Laboratory, Idaho Falls, ID 83415, USA
*
Authors to whom correspondence should be addressed.
Coatings 2021, 11(2), 177; https://doi.org/10.3390/coatings11020177
Submission received: 14 January 2021 / Revised: 26 January 2021 / Accepted: 29 January 2021 / Published: 2 February 2021
(This article belongs to the Special Issue Mechanical Properties of Advanced Multifunctional Coatings)

Abstract

:
We performed hybrid grand canonical Monte Carlo/molecular dynamics (GCMC/MD) simulations to investigate the adsorption-desorption isotherms of argon molecules confined between commensurate and incommensurate contacts in nanoscale thickness. The recently proposed mid-density scheme was applied to the obtained hysteresis loops to produce a realistic equilibrium phase of nanoconfined fluids. The appropriate chemical potentials can be determined if the equilibrium structures predicted by GCMC/MD simulations are consistent with those observed in previously developed liquid-vapor molecular dynamics (LVMD) simulations. With the chemical potential as input, the equilibrium structures obtained by GCMC/MD simulations can be used as reasonable initial configurations for future metadynamics free energy calculations.

1. Introduction

The structure and thermodynamic state of a liquid film confined between two solid surfaces in nanoscale thickness and its mechanical response to external loading are very important topics in surface science [1], which has attracted considerable interests and research efforts for decades in many surface force experiments (mainly in surface force apparatus (SFA) or surface force balance (SFB) measurements) [2,3,4,5] and molecular simulations [6,7]. The fundamental questions concerning the squeezing and shearing behaviors of nanoconfined fluids are particularly relevant to the fields of nanotribology, biolubrication, coating, and surface engineering and have been a matter of persistent debate despite many new findings and new insights [8,9,10,11].
The very low compression rate or lateral sliding speed of mechanical driving springs in an SFA/B instrument largely enables a nanoconfined liquid film in a quasistatic equilibrium state, except in an unstable jump during the layering transition or in a fast slip during a stick-slip sliding. Because of this, we need to first understand the actual equilibrium structure of a nanoconfined liquid film that should correspond to a lowest free energy state. These equilibrium states may not be fully explored by the SFA/B mechanical driving system due to its nonequilibrium nature of driven dynamics during unstable transitions.
Recently, a liquid-vapor molecular dynamics (LVMD) ensemble was used to investigate the force oscillation, phase transition, and shearing behaviors of liquid films confined between two solid walls [12,13,14,15,16]. The main features of the LVMD simulation can be summarized in three aspects: First, it enables the squeeze-out of the confined fluid during normal compression due to the extended side walls along the squeeze-out direction. Second, the lateral pressure of the confined system is comparable to the ambient pressure because of the coexistence of vapor phase around the central liquid droplet. Third, the squeeze-out of the confined fluid is realized by compressing the driving spring, which is connected to the top confining wall. Such a mechanical loading is similar to the situation in SFA/B experiments. Therefore, an LVMD ensemble is particularly suitable in investigating the squeeze-out behavior of confined fluids in surface force experiments. It has also been extended to study the mechanical response of a liquid film confined between AFM tip and substrate [17,18,19]. A critical issue in the LVMD simulation of a nanoconfined fluid concerns whether the simulation can produce a realistic thermodynamic equilibrium state of the liquid film under a sufficiently low compression rate. In our previous study [14], grand canonical Monte Carlo (GCMC) and LVMD simulations were carried out to study the squeezing and phase transition of simple liquid argon confined between two commensurate solid surfaces. The comparative study revealed that LVMD simulation can capture a major part of the force oscillation profile predicted by the equilibrium GCMC simulation and, at the same time, reveal the non-equilibrium squeeze-out behavior of the confined film. Still, the problem of whether the confined liquid film is in the lowest free energy state remains.
Metadynamics [20,21] proves to be a state-of-the-art computational framework for enhanced sampling coupled with molecular dynamics (MD) simulations in an efficient, flexible, and accurate manner. Its ultimate goal is to simulate rare events and reconstruct the free energy surface (FES) as a function of collective variables (CVs) in physics/biophysics, chemistry, and material science [22,23]. To study phase transitions involving the solid nucleation and/or relative free energy of different phases, structural order parameters (such as Steinhardt parameters [24,25]) can be selected as CVs [26,27]. In this sense, however, LVMD assembly as the simulation setup is not suitable for a metadynamics study, due to the coexistence of multiple phases involved in LVMD simulation. The simulation setup in a uniform slit pore with periodic boundary conditions (PBCs) applied in the lateral directions (i.e., there is no liquid–gas or solid–liquid phase boundary) in our previous GCMC simulations [14] is more suitable for combination with a metadynamics study, since only one homogeneous phase exists in the confined region.
GCMC simulations have been considered a natural way and a standard method to simulate an open system with constant temperature T, volume V, and chemical potential μ (μVT system) imposed by an external reservoir while the number of particles is allowed to vary. Typical examples are clay swelling [28,29,30,31] and the quasistatic friction in aqueous film in an SFA experiment [32]. In GCMC simulation, at a given gap width between two confining walls, a hysteresis loop with two distinct branches (adsorption and desorption) is often observed and widely documented, which was not considered in our previous study [14]. How to determine the equilibrium transition within the hysteresis loop is a critical challenge. In this study, a recently proposed method called the mid-density scheme was applied to determine the equilibrium state in a hysteresis loop [33]. Compared with conventional but computationally expensive methods such as thermodynamic integration [34,35] and gauge cell method [36,37], the mid-density scheme is a simplified but useful approach to identify the equilibrium phase transition in a hysteresis loop.
The aim of this paper is to obtain an appropriate value of chemical potential extracted from hybrid grand canonical Monte Carlo/molecular dynamics (GCMC/MD) simulations. The criterion is that it can correctly reproduce the thermodynamic states observed in LVMD simulation, rather than accurately predict the energetically favorable states. In other words, LVMD simulations can serve as a guide in searching the proper value of chemical potential adopted for a GCMC simulation. The equilibrium configuration obtained by this approach can be viewed as a reference and further used as the initial configuration in metadynamics to investigate the free energy profile relative to an order parameter at a given gap distance between confining solid walls.
The rest of the paper is organized as follows. In Section 2, we briefly describe the simulation models and the GCMC simulation techniques. Results are given in Section 3, followed by a summary and discussions in Section 4.

2. Simulation Models and Methods

As illustrated in Figure 1, argon atoms, as a nonpolar model lubricant, are confined between two rigid face-centered cubic (FCC) solid walls. A simple and computationally cheap Lennard–Jones (LJ) atomic pair potential is used to model the interactions between argon molecules according to the literature, i.e., σ = 0.3405 nm and ε = 0.2381 kcal/mol [38]. Following our previous publications [12,16], two types of contacts are considered: commensurate (Figure 1a,b) and incommensurate (Figure 1c,d). The two FCC crystal walls have the z direction along the [111] direction, while the x and y directions are along the [ 1 1 ¯ 0 ] and [ 11 2 ¯ ] directions, respectively. For convenience, the relevant parameters are summarized in Table 1. For both contacts, the wall–fluid interaction between argon and solid wall is the same as the argon–argon interaction (i.e., εwf = εff = ε, where w and f stand for “wall” and “fluid,” respectively).
Periodic boundary conditions (PBCs) are implemented in the x and y directions to approximate the infinite extent of lateral surfaces. All the simulations are carried out using the Large-scale Atomic/Molecular Massively Parallel Simulator (LAMMPS) package [39]. A standard cutoff distance of 8.5 Å (about 2.5 σ) is used for the LJ interactions, and the time step is 1.0 fs in MD simulations. All the simulations are performed with the Nosé–Hoover thermostat [40,41] at a temperature of 85 K, corresponding to a liquid state of argon which is between the melting point (83.8 K) and the boiling point (87.3 K) of argon.
The local structural ordering of atoms is characterized by the OVITO visualization package [42] with the polyhedral template matching (PTM) method [43]. The PTM method can reliably identify the most common ordered crystalline structures of condensed phases ranging from face-centered cubic (FCC), hexagonal close-packed (HCP), body-centered cubic (BCC), simple cubic (SC), and icosahedral (ICO) to others (unknown coordination structure). It can still work effectively in the presence of strong thermal displacements and strains.
The GCMC simulation conducts exchanges of atoms or molecules with a virtual ideal gas reservoir. Thus, it is considered a natural way to simulate an open system characterized by fixed temperature T, volume V, and chemical potential μ. If all the inserted atoms in the confined region can also be moved using a regular NVT ensemble control (the volume and temperature are held constant), simulations in the grand canonical ensemble (μVT, constant chemical potential, constant volume, and constant temperature) can be performed. In such a hybrid GCMC/MD simulation, the inserted molecules can be well equilibrated.
Our hybrid GCMC/MD simulation attempts 1000 insertion/deletion moves and 1000 translational moves every 100 timesteps. In each simulation, at least 5 million timesteps are performed. The temperature of the imaginary reservoir is set to be equivalent to the target temperature used in NVT (T = 85 K) so that the imaginary reservoir is in thermal equilibrium with the simulation cell. When an argon atom is to be inserted, its coordinates are chosen at a random place within the confined region, and new atom velocities are randomly chosen from the specified temperature distribution given by T.
Hybrid GCMC/MD simulations can be initiated with an empty box or a box full of argon molecules, which will give the adsorption and desorption branches respectively. For the former, we continue to increase the chemical potential each time and the resulting configuration of the previous simulation is used as the starting configuration for the subsequent simulation. For the latter, we repeat the same procedure with decreasing chemical potential. In many microporous systems, the adsorption and desorption branches are distinct, exhibiting a hysteresis loop, with the equilibrium phase transition undetermined.
Compared with conventional but computationally expensive methods, the mid-density scheme is a simplified but useful approach to identify the equilibrium phase transition in a hysteresis loop [33]. It has been successfully applied to study argon adsorption in graphite slit pores and in silica cylindrical pores [33,44]. The researchers who proposed this method also demonstrated [45] that its validity for the determination of the equilibrium state is supported by the commonly used canonical ensemble kinetic Monte Carlo (CE-kMC) [46,47] and gauge cell methods [36,37,48].
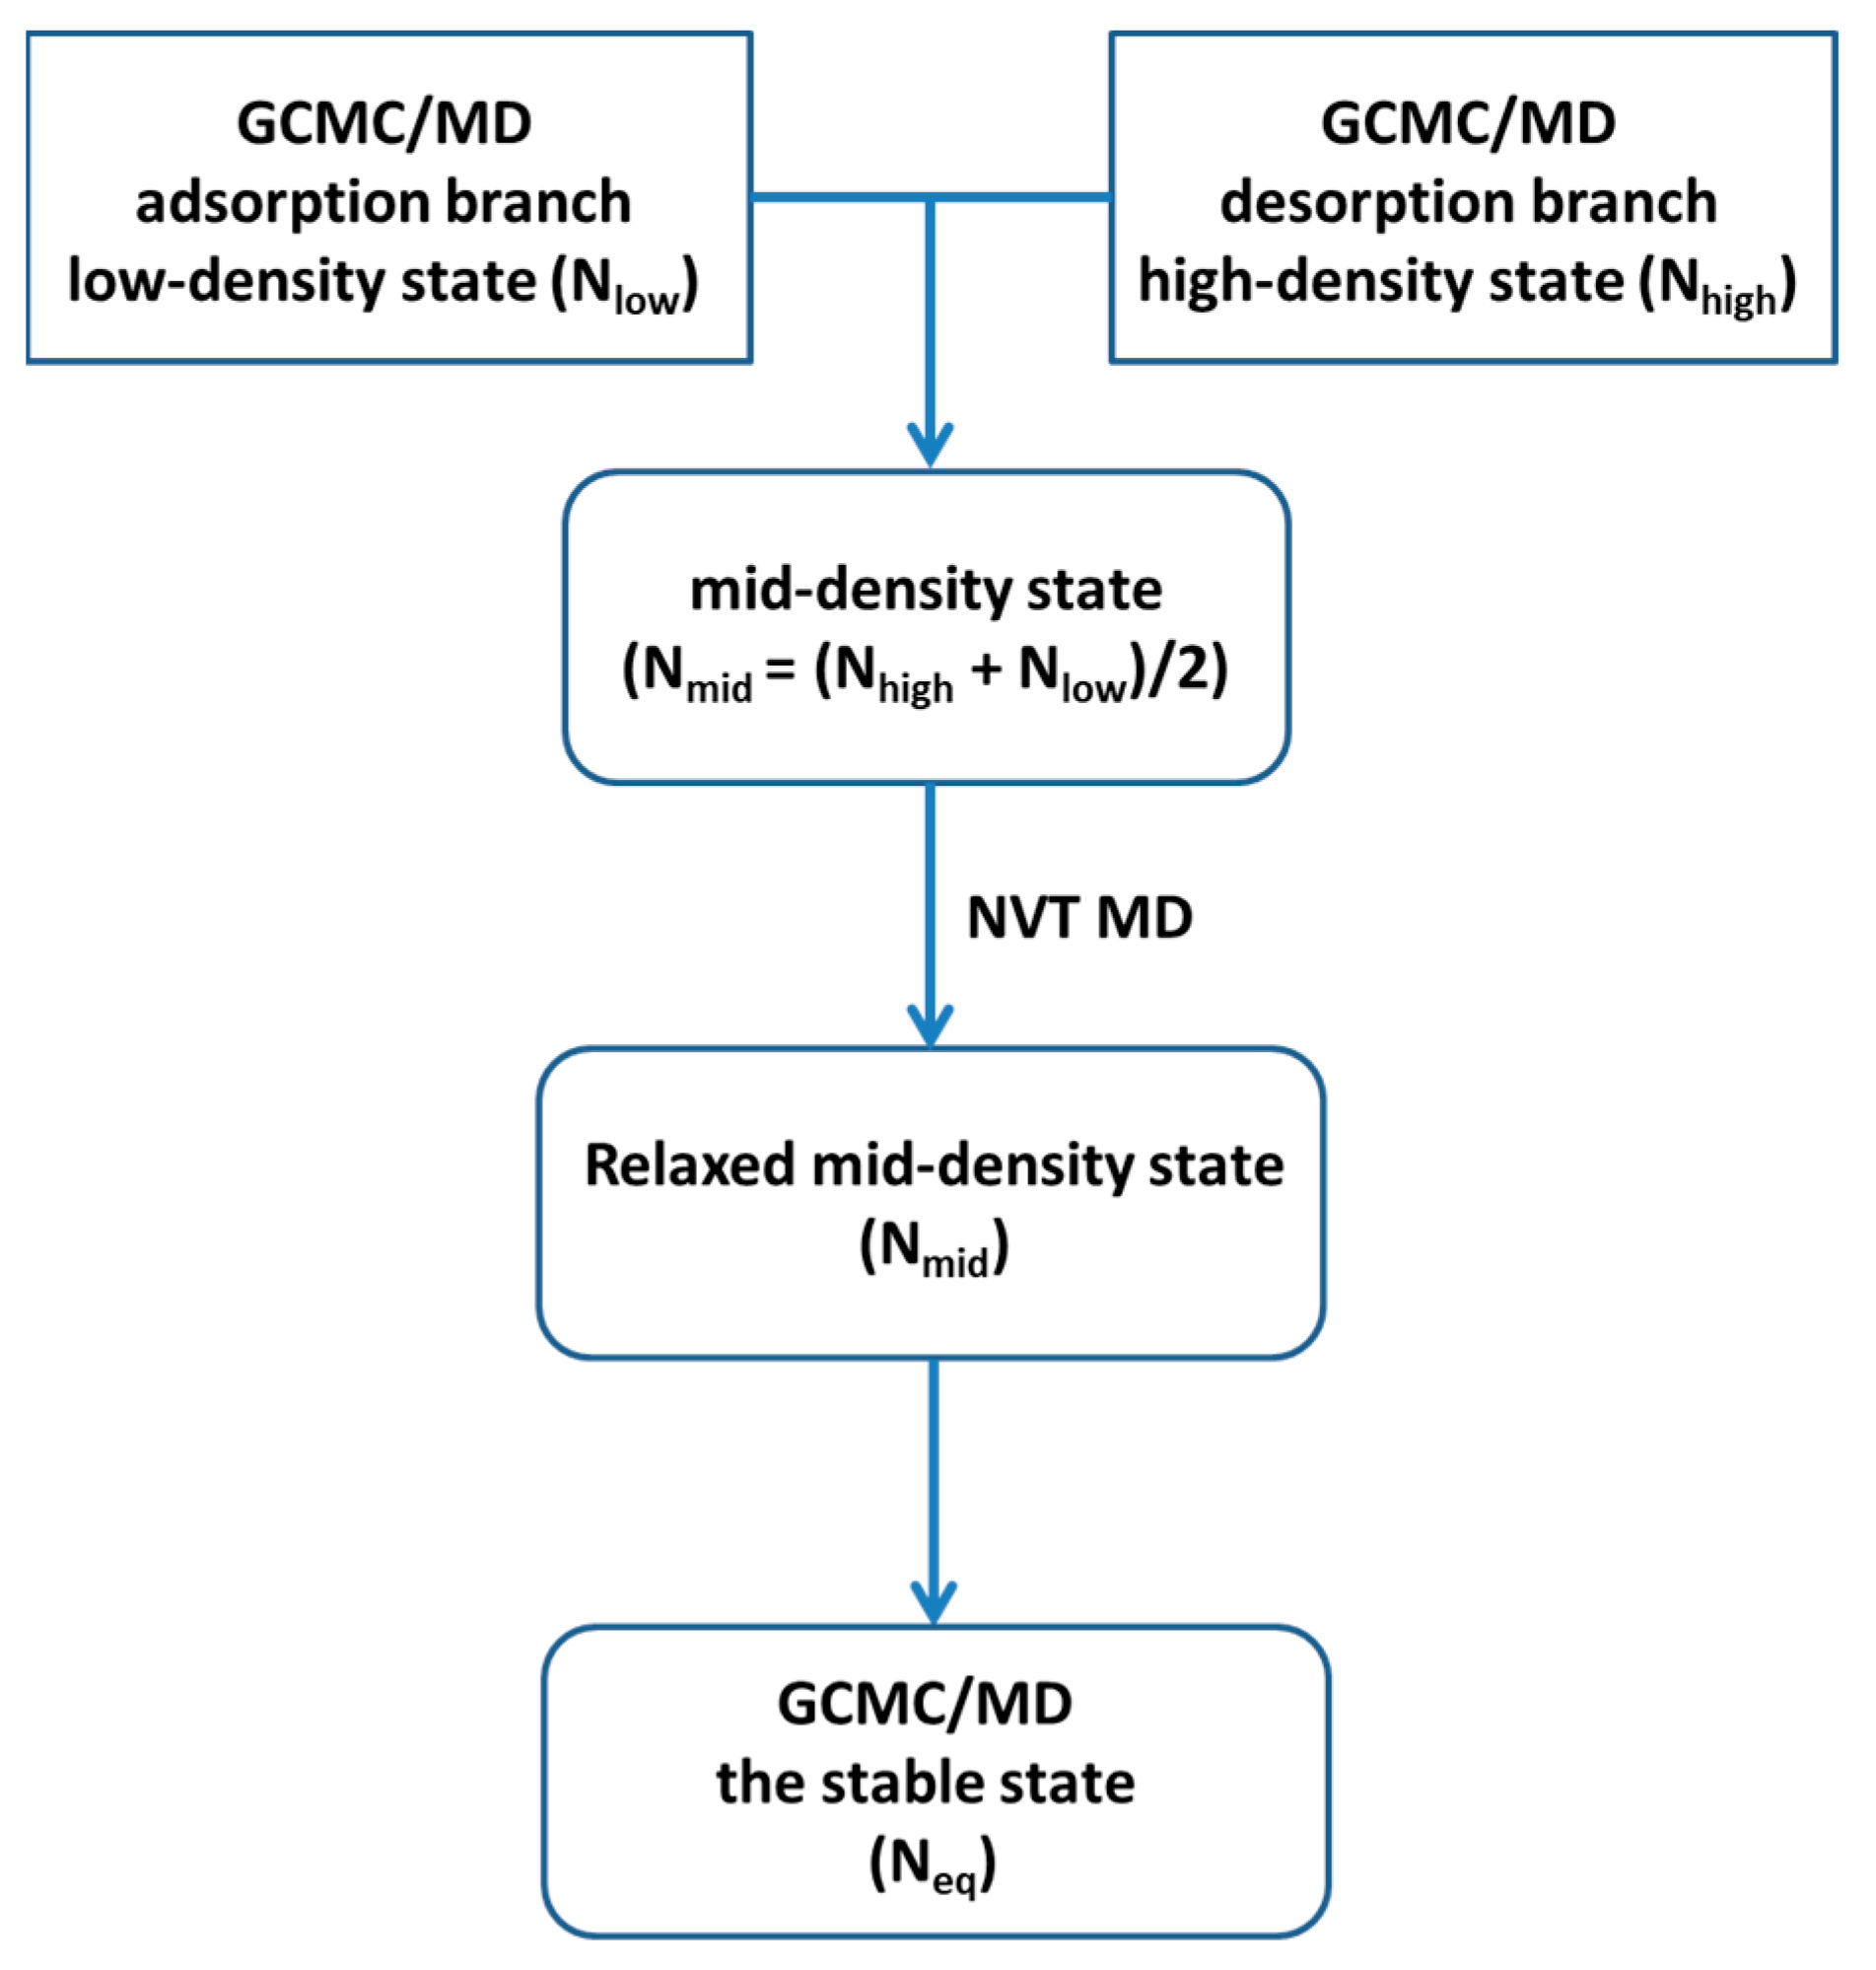
The detailed procedures are as follows: (1) For each chemical potential, there are two states: low-density state (with average Nlow argon molecules in the confined region) on the adsorption branch and high-density states (with average Nhigh argon molecules in the confined region) on the desorption branch. (2) The number of particles in the mid-density state is the average of the number of particles in the low-density state and the high-density state, i.e., Nmid = (Nhigh + Nlow)/2. (3) The mid-density state can be constructed by randomly deleting (Nhigh − Nlow)/2 molecules from the high-density state. (4) Run the NVT MD simulation to completely relax the system with Nmid particles. (5) As a final step, the hybrid GCMC/MD simulation is performed for a sufficiently long time and the final state obtained is considered to be the stable state. It is summarized in the flowchart shown in Figure 2.

3. Results and Discussion

Our previous LVMD simulations show that the critical layer number, nc, at which the confinement-induced liquid-like to solid-like phase transition occurs, does not depend on the size of the contact area, but depends on the nature of contact [16]. As to the commensurate contact, this number is nc = 7, while in the case of the incommensurate contact, it is nc = 5, the same critical layer number for mica-cyclohexane-mica contact [15]. Our special interest is in the equilibrium state in both commensurate and incommensurate contacts at nc and nc + 1 monolayer thickness.

3.1. Commensurate Contact Simulations

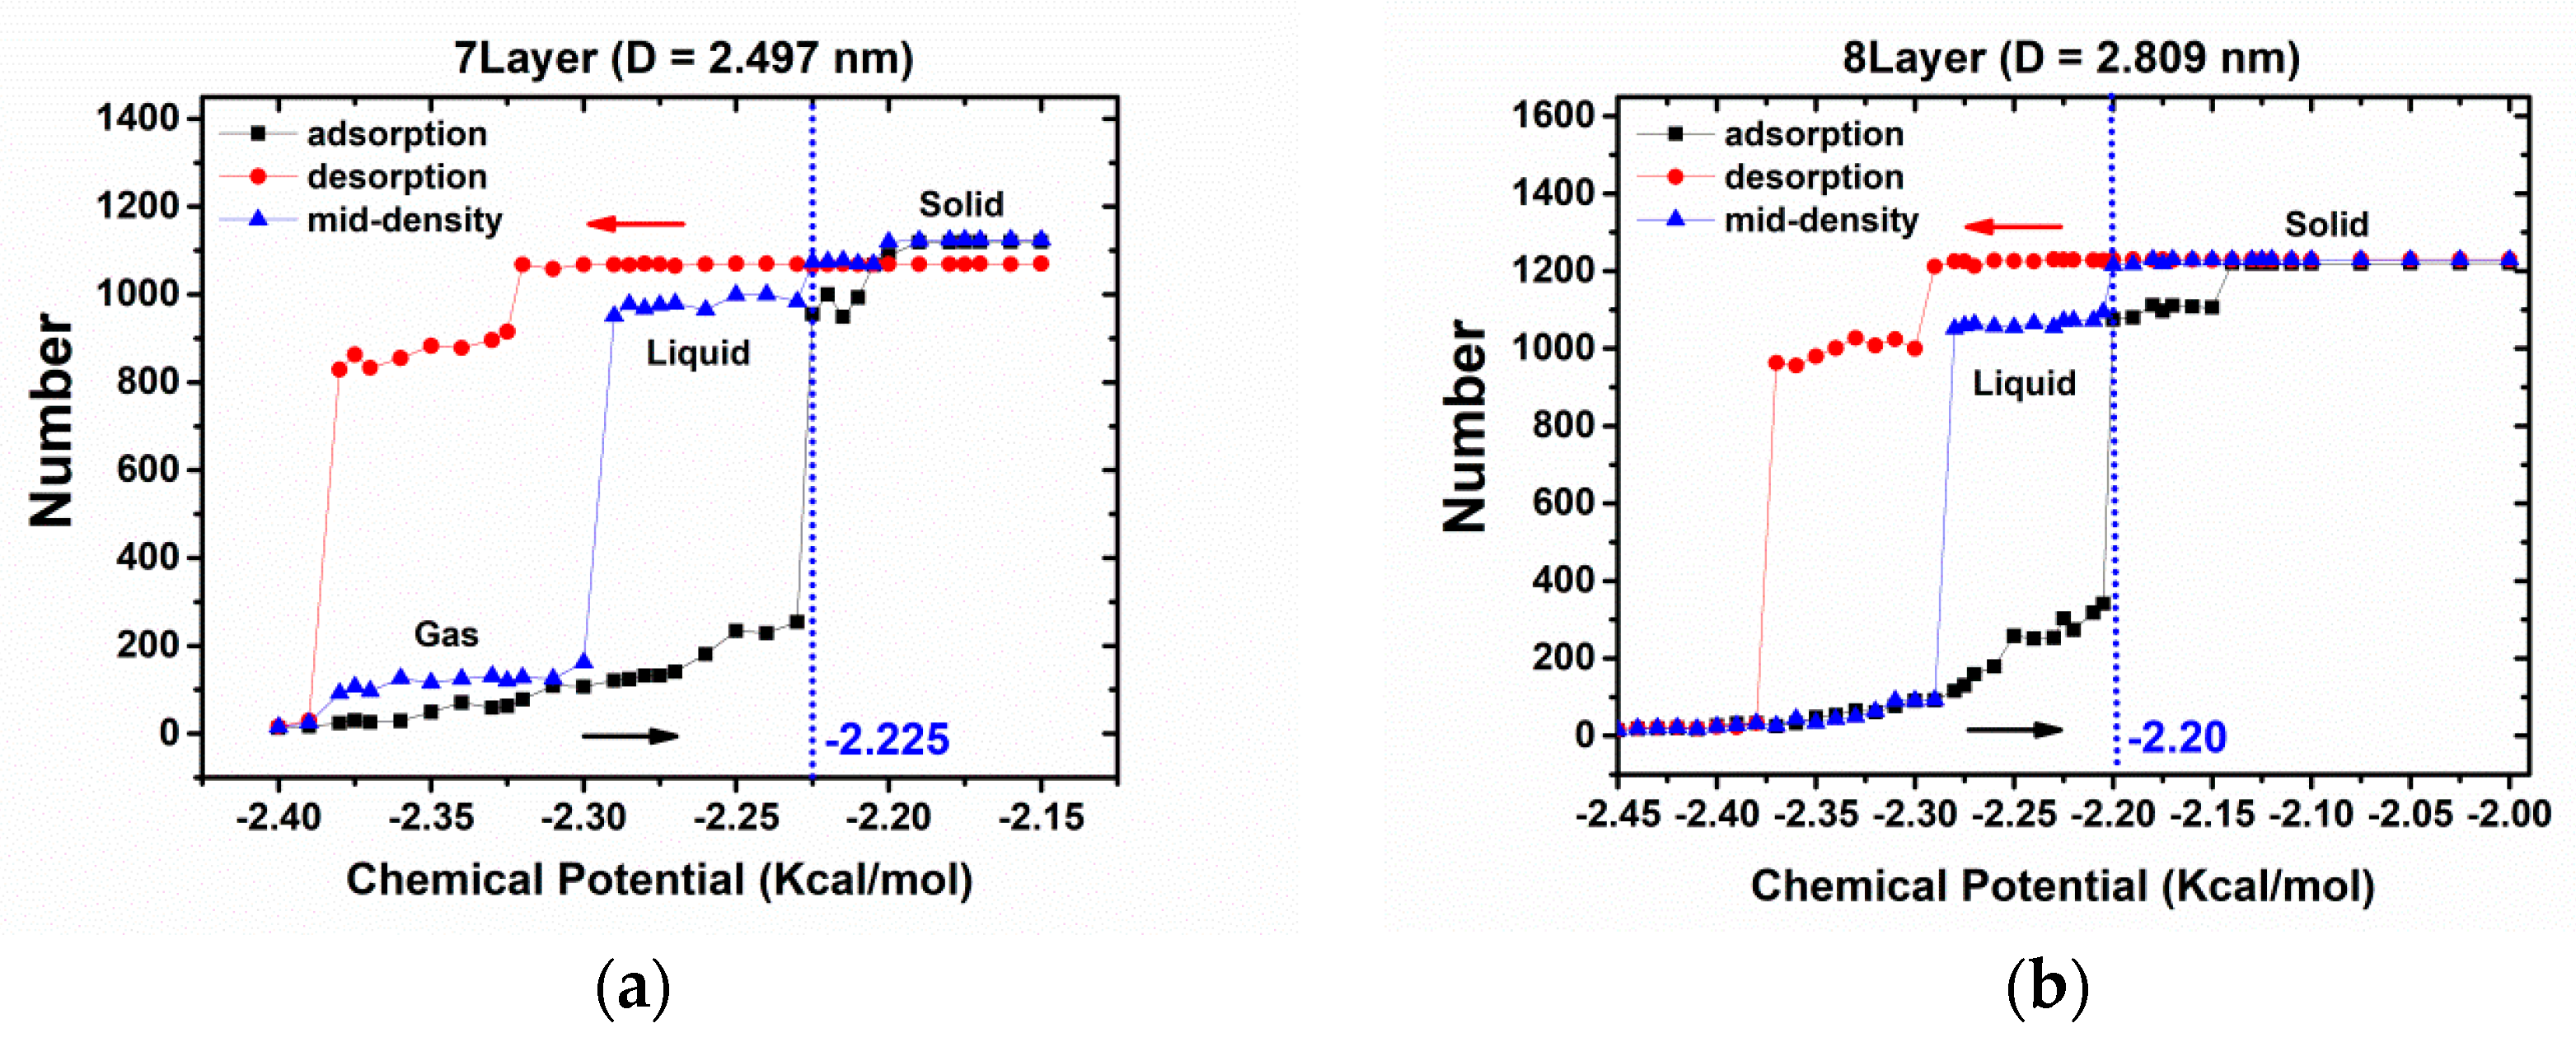
For the perfect commensurate contact, hybrid GCMC/MD simulations are performed at n = 7 and n = 8 monolayer thickness. The adsorption-desorption isotherms are shown in Figure 3. The black and red curves represent adsorption and desorption branches respectively, which form two very broad hysteresis loops. The overall pattern of each adsorption and desorption branch is a three-step shape, representing the gas, liquid and solid phases respectively.
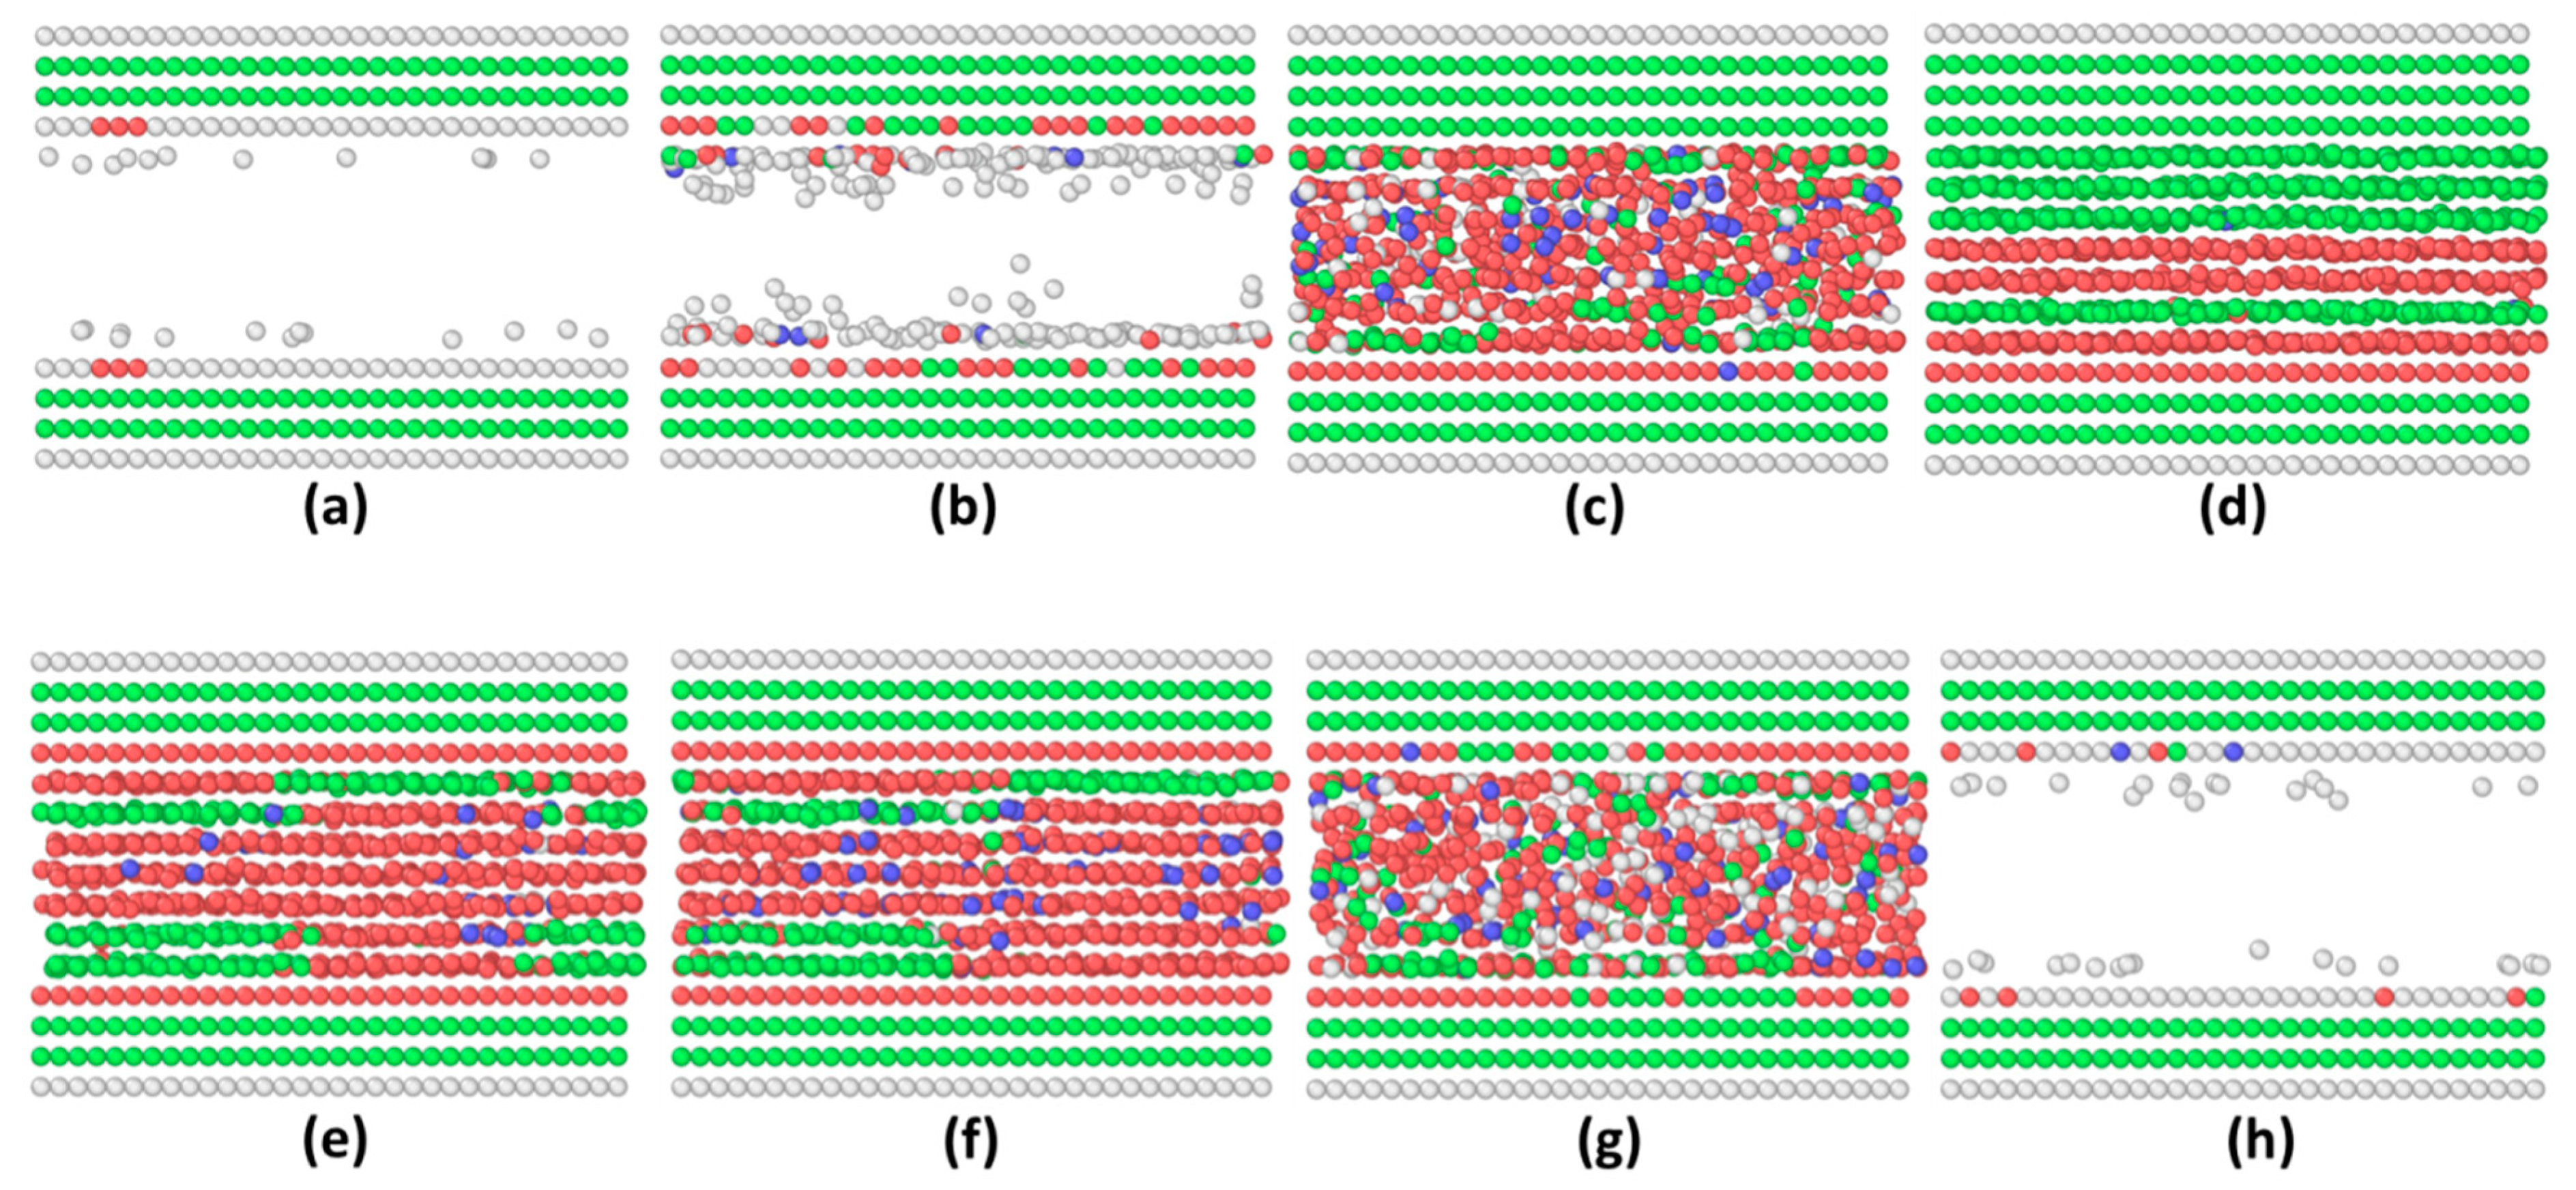
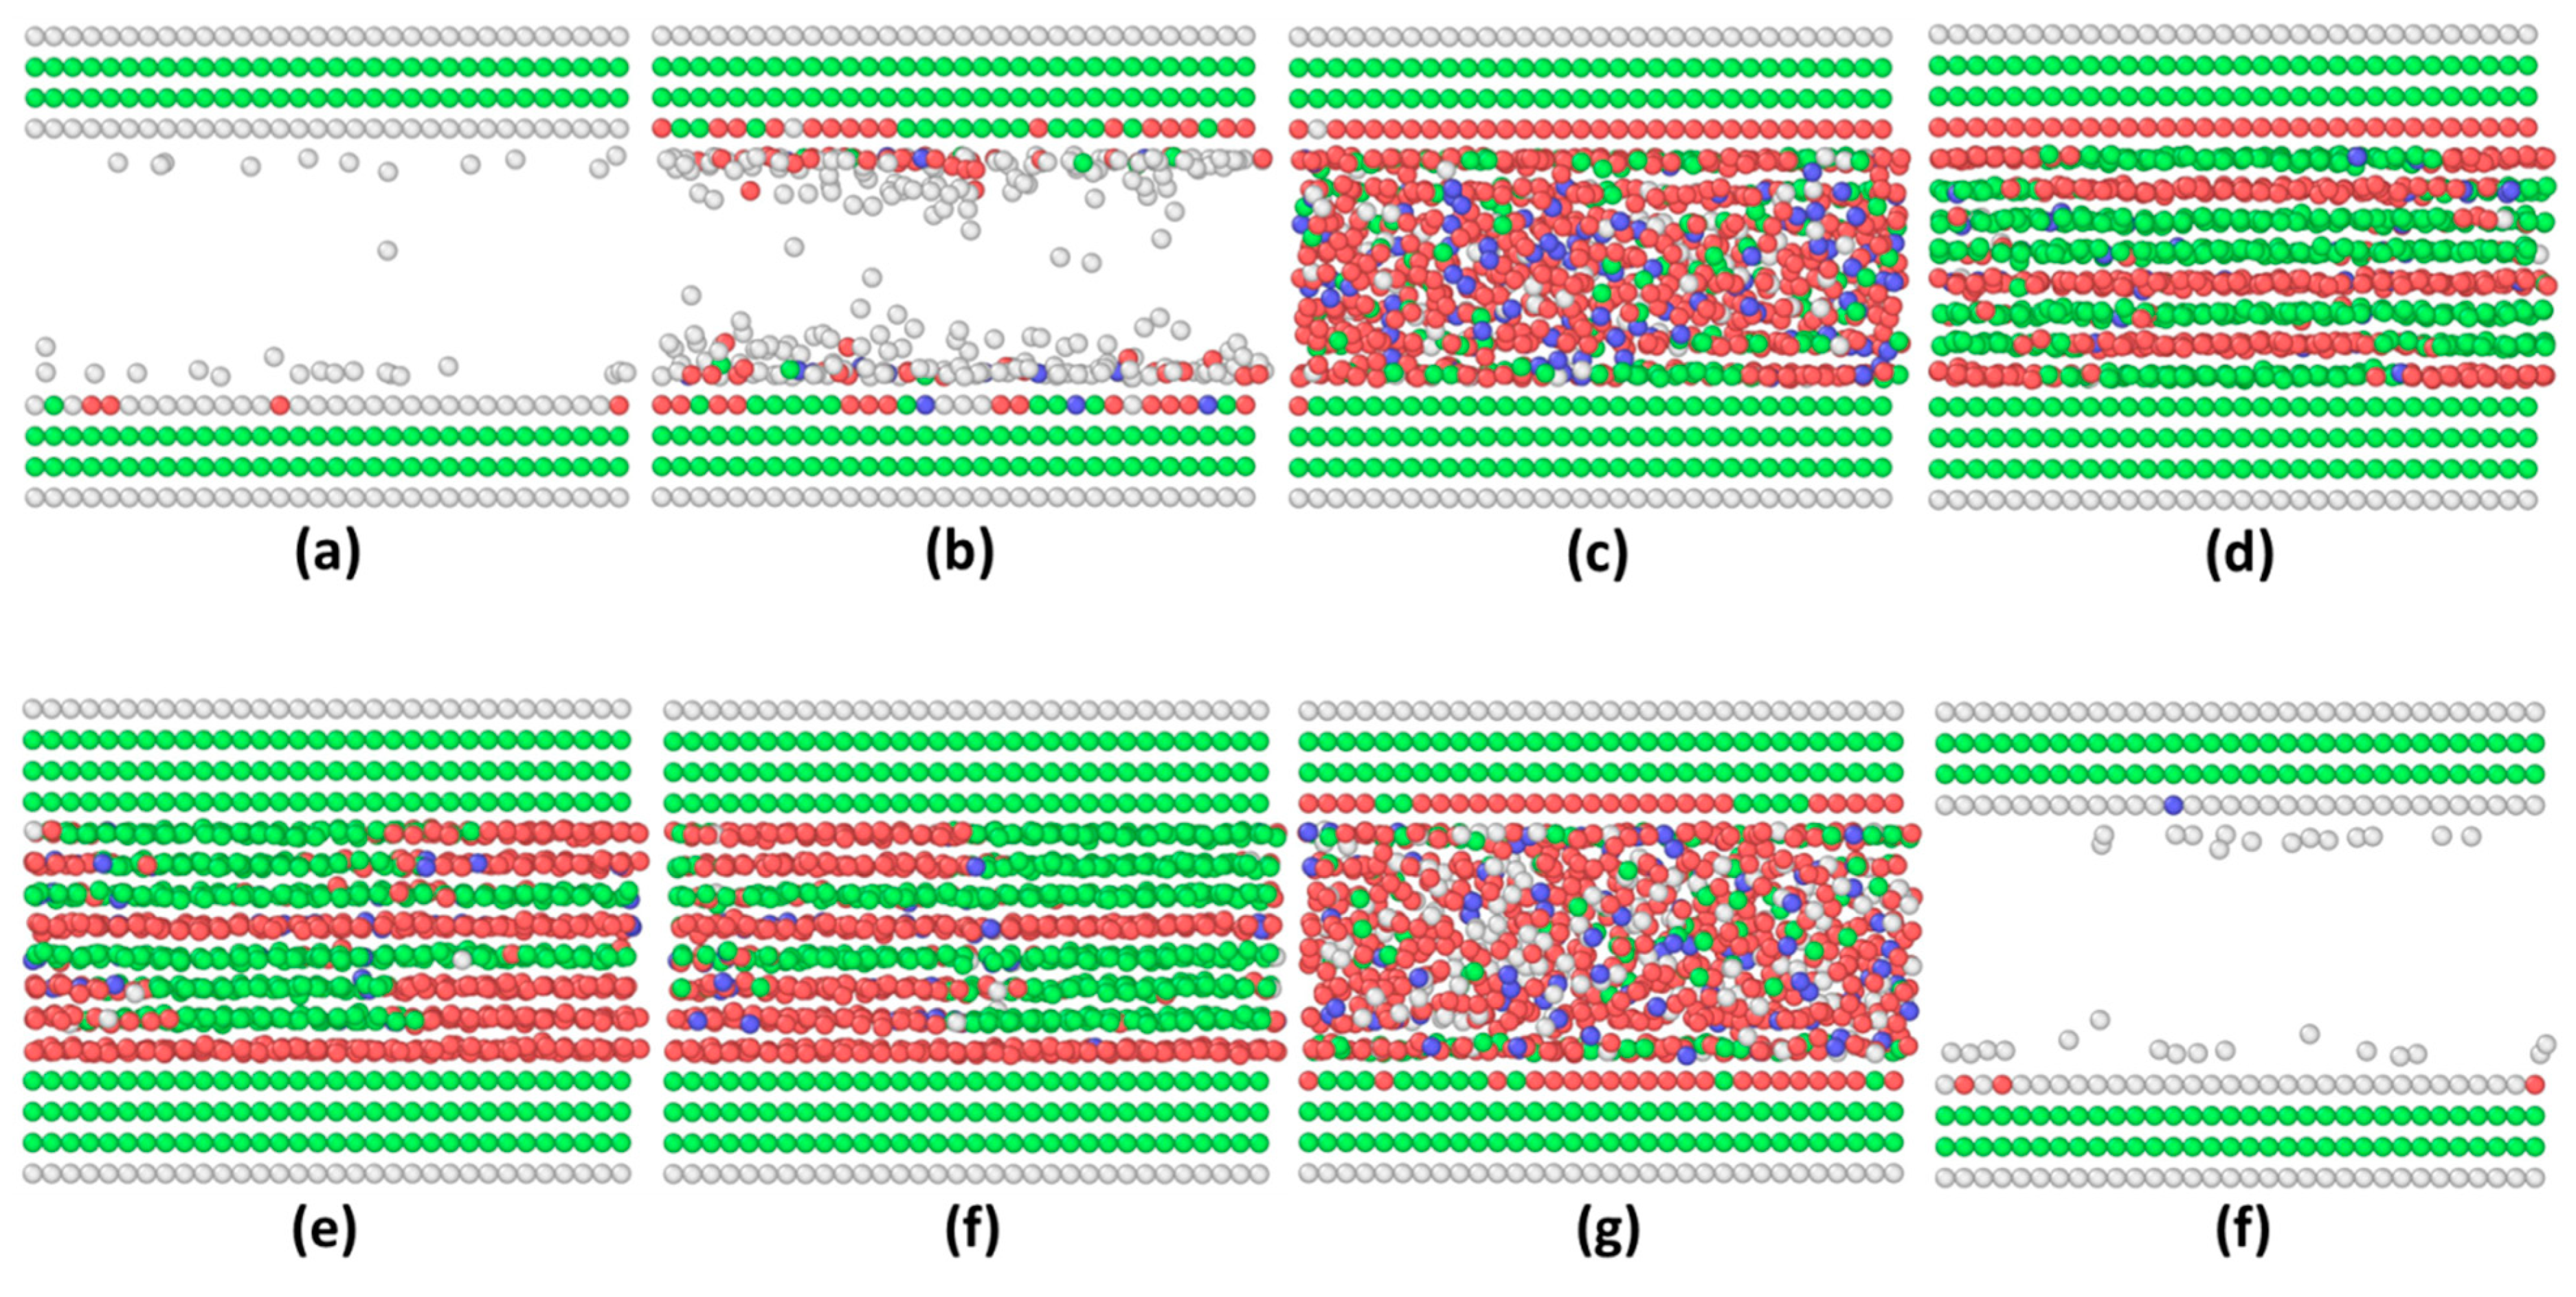
As to n = 7 monolayer, the adsorption branch starts with μ = −2.40 kcal/mol, in which the system is in a state of dilute gas phase and the argon atoms are moving close to the confining walls (Figure 4a). As the chemical potential increases, the number of atoms in the gas phase increases and two contact layers are formed (Figure 4b). At μ = −2.225 kcal/mol, the system experiences a gas to liquid phase transition with a sharp increase in the number of particles (Figure 4c). At μ = −2.19 kcal/mol, the system undergoes a liquid to solid phase transition, in which FCC layers and HCP layers alternate to form 7 solid layers (Figure 4d). The desorption branch starts with μ = −2.15 kcal/mol, in which the solidified film is formed in a polycrystalline state that has FCC and HCP crystal structures. The grain boundaries between FCC and HCP crystals are clearly seen in the two outmost contact layers as shown in Figure 4e. The middle three layers are all in HCP structures. Due to existence of grain boundaries and defects, the number of argon particles in such a polycrystalline state is smaller than that in solid state in the adsorption branch in which the packing structure is more compact (Figure 4d). As the chemical potential decreases, the number of atoms in solid state remains constant and the microstructure does not change a lot. At μ = −2.325 kcal/mol, the system experiences a solid (Figure 4f) to liquid phase transition (Figure 4g). At μ = −2.40 kcal/mol, the system goes back to the gas phase (Figure 4h), completing the hysteresis loop.
As the next step, the mid-scheme is applied to these adsorption and desorption isotherms to obtain the equilibrium phase as shown in the blue curves in Figure 3a. When μ ≤ −2.30 kcal/mol, the system is in the gas phase and the number particles in the gas phase is notably larger than that in the adsorption branch. When chemical potential is in the range of [−2.29, −2.22] kcal/mol, the equilibrium state is the liquid phase. As can be seen, the solid state exists when chemical potential is larger than −2.225 kcal/mol. Still, two possible solid states are observed: a polycrystalline state similar to that in Figure 4e with smaller chemical potential and 7 solid layers with stacking fault similar to that in Figure 4d corresponding to larger chemical potential.
We repeat the same procedure for the case of n = 8 monolayer thickness. The shape of the hysteresis loop is similar to the n = 7 monolayer case and, as expected, it is wider. In this case, there is no much difference between the two solid states in adsorption and desorption branches (Figure 5d,e). They are both in the polycrystalline state and the grain boundaries between FCC and HCP crystals are in the two or three outmost contact layers. Based on the mid-density scheme applied to the isotherms, the liquid state is the stable phase when chemical potential is smaller than −2.20 kcal/mol but larger than −2.29 kcal/mol.
Since the critical layer number for the perfect commensurate contact is nc = 7 in LVMD simulations, the confined film is in liquid state at n = 8 layers and is in solid state at n = 7 layers. Taken together, the appropriate chemical potential should be in the range of [−2.225, −2.20] kcal/mol, which can reproduce the correct equilibrium phase for n = 7 and 8 layers observed in LVMD simulations.
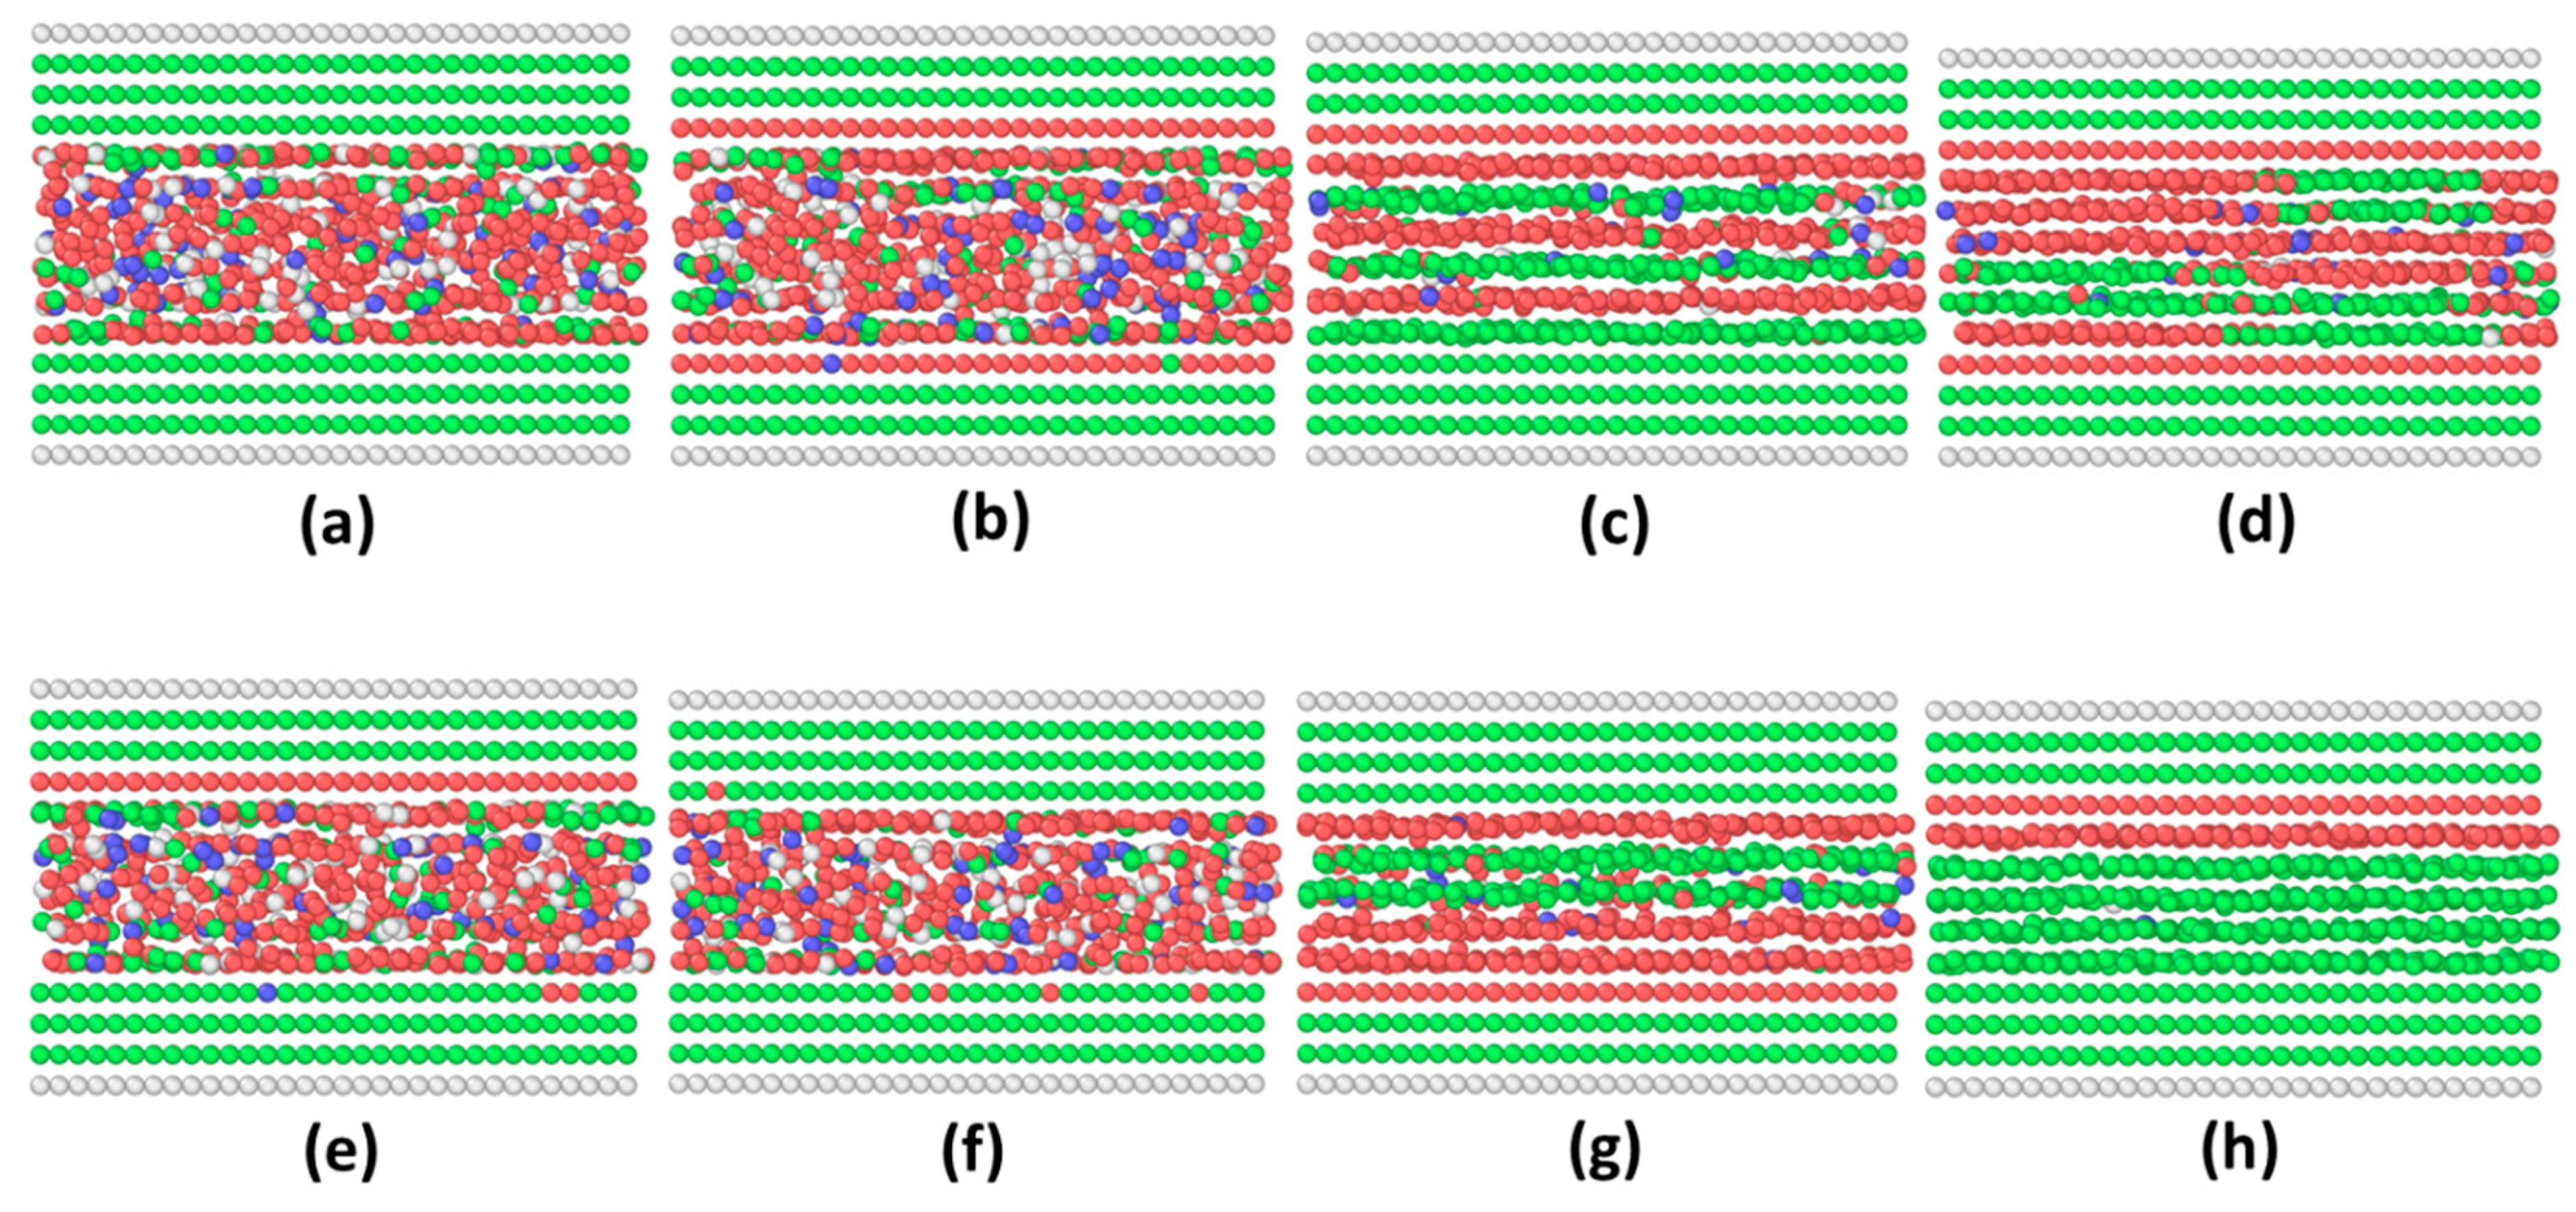
In the next step, we select chemical potential μ = −2.21 kcal/mol for the rest of simulations with varying thickness. As can be seen in Table 2, all the equilibrium phases predicted in GCMC simulations (Figure 6) are consistent with the observations of LVMD simulations (see Figure A1), which confirms that μ = −2.21 kcal/mol is an appropriate choice for running GCMC/MD simulations. With this chemical potential, GCMC/MD can produce equilibrium configuration for future simulations coupled with metadynamics.

3.2. Incommensurate Contact Simulations

We now consider the incommensurate contact between the confining wall and the solidified film. The critical number of monolayers in the film for liquid-like to solid-like phase transition is nc = 5. Following the same procedure in the case of commensurate contact, the hybrid GCMC/MD simulations are performed at n = 5 and n = 6 monolayer thickness. The adsorption and desorption isotherms are shown in Figure 7. The black and red curves represent adsorption and the desorption branches, respectively. The blue curves show the equilibrium states by applying the mid-density scheme to the adsorption-desorption isotherms. The overall pattern of the hysteresis loop is similar to that in the commensurate case except the desorption branch at n = 5 monolayer in which the liquid phase is absent.
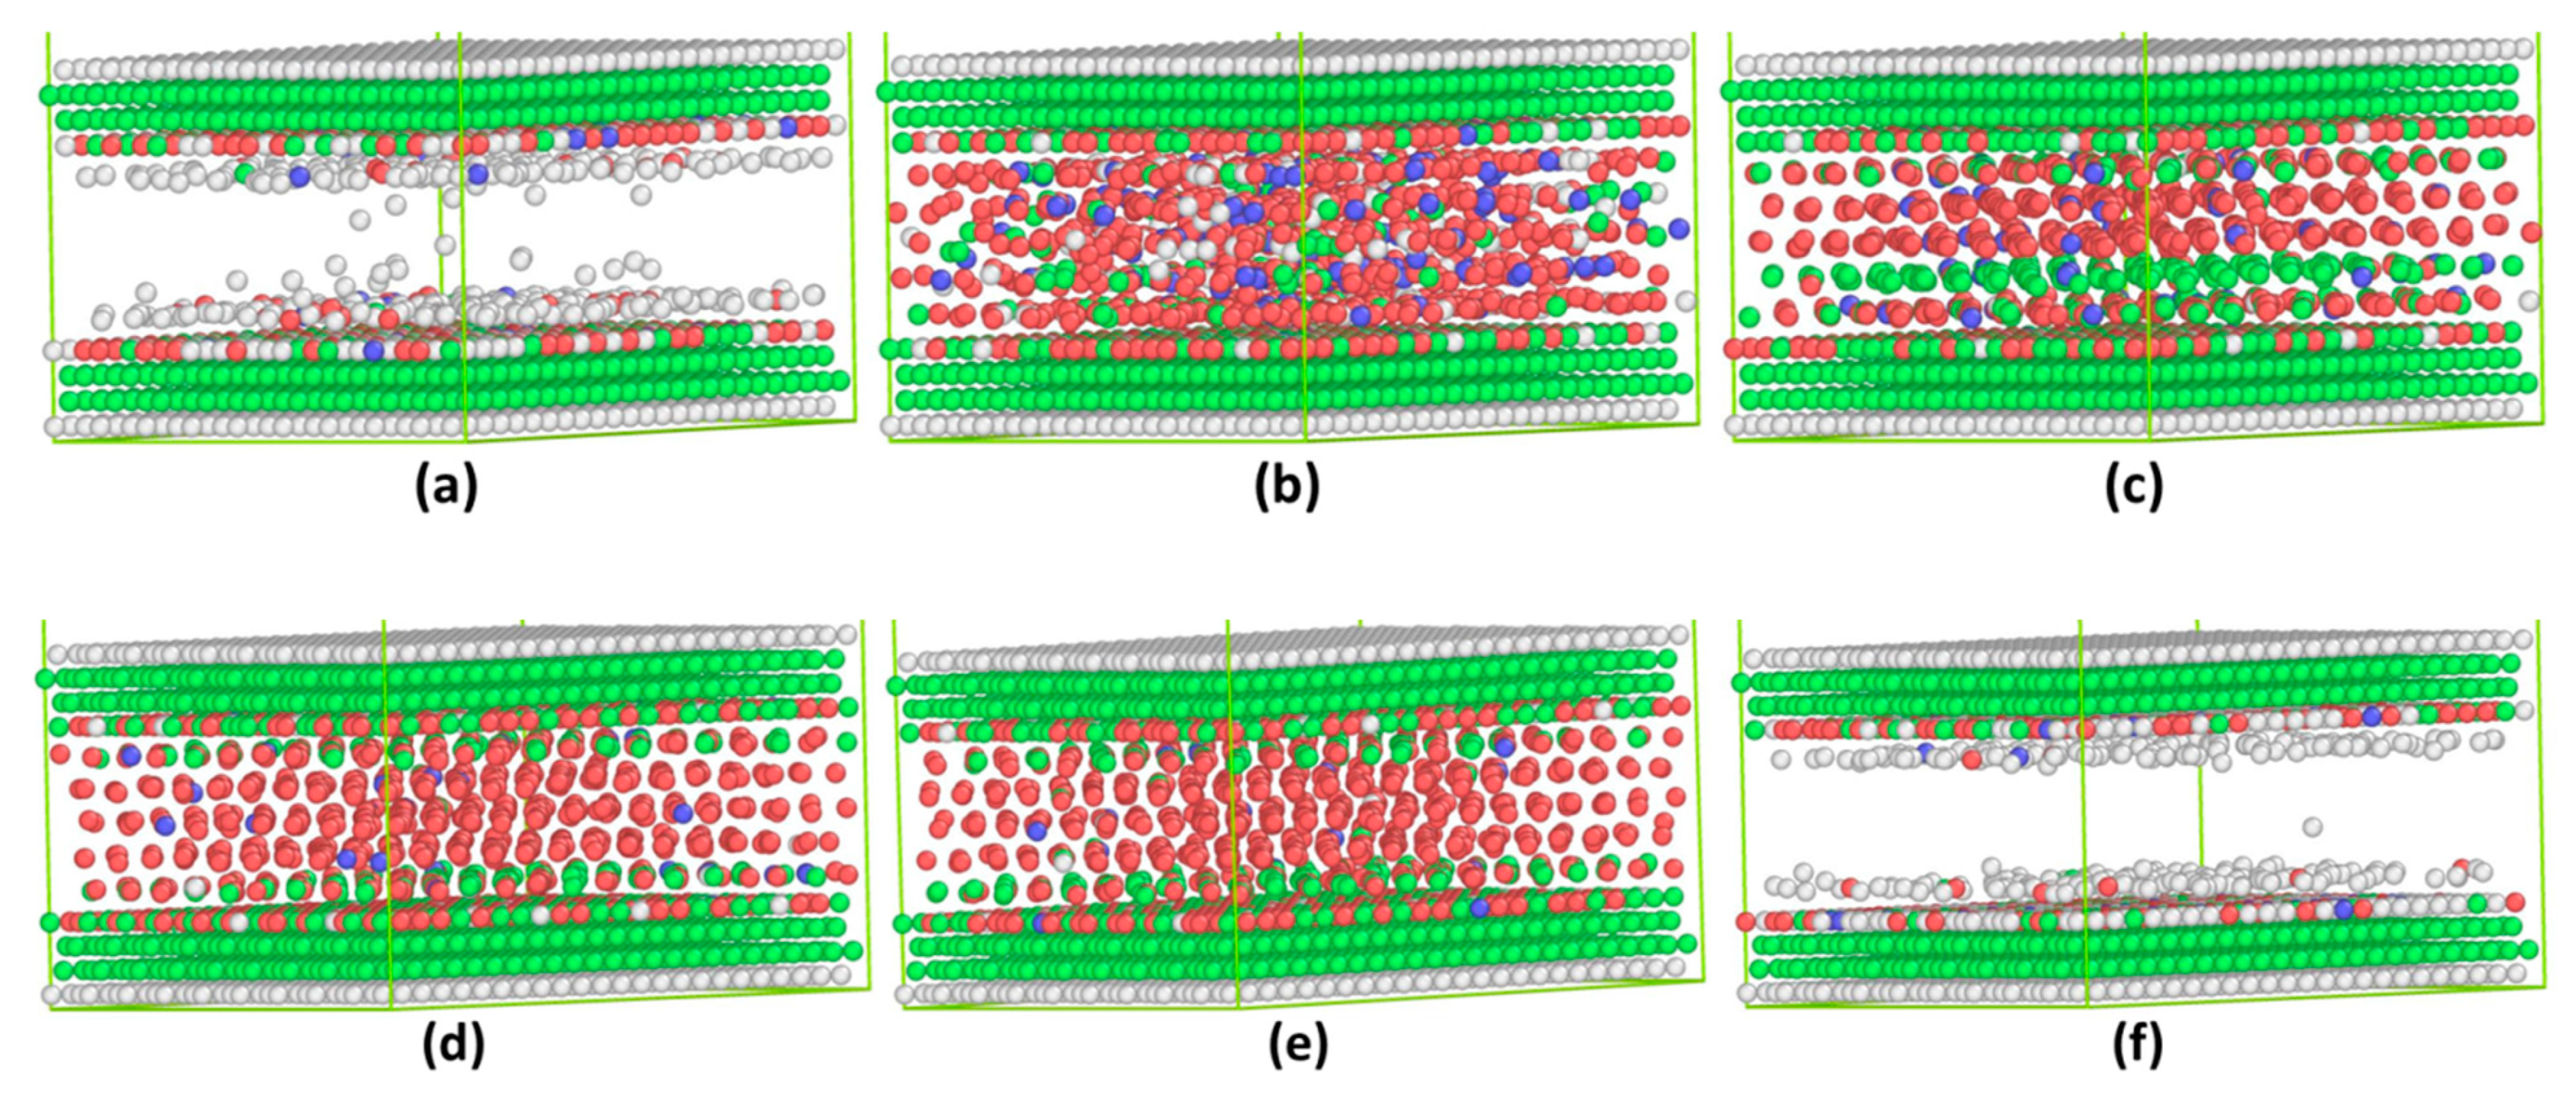
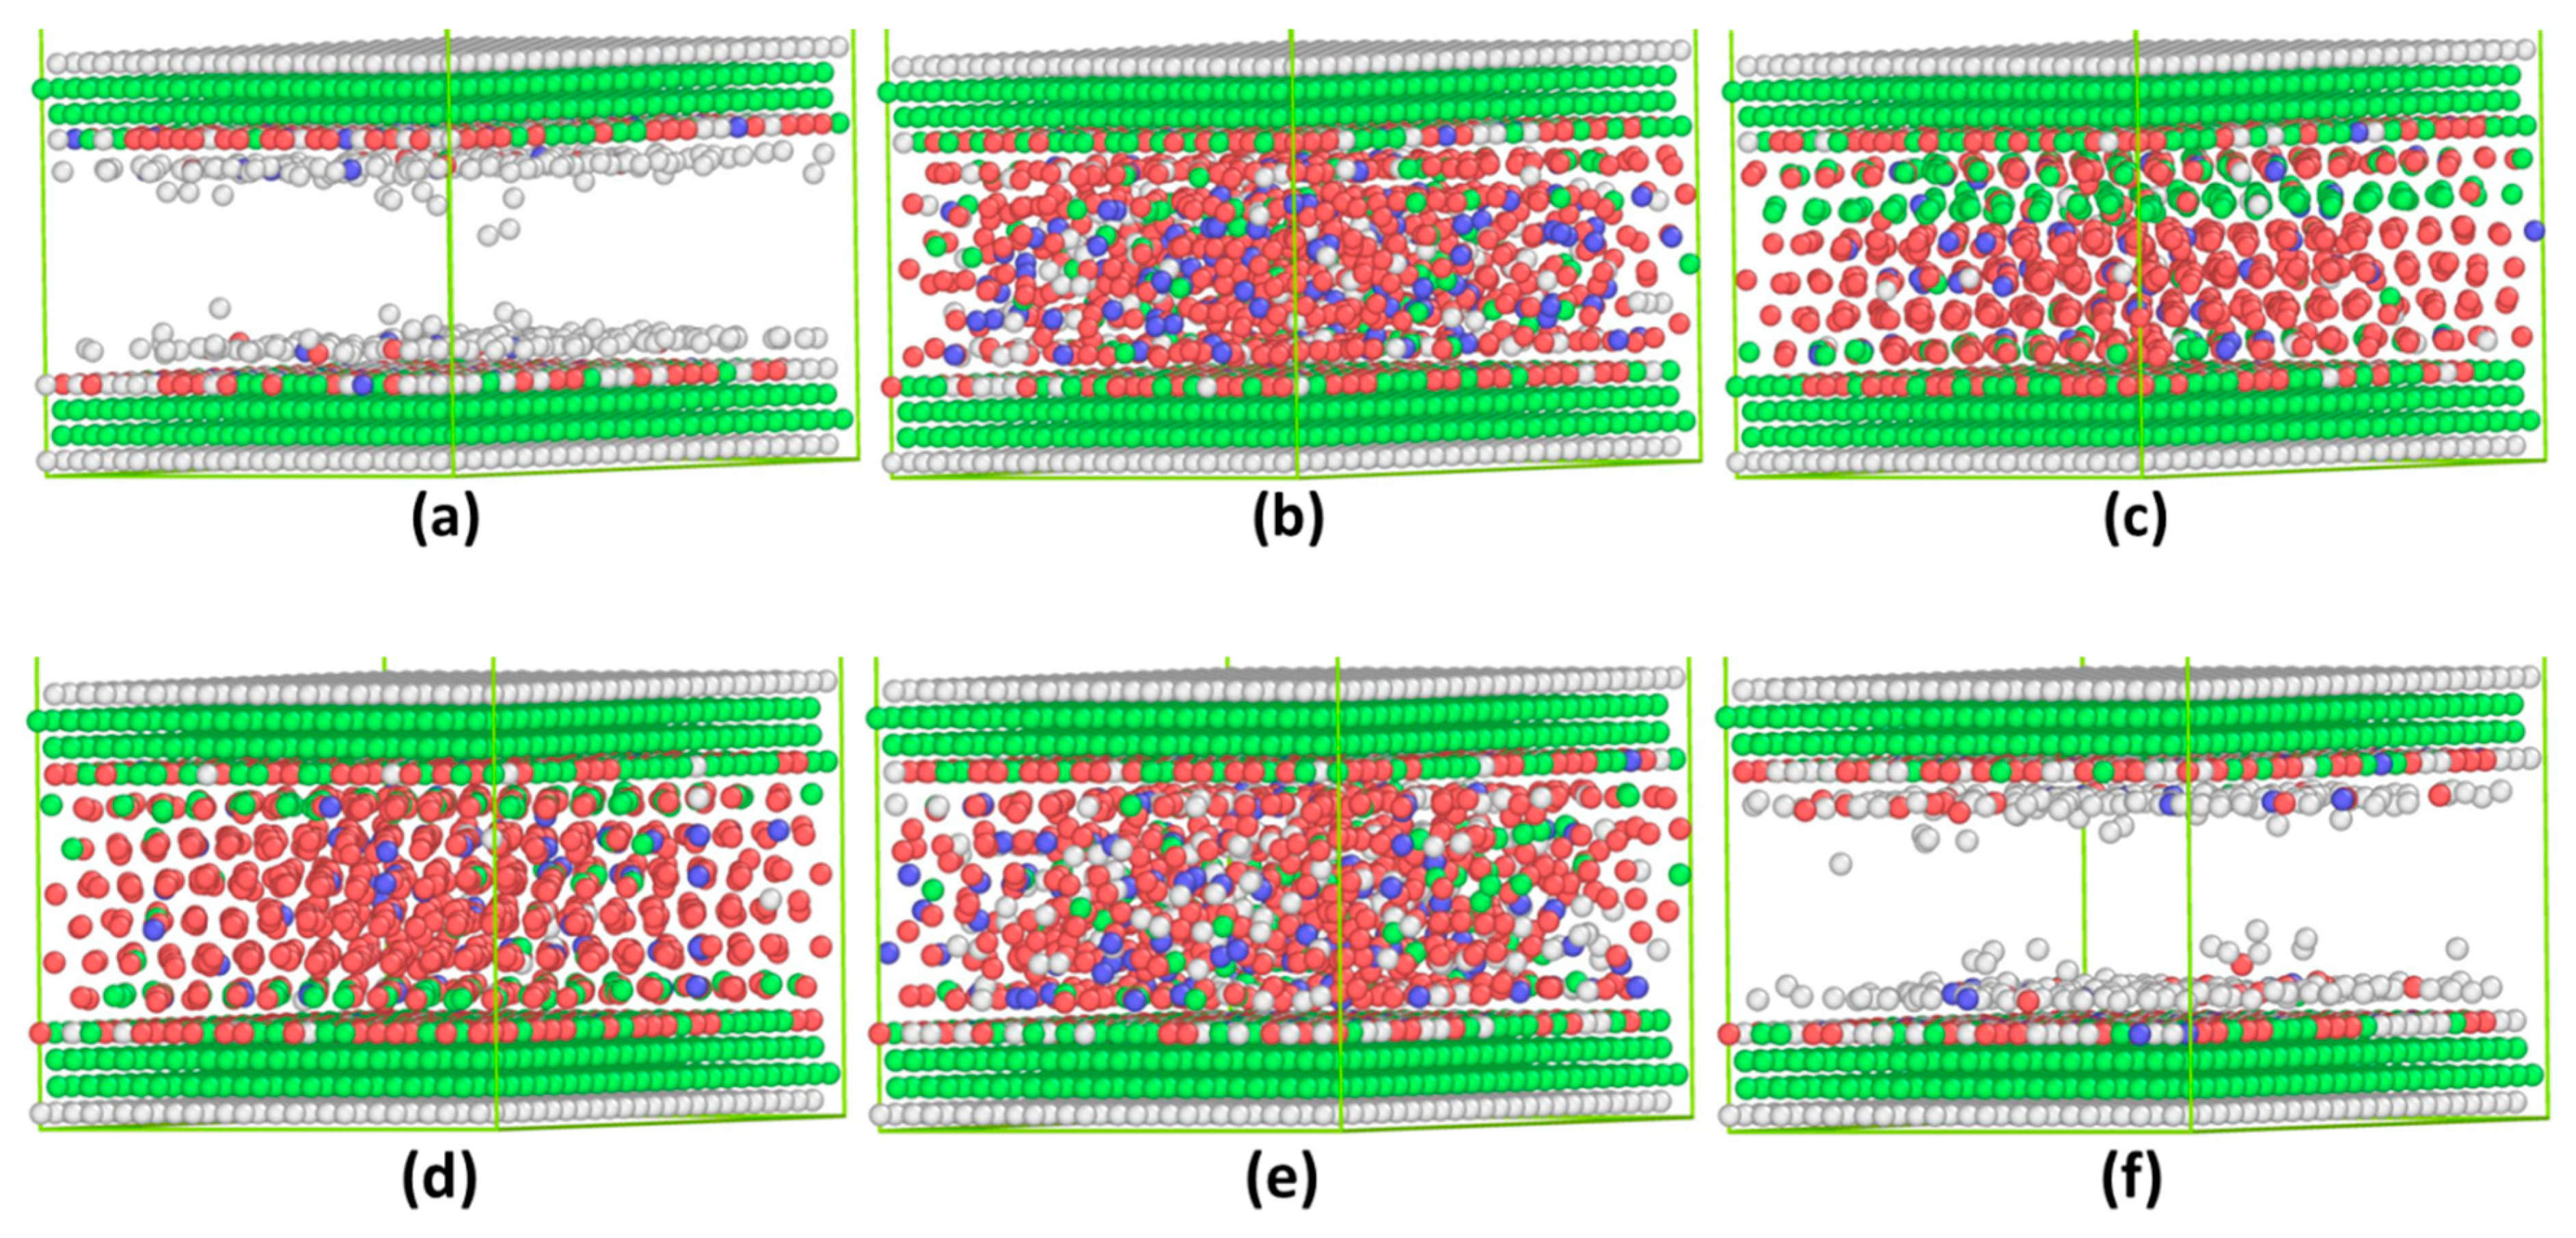
As for the n = 5 monolayer, in the adsorption branch, the equilibrium state is the gas phase with chemical potential in the range of [−2.60, −2.33] kcal/mol (Figure 8a). Liquid state (Figure 8b) can only exist in a very narrow range (from −2.325 kcal/mol to −2.320 kcal/mol), which is followed by solid phase when chemical potential μ ≥ −2.31. It should be noted that the normal of the (111) close packed plane of the solid structure is nearly along the diagonal direction in the lateral x–y plane (Figure 8c). The desorption branch starts with μ = −2.15 kcal/mol, in which the solidified film is formed. Compared with the solidified structure in the adsorption branch (Figure 8c), the lattice orientation is different and its close packed normal is off the diagonal of the lateral xy plane (Figure 8d). The slightly different configurations can explain the difference in the number of particles in solidified structures (Figure 8c,d). As the chemical potential decreases, the number of atoms in solid state remains constant and the microstructure does not change a lot (Figure 8e). At μ = −2.515 kcal/mol, the system experiences a solid (Figure 8e) to gas phase transition (Figure 8f), completing a hysteresis loop. In this case, no liquid phase is observed. In the next step, the mid-scheme is applied to these adsorption and desorption isotherms to obtain the equilibrium phase as shown in the blue curves in Figure 7a. It can be seen that the equilibrium phase is the solid state when chemical potential is larger than −2.31 kcal/mol. For the case of n = 6 monolayer, even though the lattice orientations of the solidified structures in the adsorption and desorption branches are different (Figure 9c,d), there is no distinct difference in the number of particles in the solid structures. As can be seen, the liquid state is the stable phase when chemical potential is in the range of [−2.33, −2.25] kcal/mol. Considering the critical layer number for the incommensurate contact being nc = 5 in LVMD simulations, the appropriate chemical potential should be in the range of [−2.31, −2.25] kcal/mol, which can reproduce the correct equilibrium phase for n = 5 (in solid state) and n = 6 (in liquid state) monolayer observed in LVMD simulations. In the following, chemical potential μ = −2.28 kcal/mol is adopted for the rest of the simulations with varying thicknesses as shown in Table 3. All the equilibrium phases predicted in GCMC simulations are consistent with the observations of LVMD simulations, confirming that μ = −2.28 kcal/mol is an appropriate choice.

4. Summary and Further Discussion

It has been discussed that LVMD ensemble is not suitable for metadynamics simulations, because of the coexistence of multi-phases. Instead, simple geometry with slit pores can be a proper simulation setup. In this work, hybrid GCMC/MD simulations are carried out to investigate the adsorption and desorption isotherms of argon molecules confined between commensurate and incommensurate contacts in nanoscale thickness. By applying the mid-density scheme to the hysteresis loops, the equilibrium structures associated with nc and nc + 1 layers can be obtained. The appropriate chemical potentials can be determined if the equilibrium structures predicted by GCMC/MD simulations are consistent with those observed in LVMD simulations. Such equilibrium structures at varying thicknesses obtained using GCMC/MD simulations can be used as reasonable initial configurations for further metadynamics studies to investigate the free energy profile as a function of structural order parameters.
The shift of the chemical potential due to the presence of nanoconfinement makes the selection of chemical potential μ difficult, and in many situations the choice is merely based on the bulk chemical potential. In our previous study [14], we discussed that the bulk chemical potential μ for argon at around 85 K obtained either from Widom’s insertion method in MC calculations or from the integral equation theory [49] cannot be used in GCMC simulation. In this study, we find that the appropriate chemical potential is in the range of [−2.225, 2.20] kcal/mol for the commensurate contact and [−2.31, −2.25] kcal/mol for the incommensurate contact. There is even no overlap between them, which means that no unique chemical potential can be adopted for both cases. Given the fact that confinement usually induces a shift in chemical potential when considering the equilibrium between the slit pore and bulk fluid, we expect that the shift due to the different nature of contact should also be different.
It should be noted that in previous works, researchers mainly focus on the capillary condensation (the gas-liquid transition) in the pore, in which only two phases, gas and liquid, are involved in the GCMC simulations. When the confined space comes down to the boundary lubrication (BL) regime, three phases come into play, which makes the hysteresis loop more complicated and compounds the problems of determining the equilibrium state. As a first attempt, we apply the mid-density scheme to such a hysteresis loop. There is still some uncertainty about whether the mid-density scheme can be applied to the solid phase. However, our purpose is not to construct equilibrium phase transition in a very accurate and rigorous manner, but to construct a reasonable initial configuration at a given gap distance by GCMC/MD simulations to further investigate the free energy profile vs. structural order parameters. To accurately identify the location of the phase equilibrium, the gauge cell MC method [36,37] needs to be applied in future work.

Author Contributions

Conceptualization, R.-G.X., Q.R., and Y.L.; methodology, R.-G.X., Q.R., Y.X., and M.B.; software, R.-G.X. and M.B.; validation, R.-G.X., Q.R., and Y.X.; formal analysis, R.-G.X. and Q.R.; investigation, R.-G.X.; resources, R.-G.X.; data curation, R.-G.X.; writing—original draft preparation, R.-G.X.; writing—review and editing, R.-G.X., Q.R., and Y.L.; visualization, R.-G.X.; supervision, R.-G.X.; project administration, R.-G.X. and Y.L.; funding acquisition, Y.L. All authors have read and agreed to the published version of the manuscript.

Funding

This work is supported by the American Chemical Society Petroleum Research Fund (ACS PRF), the National Science Foundation (NSF 1149704) and the National Energy Research Scientific Computing Center (NERSC).

Data Availability Statement

Data are contained within the article.

Conflicts of Interest

The authors declare no conflict of interest.

Appendix A. Equilibrium Phase in LVMD Simulations
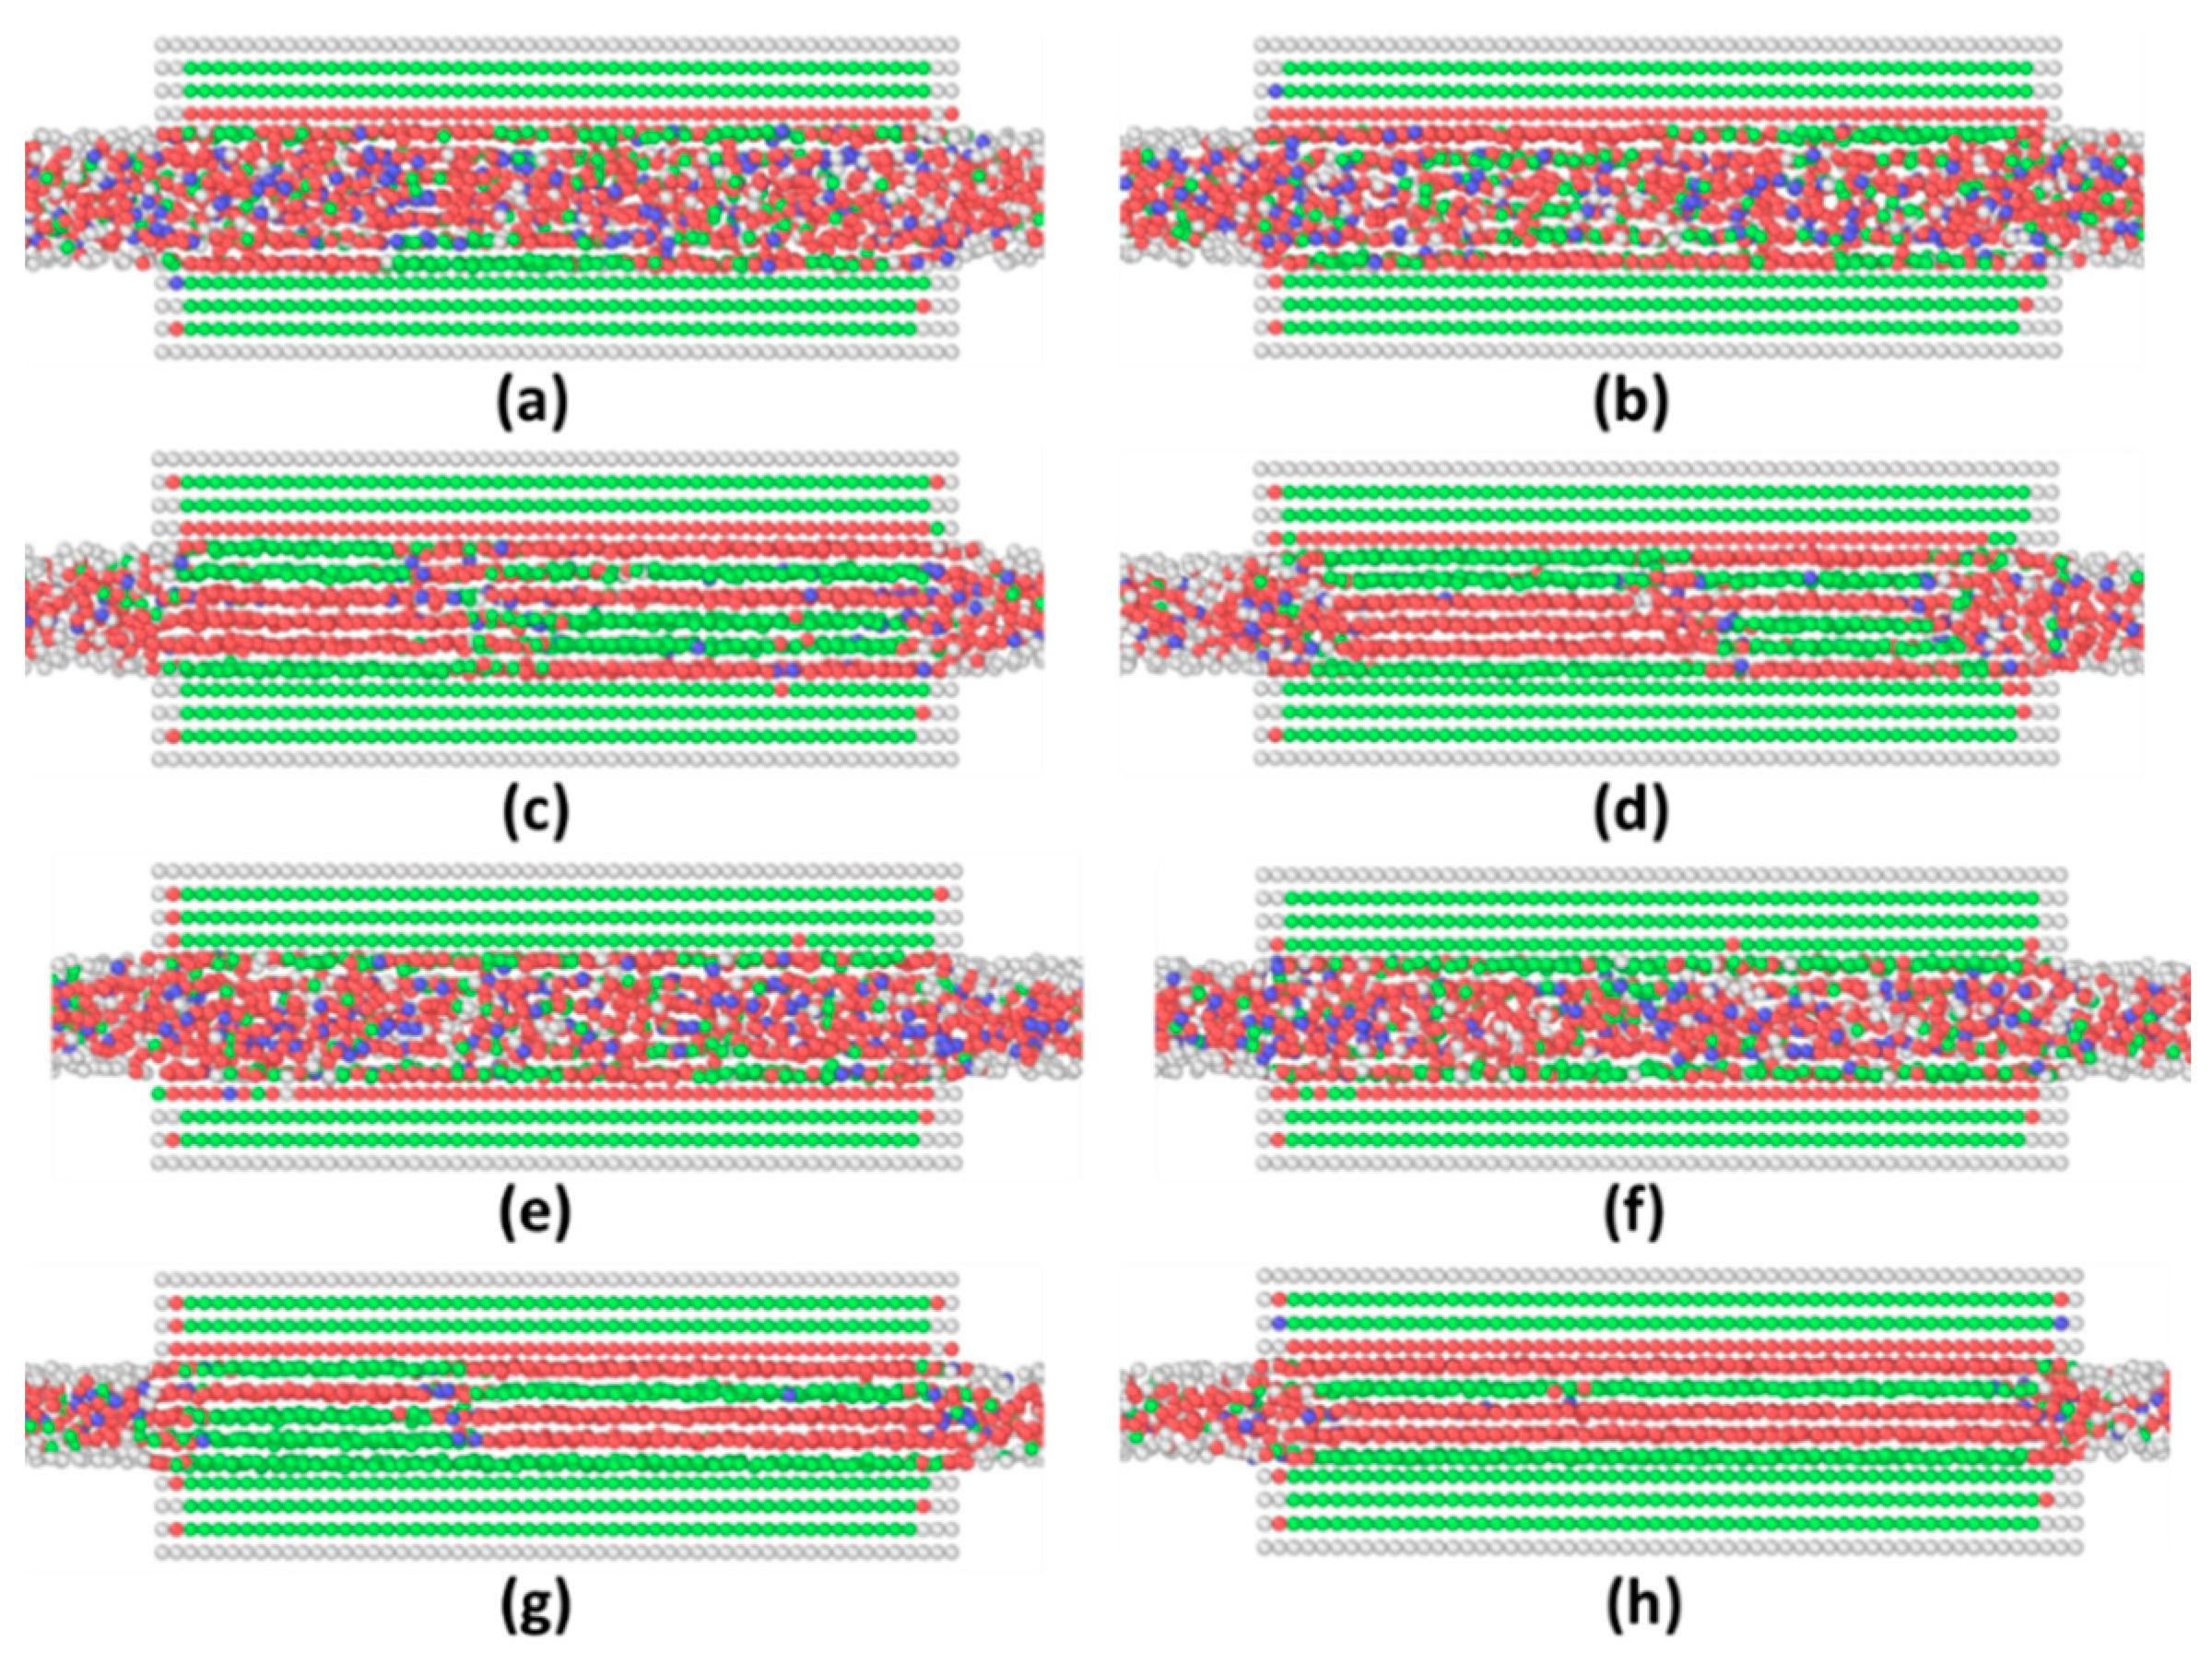
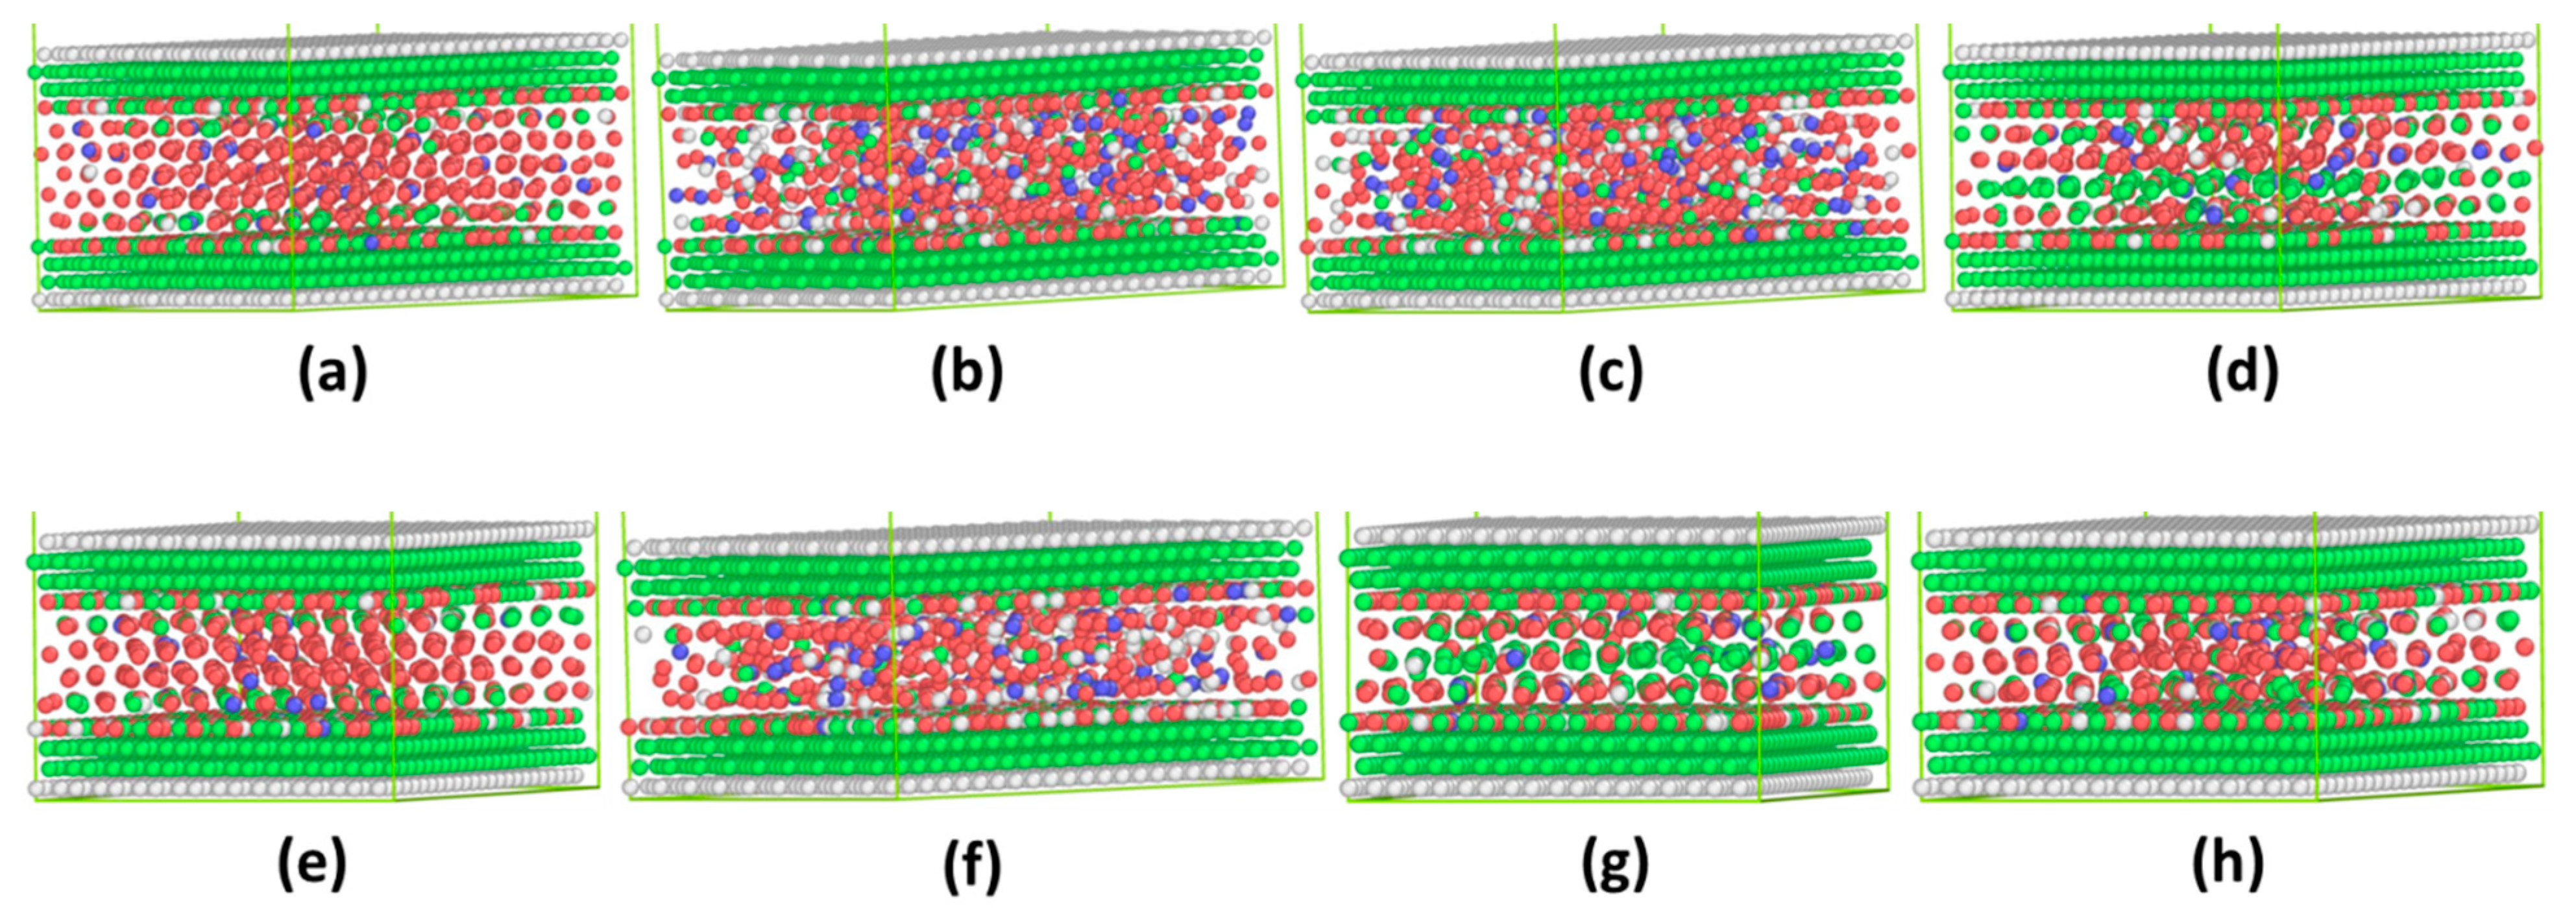
The equilibrium LVMD simulations of argon molecules confined between commensurate and incommensurate contacts are performed at a certain wall distance. It is found that the equilibrium configurations observed in LVMD simulations are consistent with those observed in GCMC/MD simulations. It should be noted that in this work, the computational cost of both LVMD and GCMC/MD simulations are within the same order of magnitude (every single LVMD or GCMC/MD simulation at each gap thickness is about a few hours long).
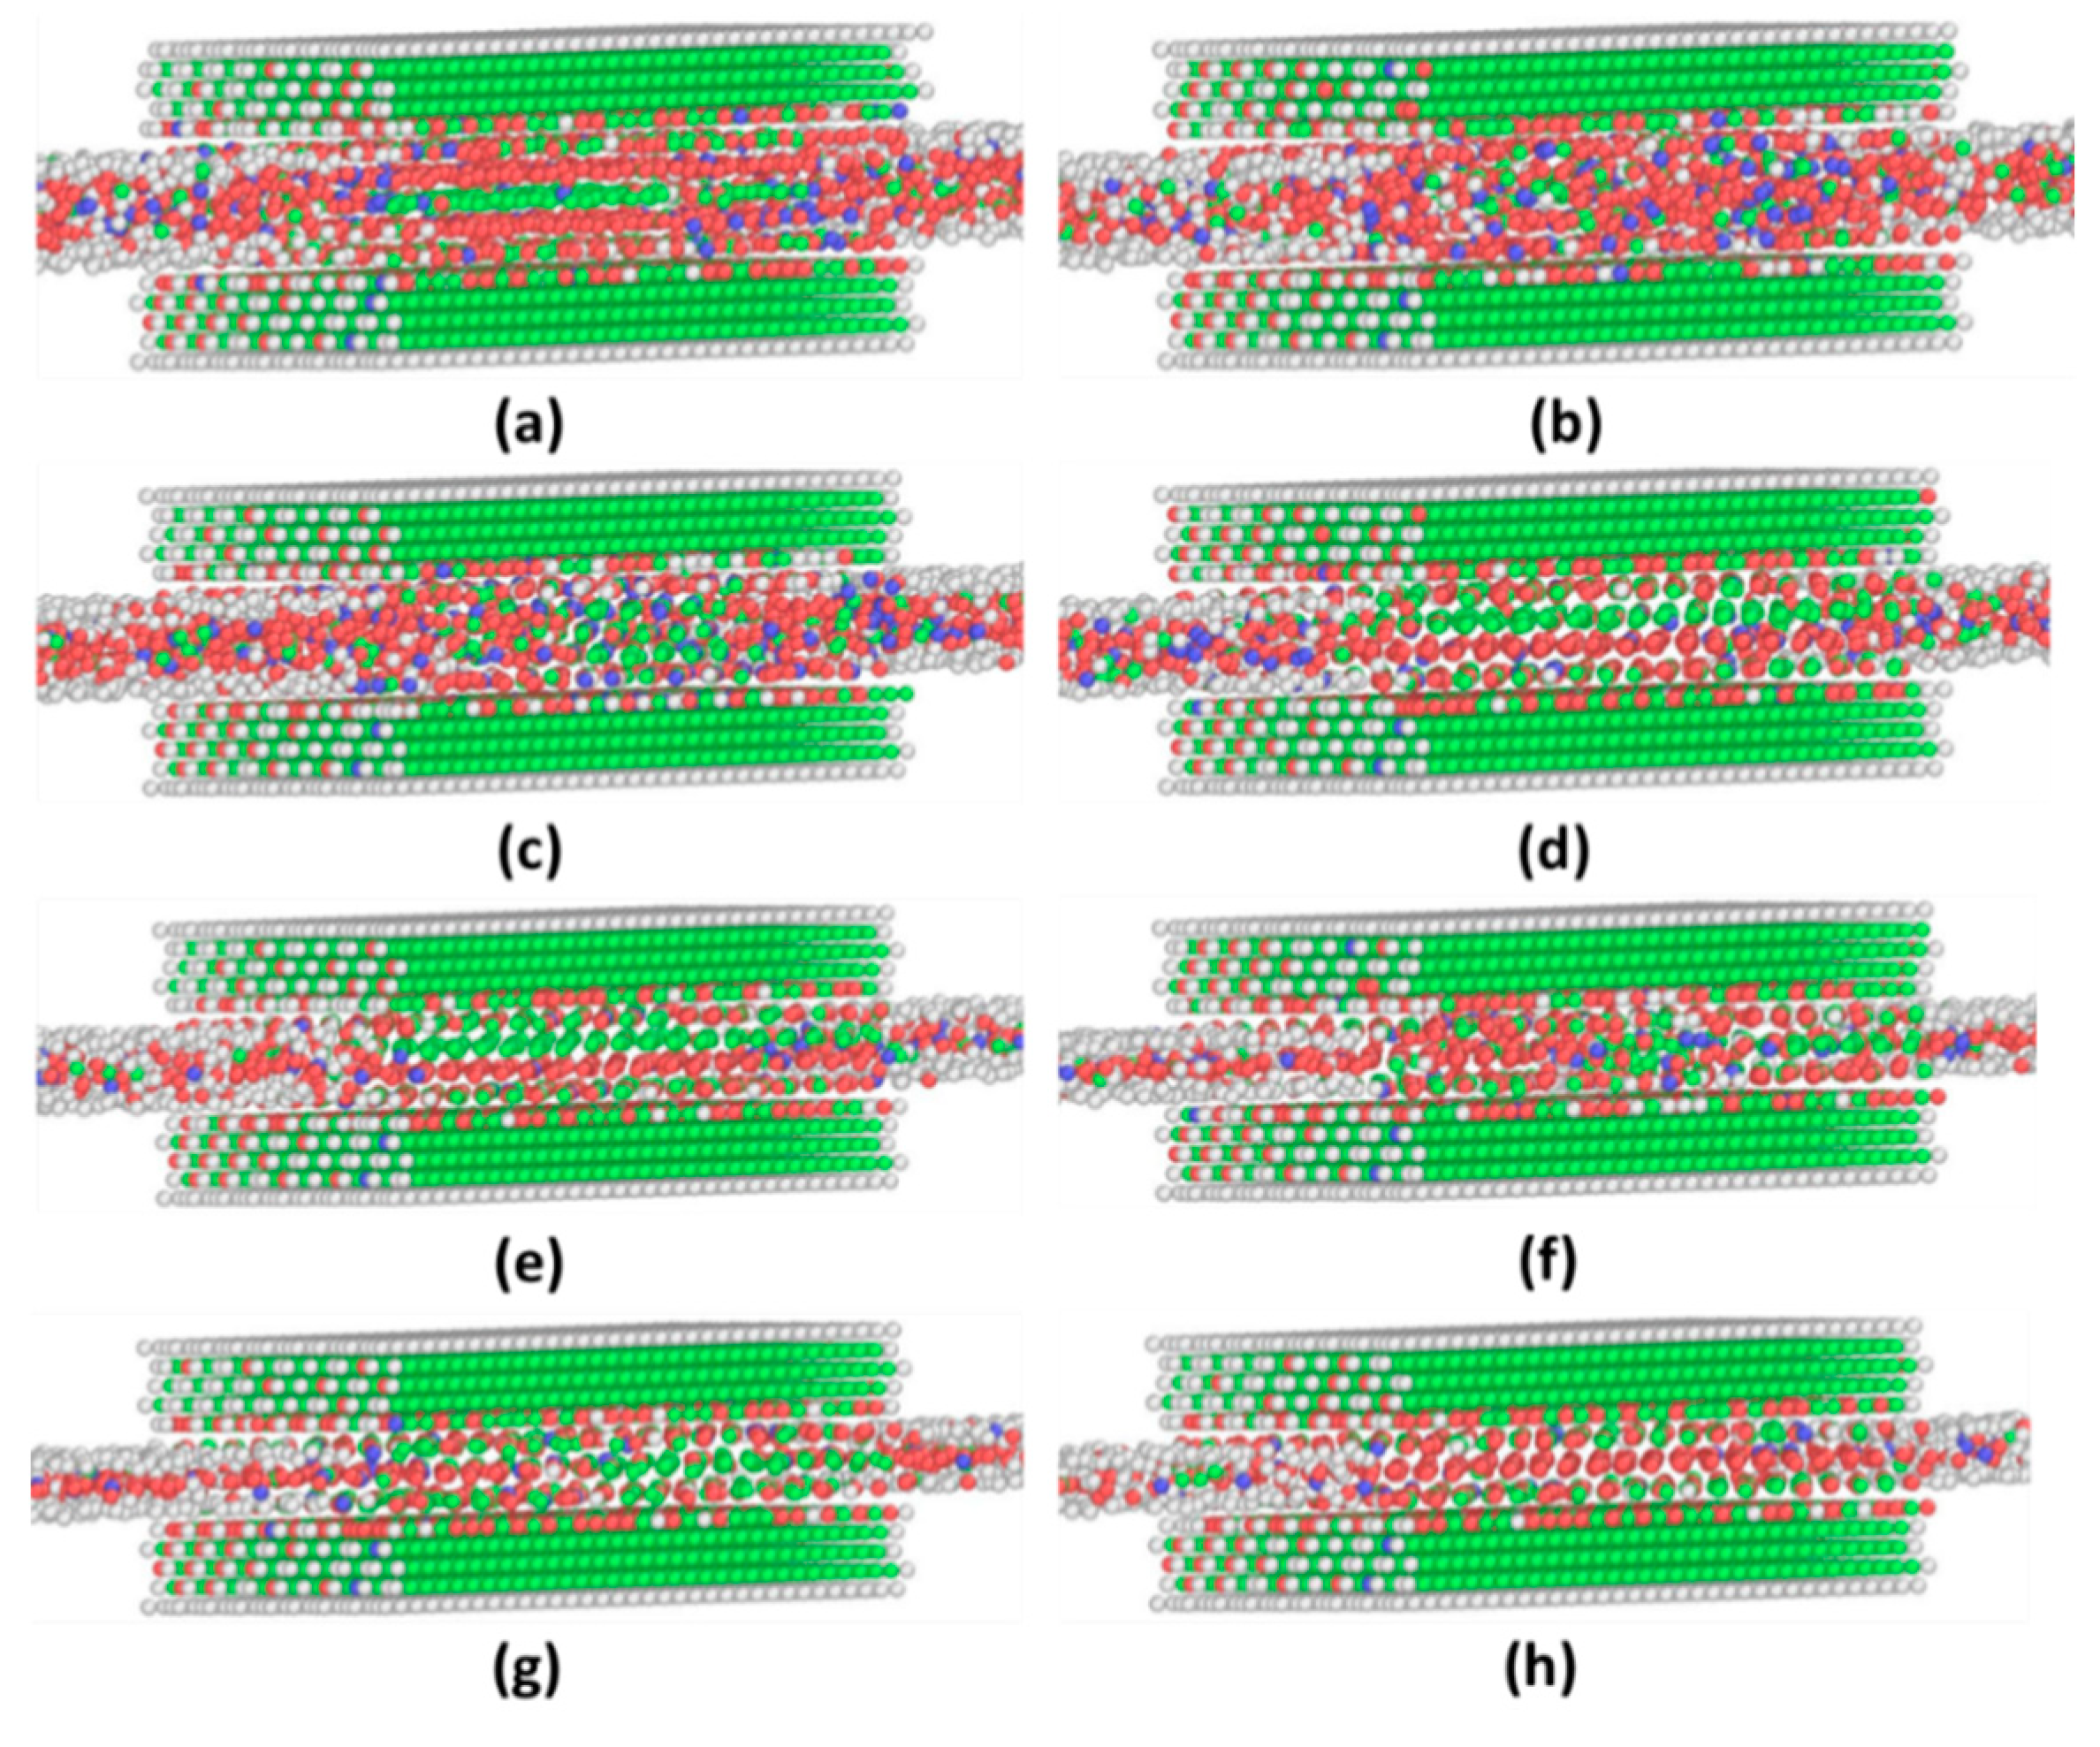
Figure A1. The equilibrium configurations of argon molecules confined between two commensurate contacts observed in LVMD simulations with varying thicknesses: (a) 6.5 Layer + 1.0Å, (b) 6.5 Layer + 0.5Å, (c) 6.5 Layer, (d) 6 Layer, (e) 5.5 Layer + 1.0Å, (f) 5.5 Layer + 0.5Å, (g) 5.5 Layer, and (h) 5 Layer. Only central walls are shown. They are consistent with those observed in GCMC/MD simulations with chemical potential μ = −2.21 kcal/mol, as shown in Figure 6.
Coatings 11 00177 g0a1
Figure A2. The equilibrium configurations of argon molecules confined between two incommensurate contacts observed in LVMD simulations with varying thicknesses: (a) 18.5 Å, (b) 17.5 Å, (c) 17.0 Å, (d) 16.0 Å, (e) 15.0 Å, (f) 14.0 Å, (g) 13.0 Å, and (h) 12.5 Å. Only central walls are shown. They are consistent with those observed in GCMC/MD simulations with chemical potential μ = −2.28 kcal/mol as shown in Figure 10.
Coatings 11 00177 g0a2

References

  1. Israelachvili, J.N. Intermolecular and Surface Forces, 3rd ed.; Elsevier, Academic Press, Inc.: San Diego, CA, USA, 2011. [Google Scholar]
  2. Klein, J.; Kumacheva, E. Confinement-induced phase transitions in simple liquids. Science 1995, 269, 816–819. [Google Scholar] [CrossRef] [PubMed]
  3. Klein, J.; Kumacheva, E. Simple liquids confined to molecularly thin layers. I. Confinement-induced liquid-to-solid phase transitions. J. Chem. Phys. 1998, 108, 6996–7009. [Google Scholar] [CrossRef]
  4. Kumacheva, E.; Klein, J. Simple liquids confined to molecularly thin layers. II. Shear and frictional behavior of solidified films. J. Chem. Phys. 1998, 108, 7010–7022. [Google Scholar] [CrossRef]
  5. Demirel, A.L.; Granick, S. Glasslike transition of a confined simple fluid. Phys. Rev. Lett. 1996, 77, 2261–2264. [Google Scholar] [CrossRef] [PubMed] [Green Version]
  6. Thompson, P.A.; Robbins, M.O. Origin of stick-slip motion in boundary lubrication. Science 1990, 250, 792–794. [Google Scholar] [CrossRef]
  7. Docherty, H.; Cummings, P.T. Direct evidence for fluid–solid transition of nanoconfined fluids. Soft Matter 2010, 6, 1640–1643. [Google Scholar] [CrossRef]
  8. Rosenhek-Goldian, I.; Kampf, N.; Yeredor, A.; Klein, J. On the question of whether lubricants fluidize in stick–slip friction. Proc. Natl. Acad. Sci. USA 2015, 112, 7117–7122. [Google Scholar] [CrossRef] [Green Version]
  9. Smith, A.M.; Hallett, J.E.; Perkin, S. Solidification and superlubricity with molecular alkane films. Proc. Natl. Acad. Sci. USA 2019, 116, 25418–25423. [Google Scholar] [CrossRef] [Green Version]
  10. Gooneie, A.; Balmer, T.E.; Heuberger, M. Seclusion of molecular layers in a confined simple liquid. Phys. Rev. Res. 2020, 2, 022026. [Google Scholar] [CrossRef]
  11. Gao, H.; Müser, M.H. Why liquids can appear to solidify during squeeze-out–Even when they don’t. J. Colloid Interface Sci. 2020, 562, 273–278. [Google Scholar] [CrossRef]
  12. Lei, Y.; Leng, Y. Force oscillation and phase transition of simple fluids under confinement. Phys. Rev. E 2010, 82, 040501. [Google Scholar] [CrossRef] [PubMed]
  13. Lei, Y.; Leng, Y. Stick-slip friction and energy dissipation in boundary lubrication. Phys. Rev. Lett. 2011, 107, 147801. [Google Scholar] [CrossRef] [PubMed]
  14. Leng, Y.; Xiang, Y.; Lei, Y.; Rao, Q. A comparative study by the grand canonical Monte Carlo and molecular dynamics simulations on the squeezing behavior of nanometers confined liquid films. J. Chem. Phys. 2013, 139, 074704. [Google Scholar] [CrossRef] [PubMed]
  15. Xu, R.-G.; Leng, Y. Squeezing and stick–slip friction behaviors of lubricants in boundary lubrication. Proc. Natl. Acad. Sci. USA 2018, 115, 6560–6565. [Google Scholar] [CrossRef] [Green Version]
  16. Xu, R.-G.; Xiang, Y.; Papanikolaou, S.; Leng, Y. On the shear dilation of polycrystalline lubricant films in boundary lubricated contacts. J. Chem. Phys. 2020, 152, 104708. [Google Scholar] [CrossRef]
  17. Xu, R.-G.; Leng, Y. Solvation force simulations in atomic force microscopy. J. Chem. Phys. 2014, 140, 214702. [Google Scholar] [CrossRef]
  18. Xu, R.-G.; Leng, Y. Contact stiffness and damping of liquid films in dynamic atomic force microscope. J. Chem. Phys. 2016, 144, 154702. [Google Scholar] [CrossRef] [Green Version]
  19. Xu, R.-G.; Xiang, Y.; Leng, Y. Computational simulations of solvation force and squeezing out of dodecane chain molecules in an atomic force microscope. J. Chem. Phys. 2017, 147, 054705. [Google Scholar] [CrossRef] [Green Version]
  20. Laio, A.; Parrinello, M. Escaping free-energy minima. Proc. Natl. Acad. Sci. USA 2002, 99, 12562–12566. [Google Scholar] [CrossRef] [Green Version]
  21. Barducci, A.; Bussi, G.; Parrinello, M. Well-tempered metadynamics: A smoothly converging and tunable free-energy method. Phys. Rev. Lett. 2008, 100, 020603. [Google Scholar] [CrossRef] [Green Version]
  22. Barducci, A.; Bonomi, M.; Parrinello, M. Metadynamics. Wiley Interdiscip. Rev. Comput. Mol. Sci. 2011, 1, 826–843. [Google Scholar] [CrossRef]
  23. Laio, A.; Gervasio, F.L. Metadynamics: A method to simulate rare events and reconstruct the free energy in biophysics, chemistry and material science. Rep. Prog. Phys. 2008, 71, 126601. [Google Scholar] [CrossRef]
  24. Steinhardt, P.J.; Nelson, D.R.; Ronchetti, M. Bond-orientational order in liquids and glasses. Phys. Rev. B 1983, 28, 784–805. [Google Scholar] [CrossRef]
  25. Lechner, W.; Dellago, C. Accurate determination of crystal structures based on averaged local bond order parameters. J. Chem. Phys. 2008, 129, 114707. [Google Scholar] [CrossRef]
  26. Tribello, G.A.; Giberti, F.; Sosso, G.C.; Salvalaglio, M.; Parrinello, M. Analyzing and driving cluster formation in atomistic simulations. J. Chem. Theory Comput. 2017, 13, 1317–1327. [Google Scholar] [CrossRef]
  27. Giberti, F.; Salvalaglio, M.; Parrinello, M. Metadynamics studies of crystal nucleation. IUCrJ 2015, 2, 256–266. [Google Scholar] [CrossRef] [Green Version]
  28. Tambach, T.J.; Bolhuis, P.G.; Hensen, E.J.; Smit, B. Hysteresis in clay swelling induced by hydrogen bonding: Accurate prediction of swelling states. Langmuir 2006, 22, 1223–1234. [Google Scholar] [CrossRef]
  29. Rao, Q.; Xiang, Y.; Leng, Y. Molecular simulations on the structure and dynamics of water–methane fluids between Na-montmorillonite clay surfaces at elevated temperature and pressure. J. Phys. Chem. C 2013, 117, 14061–14069. [Google Scholar] [CrossRef]
  30. Rao, Q.; Leng, Y. Methane aqueous fluids in montmorillonite clay interlayer under near-surface geological conditions: A grand canonical Monte Carlo and molecular dynamics simulation study. J. Phys. Chem. B 2014, 118, 10956–10965. [Google Scholar] [CrossRef]
  31. Rao, Q.; Leng, Y. Molecular understanding of CO2 and H2O in a montmorillonite clay interlayer under CO2 geological sequestration conditions. J. Phys. Chem. C 2016, 120, 2642–2654. [Google Scholar] [CrossRef]
  32. Fedyanin, I.; Pertsin, A.; Grunze, M. Quasistatic computer simulations of shear behavior of water nanoconfined between mica surfaces. J. Chem. Phys. 2011, 135, 174704. [Google Scholar] [CrossRef] [PubMed]
  33. Liu, Z.; Herrera, L.; Nguyen, V.T.; Do, D.; Nicholson, D. A Monte Carlo scheme based on mid-density in a hysteresis loop to determine equilibrium phase transition. Mol. Simul. 2011, 37, 932–939. [Google Scholar] [CrossRef]
  34. Peterson, B.K.; Gubbins, K.E. Phase transitions in a cylindrical pore: Grand canonical Monte Carlo, mean field theory and the Kelvin equation. Mol. Phys. 1987, 62, 215–226. [Google Scholar] [CrossRef]
  35. Peterson, B.K.; Gubbins, K.E.; Heffelfinger, G.S.; Marini Bettolo Marconi, U.; van Swol, F. Lennard-Jones fluids in cylindrical pores: Nonlocal theory and computer simulation. J. Chem. Phys. 1988, 88, 6487–6500. [Google Scholar] [CrossRef]
  36. Neimark, A.V.; Vishnyakov, A. Gauge cell method for simulation studies of phase transitions in confined systems. Phys. Rev. E 2000, 62, 4611–4622. [Google Scholar] [CrossRef] [Green Version]
  37. Vishnyakov, A.; Neimark, A.V. Studies of Liquid—Vapor Equilibria, Criticality, and Spinodal Transitions in Nanopores by the Gauge Cell Monte Carlo Simulation Method. J. Phys. Chem. B 2001, 105, 7009–7020. [Google Scholar] [CrossRef]
  38. Allen, M.P.; Tildesley, D.J. Computer Simulation of Liquids; Oxford University Press: Oxford, UK, 2017. [Google Scholar]
  39. Plimpton, S. Fast parallel algorithms for short-range molecular dynamics. J. Comput. Phys. 1995, 117, 1–19. [Google Scholar]
  40. Hoover, W.G. Canonical dynamics: Equilibrium phase-space distributions. Phys. Rev. A 1985, 31, 1695–1697. [Google Scholar] [CrossRef] [Green Version]
  41. Nosé, S. A unified formulation of the constant temperature molecular dynamics methods. J. Chem. Phys. 1984, 81, 511–519. [Google Scholar] [CrossRef] [Green Version]
  42. Stukowski, A. Visualization and analysis of atomistic simulation data with OVITO–the open visualization tool. Model. Simul. Mater. Sci. Eng. 2009, 18, 015012. [Google Scholar] [CrossRef]
  43. Larsen, P.M.; Schmidt, S.; Schiøtz, J. Robust structural identification via polyhedral template matching. Model. Simul. Mater. Sci. Eng. 2016, 24, 055007. [Google Scholar] [CrossRef]
  44. Liu, Z.; Do, D.D.; Nicholson, D. A thermodynamic study of the mid-density scheme to determine the equilibrium phase transition in cylindrical pores. Mol. Simul. 2012, 38, 189–199. [Google Scholar] [CrossRef]
  45. Nguyen, V.T.; Do, D.; Nicholson, D. Reconciliation of different simulation methods in the determination of the equilibrium branch for adsorption in pores. Mol. Simul. 2014, 40, 713–720. [Google Scholar] [CrossRef] [Green Version]
  46. Ustinov, E.A.; Do, D. Application of kinetic Monte Carlo method to equilibrium systems: Vapour–liquid equilibria. J. Colloid Interface Sci. 2012, 366, 216–223. [Google Scholar] [CrossRef]
  47. Fan, C.; Do, D.; Nicholson, D.; Ustinov, E. Chemical potential, Helmholtz free energy and entropy of argon with kinetic Monte Carlo simulation. Mol. Phys. 2014, 112, 60–73. [Google Scholar] [CrossRef] [Green Version]
  48. Nguyen, V.T.; Do, D.; Nicholson, D. Monte Carlo simulation of the gas-phase volumetric adsorption system: Effects of dosing volume size, incremental dosing amount, pore shape and size, and temperature. J. Phys. Chem. B 2011, 115, 7862–7871. [Google Scholar] [CrossRef]
  49. Kast, S.M. Combinations of simulation and integral equation theory. Phys. Chem. Chem. Phys. 2001, 3, 5087–5092. [Google Scholar] [CrossRef]
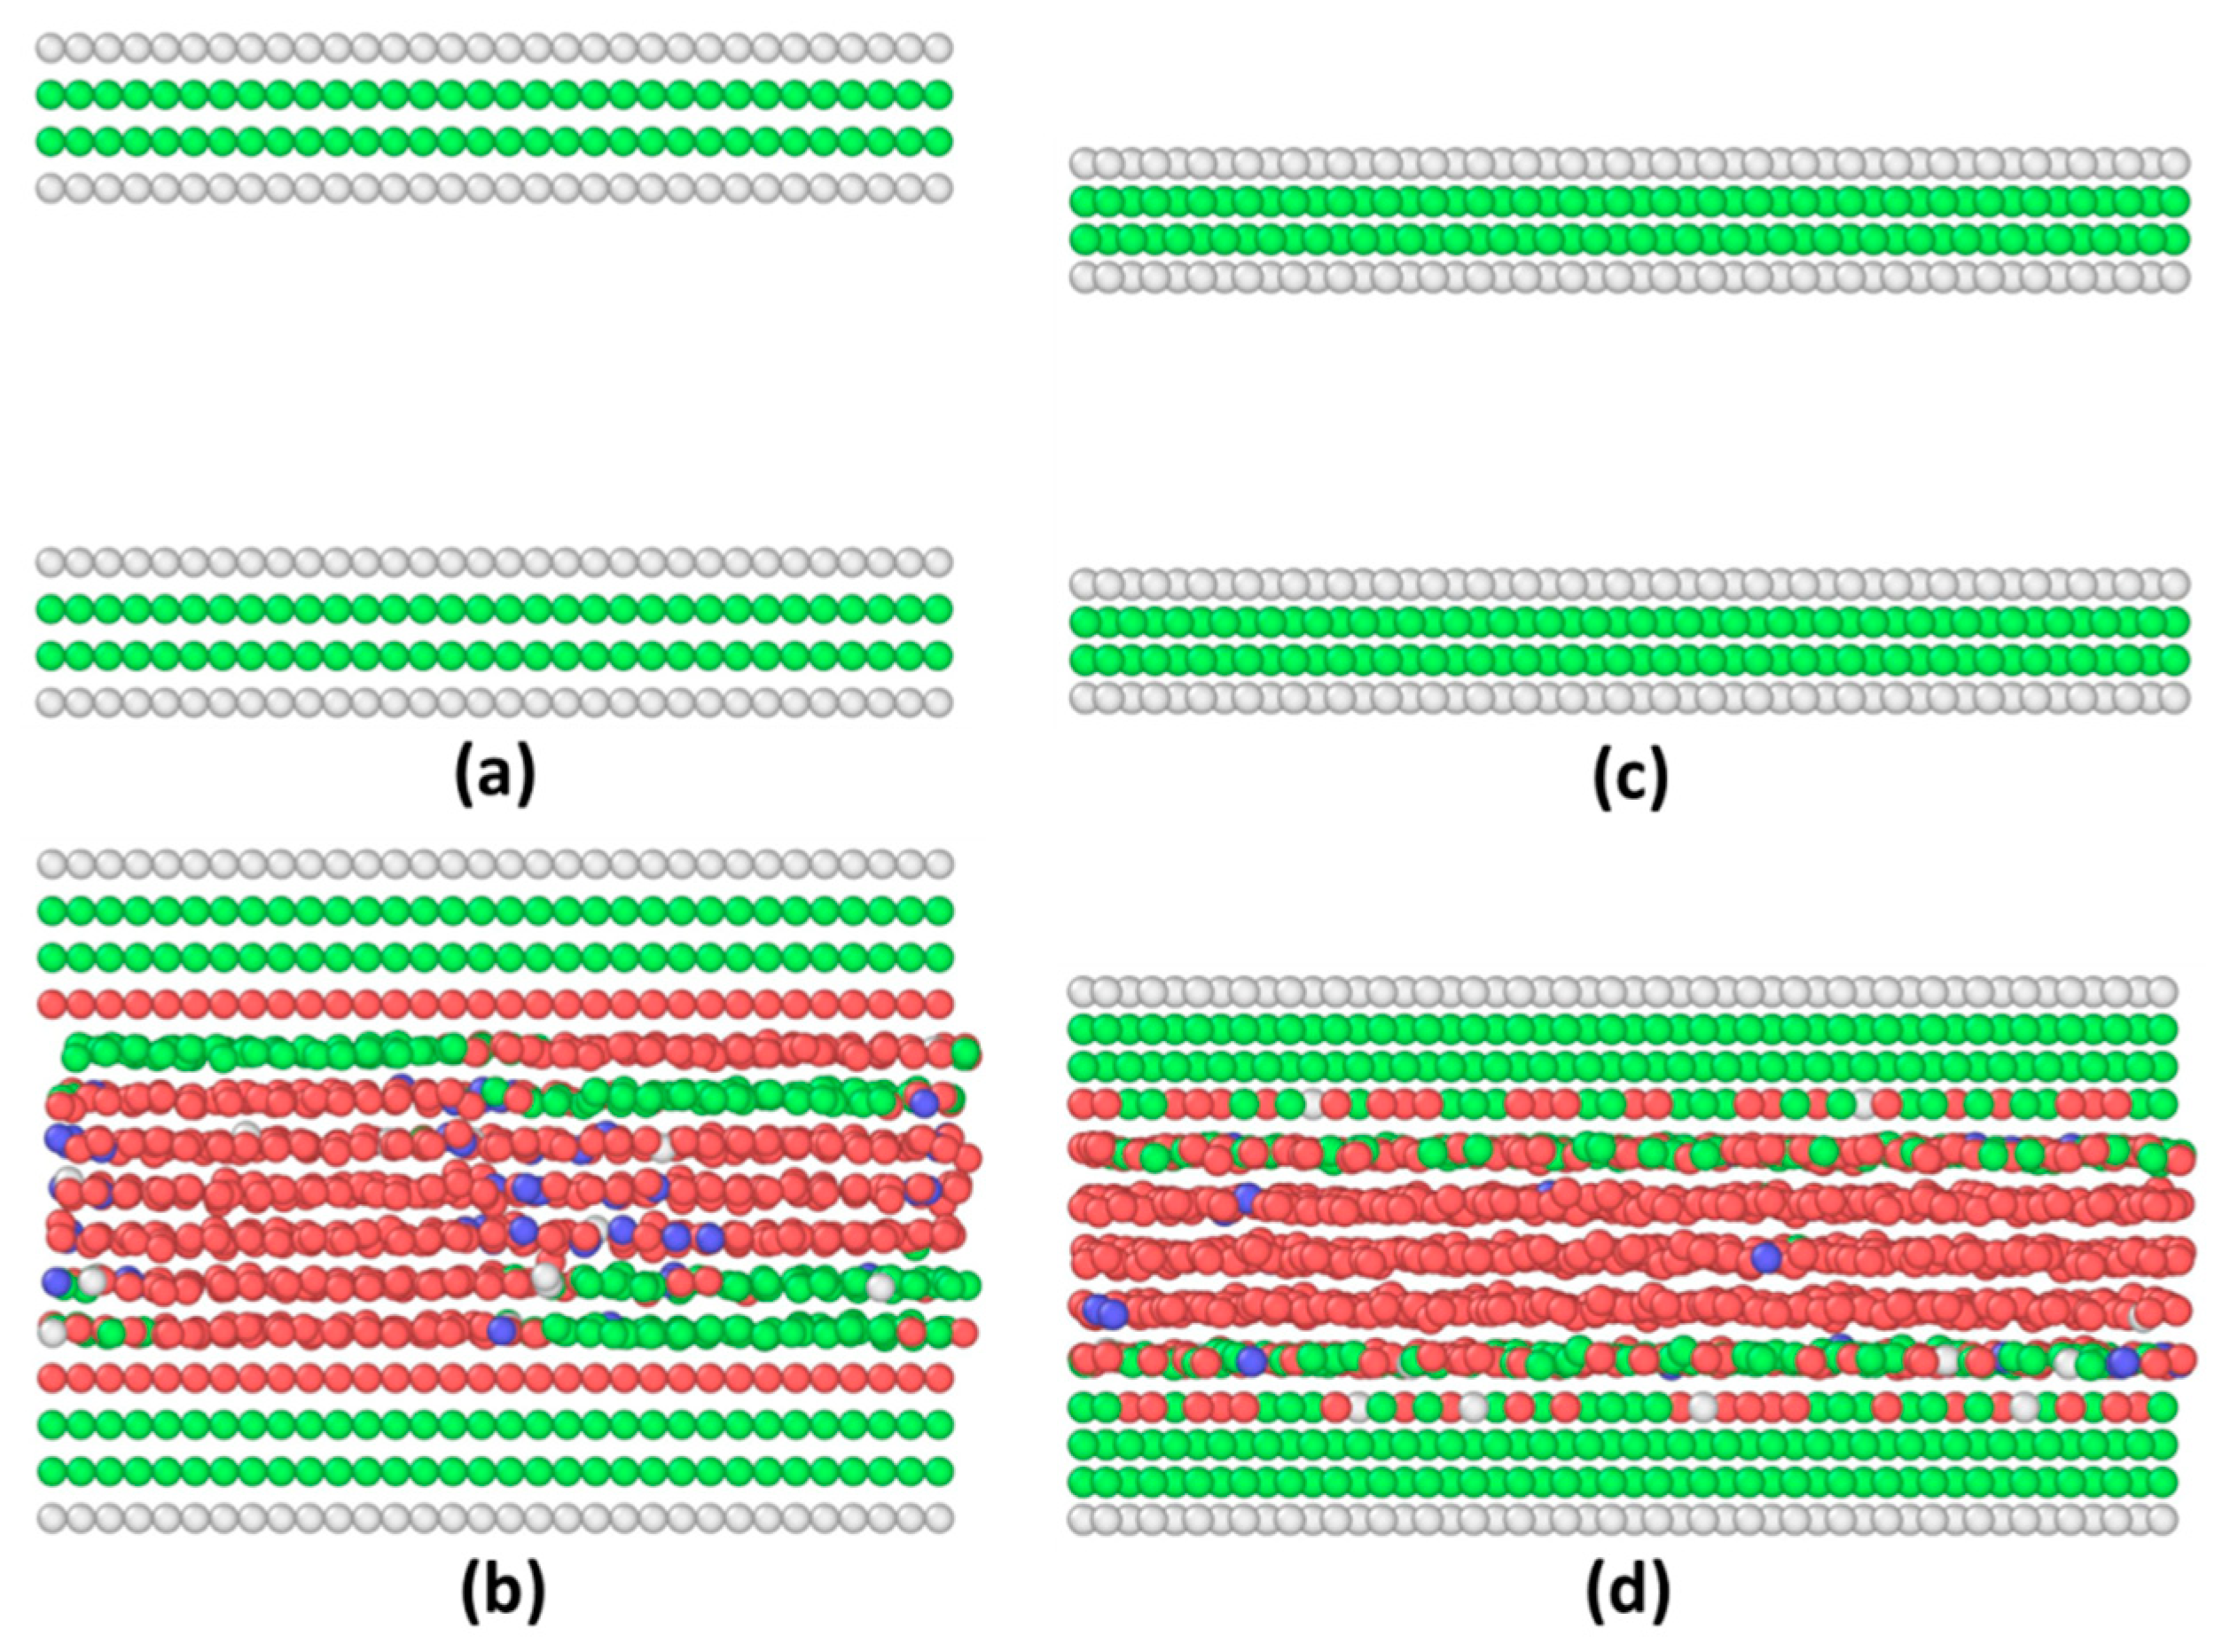
Figure 1. Schematic of the simulation model. Commensurate contact: (a) the adsorption branch started with an empty box and (b) the desorption branch started with a full box. Incommensurate contact: (c) the adsorption branch started with an empty box and (d) the desorption branch started with a full box. Atoms in face-centered cubic (FCC), hexagonal close-packed (HCP), body-centered cubic (BCC), and other mixed crystalline structures are in green, red, purple, and white, respectively. The color scheme is consistent throughout this work.
Coatings 11 00177 g001
Figure 2. The flowchart of the mid-density scheme applied in this work.
Coatings 11 00177 g002
Figure 3. Grand canonical Monte Carlo/molecular dynamics (GCMC/MD) simulations of adsorption (black) and desorption (red) isotherms for argon molecules confined between two commensurate contacts at 85 K at (a) n = 7 monolayer and (b) n = 8 monolayer thickness. The equilibrium states obtained by the mid-density scheme are shown in blue curves, on which the vertical dashed lines mark the phase boundary between liquid phase and solid phase.
Coatings 11 00177 g003
Figure 4. The snapshots of atomic configurations of adsorption-desorption isotherms for argon molecules confined between two commensurate contacts at 85 K for n = 7 monolayer thickness. Adsorption: (a) μ = −2.40 kcal/mol, (b) μ = −2.23 kcal/mol, (c) μ = −2.225 kcal/mol, and (d) μ = −2.19 kcal/mol. Desorption: (e) μ = −2.15 kcal/mol, (f) μ = −2.32 kcal/mol, (g) μ = −2.325 kcal/mol, and (h) μ = −2.40 kcal/mol.
Coatings 11 00177 g004
Figure 5. The GCMC snapshots of atomic configurations of adsorption-desorption isotherms for argon molecules confined between two commensurate contacts at 85 K for n = 8 monolayer thickness. Adsorption: (a) μ = −2.40 kcal/mol, (b) μ = −2.21 kcal/mol, (c) μ = −2.19 kcal/mol, and (d) μ = −2.0 kcal/mol. Desorption: (e) μ = −2.20 kcal/mol, (f) μ = −2.275 kcal/mol, (g) μ = −2.35 kcal/mol, and (h) μ = −2.40 kcal/mol.
Coatings 11 00177 g005
Figure 6. Equilibrium phases of argon molecules confined between two commensurate contacts predicted in GCMC/MD simulations with chemical potential μ = −2.21 kcal/mol for varying thicknesses: (a) 6.5 Layer + 1.0Å, (b) 6.5 Layer + 0.5Å, (c) 6.5 Layer, (d) 6 Layer, (e) 5.5 Layer + 1.0Å, (f) 5.5 Layer + 0.5Å, (g) 5.5 Layer, and (h) 5 Layer. They are consistent with those observed in LVMD simulations as shown in Figure A1.
Coatings 11 00177 g006
Figure 7. GCMC/MD simulations of adsorption (black) and desorption (red) isotherms for argon molecules confined between two incommensurate contacts at 85 K at (a) n = 5 monolayer and (b) n = 6 monolayer thickness. The equilibrium states obtained by the mid-density scheme are shown in blue curves, on which the vertical dashed lines mark the phase boundary between liquid phase and solid phase.
Coatings 11 00177 g007
Figure 8. The GCMC snapshots of the atomic configurations of the adsorption-desorption isotherms for argon molecules confined between two incommensurate contacts at 85 K for n = 5 monolayer thickness. Adsorption: (a) μ = −2.33 kcal/mol, (b) μ = −2.32 kcal/mol, and (c) μ = −2.15 kcal/mol. Desorption: (d) μ = −2.15 kcal/mol, (e) μ = −2.51 kcal/mol, and (f) μ = −2.515 kcal/mol.
Coatings 11 00177 g008
Figure 9. The GCMC snapshots of atomic configurations of adsorption-desorption isotherms for argon molecules confined between two incommensurate contacts at 85 K for n = 6 monolayer thickness. Adsorption: (a) μ = −2.26 kcal/mol, (b) μ = −2.25 kcal/mol, and (c) μ = −2.15 kcal/mol. Desorption: (d) μ = −2.15 kcal/mol, (e) μ = −2.37 kcal/mol, and (f) μ = −2.41 kcal/mol.
Coatings 11 00177 g009
Figure 10. Equilibrium phases of argon molecules confined between two incommensurate contacts predicted in GCMC/MD simulations with chemical potential μ = −2.28 kcal/mol for varying thicknesses: (a) 18.5 Å, (b) 17.5 Å, (c) 17.0 Å, (d) 16.0 Å, (e) 15.0 Å, (f) 14.0 Å, (g) 13.0 Å, and (h) 12.5 Å. They are consistent with those observed in LVMD simulations as shown in Figure A2.
Coatings 11 00177 g010
Table 1. The relevant parameters for commensurate and incommensurate contacts used in this study.
Lattice Constant (nm)σwσwfεwfLateral Dimensions (nm × nm)
Commensurate 0.5405σσε6.12 × 3.31
Incommensurate0.4080.755σ0.887σε6.92 × 4.50
Table 2. The equilibrium phase in different thicknesses predicted by GCMC/MD simulations with chemical potential μ = −2.21 kcal/mol (Figure 6) and liquid-vapor molecular dynamics (LVMD) simulations (Figure A1).
ThicknessGCMCLVMD
6.5 Layer + 1.0ÅLiquidLiquid
6.5 Layer + 0.5ÅLiquidLiquid
6.5 LayerSolidSolid
6 LayerSolidSolid
5.5 Layer + 1.0ÅLiquidLiquid
5.5 Layer + 0.5ÅLiquidLiquid
5.5 LayerSolidSolid
5 LayerSolidSolid
Table 3. The equilibrium phase in different thicknesses predicted by GCMC simulations with chemical potential μ = −2.28 kcal/mol (Figure 10) and LVMD simulations (Figure A2).
ThicknessGCMCLVMD
18.5 ÅSolidSolid
17.5 ÅLiquidLiquid
17.0 ÅLiquidLiquid
16.0 ÅSolidSolid
15.0 ÅSolidSolid
14.0 ÅLiquidLiquid
13.0 ÅSolidSolid
12.5 ÅSolidSolid
Publisher’s Note: MDPI stays neutral with regard to jurisdictional claims in published maps and institutional affiliations.