Article

Continuous Numerical Analysis of Slug Rivet Installation Process Using Parameterized Modeling Method

1
Mechanical Engineering College, Zhijiang College of Zhejiang University of Technology, Shaoxing 312030, China
2
College of Mechanical Engineering and Automatic, Zhejiang Sci-Tech University, Hangzhou 310018, China
3
College of Mechanical Engineering, Zhejiang University, Hangzhou 310027, China
*
Author to whom correspondence should be addressed.
Coatings 2021, 11(2), 189; https://doi.org/10.3390/coatings11020189
Submission received: 1 January 2021 / Revised: 24 January 2021 / Accepted: 3 February 2021 / Published: 6 February 2021

Abstract

:
The slug rivet installation process is complex. A lot of parameters are included during the riveting deformation process. The workload and time cost of a traditional simulation study is very high since a traditional numerical model should be modified manually time by time when riveting parameters change. The data processing after simulation is another complex work. To improve the situation, this paper presents a parameterized modeling method. The modeling process and data processing algorithm can be developed using Python script. The parameterized model can automatically and continuously re-build without any manual intervention according to the riveting parameter auto-update condition. The post-processing analysis can be automatically conducted and saved as well. Then this paper conducts continuous analysis to illustrate the impact of riveting parameters on riveting quality. The parameterized model keeps running 41 times until the riveting parameter is out of range. The parameterized modeling method is a useful method for a simulation study. The study will pave the way for further investigations.

1. Introduction

Long fatigue life design of aircraft requires an increasing improvement of rivet assembly quality. Slug rivet interference-fit riveting is one of the advanced connection technologies, which can evolve the assembly quality to a higher level with the requirement of long fatigue life, good sealing performance and high corrosion resistance. The slug rivet interference-fit riveting technology has been widely used in the field of wing sheet assembly systems [1,2,3,4]. Statistics show that the slug rivet accounts for more than 80% of the riveting work during the wing sheet manufacturing process of the ARJ-21 regional jet [5].
Figure 1 illustrates the typical slug rivet connection structure widely used in wing sheet assembly. Table 1 and Table 2 list the related riveting parameters. The riveting parameters can be divided into structure parameters and procedure parameters.
Slug rivet installation is a particularly sensitive case. Since there are numerous riveting parameters associated with a riveting process. Incorrect selection of riveting parameters could induce excessive residual stresses, initiate cracks and result in improper deformations [6]. Li [7], Song et al. [8] and Mu et al. [9,10] built the mapping relationship between squeezing force and driven head geometry. Lei et al. [11,12], Reinhall [13] and Chang et al. [14] provided a deeper understanding of the slug rivet installation process with the impacts of different riveting parameters. Appropriate riveting parameter combination can make more homogeneous interference distribution along the thickness direction. The residual compressive stress around the rivet hole can significantly improve the fatigue performance of a slug rivet assembly.
In earlier research, the internal relation between different rivet die structures and riveting quality has been revealed [15]. Figure 2 presents the structure sketch of rivet dies made of different structures. Table 3 lists the structure parameters of three different rivet die types. The result indicates that a well-designed rivet die has a more positive effect on arising the interference level around the rivet hole. The riveting quality can be effectively improved. Moreover, Wang et al. [16] further proposed an integration method to optimize riveting parameters. Five key process parameters were considered. At least 50 sets of different parameter combinations were applied to search for a Pareto-optimal solution. Their results indicate the optimized riveting parameter combination could effectively improve the deformation homogeneity.
Among the studies, the simulation of the slug rivet installation process mainly focuses on the influence of riveting parameters. Little attention has been paid to the establishment of a numerical model. Numerical simulation is an effective and important method to demonstrate the significant impact of different factors on riveting quality. However, the numerical studies of the rivet installation process require much work. A traditional numerical model should be modified manually time after time when the riveting parameters change. The manual modification process and the result data processing process after simulation take a large amount of time and energy. Some elementary mistakes may even appear due to the heavy workload.
To reduce the high workload, this paper proposes the parameterized modeling method. The numerical model can be modified automatically according to the riveting parameter auto-update. The data obtained from simulation results can be automatically conducted as well. Then the numerical study can be consistently and automatically conducted within some range of riveting parameters. The parameterized modeling method can save a huge mass of modeling time and workload. The result of this paper is very useful to effectively improve the automation degree of slug rivet assembly simulation and data processing process.

2. Materials and Methods

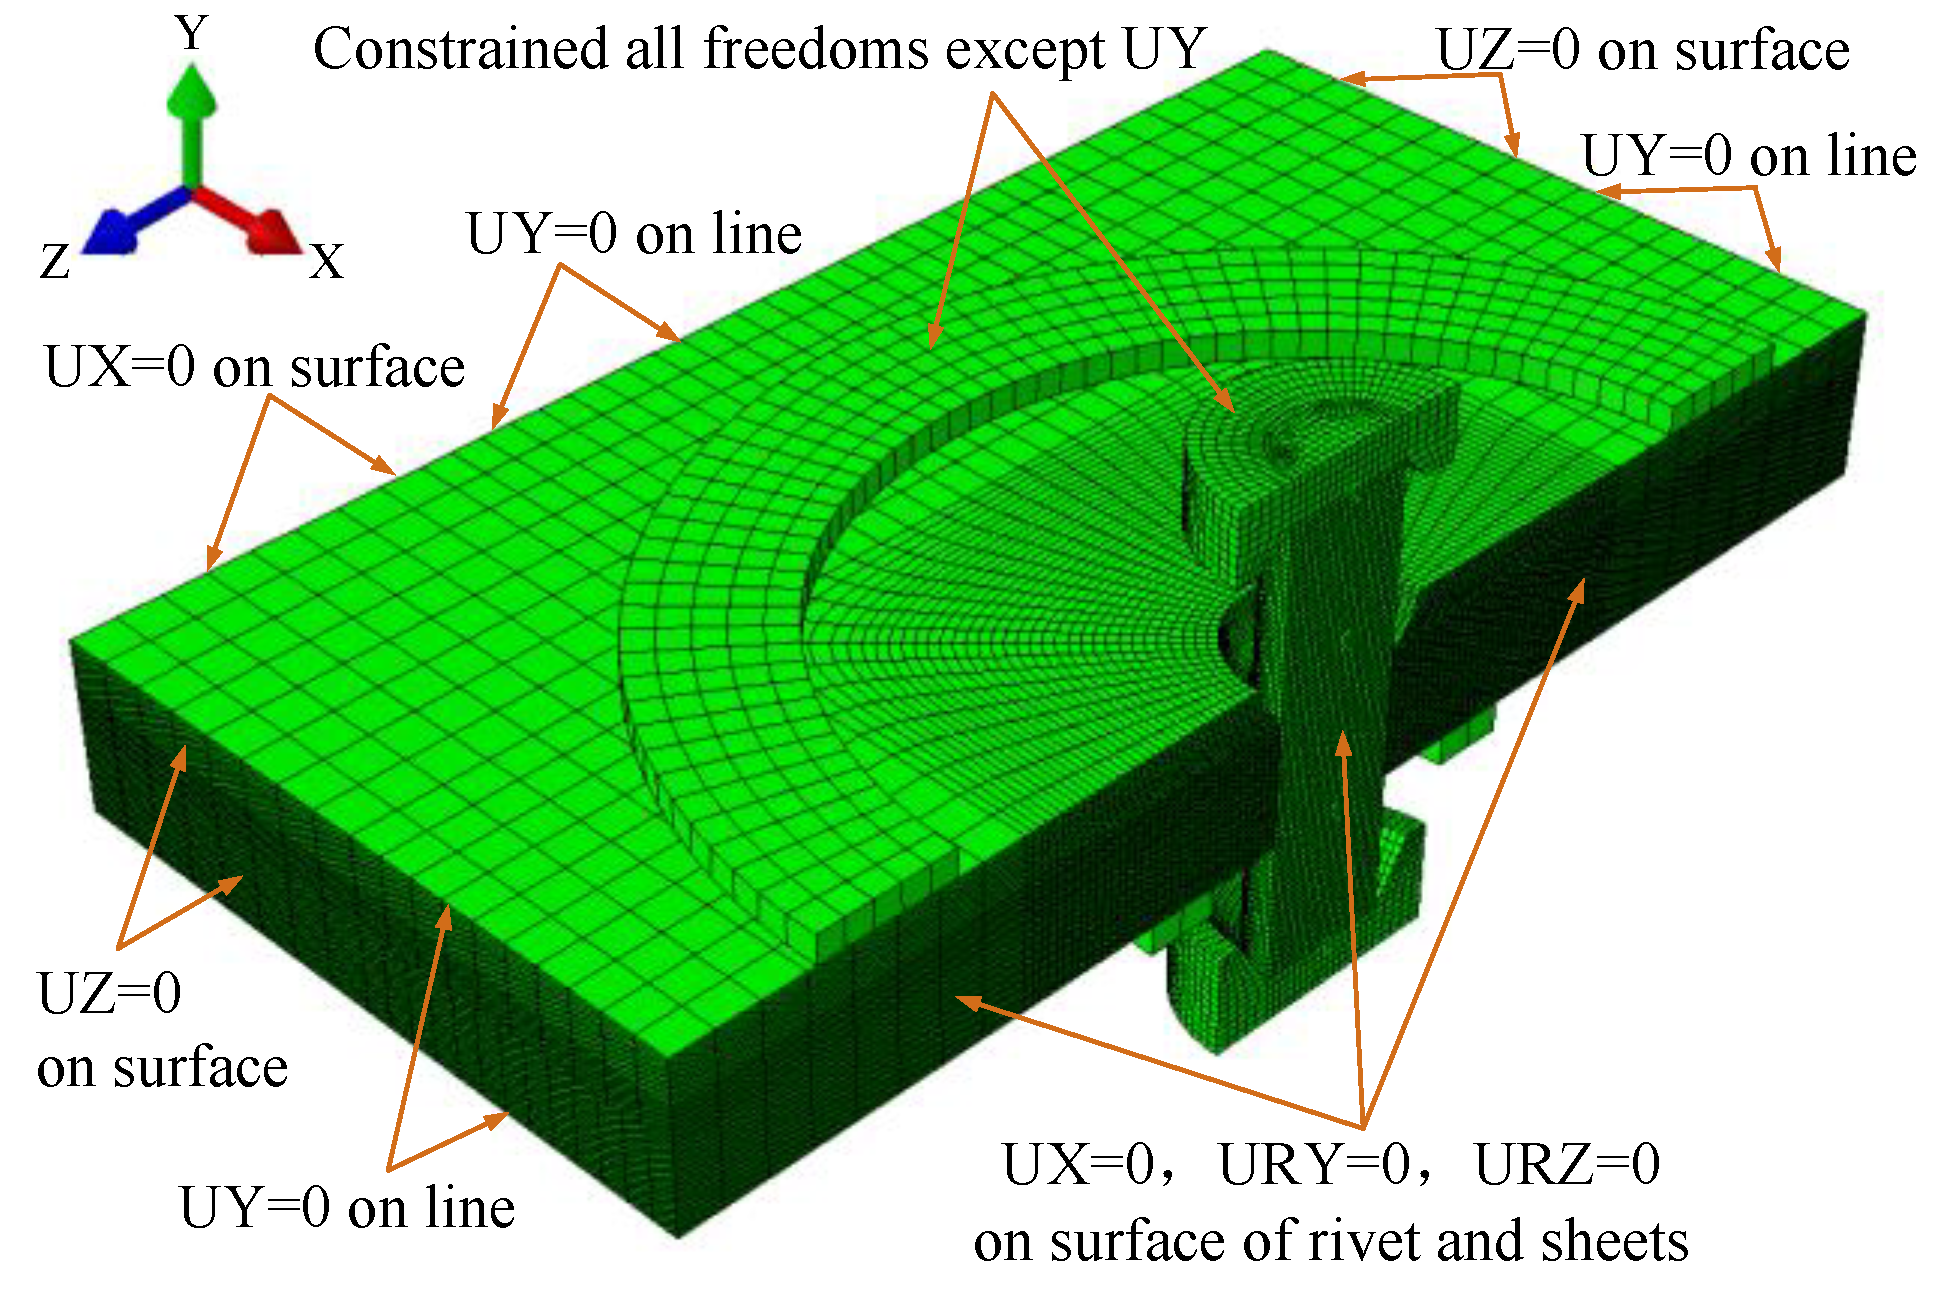
2.1. Baseline Model Establishment

A three-dimensional symmetry finite element model was used to simulate the slug rivet installation process. The FE model consists of an NAS1321AD6E10 slug rivet, upper and lower riveting dies, upper and lower pressure feet and upper and lower sheets. The materials of the slug rivet and sheets are 2117-T4 Al alloy and 2024-T3 Al alloy, respectively.
Figure 3 shows the mesh and boundary conditions of the FE model. The FE model is generated using C3D8R reduced integration 8-node solid continuum elements. Three deformable bodies, two sheets and a rivet are defined in the model. The riveting dies and the pressure feet are defined as rigid bodies. The sheet surfaces on the far-end are constrained in the X-Direction and Z-Direction. The top and bottom lines of the sheets on the far-end are constrained in the Y-Direction. All freedom degrees of the riveting dies and pressure feet are constrained, except the Y-Direction.
Different mesh sizes are applied for different parts. The mesh size of a rivet is 0.15 mm. The mesh size of a sheet is 0.2 mm for the area in the vicinity of the rivet and 1.2 mm for the region far from the rivet hole. The workstation (Round Rock, TX, USA) used in simulation contains a CPU Core I7, Memory 8G, Win 7 operation system. The simulation cycle takes about 2 h each time.
The FE model can simulate the riveting process well. Details of the FE model and its validation process can be found in the earlier study [11].

2.2. Parameterized Model Establishment

The FE model is generated using ABAQUS 6.14. The ABAQUS kernel can be controlled by the Python script. With the Python script, the finite element software can automatically realize the pre-processing modeling and the post-processing analysis with simulation results.
The parameterized modeling process can be divided into several stages. Figure 4 illustrates the parameterized modeling process. Stage 1: the secondary development of ABAQUS can be conducted based on Python script development. Stage 2: the parameterized modeling process can be divided into three parts. Firstly, write the main function. Secondly, design analysis steps. Thirdly, develop different function modules. Stage 3: start ABAQUS and invoke script interface.
In Stage 1, the difficulty of ABAQUS Python script development can be greatly reduced with the help of macro files. Since the macro file in ABAQUS contains a lot of script commands. Figure 5 shows the improved parameterized modeling process. At the beginning of the continuous simulation, the numerical model needs to be built manually once. Record the manual modeling process using a macro file. Then, the interrelationship between ABAQUS operation, script file creation and numerical model establishment can be built. Finally, translate the recorded macro file into a Python script file.
Based on the translated Python script, the parameterized model can be automatically rebuilt time by time. Each time the riveting parameter combination can auto-update within a certain range.
In Stage 2, Figure 6 illustrates the parameterized model structure. All parts can be combined together by the main function. In Stage 3, the ABAQUS is started by calling the main function.
The analysis steps development can be divided into three steps. The pre-processing step gradually invokes different modeling modules to build the parameterized model. In function modular development, modular programming technology can effectively reduce the difficulty of model incessantly rebuilding and modeling program development. The modules are developed using a Python script translated from macro files. All these modules can be independent of each other. Each module can perform its specific function. Then, the simulation step submits analysis calculations. Finally, the post-processing step conducts data analysis based on simulation outputs.
In the post-processing step, the simulation results will auto-analyze and auto-save using an Excel file. Figure 7 shows the data format saved in Excel files. The “analysis start time” is recorded in Line 1. The “riveting parameter combination used in current study” is recorded in the lines from Line 2 to Line 5. The data recorded in the green box are the element node number and its corresponding radial expansion. The element nodes are located at the hole wall along the thickness direction. These element nodes are set in the pre-processing step to measure the radial expansion. As a required result, the radial expansion will be translated into interference value in the post-processing step. The data recorded in the blue box are statistically average interference values, of which Line 75 records the total average interference value.
Figure 8 illustrates the continuous analysis process after parameterized model establishment. The simulation is iterated within a certain range of riveting parameters. The numerical model automatically re-builds time by time. The riveting parameters auto-update in each loop iteration. The simulation could finish when the riveting parameters are out of range.
The benefits of using modular programming technology to build a parameterized model are obvious. The automation degrees of model establishment and data processing process will be increased. The code’s readability, maintainability and programming efficiency will be increased as well. The parameterized model has strong generality. The input and output parameters can be controlled. The independent module in the parameterized model can be applied to other similar projects.
It is convenient to apply the parameterized model to the cases that need a batch program, such as parameter analysis and optimization analysis. The repeated re-model work can be avoided. The workload and time cost among simulations and analyses will be greatly reduced.

3. Results

Figure 1 illustrates the rivet structure. The countersunk hole at the upper sheet will lead to inhomogeneous interference distribution along the thickness direction. The radial expansion within the countersunk hole would be lower than other parts. The resulting residual stress state surrounding the countersunk hole will be worse. Fatigue crack may firstly emerge in the vicinity of the countersunk hole.
The riveting parameter, protruding height (PU as shown in Figure 1), can make interference distribution more homogeneous along the thickness direction. Since the material flow of a slug rivet can not only fill the countersunk hole but also press the hole wall during the riveting deformation process. The inhomogeneous scale of interference distribution can be improved with the effect of excess material flow.
With the parameterized model, the internal relation between protruding height and interference distribution homogeneity can be easily revealed. The optimal protruding height can be found to improve the riveting quality.

3.1. Parameter Analysis

For the baseline model, the protruding height PU is usually equal to 4.94 mm, and the rivet length and sheet thickness are 15.88 and 6 mm separately. According to the process manual, the variation range of protruding height is [ 3.94 , 5.94 ] mm [17]. Then, for the parameterized model, the value range of PU is [ 3.94 , 5.94 ] mm (PU + PL = 9.88 mm). The PU increment step is 0.05 mm.
Totally, 41 groups of simulation will be conducted. Figure 9 illustrates the average interference value obtained from the cases of different protruding height PU. The total average interference value exists between the average data obtained from the upper and lower sheets.
Obviously, because of the countersunk hole, the average interference value of the upper sheet is smaller than the value gained from the lower sheet. The difference of average interference value between the upper and lower sheets is distinct. However, the gap gradually becomes smaller with the increase of protruding height PU. The difference that existed between the upper and lower sheets achieves an almost perfect state when the protruding height PU is close to 5.94 mm.
To better evaluate the homogeneousness of the interference distribution condition, the linear fitting of the interference distribution along the thickness direction is deduced using the least square method. The slope of the fitted regression line obtained from the least square method is considered as the evaluation criterion, as expressed in Equation (1) [18,19]. The smaller the value y s l o p e is, the more inhomogeneous interference distribution condition will be.
y s l o p e = | k |
where k is the slope of the fitted regression line obtained from the least square method.
Figure 10 presents the interference distribution conditions. The vertical axis represents the value obtained from Equation (1). Clearly, the interference value gradually achieves a more homogeneous distribution when the protruding height PU is getting larger. The phenomenon is shown in Figure 9.
Figure 11 further compares the homogeneousness of different interference distributions. When the protruding height PU is small, such as PU = 3.94 mm, the interference distribution curve is pretty uneven. The slope of the fitted regression line is great. As a result, the included angle between the fitted regression line and x-axis (the thickness direction) is larger as well. When the protruding height PU is large, such as PU = 5.94 mm, the interference curve achieves an approximately symmetric distribution. It seems that the fitted regression line almost parallels the x-axis. The slope of the fitted regression line is very small. Moreover, the influence of protruding height on the interference level mainly acts on the upper sheet since the countersunk hole exists on the upper sheet.
Parameter analysis indicated that the adjustment of protruding height is an important and influential method to improve the interference value and its corresponding distribution condition. In the actual slug rivet installation process, the protruding height at the upper side should be larger than the value at the lower side (PU > PL).
Moreover, without the help of a parameterized model, the numerical model establishment and data analysis should be manually conducted 41 times. The workload and time cost are very high. On the contrary, with a parameterized model, the numerical model can automatically re-build and the data analysis can be automatically conducted. Each time the protruding height PU auto-updates within the range of [ 3.94 , 5.94 ] mm. Each simulation takes 2 h. Then the parameter analysis process keeps running for 82 h without any manual intervention until the riveting parameter is out of range. Much workload and time cost have been saved.

3.2. Optimal Parameter Analysis

Interference level is considered as the main quality control criterion for riveted assembly [17]. The interference value and distribution condition are two important indexes of the interference level for the quality control criterion. In this section, continuous analysis is conducted to find out the optimal protruding height PU within the range of [ 3.94 , 5.94 ] mm. The optimal value can not only make the interference value as large as possible but also make the interference distribution as homogeneous as possible. Therefore, the object function can be determined, as expressed in Equation (2).
f ( PU ) = min 1 y i n t e r f e r e n c e ( PU ) + a + y s l o p e ( PU ) b
where y i n t e r f e r e n c e ( PU ) is the average interference value, y s l o p e ( PU ) is the absolute value of the slope, a and b are constant coefficients, PU is the protruding height, and f ( PU ) is the target value.
In Equation (2), the constant coefficient a is used to avoid the special case that the denominator is equal to zero, a = 0.1. Constant coefficient b is the weight coefficient, which is used to determine the importance between interference value ( y i n t e r f e r e n c e ) and interference distribution condition ( y s l o p e . When b = 0, the continuous analysis only considers the interference value. In contrast, when b   =   + , the continuous analysis only considers the distribution condition. To a certain extent, the change of weight coefficient b will impact the optimal result. Therefore, to make a better choice, the continuous analysis will generate an optimum value range due to the variation of weight coefficient b.
Substitute the average interference value (as shown in Figure 9) and the absolute value of slope (as shown in Figure 10) into Equation (2). Figure 12 and Figure 13 display the target value curves combined with different weight coefficient values. The vertical axis in Figure 12 and Figure 13 represent the value obtained from Equation (2).
The slope of the target value curve becomes larger when the weight coefficient is getting larger. However, the variation trends of the curves in Figure 12 and Figure 13 are approximately consistent with each other. The coefficients, such as coefficient a, the average interference value and the absolute value of slope, are constant. The target value mainly depends on the weight coefficient b.
Table 4 lists the optimum value of protruding height PU with the effects of different weight coefficients. When the weight coefficient is small, the average interference value plays a major role in the continuous analysis. The optimal protruding height PU is 5.74 mm. Meanwhile, the effect of an average interference value can be ignored when the weight coefficient is large enough. The corresponding optimal protruding height PU is 5.89 mm. Therefore, considering the combined effect of both average interference value and interference distribution condition, the optimum value range is within [ 5.74 , 5.89 ] mm.
The optimal parameter algorithm was developed in the post-processing step. With a parameterized model, the continuous analysis can be automatically conducted. Finally, the optimum value range will be outputted and saved in an Excel file.

3.3. Verification Experiment

To provide a valid study, the accuracy and validity of the baseline model should be verified first. The experiments were conducted on the automatic drilling and riveting machine developed by Zhejiang University. Figure 14a illustrates the components of the equipment. Figure 14b presents the riveting operation process. Five rivets were installed.
Interference level is considered as the main quality control criterion for riveted assembly. Figure 15a shows the comparison of the interference level condition after the riveting process. Figure 15b shows the measurement points in the specimen. The experimental data were obtained by measuring the radial expansion of the slug rivet.
Because of the countersunk hole, the interference level at the upper sheet is smaller than the lower sheet. Though there is a small gap between FE and experiment results. The variation trends and the value of the two curves are approximately consistent with each other. The difference may be caused by measurement error, material property error and experimental error. The comparison between numerical results and experimental measurements is satisfactory in terms of the interference condition.
More details of numerical model verification can be seen in Reference [11]. The comparison proves that the baseline model can simulate the slug rivet installation process reasonably and provide accurate numerical results.
To verify the accuracy and validity of parameter analysis and optimal parameter analysis, several experiments were conducted using different protruding height PU. Figure 16 displays the experiment process. The protruding height PU in the experiments was 3.94, 4.44, 4.94, 5.44, 5.74 and 5.94 mm, respectively. At least three rivets were installed in each experiment. Figure 17 shows the specimen after riveting.
Interference level is considered as the main quality control criterion for riveted assembly. Figure 18 shows the comparison of the interference condition after the riveting process. The comparisons between the numerical results and experimental measurements are satisfactory in terms of both interference value and its variation trend.
The comparisons of interference value and its variation trend demonstrate that the parameterized model can simulate the slug rivet upset process reasonably and provide accurate numerical results.

4. Conclusions

This paper presents a parameterized modeling method. The parameterized model was built using Python script. Based on modular programming technology, the Python script can be divided into different modules. Each module implements a specific function. The degree of modeling automation in the pre-processing step and post-processing step can be significantly improved. To further reduce modeling difficulty, ABAQUS micro file is used to develop the Python script. Micro files can be generated by recording the manual modeling process. Therefore, for a certain numerical study, the baseline model only needs to be manually built once. Then the parameterized model can automatically re-build and simulate time by time without any manual intervention until the riveting parameter is out of range. Each time the riveting parameter can auto-update within a certain range. The simulation results can be automatically analyzed and saved as well.
With the parameterized model, the impact of protruding height on interference level has been continuously and automatically analyzed. The range of protruding height is [ 3.94 , 5.94 ] mm. The PU increment step is 0.05 mm. Totally, 41 simulations are conducted. The continuous simulation process keeps running 82 h. With the optimal parameter algorithm, the optimum value range of protruding height comes out simultaneously with the parameter analysis results. The comparisons between simulations and experiments prove the parameterized model’s ability. Much workload and time can be saved.
The study in this paper was fundamental research in the field of slug rivet connection. Few studies have published investigations concentrated on the numerical modeling method. The study improves knowledge about the modeling process and analysis method. The next phase of the study is undergoing large-scale optimization analysis. More riveting parameters can be taken into account. To further save analysis time, distributed computing technology can be applied.

Author Contributions

Conceptualization, C.L.; methodology, C.L. and J.L.; software, C.L.; validation, C.L., Y.B., and J.L.; formal analysis, J.L.; investigation, J.L.; resources, Y.B.; data curation, C.L.; writing—original draft preparation, C.L.; writing—review and editing, C.L.; visualization, C.L.; supervision, C.L.; project administration, C.L.; funding acquisition, C.L. All authors have read and agreed to the published version of the manuscript.

Funding

This research was funded by the National Natural Science Foundation of China (No. 51905489) and the Research Foundation of Zhijiang College of Zhejiang University of Technology (No. 104190220).

Institutional Review Board Statement

Not applicable.

Informed Consent Statement

Not applicable.

Data Availability Statement

Exclude.

Acknowledgments

The authors would like to acknowledge Zhijiang College of Zhejiang University of Technology and Zhejiang University for technical and financial support to this research.

Conflicts of Interest

No conflict of interest.

References

  1. Liang, C. Survey report of aircraft automatic assembly technology and equipment application. Aeronaut. Manuf. Technol. 2011, 19, 54–55. [Google Scholar]
  2. Rooks, B. Automatic wing box assembly developments. Ind. Robot. Int. J. 2001, 28, 297–302. [Google Scholar] [CrossRef] [Green Version]
  3. Holden, R.; Haworth, P.; Kendrick, I.; Smith, A. Automated riveting cell for a320 wing sheets with improved throughput and reliability (sa2). SAE Tech. Paper 2007, 3915, 2688–3627. [Google Scholar]
  4. Sarh, B.; Buttrick, J.; Munk, C.; Bossi, R. Aircraft Manufacturing and Assembly; Springer Nature: Berlin/Heidelberg, Germany, 2009; pp. 893–910. [Google Scholar]
  5. Liu, L.X.; Li, X.N.; Wang, Z.Q.; Li, W.P. Semi-empirical research on automatic drilling and riveting process of headless rivet. J. Northwestern Polytech. Univ. 2013, 31, 77–82. [Google Scholar]
  6. Cheraghi, S.H. Effect of variations in the riveting process on the quality of riveted joints. Int. J. Adv. Manuf. Technol. 2007, 39, 1144–1155. [Google Scholar] [CrossRef]
  7. Li, Y.J. An Analysis of Riveting Process by Theoretical, Nonlinear Finite Element and Experimental Methods; Wichita State University: Wichita, KS, USA, 1998. [Google Scholar]
  8. Song, D.L.; Li, Y.; Luo, B.; Li, X.G. An effective mathematical modeling for and simulation analysis of flush rivet pressing force of CFRP/AI components. J. Northwestern Polytech. Univ. 2012, 30, 558–564. [Google Scholar]
  9. Mu, W.; Li, Y.; Zhang, K.; Cheng, H. Notice of Retraction: An effective method of studying interference-fit riveting for 2117-T4 aluminum slug rivet. In Proceedings of the 2010 International Conference on Computer and Communication Technologies in Agriculture Engineering, Chengdu, China, 12–13 June 2010; IEEE: Chengdu, China, 2010; Volume 2, pp. 303–307. [Google Scholar]
  10. Mu, W.Q.; Li, Y.; Zhang, K.F.; Cheng, H. Mathematical modeling for and simulation analysis of flush rivet pressing force. J. Northwestern Polytech. Univ. 2010, 28, 742–747. [Google Scholar]
  11. Lei, C.; Bi, Y.; Li, J.; Ke, Y. Experiment and numerical simulations of a slug rivet installation process based on different modeling methods. Int. J. Adv. Manuf. Technol. 2018, 97, 1481–1496. [Google Scholar] [CrossRef]
  12. Lei, C.; Bi, Y.; Li, J.; Ke, Y. Effect of riveting parameters on the quality of riveted aircraft structures with slug rivet. Adv. Mech. Eng. 2017, 9, 1–12. [Google Scholar] [CrossRef]
  13. Reinhall, P.G.; Ghassaei, S.; Choo, V. An analysis of rivet die design in electromagnetic riveting. J. Vib. Acoust. 1988, 110, 65–69. [Google Scholar] [CrossRef]
  14. Chang, Z.; Wang, Z.; Zhang, J.; Yang, Y.; Kang, Y. Investigation of riveting parameters influence on the riveted joints deformation during slug rivet installation. Syst. Des. Complex. 2016, 11. [Google Scholar] [CrossRef]
  15. Lei, C.; Li, J. Effect of rivet die structure on the quality of riveted aircraft structures using slug rivet. Int. J. Adv. Manuf. Technol. 2020, 107, 229–245. [Google Scholar] [CrossRef]
  16. Wang, Z.; Chang, Z.; Luo, Q.; Hua, S.; Zhao, H.; Kang, Y. Optimization of riveting parameters using Kriging and particle swarm optimization to improve deformation homogeneity in aircraft assembly. Adv. Mech. Eng. 2017, 9, 1–13. [Google Scholar] [CrossRef] [Green Version]
  17. Shanghai Aircraft Manufacturing Company. Rivet Criterion ZPS-XXX 2010; Shanghai Aircraft Manufacturing Company: Shanghai, China, 2010. [Google Scholar]
  18. Yang, Y. Research on Riveting Process of Uniform and Reasonable Interference for Aircraft Thin-Walled Structure. Master’s Thesis, Nanjing University of Aeronautics and Astronautics, Nanjing, China, 2013. [Google Scholar]
  19. Liang, K.; Jiang, L.P.; Wei, H.Y.; Chen, W.L.; Jiang, H.Y.; Xu, R.W.; Wang, Y.B.; Yu, L. Interference uniformity analysis based on the clearance between the hole and rivet. Appl. Mech. Mater. 2012, 246, 28–32. [Google Scholar] [CrossRef]
Figure 1. The structural sketch of a riveted lap joint.
Coatings 11 00189 g001
Figure 2. The structural sketch of different types of rivet die.
Coatings 11 00189 g002
Figure 3. The FE model with mesh and boundary conditions.
Coatings 11 00189 g003
Figure 4. The parameterized modeling process.
Coatings 11 00189 g004
Figure 5. The improved parameterized modeling process.
Coatings 11 00189 g005
Figure 6. The parameterized model structure.
Coatings 11 00189 g006
Figure 7. The data format saved in Excel files.
Coatings 11 00189 g007
Figure 8. The continuous analysis process.
Coatings 11 00189 g008
Figure 9. The average interference value obtained from different protruding heights.
Coatings 11 00189 g009
Figure 10. The interference distribution conditions.
Coatings 11 00189 g010
Figure 11. The homogeneousness of different interference distribution conditions.
Coatings 11 00189 g011
Figure 12. The target value when the weight coefficient b is from 0.0001 to 10.
Coatings 11 00189 g012
Figure 13. The target value when the weight coefficient b is from 1 to 100.
Coatings 11 00189 g013
Figure 14. The automatic drilling and riveting machine and its experimental process. (a) The automatic drill-rivet machine; (b) Drilling and riveting operation.
Coatings 11 00189 g014
Figure 15. Interference condition between experimental and simulation. (a) Interference comparison; (b) Interference measurement point. The points D1 - D6 are the number of measurement points.
Coatings 11 00189 g015
Figure 16. The experiment process using different protruding heights. (a) The experiment device; (b) The experiment process.
Coatings 11 00189 g016
Figure 17. The specimen after riveting. (a) The upper side; (b) The lower side.
Coatings 11 00189 g017
Figure 18. The comparisons of interference condition. (a) Pu = 3.94 mm; (b) Pu = 4.44 mm; (c) Pu = 4.94 mm; (d) Pu = 5.44 mm; (e) Pu = 5.74 mm; (f) Pu=5.94 mm.
Coatings 11 00189 g018
Table 1. The main structure riveting parameter of a riveted lap joint.
Structure ParameterStructure Parameter
Countersunk hole diameter, ECountersunk hole depth, C
Rivet hole diameterFillet radius, R1
Total thickness, TFillet radius, R2
Sheet thicknessSlug rivet diameter
Protrusion height, PU (protrusion height out of the upper sheet) and PL (protrusion height out of the lower sheet)Slug rivet length
Table 2. The main procedure riveting parameter of a riveted lap joint.
Procedure ParameterProcedure Parameter
Squeezing forceSymmetry of squeezing force
Clamping forceSymmetry of clamping force
Synchronism of the riveting diesCountersunk hole structure
Table 3. The parameter value range.
Rivet Die TypeParameter Value Range
Type 1 H [ 1 , 2 ]   mm ,   D [ 4.76 , 5.56 ]   mm ,   θ [ 30 ° , 90 ° ]
Type 2 H [ 1 , 2 ]   mm ,   R [ 3.38 , 6.36 ]   mm
Type 3   θ [ 120 ° , 170 ° ]
Table 4. The optimum value when the weight coefficient b is from 0.0001 to 10,000.
Weight Coefficient0.00010.0010.010.1110100100010,000
Optimum value5.745.745.745.745.795.895.895.895.89
Publisher’s Note: MDPI stays neutral with regard to jurisdictional claims in published maps and institutional affiliations.

