Article

Rate-Dependent Cohesive Models for Dynamic Mode I Interfacial Propagation and Failure of Unidirectional Composite Laminates

1
Department of Aeronautical Structure Engineering, Northwestern Polytechnical University, Xi’an 710072, China
2
Shaanxi Key Laboratory of Impact Dynamics and Its Engineering Application, Xi’an 710072, China
3
Joint International Research Laboratory of Impact Dynamics and Its Engineering Application, Xi’an 710072, China
*
Author to whom correspondence should be addressed.
Coatings 2021, 11(2), 191; https://doi.org/10.3390/coatings11020191
Submission received: 18 January 2021 / Revised: 31 January 2021 / Accepted: 2 February 2021 / Published: 7 February 2021
(This article belongs to the Special Issue Damage and Fracture of Composites)

Abstract

:
With the increasing application of composite materials in anti-impact structure, the development of reliable rate-dependent interlaminar constitutive model becomes necessary. This study aims to assess and evaluate the applicability of three types of rate-dependent cohesive models (logarithmic, exponential and power) in numerical delamination simulation, through comparison with dynamic test results of double cantilever beam (DCB) specimens made from T700/MTM28-1 composite laminate. Crack propagation length history profiles are extracted to calibrate the numerical models. Crack propagation contours and fracture toughness data are predicted, extracted and compared to investigate the difference of the three different rate-dependent cohesive models. The variation of cohesive zone length and force profiles with the implemented models is also investigated. The results suggest that the crack propagation length can be better predicted by logarithmic and power models. Although crack propagation length profiles are well predicted, the numerical calculated dynamic fracture toughness tends to be higher than that of experimental measured results. The three models also show differences in the prediction of maximum loading forces. The results of this work provide useful guidance for the development of more efficient cohesive models and more reliable interface failure simulation of impact problems.

1. Introduction

Delamination is one of the main damage modes of composite structures subjected to impact loads, which will result in significant stiffness degradation of the structure [1,2,3,4]. The fracture toughness of mode I delamination is generally lower than that of mode II, so the mode I delamination is more likely to occur and has been extensively studied by double cantilever beam (DCB) experiments [5]. For the simulation of delamination of composite materials, the cohesive model is the most widely used method [6]. The concept of cohesive zone was first proposed by Dugdale [7] and Barenblatt [8], in the study of crack-tip yielding and fracture of brittle materials. Initial studies of cohesive model were mainly on the crack propagation in brittle materials [9,10], which was gradually applied to the fracture simulation of other materials and structures, including interface failure of adhesively bonded joints [11] and delamination in composite laminates [12].
The original cohesive model is rate-independent and shows good correlation with quasi-static test results. However, composite structures often undergo dynamic loading during its service life. Additionally, experimental results also elaborated the sensitivity of cohesive parameters with the variation of loading rates [13]. Therefore, it is necessary to develop rate-dependent cohesive model. The current rate-dependent cohesive model can be mainly divided into two categories. One category is to expand the viscoelastic or viscoplastic material model to a rate-dependent form. For example, Corigliano and Ricci [14] proposed two rate-dependent models: the viscoplastic model and time-dependent damage model. Musto and Alfano [15] proposed a novel rate-dependent model combining damage and visco-elasticity, where the rate-dependency is associated with the viscoelastic dissipated energy of the interface. Giraldo-Londoño et al. [16] approximated the viscoelastic behavior using two rate-dependent springs, in which two damage parameters were extracted from the Park-Paulino-Roesler (PPR) model.
The other type of method is to develop phenomenological expressions in which the fracture toughness and cohesive strength are expressed as functions of the opening rate at the crack tip [17,18,19,20,21,22,23,24]. Although the physical mechanism of crack fracture can be better reflected using the viscoelastic constitutive model, the mathematic representation of the viscoelastic model is very complicated and requires high computational time. Comparing with the viscoelastic model, the phenomenological model is relatively simpler and easier to implement, and computationally less expensive. Therefore, the phenomenological model is more convenient in practical engineering application and is the main subject of this work.
The most common rate-dependent phenomenological model for interface failure simulation is the logarithmic model derived from the Johnson-Cook constitutive model, where the parameters of the cohesive model have a linear relationship with the logarithm of the opening rate [17,18,19,20]. Karkkainen et al. [17] proposed a logarithmic-form rate-dependent behavior cohesive model to simulate the failure of the bonding interface between aluminum and resin, together with a maximum strain-based failure criterion for determining the onset of damage, without considering the damage evolution process. May et al. [18] developed a logarithmic rate-dependent cohesive model for BETAMATE 1496V (DuPont, Wilmington, DE, USA) adhesive through experimental calibration of tapered double cantilever beam (TDCB) and tapered end notch bending (TENF) tests. Furthermore, May et al. [19] used six different parameter sets to calibrate the rate-dependent cohesive model. Liu et al. [12] used two numerical methods, the rate-dependent cohesive model and the interfacial thick level set (ITLS) model, to simulate the DCB test of PEEK/carbon fiber composite laminates, based on the logarithmic formula. The proposed models calibrate well the rate dependency of fracture energy. Tamrakar et al. [20] used the droplet experiment method to determine the parameters of a rate-dependent cohesive model for composite interface, where the experimentally measured strength and fracture toughness show a linear relationship with the logarithm of the opening rate.
Apart from the logarithm models, Gozluklu et al. [21] proposed a bilinear rate-dependent cohesive model with only one rate-dependent factor k, where k is the ratio of dynamic fracture toughness to static fracture toughness in an exponential formula and calibrated using from literature data in the literature [22,23]. Similar methods are also applied for the dynamic crack growth in pure matrix material [6,24]. Zhou et al. [24] developed a power formula-based phenomenological rate-dependent cohesive model to describe the evolution of fracture toughness against the change of opening rate, in purpose of simulating the high-speed crack propagation of PMMA plates. Similar model and results were obtained in the study by Kazerani et al. [6].
There are many other researchers who developed rate-dependent cohesive law through direct fitting with experimental results, which were widely use in the simulation of adhesive interfaces [25,26,27,28]. May et al. [11], Makhecha et al. [25] and Yang et al. [26] calibrated the rate-dependent parameters based on loading rates. Lißner et al. [27] adopted a trilinear cohesive model to describe the rate-dependent behavior. Marzi et al. [28] used two different formulae to match the rate-dependency of failure-initiation stress and fracture energy, respectively. Overall, these formulae are applicable solely to the studied adhesive materials, but not suitable for the delamination simulation of composite interfaces.
A few studies were conducted to understand the feasibility of existing cohesive models in delamination studies of composite interfaces [29,30,31]. May et al. [29] identified the necessary of considering simultaneously the rate effect of interface strength and fracture toughness, through the comparison study of four different cohesive models for the impact simulation of composites. Fernandes et al. [30] evaluated the effects of bilinear, linear-exponential and trapezoidal cohesive zone model (CZM) laws on the simulation of bonded composite joints, and concluded that the shape of the CZM has no significant effect on the force-displacement curve of the brittle bonding interface, but has a certain effect on the ductile interface. Salih et al. [31] compared a variety of rate-dependent trapezoidal cohesive models and found that the shape of the cohesive model has certain influences on the simulation results of composite interfaces, and proposed a new rate-dependent cohesive model. The modeling results of Salih et al. [31] agree well with the experimental results; it is found that the initial stress has a positive increasing tendency with strain rate until reaching a critical value, following which the fracture energy starts to increase with the increase of strain rate.
Although some researchers have analyzed the impact of different cohesive models, the influence of rate-dependent cohesive models with different formulae based on bilinear cohesive model is not discussed in the previous research. Therefore, the effects of different types of rate-dependent cohesive models on the delamination of composite materials have not been systematically studied and need to be explored further. The influence of different types of rate-dependent cohesive models on the DCB test of carbon fiber composite laminate is analyzed in this paper. Firstly, the materials and experiments are described in Section 2. Then, different rate-dependent cohesive models are introduced in Section 3 and implemented in commercial finite element software Abaqus® (6.14-1, SIMULIA, Providence, RI, USA) using the VUMAT subroutine. The finite element model is introduced in Section 4. Then, the simulation results of different rate-dependent cohesive models are discussed in Section 5. Conclusions are explored in the last section.

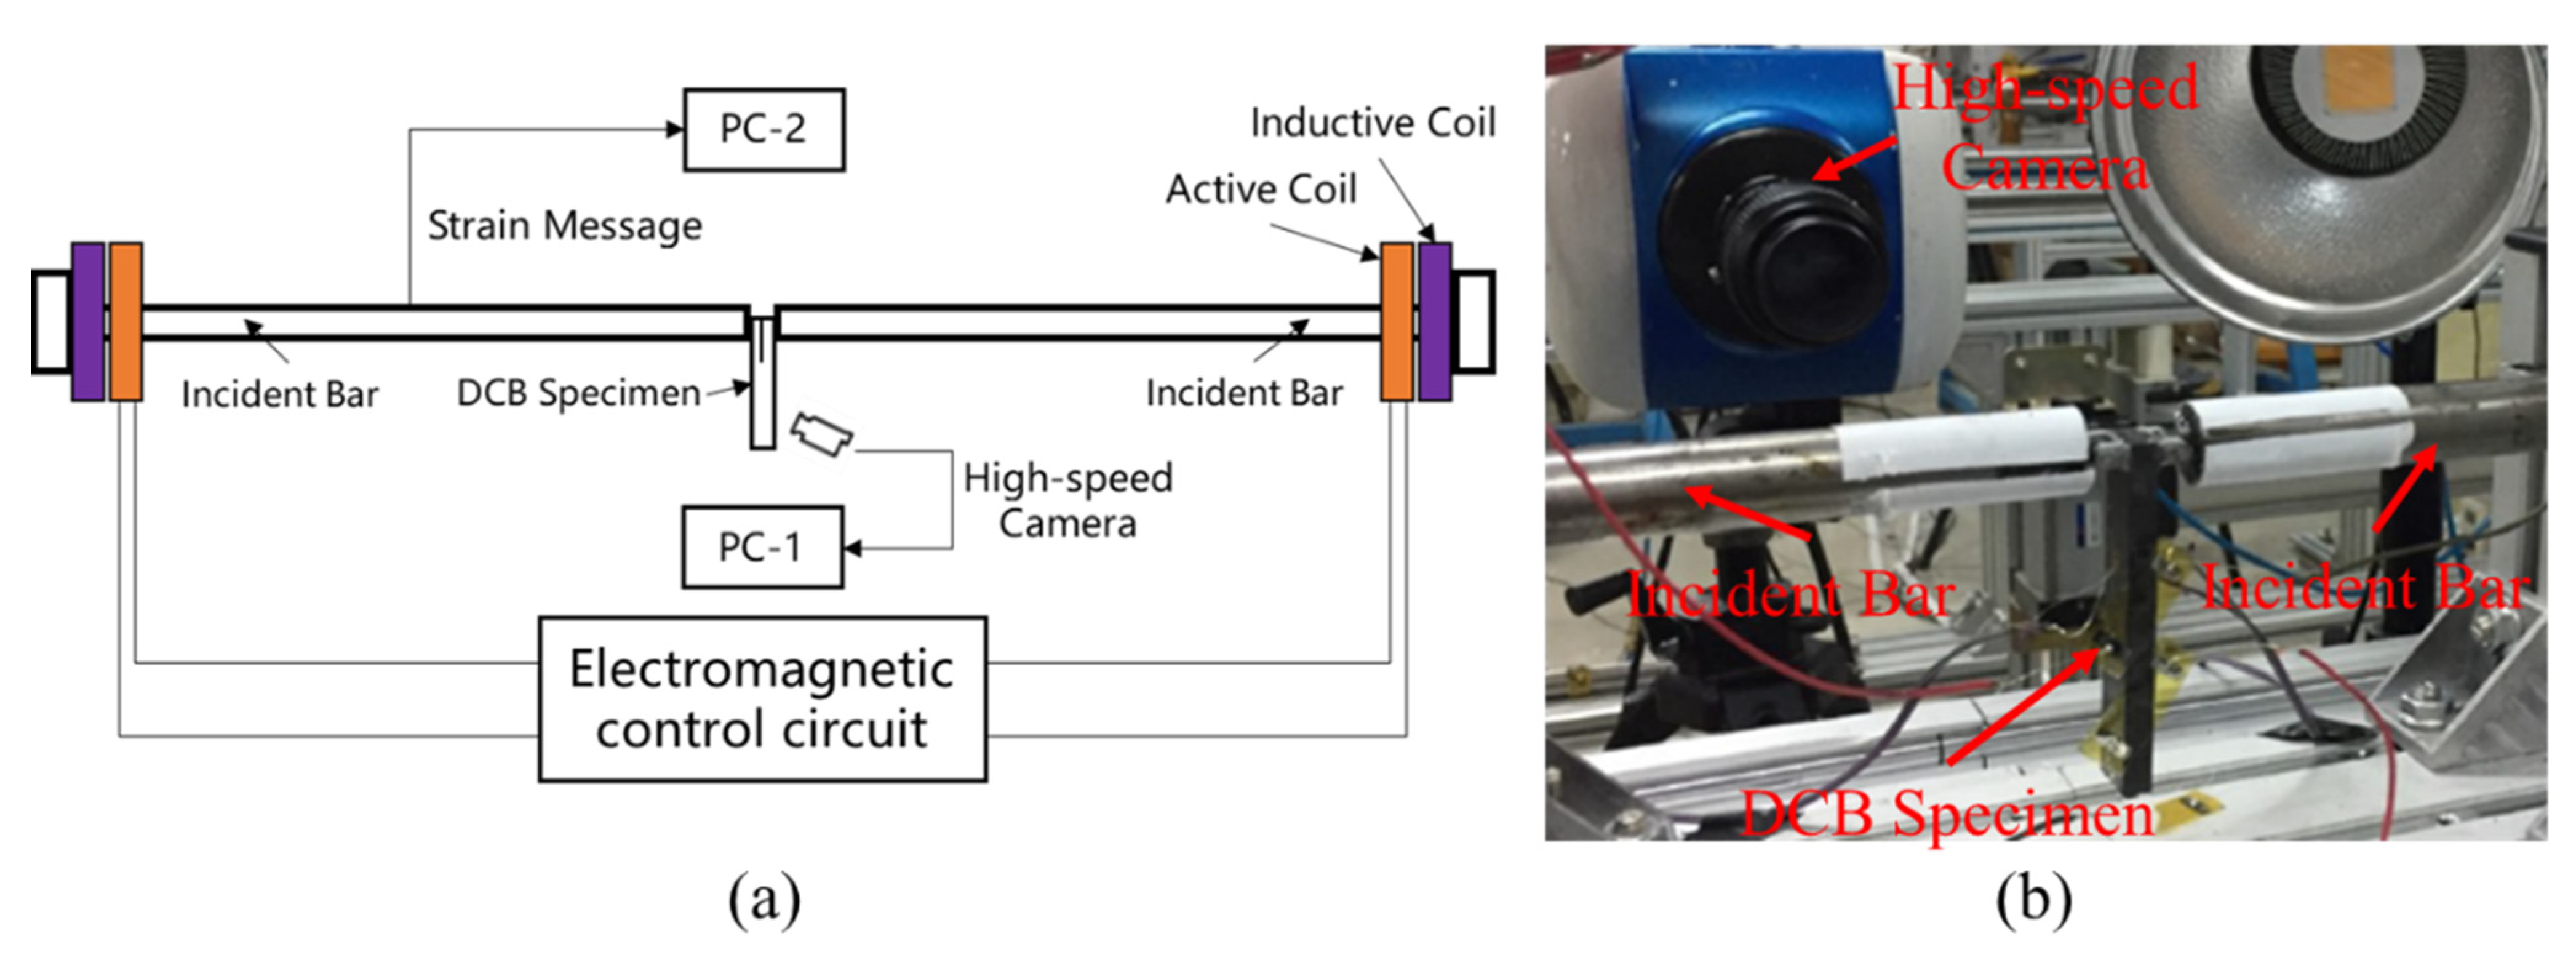
2. Materials and Tests

The CytecTM T700/MTM28-1 (Woodland Park, CO, USA) carbon/epoxy unidirectional laminates with fiber volume fraction of 61% are employed as specimens in the DCB experiment. The basic properties of the epoxy resin are ρ = 1.21 g/cm3, E = 8.4 GPa, S = 55.4 MPa and ν = 0.33. A non-adhesive polytetrafluoroethylene film (i.e., Teflon) with the thickness of 13 μm is put in the mid-plane of the specimen during the lay-up to introduce the pre-crack. Therefore, the stacking sequence of all DCB specimens is [024/Teflon/024]. The loading blocks are made by Aluminum and glued to the arms of the DCB laminate using an epoxy adhesive. The temperature in the laboratory is room temperature and the relative humidity is within the normal range.
The simulation in this paper is based on the dynamic double cantilever beam (DCB) experiment in the literature [32]. The dynamic DCB test was carried out by an electromagnetic Hopkinson bar apparatus which can guarantee pure mode I loading, shown in Figure 1. The schematic diagram of the electromagnetic Hopkinson bar is shown in Figure 1a and the testing bench is shown in Figure 1b. As the Hopkinson bar is very long, only the testing bench near the DCB specimen is shown. The Hopkinson tension bar test system and the data acquisition system are contained in this experiment equipment. The Hopkinson tension bar test system contains the incident bars, active coils, inductive coils and electromagnetic control circuit. The active coils are connected with the electromagnetic control circuit. After the electromagnetic induction and interaction between active coil and inductive coil, the tension stress waves can be synchronously generated in the incident bars. Then, the specimen can be loaded symmetrically to get the pure mode I fracture.
There are two pairs of strain gages mounting on each incident bar to record the incident and reflected stress waves. Then, the loading displacement, u1 and u2 in Figure 2, can be obtained by one-dimensional stress wave theory according to the incident and reflected strain signals. To ensure accurateness, the crack propagation was monitored by a high-speed photography (Kirana®, Pitstone, UK) and two crack-propagation gauges. The maximum frame rate of the camera is 5,000,000 fps, and the frame rate is set to 250,000 fps in this experiment. The results in [32] show that the crack propagation is correctly captured. There are also two strain gages attaching on the two sides of the DCB specimen to prove the symmetrical loading. All the strain signals and the high-speed photography are recorded in data acquisition system.

3. Theories of Cohesive Models

The rate-independent cohesive model and three rate-dependent cohesive models are introduced in this section. Bilinear cohesive model is chosen as the baseline rate-independent cohesive model because of the simplicity and widely usage in the delamination simulation of composites. The rate-dependent cohesive models are taken from literature [12,21,24] as discussed in introduction section and numerically implemented in Abaqus® (Dassault Systèmes, Vélizy-Villacoublay, France) as user subroutines (VUMAT).

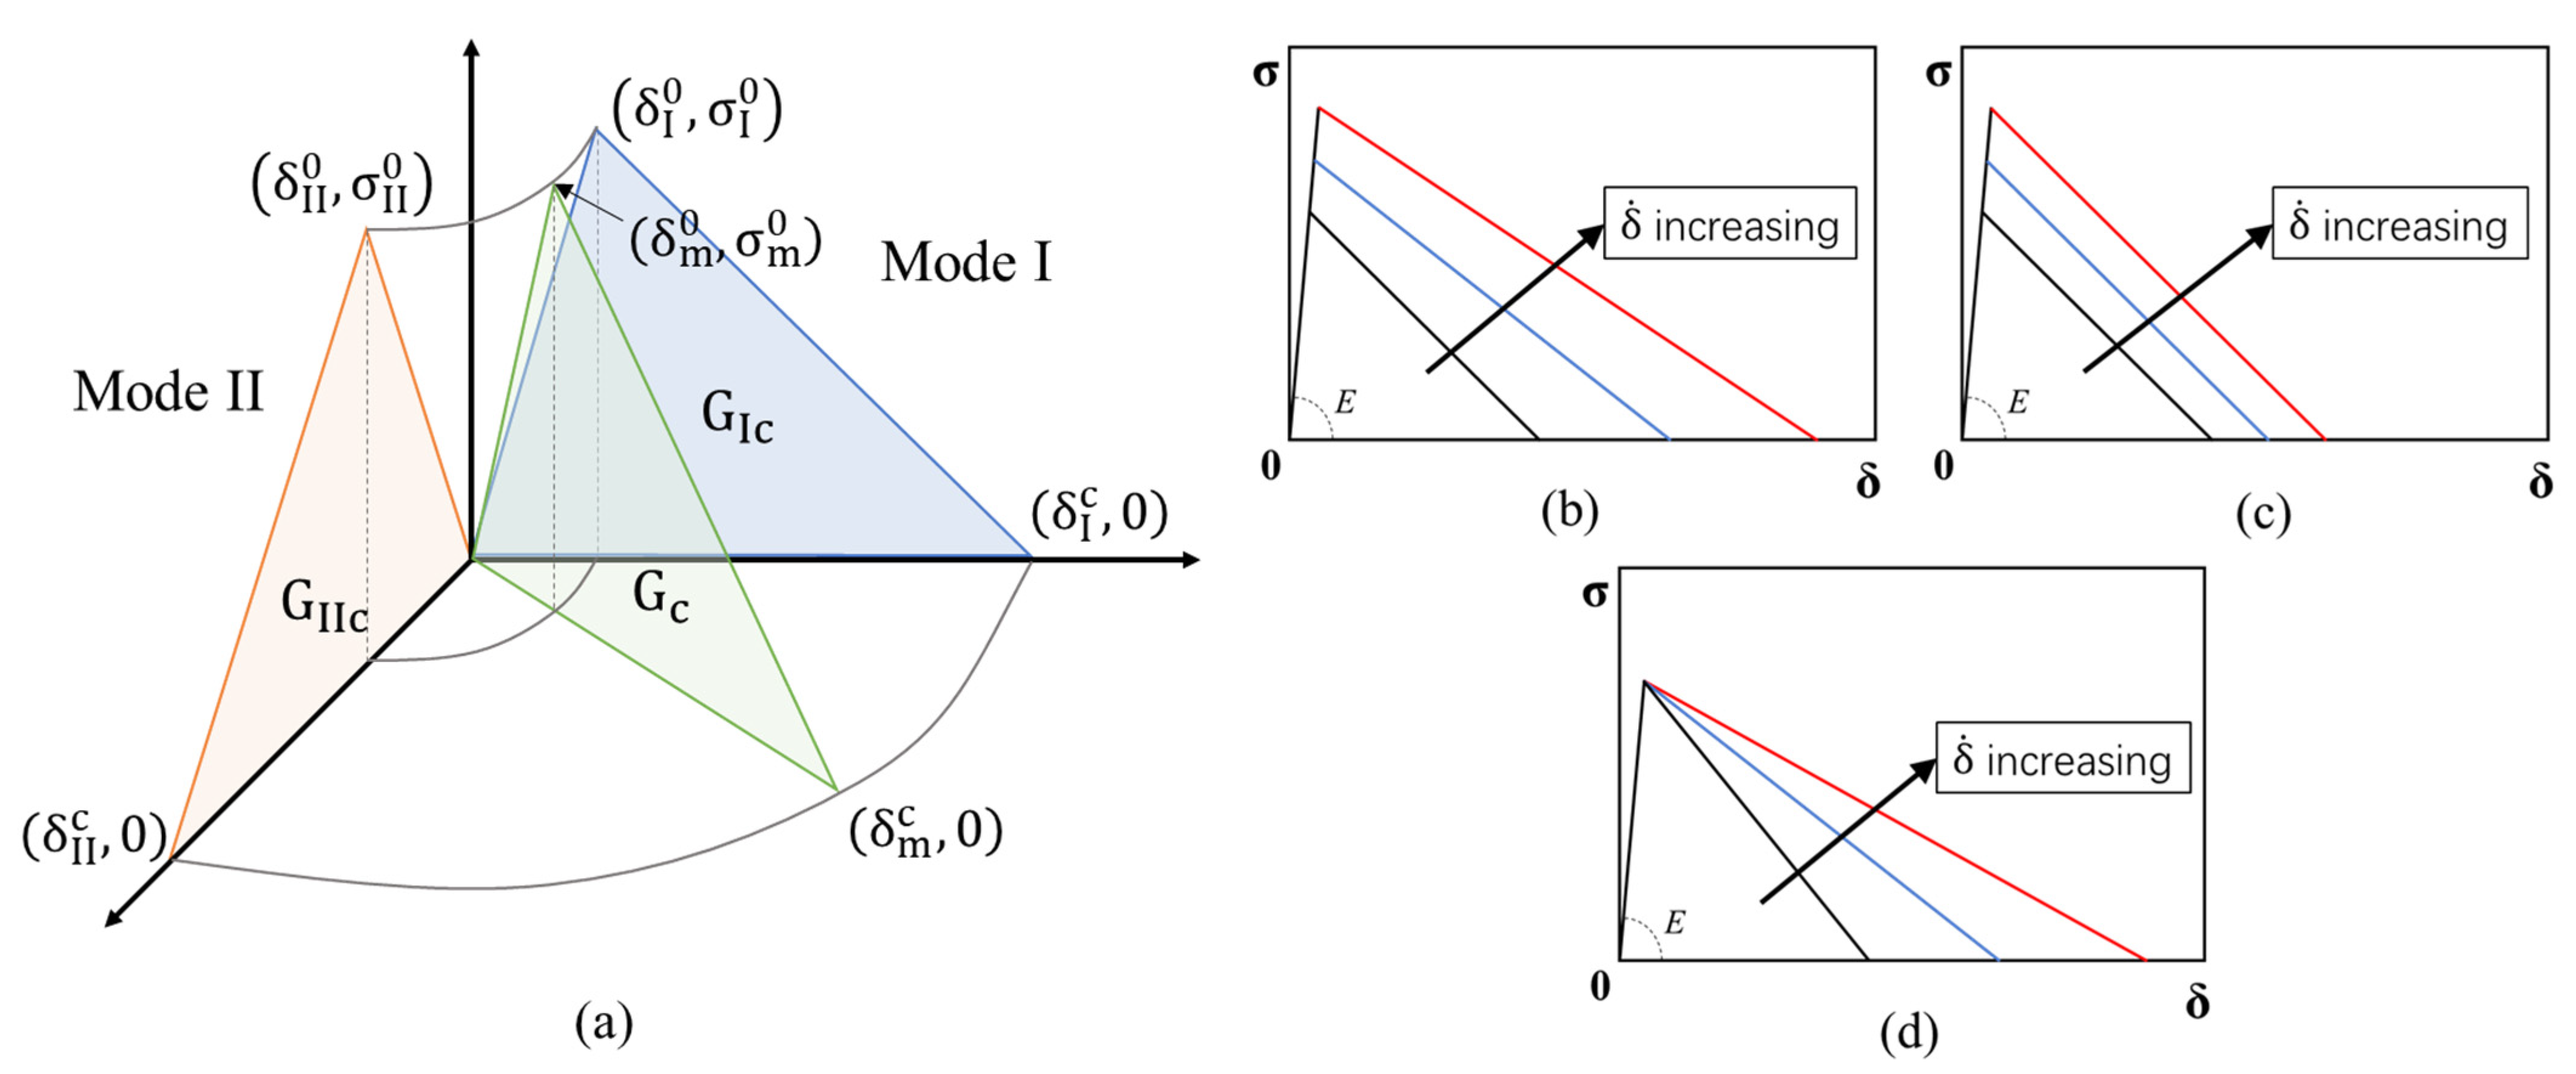
3.1. Bilinear Cohesive Model

For pure mode I or II loading, the bilinear cohesive law is defined by the point of damage initiation ( δ 0 ,   σ 0 ) and complete failure ( δ c ,   0 ) . The separation at damage initiation is defined as:
δ i 0 = σ i 0 E
where i means mode I or mode II facture, δ i 0 is the separation at damage initiation, σ i 0 is the stress at damage initiation and E is the stiffness of the element.
According to the triangular shape of bilinear cohesive law, the separation at complete failure, δ i c , can be calculated as:
δ i c = 2 G i c σ i 0
where Gic is the fracture toughness and is defined as the area under the traction–separation curve.
In mixed-mode facture, the coupling relationship between mode I and mode II facture is shown in Figure 2a. The quadratic stress failure criterion is adopted as the mixed-mode damage initiation criterion [21]:
( σ I σ I 0 ) 2 + ( σ I I σ I I 0 ) 2 = 1
where σI and σII are the current stresses under mode I and mode II loading. The separation under mixed-mode loading, δm, can be expressed as δ m = δ I 2 + δ II 2 . The mixed-mode initiation separation, δ m 0 , can be obtained by substituting this equation and Equation (1) into Equation (3) as follows [21]:
δ m 0 = { δ I 0 δ I I 0 1 + β 2 ( δ I I 0 ) 2 + ( β δ I 0 ) 2 ,   δ I > 0 δ I I 0 , δ I 0
where β is a coefficient representing the degree of mixed-mode and is defined as β = δ II / δ I [21].
The damage propagation under mixed-mode is governed by the mixed-mode fracture toughness, Gc. Additionally, Gc is given by B-K criterion proposed by Benzeggagh and Kenane [33] as follows:
G c = G I c + ( G I I c G I c ) ( G I I G I + G I I ) η
where η is an experience coefficient determined from experiments. Similarly, critical mixed-mode separation, δ m c , can be derived from Equation (5) [21]:
δ m c = { 2 δ m 0 E [ G I c + ( G I I c G I c ) ( β 2 1 + β 2 ) η ] ,   δ I > 0 δ II c , δ I 0

3.2. Rate-Dependent Cohesive Models

The rate-dependent cohesive model is established based on the rate-independent bilinear cohesive model introduced in last section. There are three types of rate-dependent cohesive models to be discussed in this paper, including logarithmic model, exponential model, and power model. The logarithmic rate-dependent cohesive model is derived from the Johnson-Cook model which is used in characterizing metal failure and is popular used in adhesive joint and composite laminates. The formula of logarithmic model is given as follows [12]:
σ i 0 ( δ . ) = { σ i , 0 0 ( 1 + c i ln ( | δ ˙ i | δ ˙ i ref ) ) ,   δ ˙ δ ˙ ref σ i , 0 0 ,   δ ˙ < δ ˙ ref
G i c ( δ ˙ ) = { G i c , 0 ( 1 + m i ln ( | δ ˙ i | δ ˙ i ref ) ) ,   δ ˙ δ ˙ ref G i c , 0 ,   δ ˙ < δ ˙ ref
where δ ˙ i is the separation opening rate at the crack tip, defined as δ ˙ i = d δ i / dt , and δ ˙ i ref is the reference separation opening rate; σ i 0 ( δ ˙ ) is the rate-dependent initiation stress, σ i , 0 0 is the quasi-static initiation stress and ci is the rate-dependent parameter of stress; G ic ( δ ˙ ) is the rate-dependent fracture toughness; Gic,0 is the quasi-static fracture toughness; and mi is the rate-dependent parameter of fracture toughness.
The exponential rate-dependent cohesive model is proposed for composite laminates firstly. The exponential model is shown as follows [21]:
1 δ i 0 ( δ ˙ ) = 1 δ i , 0 + ( 1 δ i , 0 0 1 δ i , 0 ) exp ( | δ ˙ i | δ ˙ i ref )
1 δ i c ( δ ˙ ) = 1 δ i , c + ( 1 δ i , 0 c 1 δ i , c ) exp ( | δ ˙ i | δ ˙ i ref )
1 σ i 0 ( δ ˙ ) = 1 σ i , 0 + ( 1 σ i , 0 0 1 σ i , 0 ) exp ( | δ ˙ i | δ ˙ i ref )
k = G i c , G i c , 0 = ( δ i , c δ i , 0 c ) 2 = ( σ i , 0 σ i , 0 0 ) 2 = ( δ i , 0 δ i , 0 0 ) 2
where δ i 0 ( δ ˙ ) is the rate-dependent separation at damage initiation and δ i c ( δ ˙ ) is the rate-dependent critical separation. The subscript of “0” represents quasi-static loading conditions and the subscript of “∞” represents limiting loading conditions. The limiting loading condition is an ideal condition where the crack propagation speed is infinite and is impossible to appear. The limiting values can be obtained by amplifying the quasi-static values by the rate-dependent parameter k. The value of the rate-dependent parameter changes between the quasi-static value and the limiting loading value.
The power model is first used in a brittle material, i.e., PMMA plate. The power model is given as follows [24]:
δ i c ( δ ˙ ) = δ i , 0 c ( 1 + ( | δ ˙ i | δ ˙ i ref ) n )
where n is the rate-dependent parameter. δ i , 0 c can be obtained by Equation (2). The initiation stress remains constant in this model. Therefore, the Equation (14) is used in programming, shown as follows:
G i c ( δ ˙ ) = G i c , 0 ( 1 + ( | δ ˙ i | δ ˙ i ref ) n )
The pure mode I or II traction-separation law of rate-dependent cohesive models are depicted in Figure 2b–d. The difference between these models can be seen in Figure 2. With the increasing of the separation opening rate, the initiation stress and the fracture toughness is both increasing in logarithmic model and exponential model, while only fracture toughness is increasing in power model. The parallelism is observed in the growth of exponential model, while the increase of initiation stress and fracture toughness is relatively independent in logarithmic model.

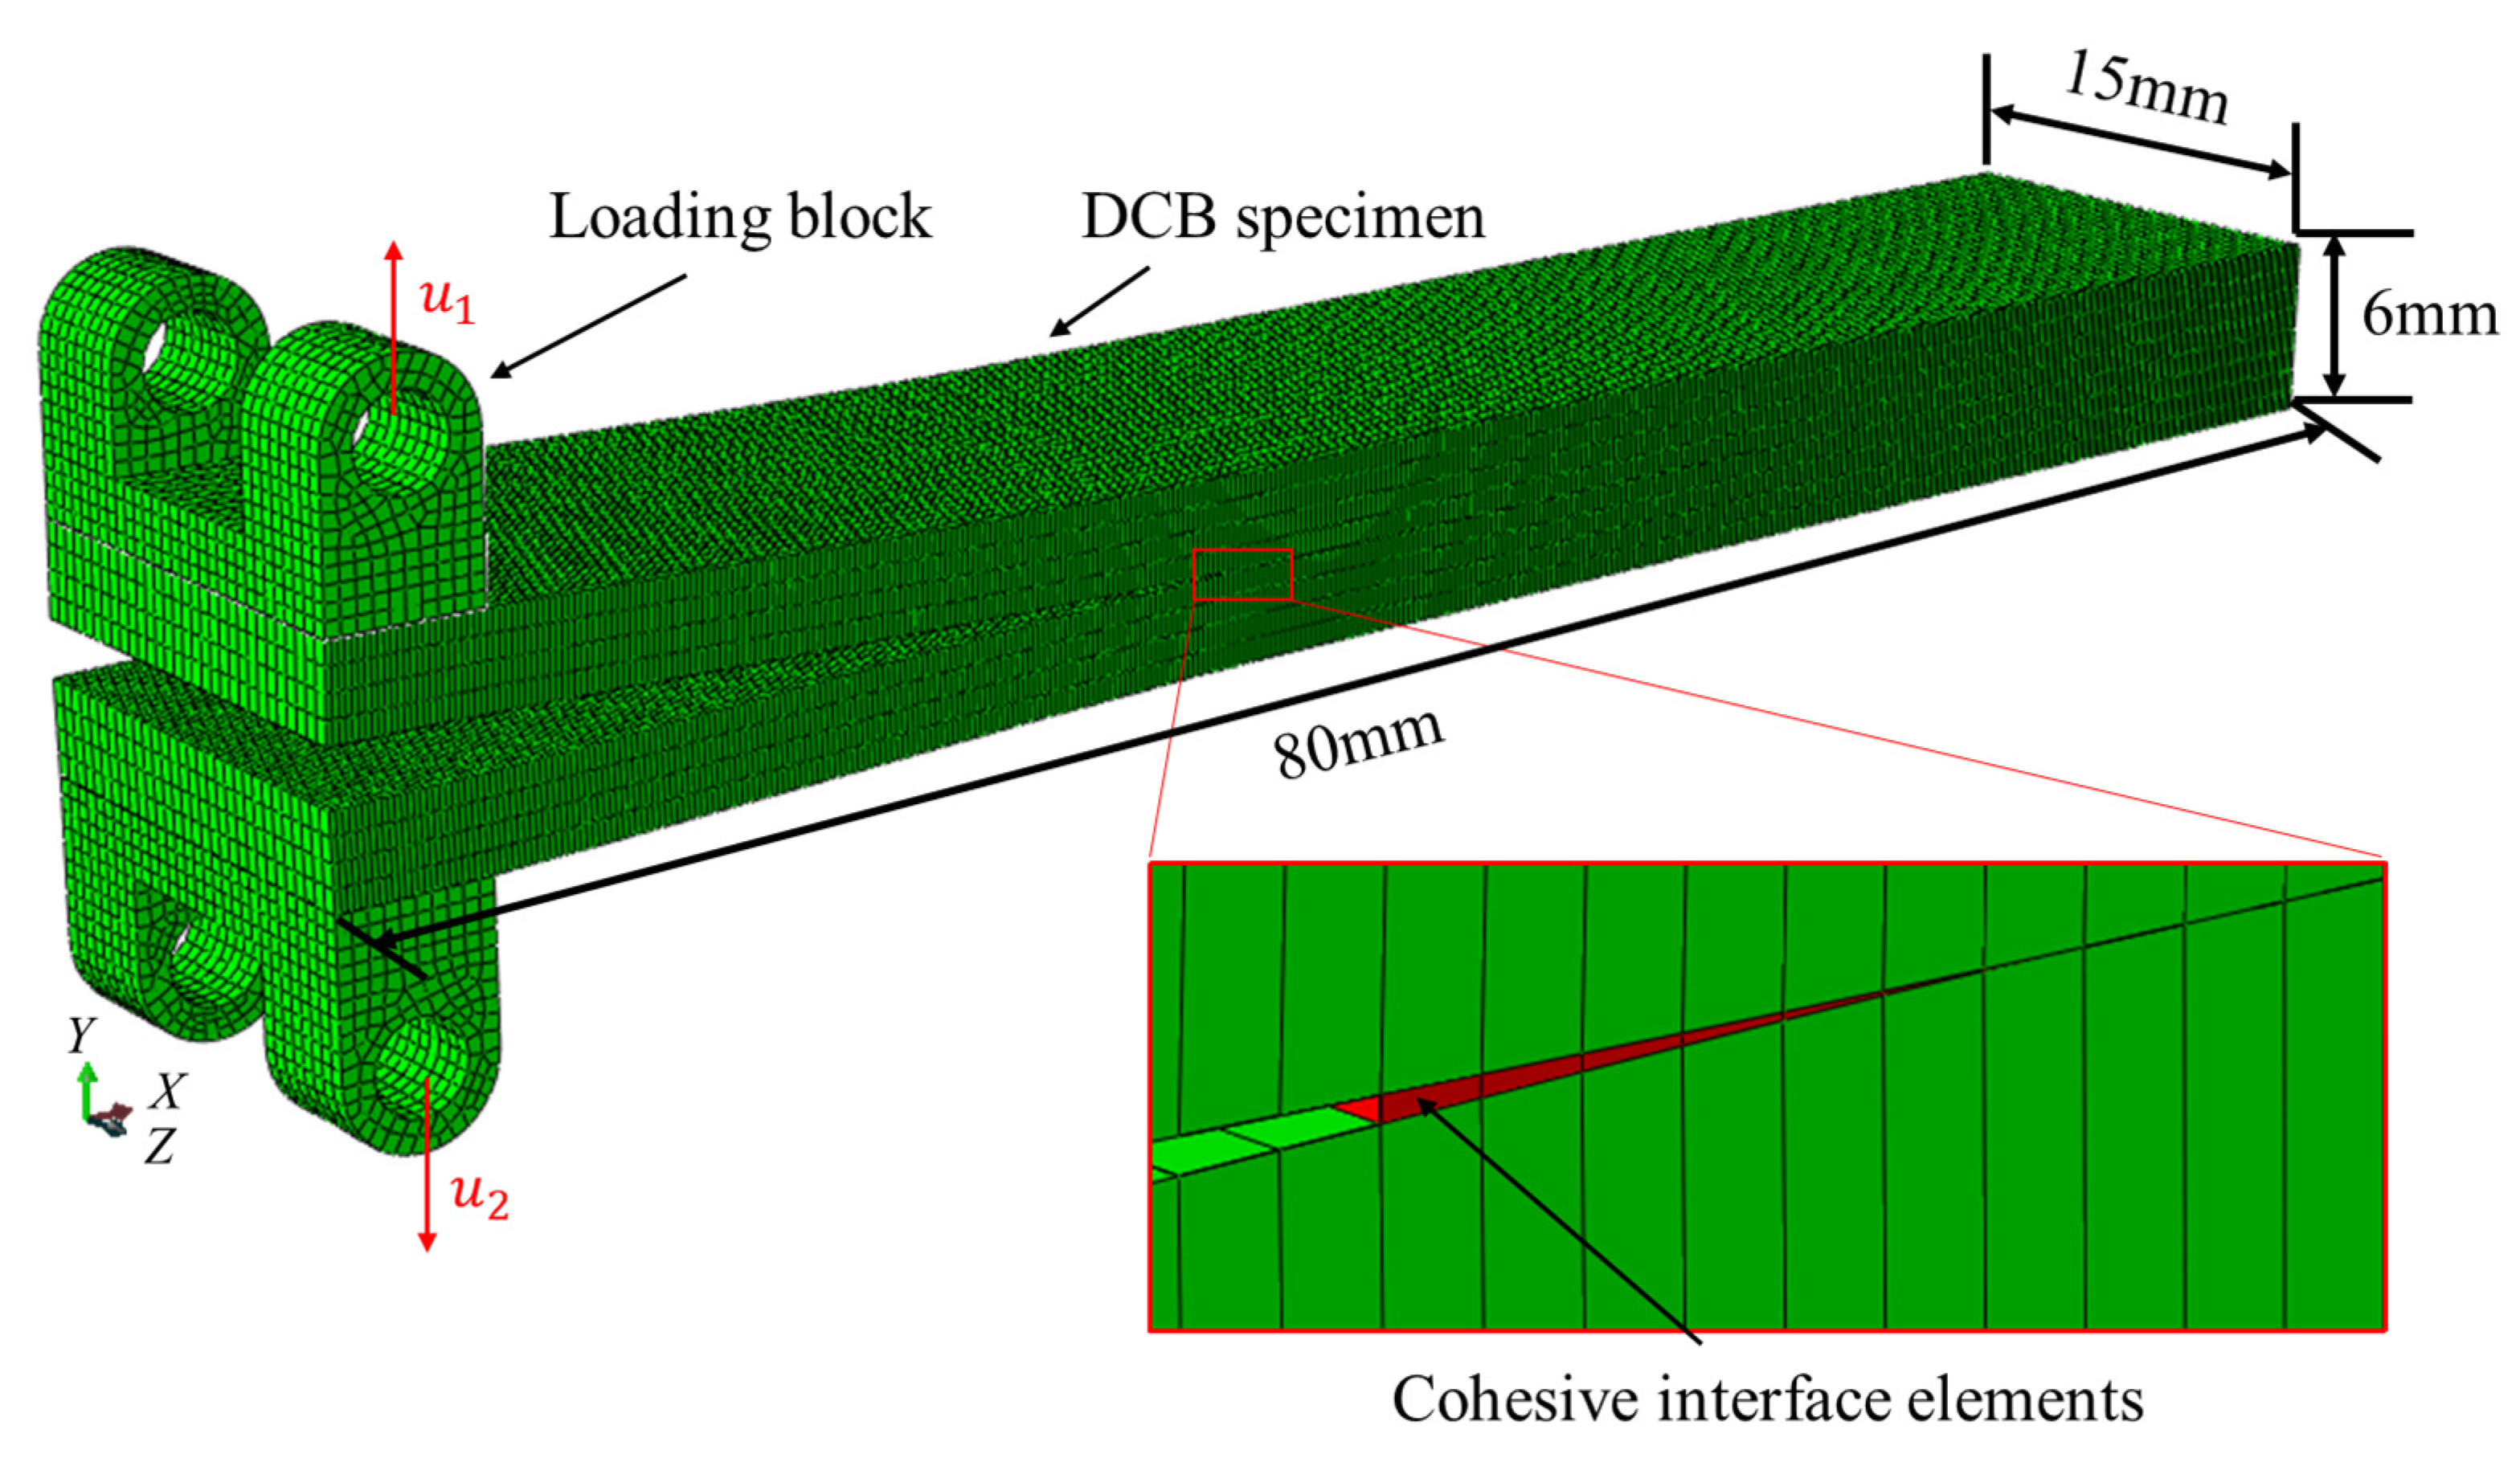
4. Finite Element Model

4.1. Model Description

The finite element (FE) model was established in Abaqus® 6.14-1, shown in Figure 3. The FE model consists of loading block and DCB specimen. The size of the specimen is 80 mm × 15 mm × 6 mm, and the prefabricated crack tip is 30 mm away from the loading side. The mesh size in the width direction is 0.5 mm and the thickness direction is 0.75 mm. To ensure convergence, the mesh size in the longitudinal direction is set as small as 0.2 mm. The zero-thickness cohesive interface elements are generated in the middle face of the laminate with the cohesive law presented in Section 3. The element type of laminate is three-dimensional eight-node reduction integral element (C3D8R) with number of 96,000, and the element type of cohesive interface is three-dimensional eight-node cohesive element (COH3D8) with number of 7500. Due to its low impact on the result, the mesh of the loading block is automatically generated and the overall mesh size is 0.5 mm. The computation time for each simulation takes about one hour using two CPUs of i5-3230M @ 2.60 GHz. (Intel, Santa Clara, CA, USA).
To consist with the experimental loading condition, the loading blocks and the external face of DCB specimen are constrained by tie constraint. The four outermost centers of round hole are set as reference points. The reference points and the inside surfaces of the hole are connected by coupling constraints. Only the freedom of rotation in Z direction of the inner surface of the hole is released. The loading displacement, u1 and u2, are loaded on the reference point. There are no additional constraints on the DCB specimen.

4.2. Material Parameters

There is no damage in the intralaminar of the laminate during DCB test. Therefore, the material property of the laminate is set as orthotropic linear elasticity with engineering constants in Table 1 [32] without damage criterion. The material of loading block is aluminum, so the material property of the loading block is set as isotropic linear elasticity with typical values of E = 70 GPa, ν = 0.32 and ρ = 2700 kg/m3.
The parameters need to be obtained can be divided into two categories: rate-independent parameters and rate-dependent parameters. Considering that the crack propagation in DCB test is mode I dominated, the parameters of mode II are assumed to be equal to that of mode I except that the quasi-static fracture toughness of mode I and II were obtained by experiments from literature [32]. The value of E should be as high as possible to make sure that the artificial deformation and artificial strain energy are minimization [34]. Therefore, the values of stiffness of mode I, II and mixed-mode are considered to be rate-independent and both taken as 5 × 10⁵ N/mm3. Typical values are employed for η [12]. Quasi-static mode I and mode II strength, σ I , 0 0 and σ II , 0 0 are appropriate adjusted based on the typical value of literature [12] to gain a better result.
The reference separation opening rate of logarithmic model adopts the value in the literature [12]. The reference separation opening rate of exponential model is suggested to be 70,000 mm/s in the literature [21], however, this value is too high for the DCB simulation in this paper. After several trial simulations, the reference separation opening rate of exponential model is determined to be 4500 mm/s in this work. The value of reference separation opening rate of power model used in the literature [24] is 5000 mm/s which is still not suitable for this model, so 20 mm/s in the literature [12] is choose for power model. The other rate-dependent parameters, i.e., ci, mi, k and n are calibrated based on the values in [12,21,24] to make the simulation results best match with the curves of crack length vs. time of experiments [32]. The parameters of rate-dependent cohesive interface element are summarized in Table 2.

5. Results and Discussion

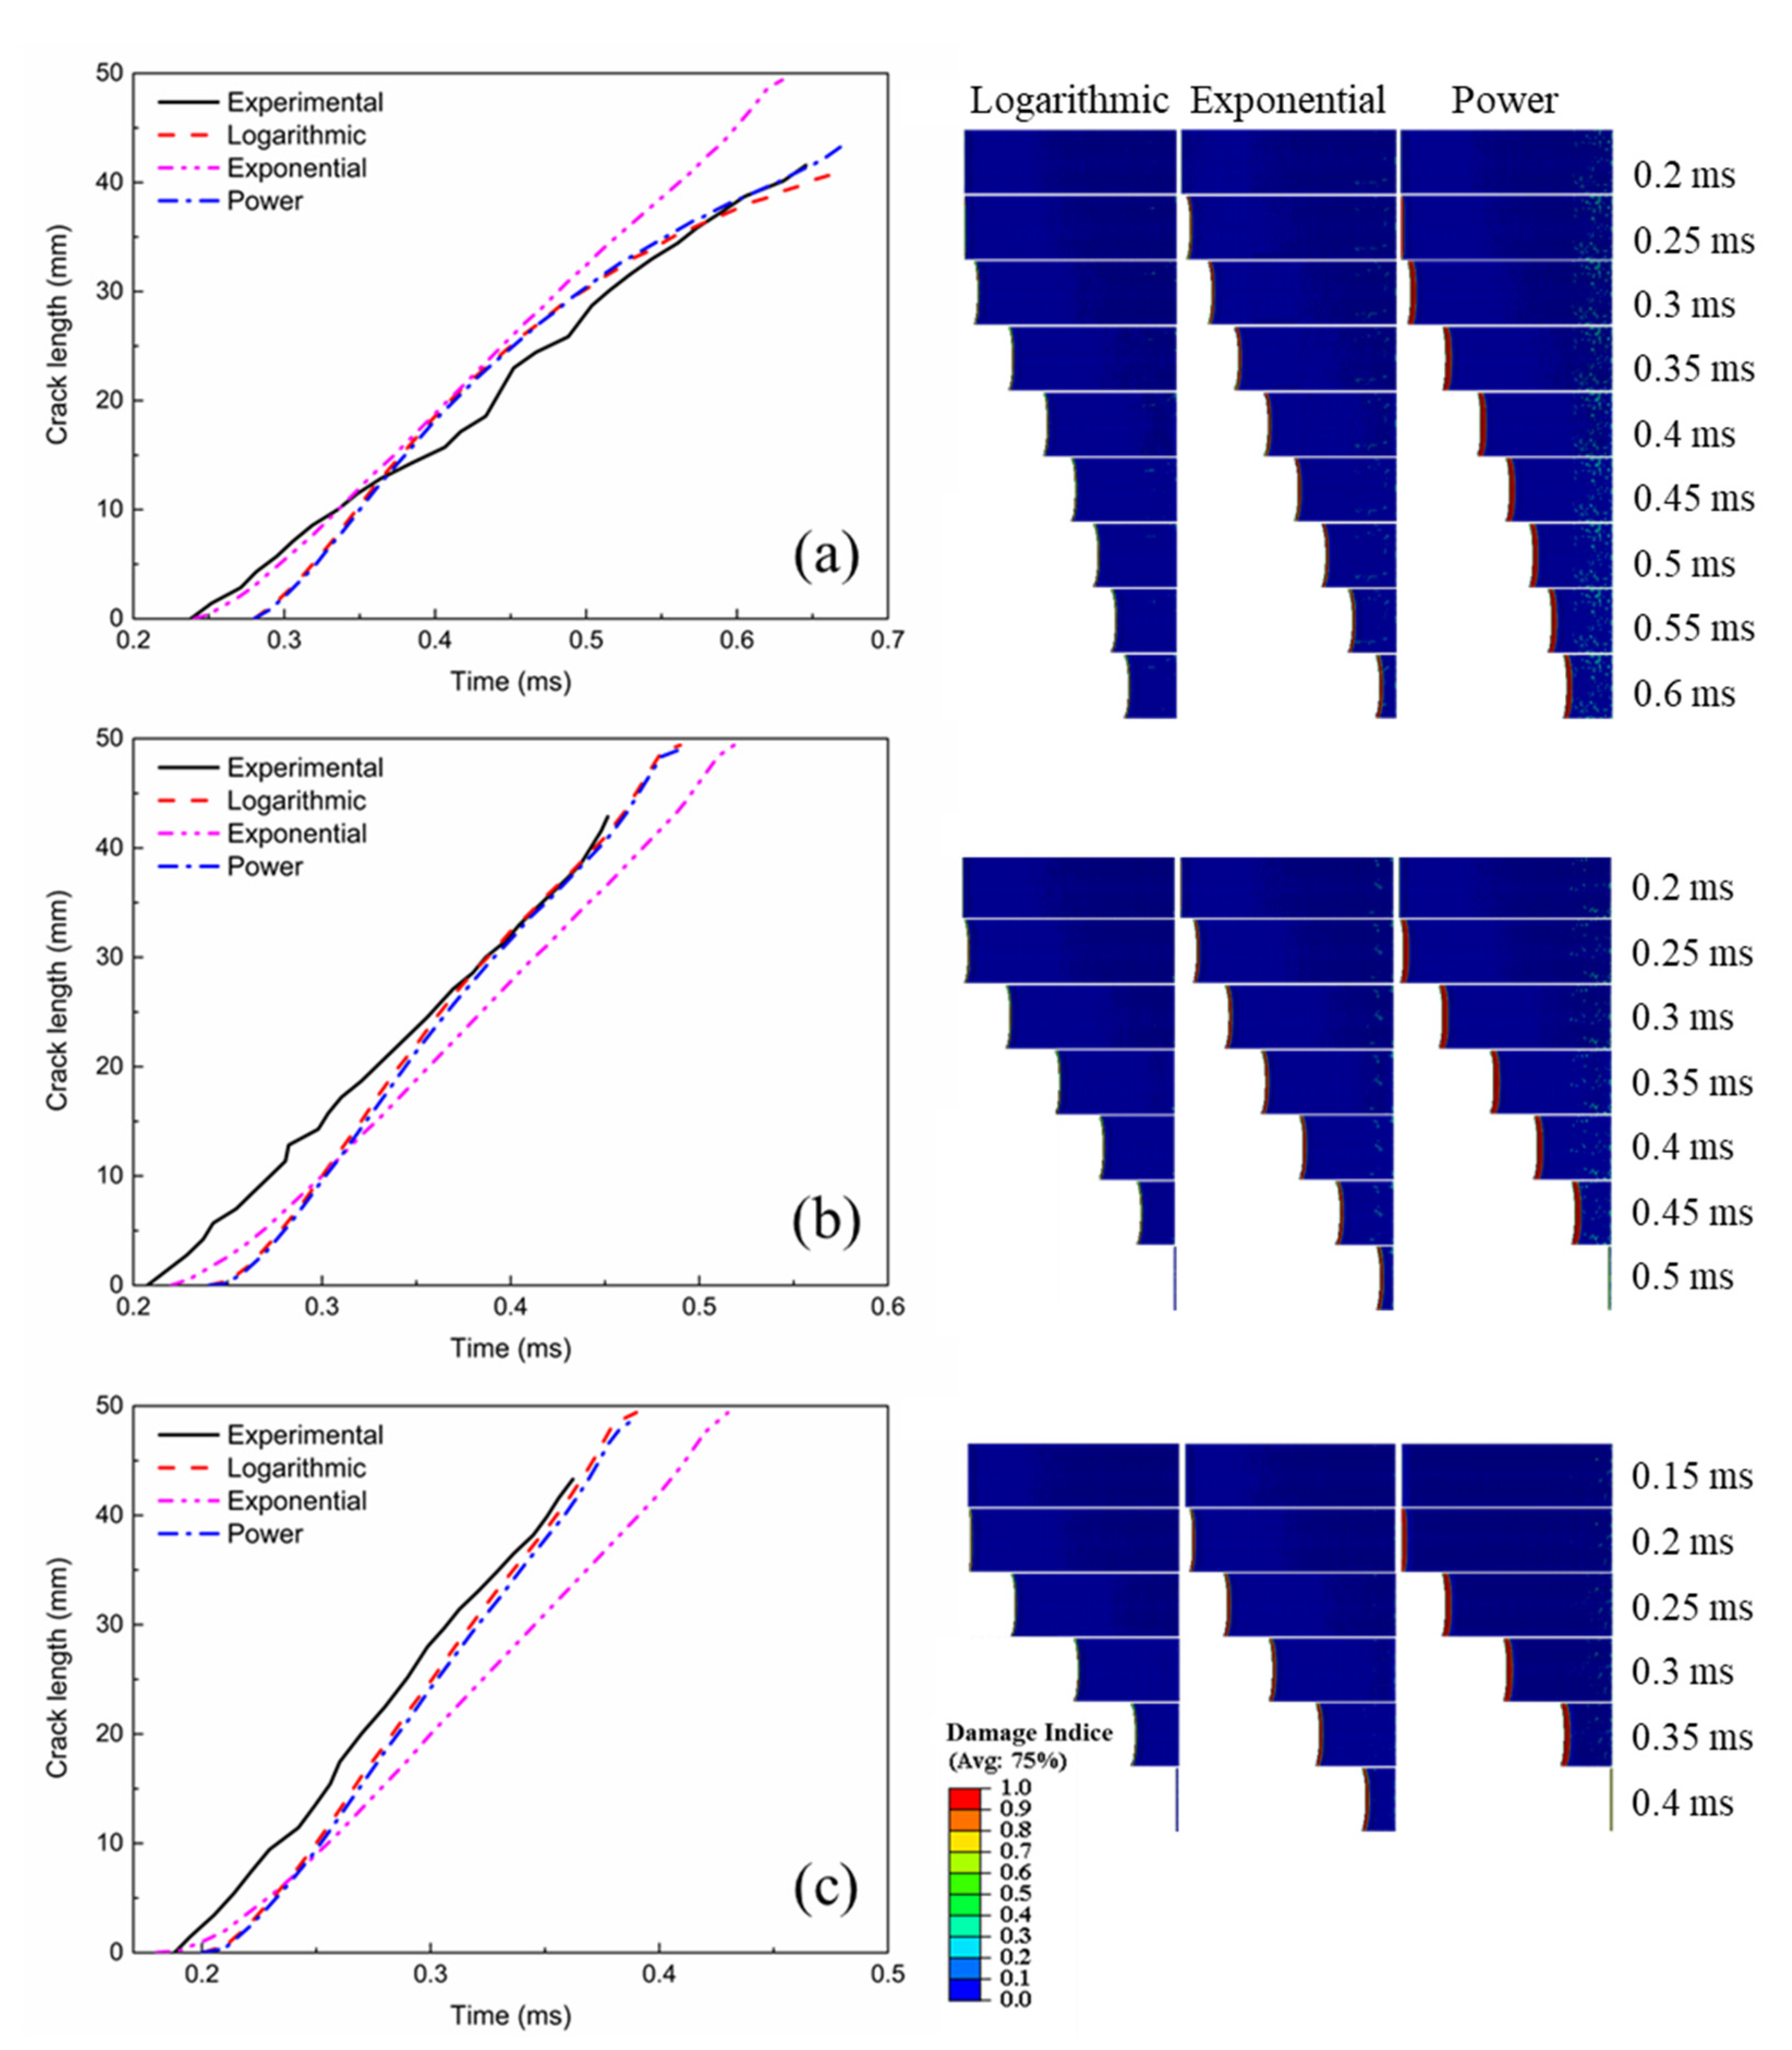
5.1. Model Correlation and Prediction of Crack Propagation Length

The crack propagation length-time curves simulated by different rate-dependent cohesive models are shown in Figure 4. The average speeds of different curves are calculated by linear fitting and the error between experiment and different models are shown in Table 3. Overall, the crack propagation curves of all three models are close to the experiment because the parameters are calibrated by these curves. The crack propagation length curves of logarithmic model and power model are very similar and close to the experimental curves, while the curves of exponential model are relatively far from the experimental curves. However, the crack initial time of exponential model is close to that of experiment while the crack initial time of logarithmic model and power model are always later than that of experiment.
The crack speed of logarithmic model is higher than that of experiment initially, and becomes lower gradually in 108 m/s condition, while the average speed of the logarithmic model is close to that of experiment with error of 2.78%. The same trend of crack speed of logarithmic model can be seen in 175 and 253 m/s conditions, though the trend is less and less obvious and the curve of 253 m/s condition is nearly linear. The average speed errors of logarithmic model are relatively larger in 175 and 253 m/s conditions, with errors of 18.86% and 9.09%, respectively, than that shown by the 108 m/s condition. The crack propagation length curves of exponential model are all nearly linear in three conditions. However, the average speed errors of exponential model are higher with 19.44% and −16.60% in 108 and 253 m/s conditions, respectively, than that of logarithmic model. Although the average speed error of exponential model in 175 m/s condition is very small of −3.43%, the initial crack speed is smaller than that of experiment which result the curve away from experiment. The behavior of crack propagation length curve of power model is similar with that of logarithmic model and the average speed errors is 8.33%, 18.29% and 7.51% in 108, 175 and 253 m/s conditions, respectively.
The propagation contours of cohesive element during the dynamic tests are simulated and compared in right side of Figure 4. The total cracking time decreases with the increase of crack-propagation velocity. Due to the approximate plane stress state of the side and the approximate plane strain state of the middle of the specimen, the crack tip is concave in x–z plane and the crack is always initiated firstly at the middle section [35]. To be consistent and comparable with the experiment, the numerical predicted crack-propagation length is counted by erosion of cohesive element along the edges. The predicted cohesive-zone length (length of red-color zone) of power model is obviously larger than that of logarithmic and exponential models which will be further discussed in Section 5.3.

5.2. Prediction of Crack Propagation Toughness

The crack propagation is governed by the dynamic fracture toughness. For the crack propagation velocity much smaller than the Rayleigh wave speed, the energy release rate can be used to express the fracture toughness. The energy history of the whole model can be obtained in numerical simulation and the energy release rate can be calculated by the following equation based on the energy conservation:
G = 1 B d d a ( U E U S U K )
where the UE, US and UK are the external work, total strain energy and kinetic energy, respectively. The B is the thickness of the specimen and the a is the crack propagation length.
The energy release rate-time curves of three rate-dependent cohesive models are depicted in Figure 5. Overall, since the crack propagation curves of logarithmic model and power model are similar and crack propagation length is governed by fracture toughness, the energy release rate curves of these two models are also very similar. Note that the initial stress of power model remains constant, which means that the change of initial stress is not very important in this loading condition. With the average crack propagation speed increasing, the general energy release rates of the three models increase in which the exponential model is the most obvious. Valleys can be seen in the final stage of all the curves.
The energy release rate curves of logarithmic model and power model keep oscillation during the crack propagation. The energy release rate of logarithmic model is a little higher than that of power model after 0.45 ms in the 108 m/s condition, which means that the crack propagation speed of logarithmic model is lower than that of power model as can be seen in Figure 4a. The first point of the power model in 175 and 253 m/s condition is extremely high because the first point of da is very small, which should be neglected.
The curves of exponential model increase initially then decrease gradually in all conditions, while the variation of logarithmic and power models is little, especially in 253 m/s condition. The overall energy release rates of exponential model are lower than that of logarithmic and power model in 108 m/s condition which results that the average crack speed is the highest in three models. Additionally, the overall energy release rates of exponential model are higher than that of logarithmic and power model in 253 m/s condition which results that the average crack speed is the lowest in three models.
The dynamic fracture toughness varies from 0.1 to 1.1 N/mm in experiment and may be totally different between two tests with the same average crack velocity. According to the experiment, the fracture toughness is governed by the crack tip opening rate and the crack propagation speed. However, within the phenomenology cohesive model discussed in this paper, the dynamic fracture toughness is only the function of crack tip opening rate. Therefore, the energy release rates in numerical results is 2–3 times than the highest energy release rate in experiment when the crack propagation length curves of numerical results are close to that of experiment. The higher fracture toughness is a compromise to compensate some physical mechanisms which is the disadvantage of phenomenology model. Although this error is relatively large in this DCB simulation, the resulting error of absorbed energy can be neglected in impact simulation of big structures. Therefore, the phenomenology models are still popular used in many studies.

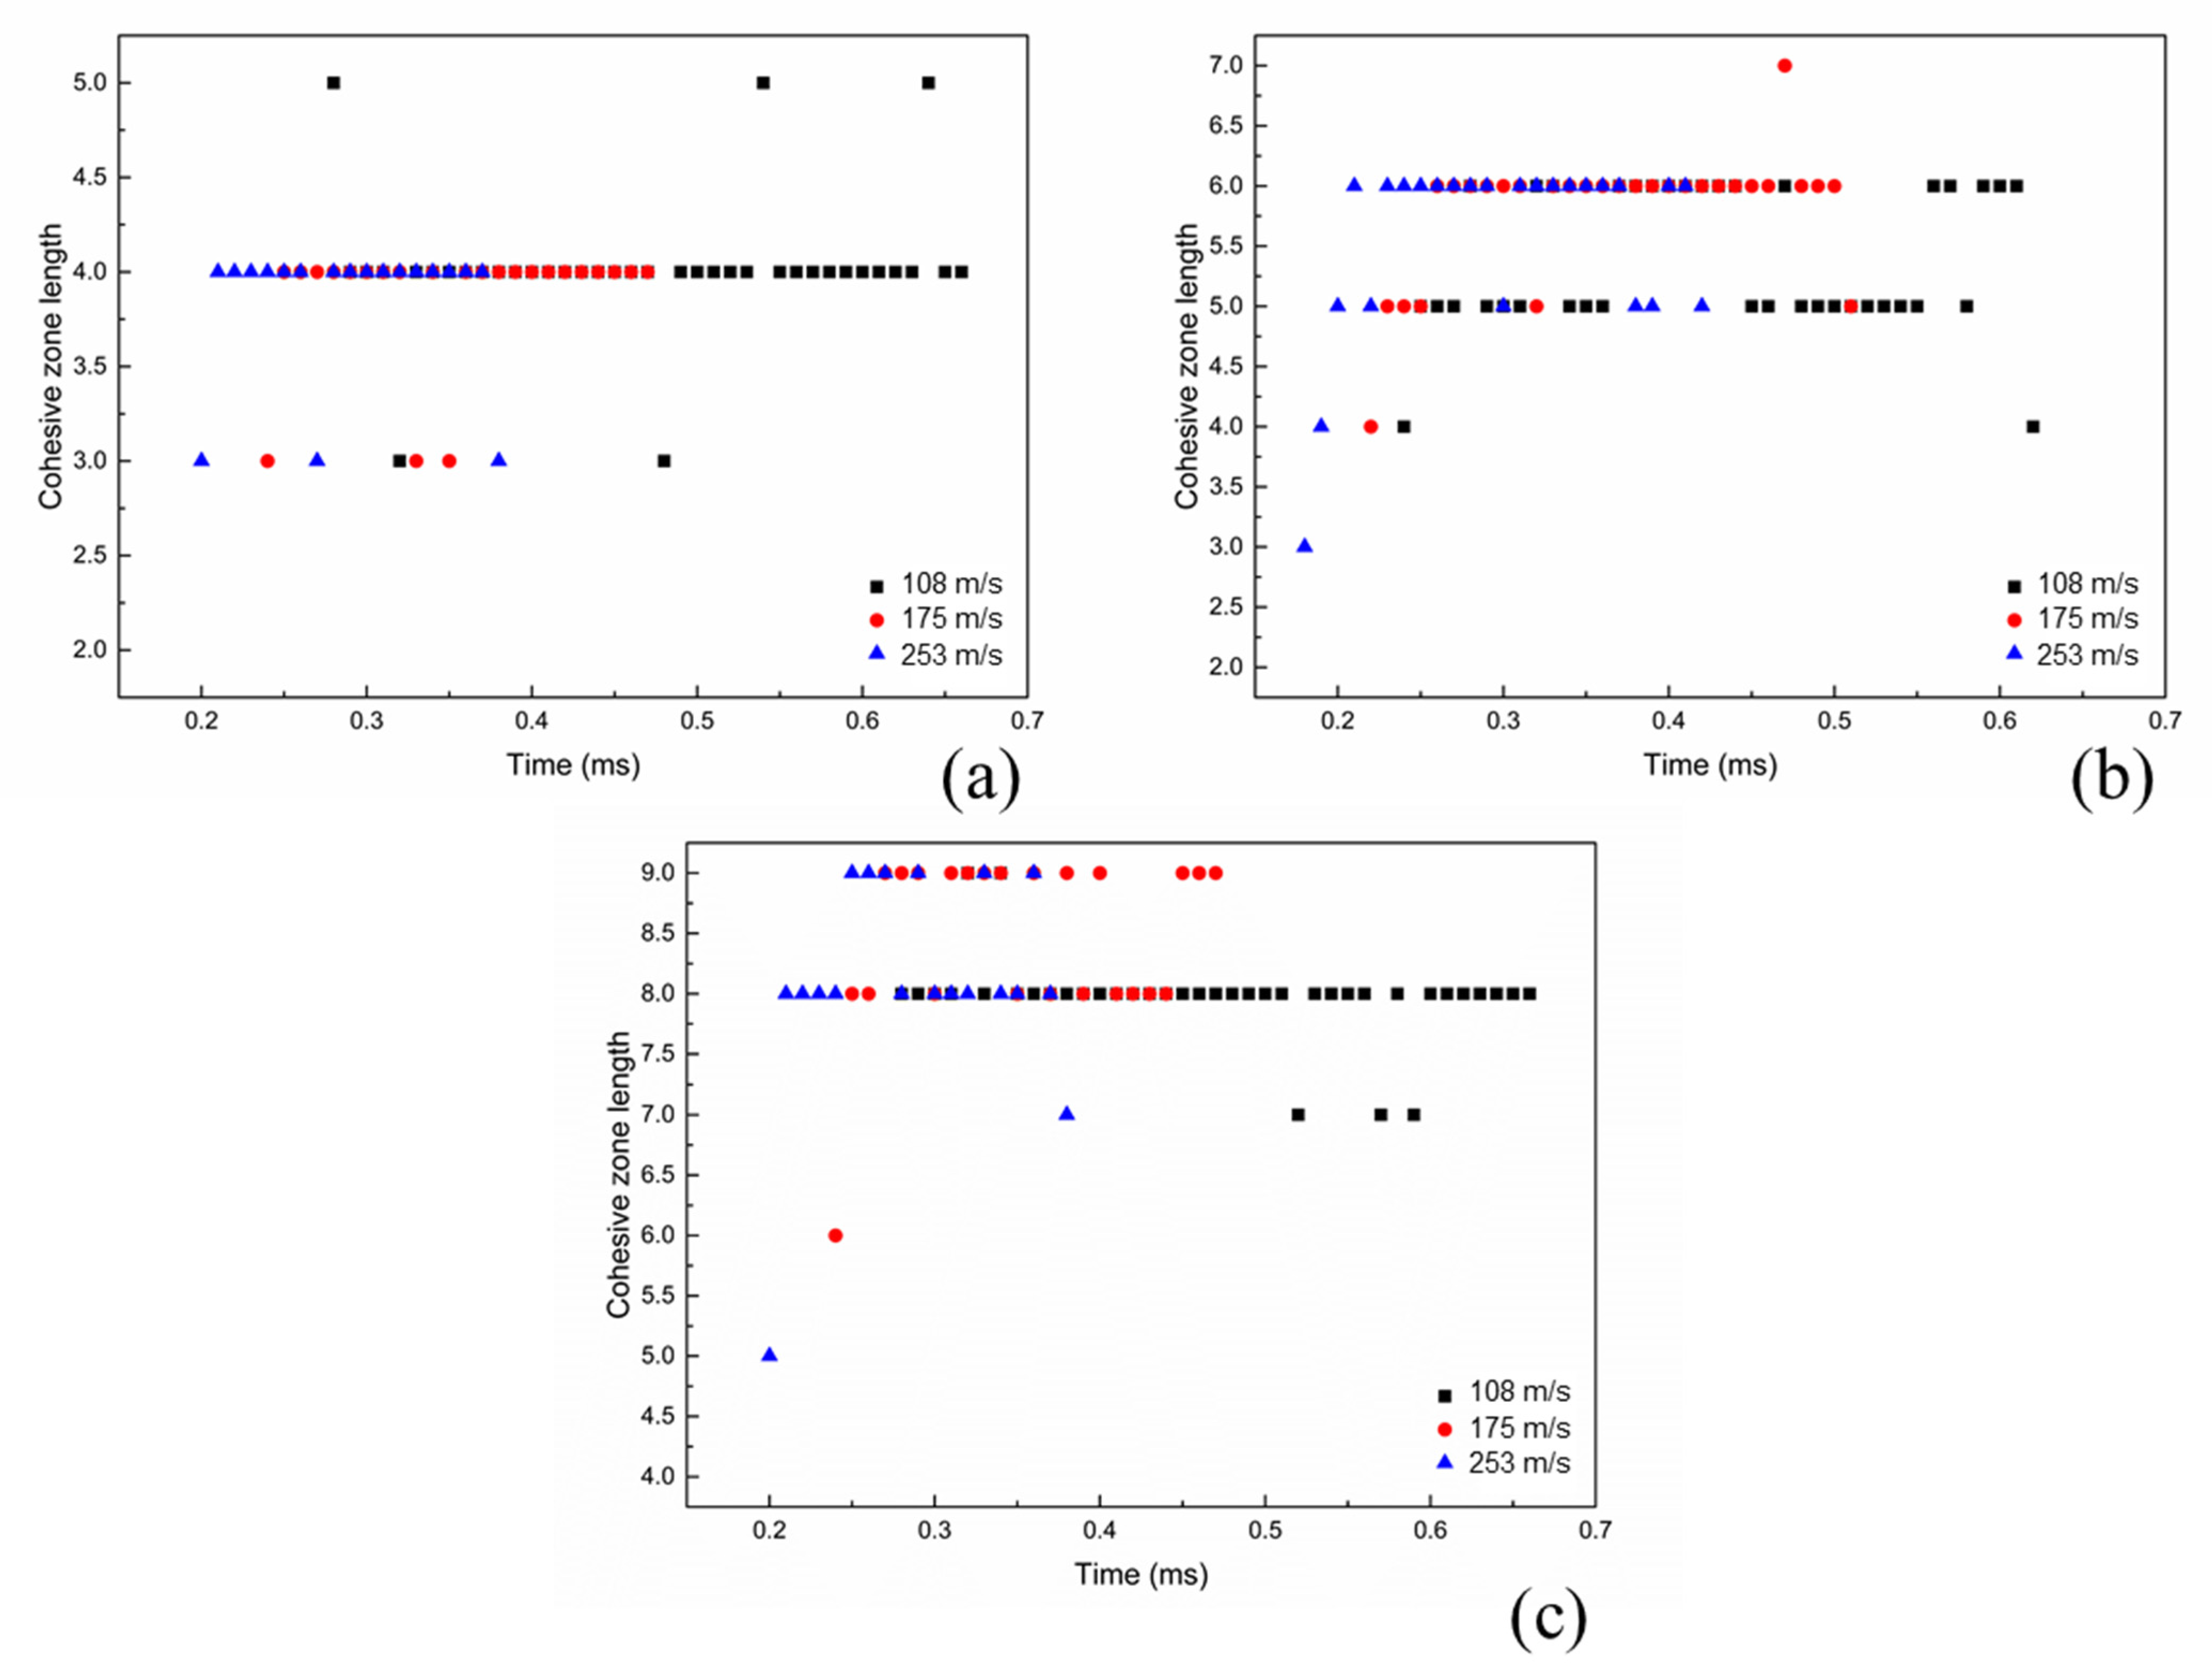
5.3. Prediction of Cohesive-Zone Length

The stability of finite element simulation of cohesive zone is strongly dependent on cohesive zone length. The cohesive zone length is the length of the failure process zone ahead of the crack tip where the cohesive forces are acting. Within the finite element method framework, the cohesive zone length can be defined as:
l c z l = N e × d e
where N e is the number of damaged cohesive elements and d e is the size of the cohesive elements which is 0.2 mm in this simulation. The cohesive zone lengths of three models in all conditions are counted and shown in Figure 6 and the N e is expressed as units of the Y-axis. According to [11], the cohesive zone length in an infinite body can be expressed by the function of strength and fracture toughness:
l c z l = C o n s t × G c ( σ 0 ) r
where r = 2 for the infinite body. While in other situations, r may be other values, e.g., r = 0.8~0.9 in the literature [11].
The phenomenon depicted in Figure 6 can be explained according to Equation (17). The most appeared cohesive zone lengths of logarithmic model, exponential model and power model are 4, 6 and 8, respectively. For the initial stress remaining unchanged in power model, the initial stress is the smallest in three models which results that the cohesive zone length is the largest. The cohesive zone length of logarithmic model is smaller than that of exponential model which means that the initial stress of logarithmic model is larger than that of exponential model when the fracture toughness is the same.
For power model, the fracture toughness becomes larger with the increase of crack speed which results that the cohesive zone length becomes larger. For exponential model, the fracture toughness changes as the square of stress. Therefore, if the r = 2 in this simulation, the cohesive zone length of exponential model should remain constant. However, the trend of cohesive zone length of exponential model is similar with that of power model. Therefore, the r is smaller than 2 in this simulation. For logarithmic model, the trend is contrary to that of power model which means that the change of initial stress is larger than that of fracture toughness with the change of crack speed.

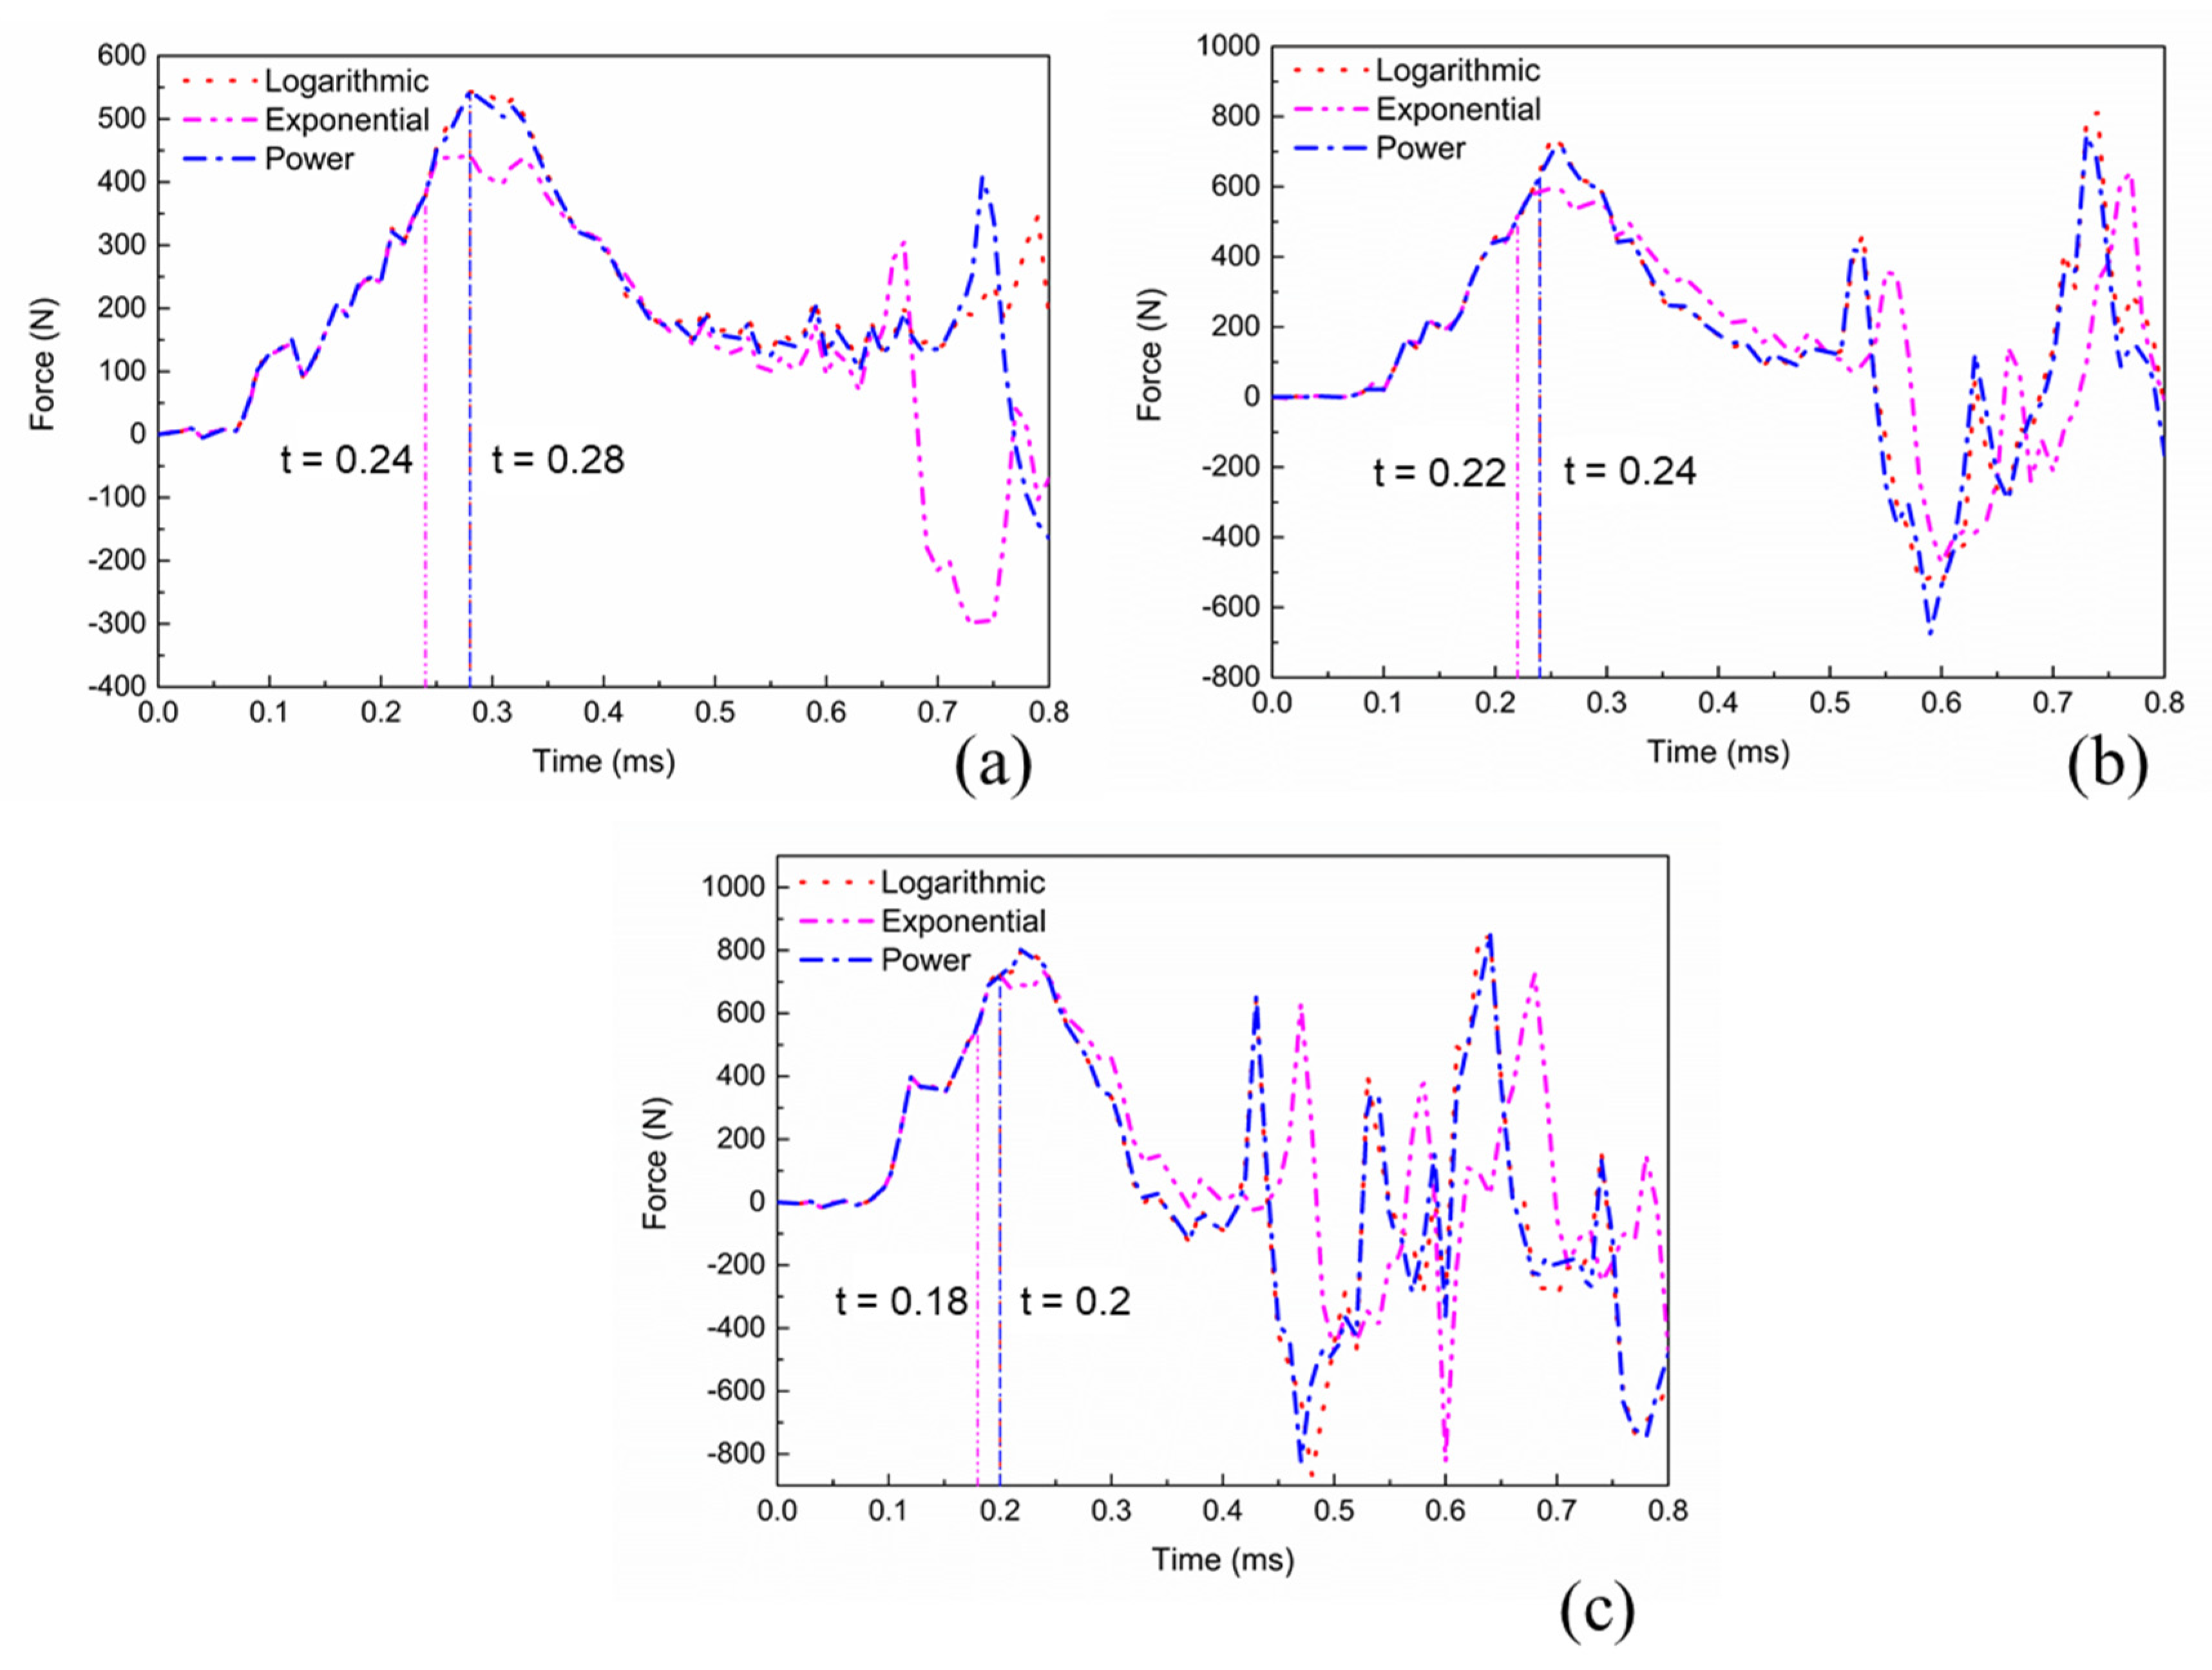
5.4. Sensitivity of Loading Force

The load forces are calculated by add the reaction forces of the two reference points of top loading block. The load force-time curves of three models are shown in Figure 7. Totally speaking, the forces of the elastic loading section between different models and conditions are the same which is easy to understand. After the delamination beginning, the trend of propagation force curves is gradually decrease because of the energy release which is similar to that of the quasi-static condition. After the laminates totally cracking, the forces become very oscillating and meaningless. Before the laminates totally cracking, the forces in 108 and 175 m/s conditions is normal and higher than 0 N. While in the 253 m/s condition, the forces are lower than 0 N at 0.35 ms in all models, which may be due to the higher loading rate.
The abscissa of vertical lines in Figure 7 means the initial time of the crack. In the typical loading force-time curves of quasi-static, the delamination begins at the peak force. While in dynamic loading condition, the time of delamination initiation is earlier than that of the peak force except the logarithmic and power models in 108 m/s condition. This may be due to the inertial effect under dynamic loading condition. Additionally, in dynamic loading conditions, the peak forces are almost 10 times than that in quasi-static loading conditions which is also a typical phenomenon under dynamic loading.
Similar to the crack length and fracture toughness, the forces of logarithmic and power models are very close, which again shows that the interface strength parameter does not affect the results much in this dynamic DCB simulation. Interestingly, the peak forces of exponential model in all conditions are lower than that of logarithmic and power models, while the propagation forces of exponential model in 175 and 253 m/s conditions is higher than that of logarithmic and power models.

6. Conclusions

This paper studies and examines the applicability of different rate-dependent cohesive models in the simulating of model I delamination of unidirectional composite. The capabilities of logarithmic, exponential and power-type rate-dependent cohesive models in predicting crack propagation length, energy release rate, cohesive zone length and reaction force are systematically discussed and compared. The main conclusions of this study are listed as follows:
  • All three models predict well the crack length profiles with average velocity errors within 20%. The exponential model shows relatively larger error compared with that of the logarithmic and power models.
  • The predicted crack propagation toughness values of all three cohesive models are much higher than that of experimental results. This indicates that physical mechanism is sacrificed by the phenomenological model in purpose of predicting accurately the cracking behavior.
  • In the presented numerical simulation results, the correlation of cohesive-zone length with crack length of DCB specimen are consistent with the results and theory predictions made in the literature [11].
  • The peak load of the exponential model is always lower than that of the logarithmic and power models, while in propagation stage, the load force of exponential model is higher than that of the logarithmic and power models especially under high loading rate.

Author Contributions

Conceptualization, C.Z. (Chao Zhang); Data curation, C.Z. (Chenxu Zhang), H.L. and J.C.; Formal analysis, C.Z. (Chenxu Zhang), H.L., J.C. and C.Z. (Chao Zhang); Supervision, C.Z. (Chao Zhang); Writing—original draft, C.Z. (Chenxu Zhang); Writing—review and editing, C.Z. (Chao Zhang). All authors have read and agreed to the published version of the manuscript.

Funding

The author(s) disclosed receipt of the following financial support for the research, authorship, and/or publication of this article: This work was supported by the National Natural Science Foundation of China (Grant No. 11772267), the 111 Project (Grant No. BP0719007), and the Shaanxi Key Research and Development Program for International Cooperation and Exchanges (Grant No. 2019KW-020).

Institutional Review Board Statement

Not applicable.

Informed Consent Statement

Not applicable.

Data Availability Statement

The data presented in this study are available on request from the corresponding author.

Conflicts of Interest

The authors declare no conflict of interest.

References

  1. Fang, G.; Ren, J.; Shi, J.; Gao, X.; Song, Y. Thermal stress analysis of environmental barrier coatings considering interfacial roughness. Coatings 2020, 10, 947. [Google Scholar] [CrossRef]
  2. Abidin, N.M.; Sultan, M.T.; Hua, L.S.; Basri, A.A.; Safri, S.N. A brief review of computational analysis and experimental models of composite materials for aerospace applications. J. Reinf. Plast. Compo. 2019, 38, 1031–1039. [Google Scholar] [CrossRef]
  3. Li, Y.; Zhong, J.; Fu, K. Low-velocity impact and compression-after-impact behaviour of flax fibre-reinforced composites. Acta. Mech. Solida. Sin. 2020, 33, 431–448. [Google Scholar] [CrossRef]
  4. Wu, Q.; Chen, X.; Fan, Z.; Jiang, Y.; Nie, D. Experimental and numerical studies of impact on filament-wound composite cylinder. Acta. Mech. Solida. Sin. 2017, 30, 540–549. [Google Scholar] [CrossRef]
  5. May, M. Measuring the rate-dependent mode I fracture toughness of composites—A review. Compos. Part. A Appl. Sci. Manuf. 2016, 81, 1–12. [Google Scholar] [CrossRef]
  6. Kazerani, T.; Zhao, G.F.; Zhao, J. Dynamic fracturing simulation of brittle material using the distinct lattice spring method with a full rate-dependent cohesive law. Rock. Mech. Rock. Eng. 2010, 43, 717–726. [Google Scholar] [CrossRef] [Green Version]
  7. Dugdale, D.S. Yielding of steel sheets containing slits. J. Mech. Phys. Solids 1960, 8, 100–104. [Google Scholar] [CrossRef]
  8. Barenblatt, G.I. The mathematical theory of equilibrium cracks in brittle fracture. Adv. Appl. Mech. 1962, 7, 55–129. [Google Scholar]
  9. Samudrala, O.; Huang, Y.; Rosakis, A.J. Subsonic and intersonic mode II crack propagation with a rate-dependent cohesive zone. J. Mech. Phys. Solids 2002, 50, 1231–1268. [Google Scholar] [CrossRef]
  10. Nguyen, T.D.; Govindjee, S.; Klein, P.A.; Gao, H. A rate-dependent cohesive continuum model for the study of crack dynamics. Comput. Methods. Appl. Mech. Eng. 2004, 193, 3239–3265. [Google Scholar] [CrossRef]
  11. May, M.; Lässig, T. Rate-dependent mode I delamination in ballistic composites—Experiment and simulation. Compos. Struct. 2017, 180, 596–605. [Google Scholar] [CrossRef]
  12. Liu, Y.; van der Meer, F.P.; Sluys, L.J. Cohesive zone and interfacial thick level set modeling of the dynamic double cantilever beam test of composite laminate. Theor. Appl. Fract. Mech. 2018, 96, 617–630. [Google Scholar] [CrossRef]
  13. Thorsson, S.I.; Waas, A.M.; Schaefer, J.; Justusson, B.; Liguore, S. Effects of elevated loading rates on mode I fracture of composite laminates using a modified wedge-insert fracture method. Compos. Sci. Technol. 2018, 156, 39–47. [Google Scholar] [CrossRef]
  14. Corigliano, A.; Ricci, M. Rate-dependent interface models: Formulation and numerical applications. Int. J. Solids Struct. 2001, 38, 547–576. [Google Scholar] [CrossRef]
  15. Musto, M.; Alfano, G. A novel rate-dependent cohesive-zone model combining damage and visco-elasticity. Comput. Struct. 2013, 118, 126–133. [Google Scholar] [CrossRef] [Green Version]
  16. Giraldo-Londoño, O.; Spring, D.W.; Paulino, G.H.; Buttlar, W.G. An efficient mixed-mode rate-dependent cohesive fracture model using sigmoidal functions. Eng. Fract. Mech. 2018, 192, 307–327. [Google Scholar] [CrossRef]
  17. Karkkainen, R.L.; Yen, C.F. Dynamic modeling for rate dependent and mode dependent cohesive interface failure analysis. J. Compos. Mater. 2012, 46, 2193–2201. [Google Scholar] [CrossRef]
  18. May, M.; Hesebeck, O.; Marzi, S.; Böhme, W.; Lienhard, J.; Kilchert, S.; Brede, M.; Hiermaier, S. Rate dependent behavior of crash-optimized adhesives—Experimental characterization, model development, and simulation. Eng. Fract. Mech. 2015, 133, 112–137. [Google Scholar] [CrossRef]
  19. May, M.; Hesebeck, O. Assessment of experimental methods for calibrating rate-dependent cohesive zone models for predicting failure in adhesively bonded metallic structures. Eng. Fail. Anal. 2015, 56, 441–453. [Google Scholar] [CrossRef]
  20. Tamrakar, S.; Ganesh, R.; Sockalingam, S.; Gillespie, J.W. Rate dependent mode II traction separation law for S-2 glass/epoxy interface using a microdroplet test method. Compos. Part. A Appl. Sci. Manuf. 2019, 124, 105487. [Google Scholar] [CrossRef]
  21. Gozluklu, B.; Coker, D. Modeling of dynamic crack propagation using rate dependent interface model. Theor. Appl. Fract. Mech. 2016, 85, 191–206. [Google Scholar] [CrossRef]
  22. Corigliano, A.; Mariani, S.; Pandolfi, A. Numerical analysis of rate-dependent dynamic composite delamination. Compos. Sci. Technol. 2006, 66, 766–775. [Google Scholar] [CrossRef]
  23. Corigliano, A.; Mariani, S.; Pandolfi, A. Numerical modeling of rate-dependent debonding processes in composites. Compos. Struct. 2003, 61, 39–50. [Google Scholar] [CrossRef]
  24. Zhou, F.; Molinari, J.F.; Shioya, T. A rate-dependent cohesive model for simulating dynamic crack propagation in brittle materials. Eng. Fract. Mech. 2005, 72, 1383–1410. [Google Scholar] [CrossRef]
  25. Makhecha, D.P.; Kapania, R.K.; Johnson, E.R.; Dillard, D.A.; Jacob, G.C.; Starbuck, J.M. Rate-dependent cohesive zone modeling of unstable crack growth in an epoxy adhesive. Mech. Adv. Mater. Struct. 2009, 16, 12–19. [Google Scholar] [CrossRef]
  26. Yang, T.; Yang, X.; Huang, R.; Liechti, K.M. Rate-dependent traction-separation relations for a silicon/epoxy interface informed by experiments and bond rupture kinetics. J. Mech. Phys. Solids 2019, 131, 1–19. [Google Scholar] [CrossRef]
  27. Lißner, M.; Alabort, E.; Cui, H.; Pellegrino, A.; Petrinic, N. On the rate dependent behaviour of epoxy adhesive joints: Experimental characterisation and modelling of mode I failure. Compos. Struct. 2018, 189, 286–303. [Google Scholar] [CrossRef] [Green Version]
  28. Marzi, S.; Hesebeck, O.; Brede, M.; Kleiner, F. A rate-dependent cohesive zone model for adhesively bonded joints loaded in mode I. J. Adhes. Sci. Technol. 2009, 23, 881–898. [Google Scholar] [CrossRef]
  29. May, M. Numerical evaluation of cohesive zone models for modeling impact induced delamination in composite materials. Compos. Struct. 2015, 133, 16–21. [Google Scholar] [CrossRef]
  30. Fernandes, R.L.; Campilho, R.D.S.G. Numerical evaluation of dissimilar cohesive models to predict the behavior of Double-Cantilever Beam specimens. Procedia. Struct. Integr. 2016, 1, 42–49. [Google Scholar] [CrossRef]
  31. Salih, S.; Davey, K.; Zou, Z. Rate-dependent elastic and elasto-plastic cohesive zone models for dynamic crack propagation. Int. J. Solids Struct. 2016, 90, 95–115. [Google Scholar] [CrossRef]
  32. Liu, H.; Meng, X.; Zhang, H.; Nie, H.; Li, Y. The dynamic crack propagation behavior of mode I interlaminar crack in unidirectional carbon/epoxy composites. Eng. Fract. Mech. 2019, 215, 65–82. [Google Scholar] [CrossRef]
  33. Benzeggagh, M.L.; Kenane, M. Measurement of mixed-mode delamination fracture toughness of unidirectional glass/epoxy composites with mixed-mode bending apparatus. Compos. Sci. Technol. 1996, 56, 439–449. [Google Scholar] [CrossRef]
  34. Turon, A.; Camanho, P.P.; Costa, J.; Renart, J. Accurate simulation of delamination growth under mixed-mode loading using cohesive elements: Definition of interlaminar strengths and elastic stiffness. Compos. Struct. 2010, 92, 1857–1864. [Google Scholar] [CrossRef]
  35. Low, K.O.; Teng, S.M.; Johar, M.; Israr, H.A.; Wong, K.J. Mode I delamination behaviour of carbon/epoxy composite at different displacement rates. Compos. Part. B Eng. 2019, 176, 107293. [Google Scholar] [CrossRef]
Figure 1. The electromagnetic Hopkinson bar system used to conduct dynamic double cantilever beam (DCB) test (a) schematic diagram (b) testing bench.
Coatings 11 00191 g001
Figure 2. (a) Mixed-mode cohesive model and traction-separation law of pure mode I or II rate-dependent cohesive model: (b) logarithmic model (c) exponential model (d) power model.
Coatings 11 00191 g002
Figure 3. Finite element model of DCB test.
Coatings 11 00191 g003
Figure 4. Crack propagation length curves and propagation of cohesive element contours of average crack tip speed of (a) 108, (b) 175, and (c) 253 m/s.
Coatings 11 00191 g004
Figure 5. Energy release rate-time curves of crack tip speed of (a) 108, (b) 175, and (c) 253 m/s.
Coatings 11 00191 g005
Figure 6. The relationship between cohesive zone length and time of (a) logarithmic model, (b) exponential model and (c) power model.
Coatings 11 00191 g006
Figure 7. Force-time curves of crack tip speed of (a) 108, (b) 175, (c) 253 m/s.
Coatings 11 00191 g007
Table 1. Material parameters of carbon laminates [32].
Densityρ = 1522 kg/m3
Young’s modulusE11 = 127 GPa, E22 = E33 = 8.4 GPa
G12 = G13 = 3.7 GPa, G23 = 3.0 GPa
Poisson’s ratioν12 = ν13 = 0.3, ν23 = 0.4
Table 2. Cohesive interface element properties of different models.
Mode I and mode II stiffness E5 × 105 N/mm3
Quasi-static mode I and mode II strength σ i , 0 0 80 MPa
Quasi-static mode I fracture toughness G Ic , 0 0.43 mJ/mm2 [32]
Quasi-static mode II fracture toughness G IIc , 0 1.25 mJ/mm2 [32]
Mixed-mode exponent η2.284 [12]
Logarithmic modelReference separation opening rate δ ˙ il ref 20 mm/s [12]
Rate-dependent coefficient c i 0.22 [12]
Rate-dependent coefficient m i 0.5
Exponential modelReference separation opening rate δ ˙ ie ref 4500 mm/s
Rate-dependent coefficient k10
Power modelReference separation opening rate δ ˙ ip ref 20 mm/s
Rate-dependent coefficient n0.2
Table 3. Average speed errors between experiment and different models.
Experimental (m/s)Logarithmic ModelExponential ModelPower Model
Velocity (m/s)ErrorVelocity (m/s)ErrorVelocity (m/s)Error
1081112.78%12919.44%1178.33%
17520818.86%169−3.43%20718.29%
2532769.09%211−16.60%2727.51%
Publisher’s Note: MDPI stays neutral with regard to jurisdictional claims in published maps and institutional affiliations.

