Down-Conversion Polymer Composite Coatings with Multipeak Absorption and Emission

Abstract
:1. Introduction
2. Experimental
2.1. Materials and Synthesis of Sr2CaMoO6:Sm,Na and YVO4:Bi,Eu
2.2. Preparations of the Polymeric Luminescent Coatings
2.3. Characterizations and Calculation
3. Results and Discussion
3.1. Sr2CaMoO6:Sm,Na Phosphors
3.1.1. Effect of Doping Amounts of Sm3+ and Na+
3.1.2. Band Structure and Density of States
3.2. YVO4:Bi,Eu
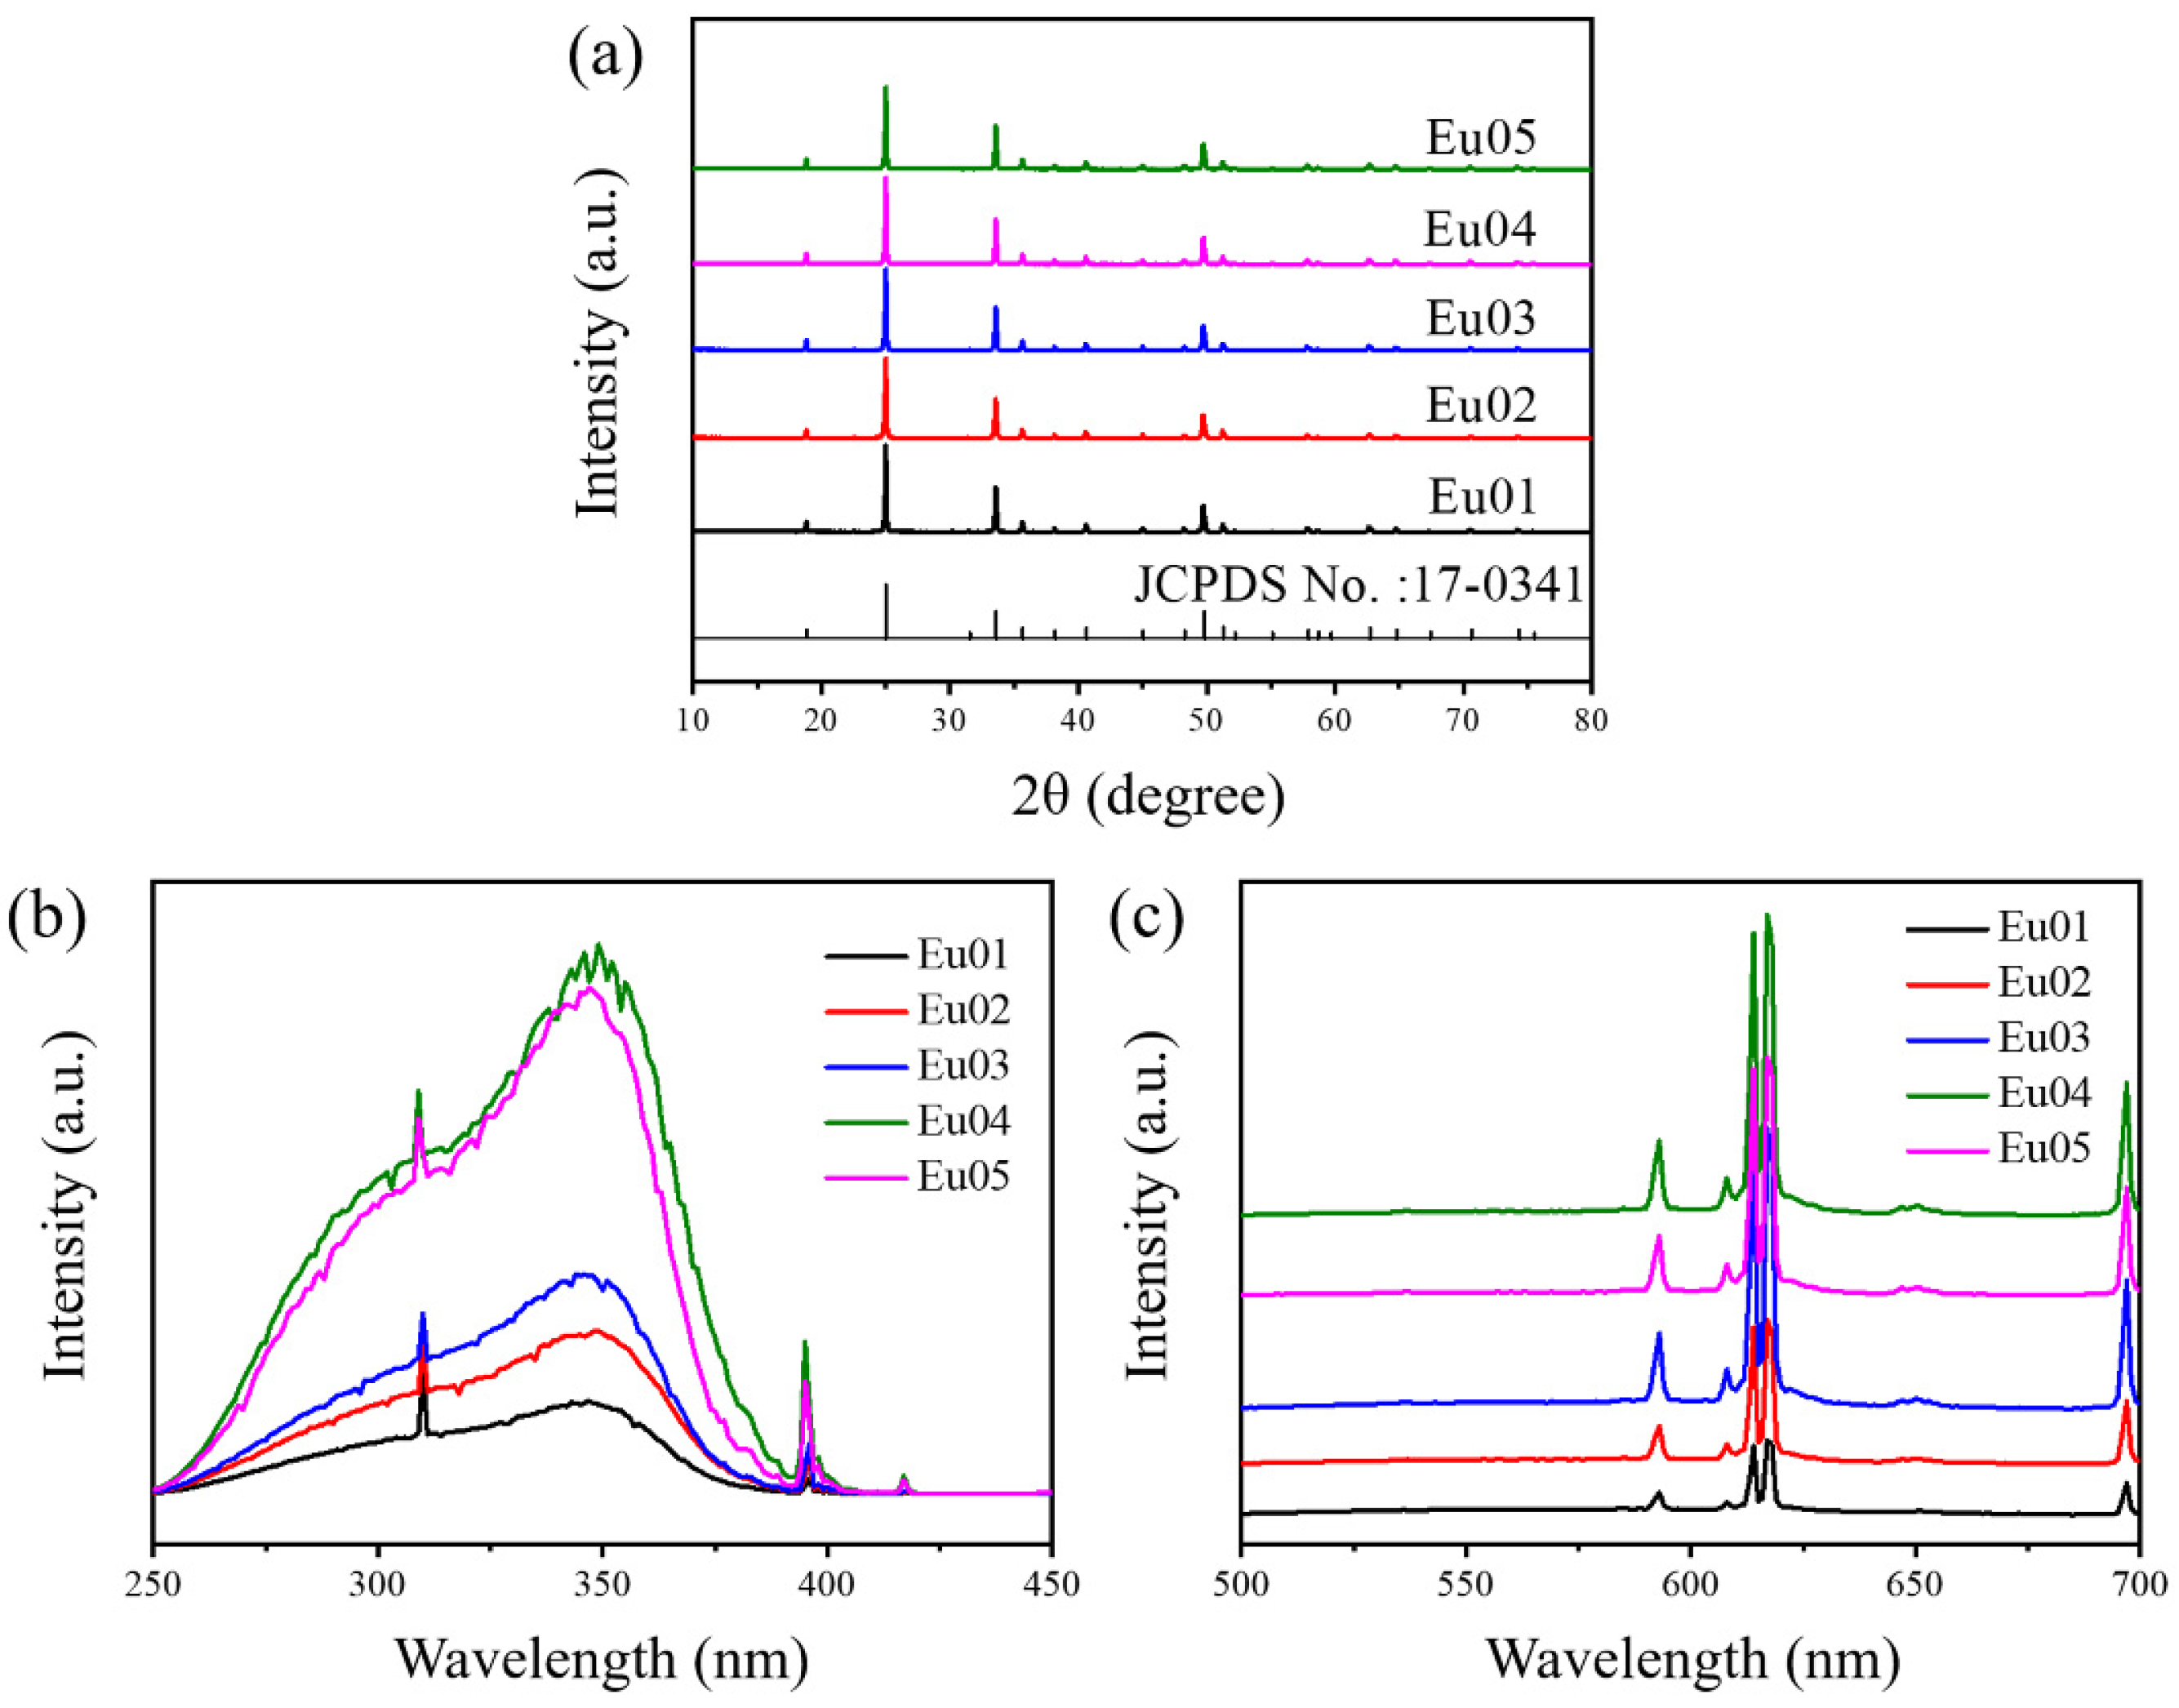
3.2.1. Effect of Amounts of Eu3+
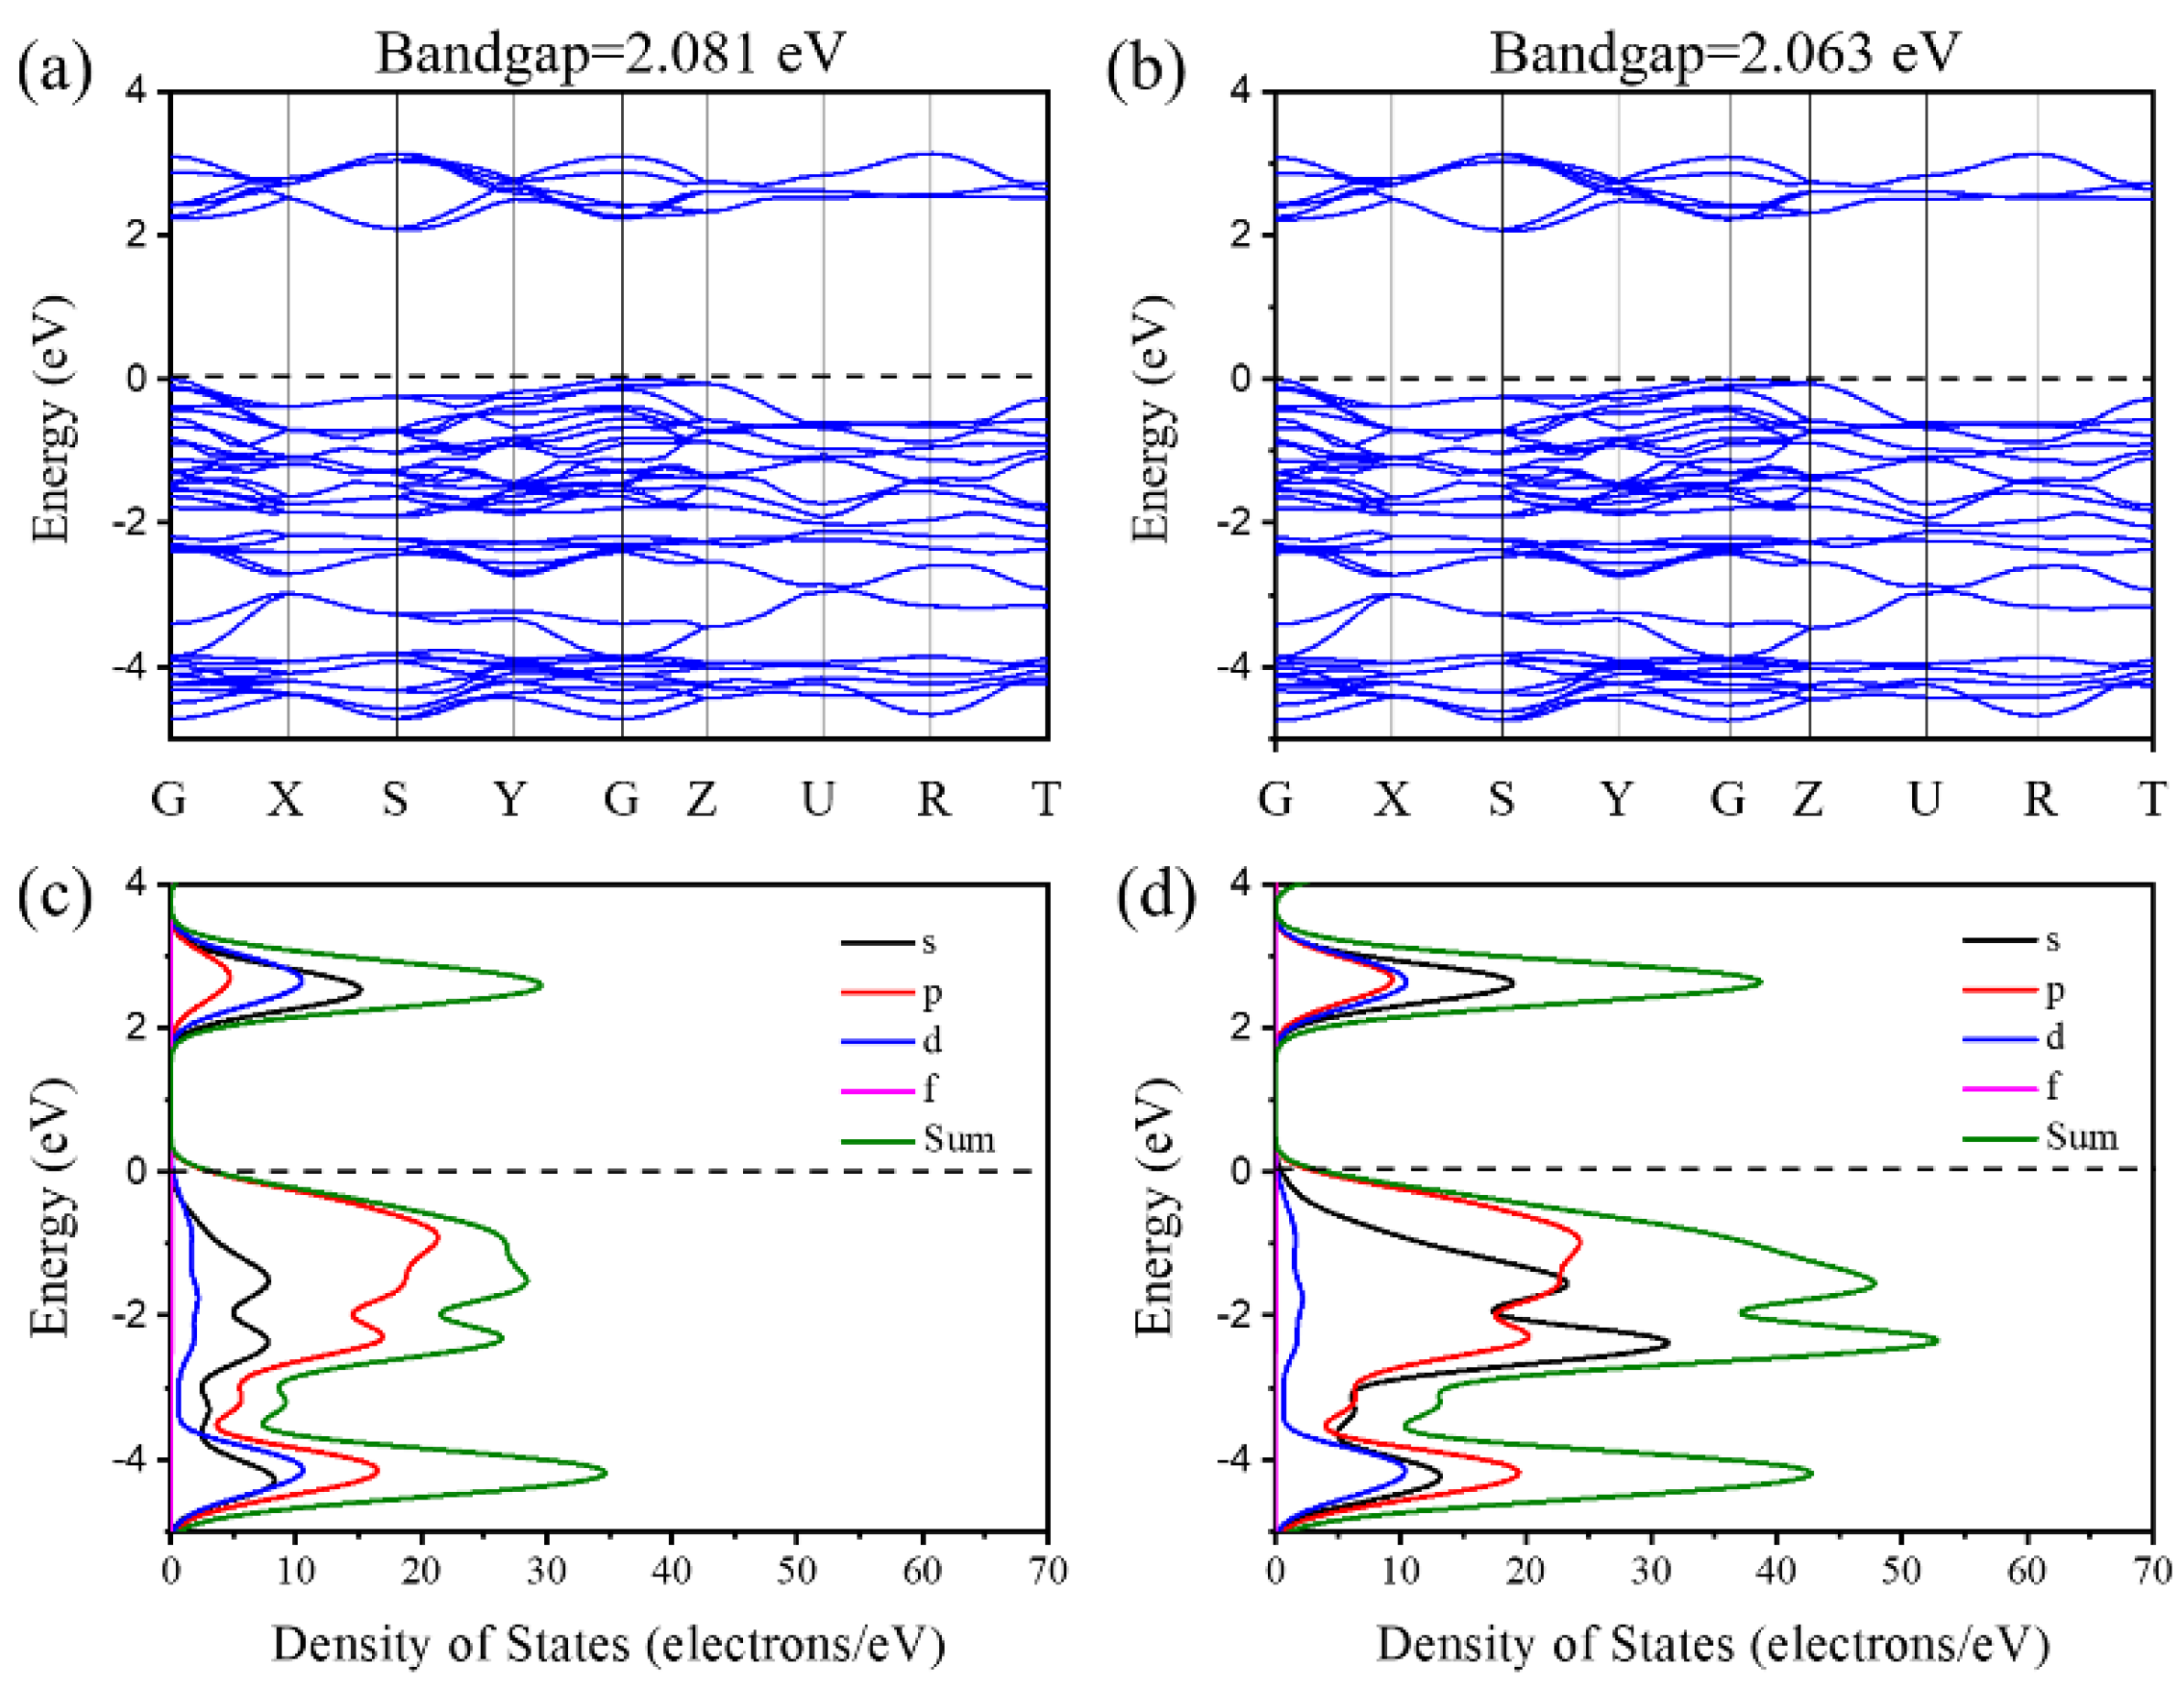
3.2.2. Band Structure and Density of States
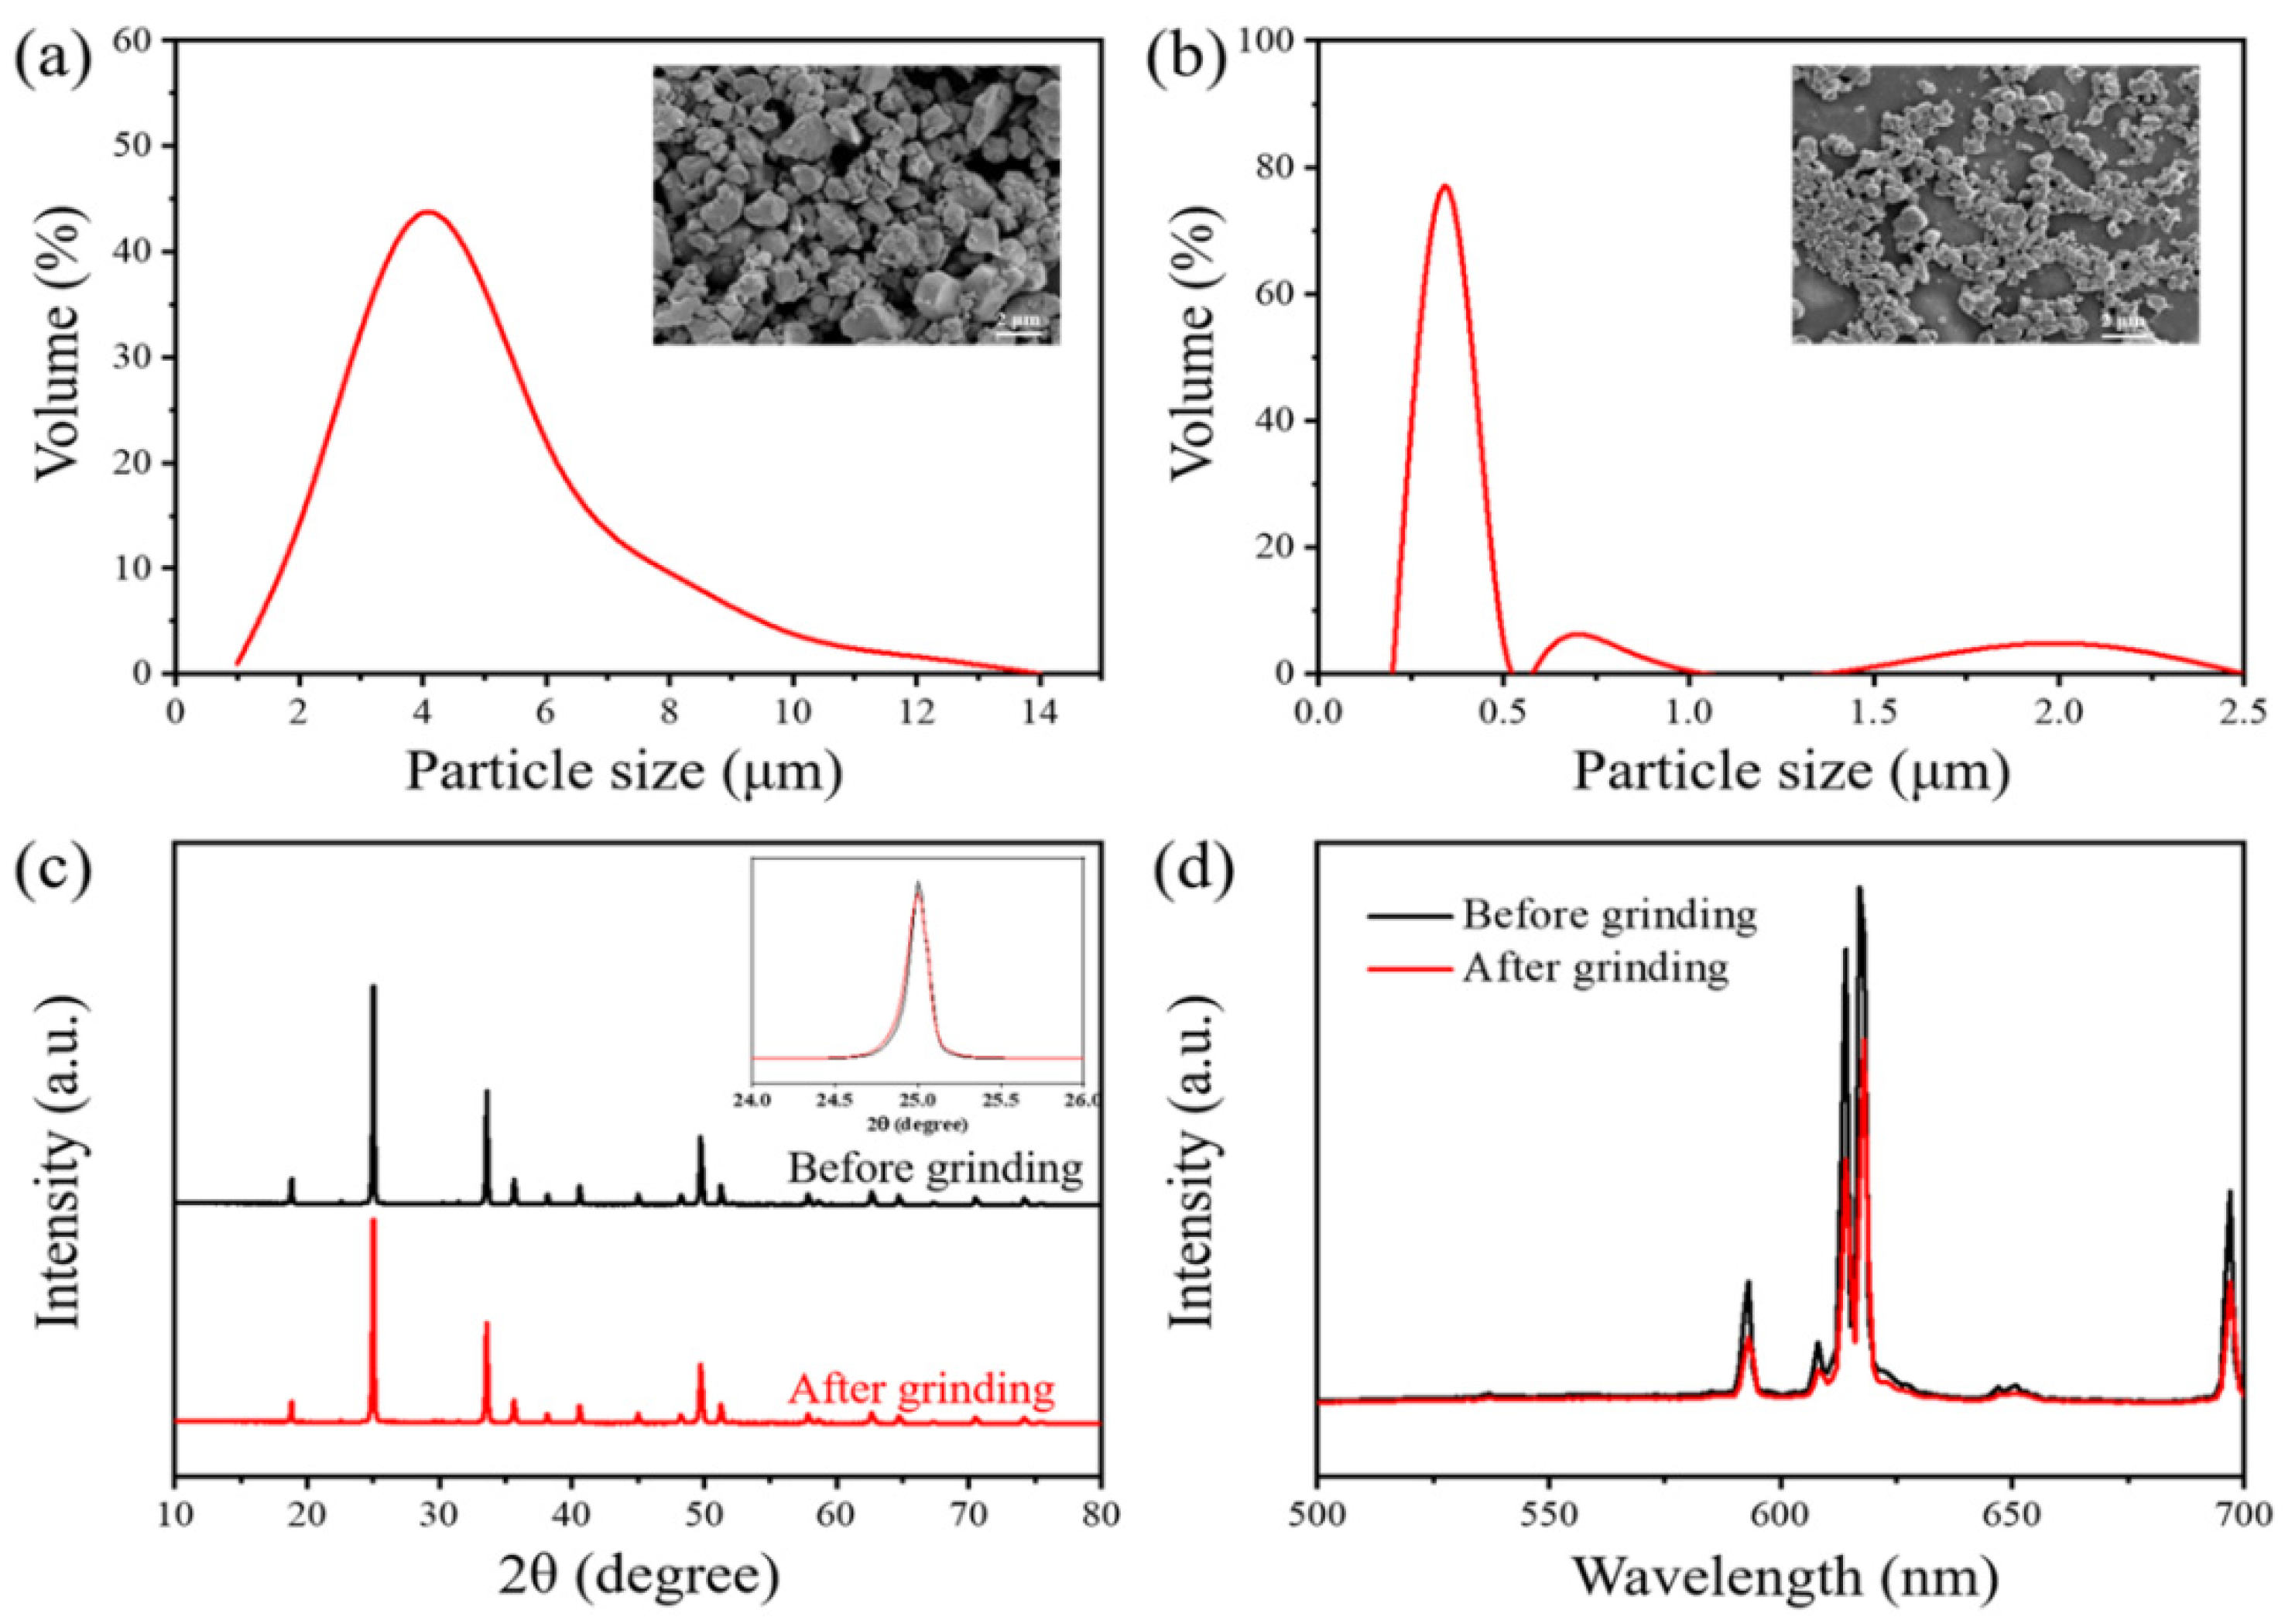
3.3. Influence of Particle Size
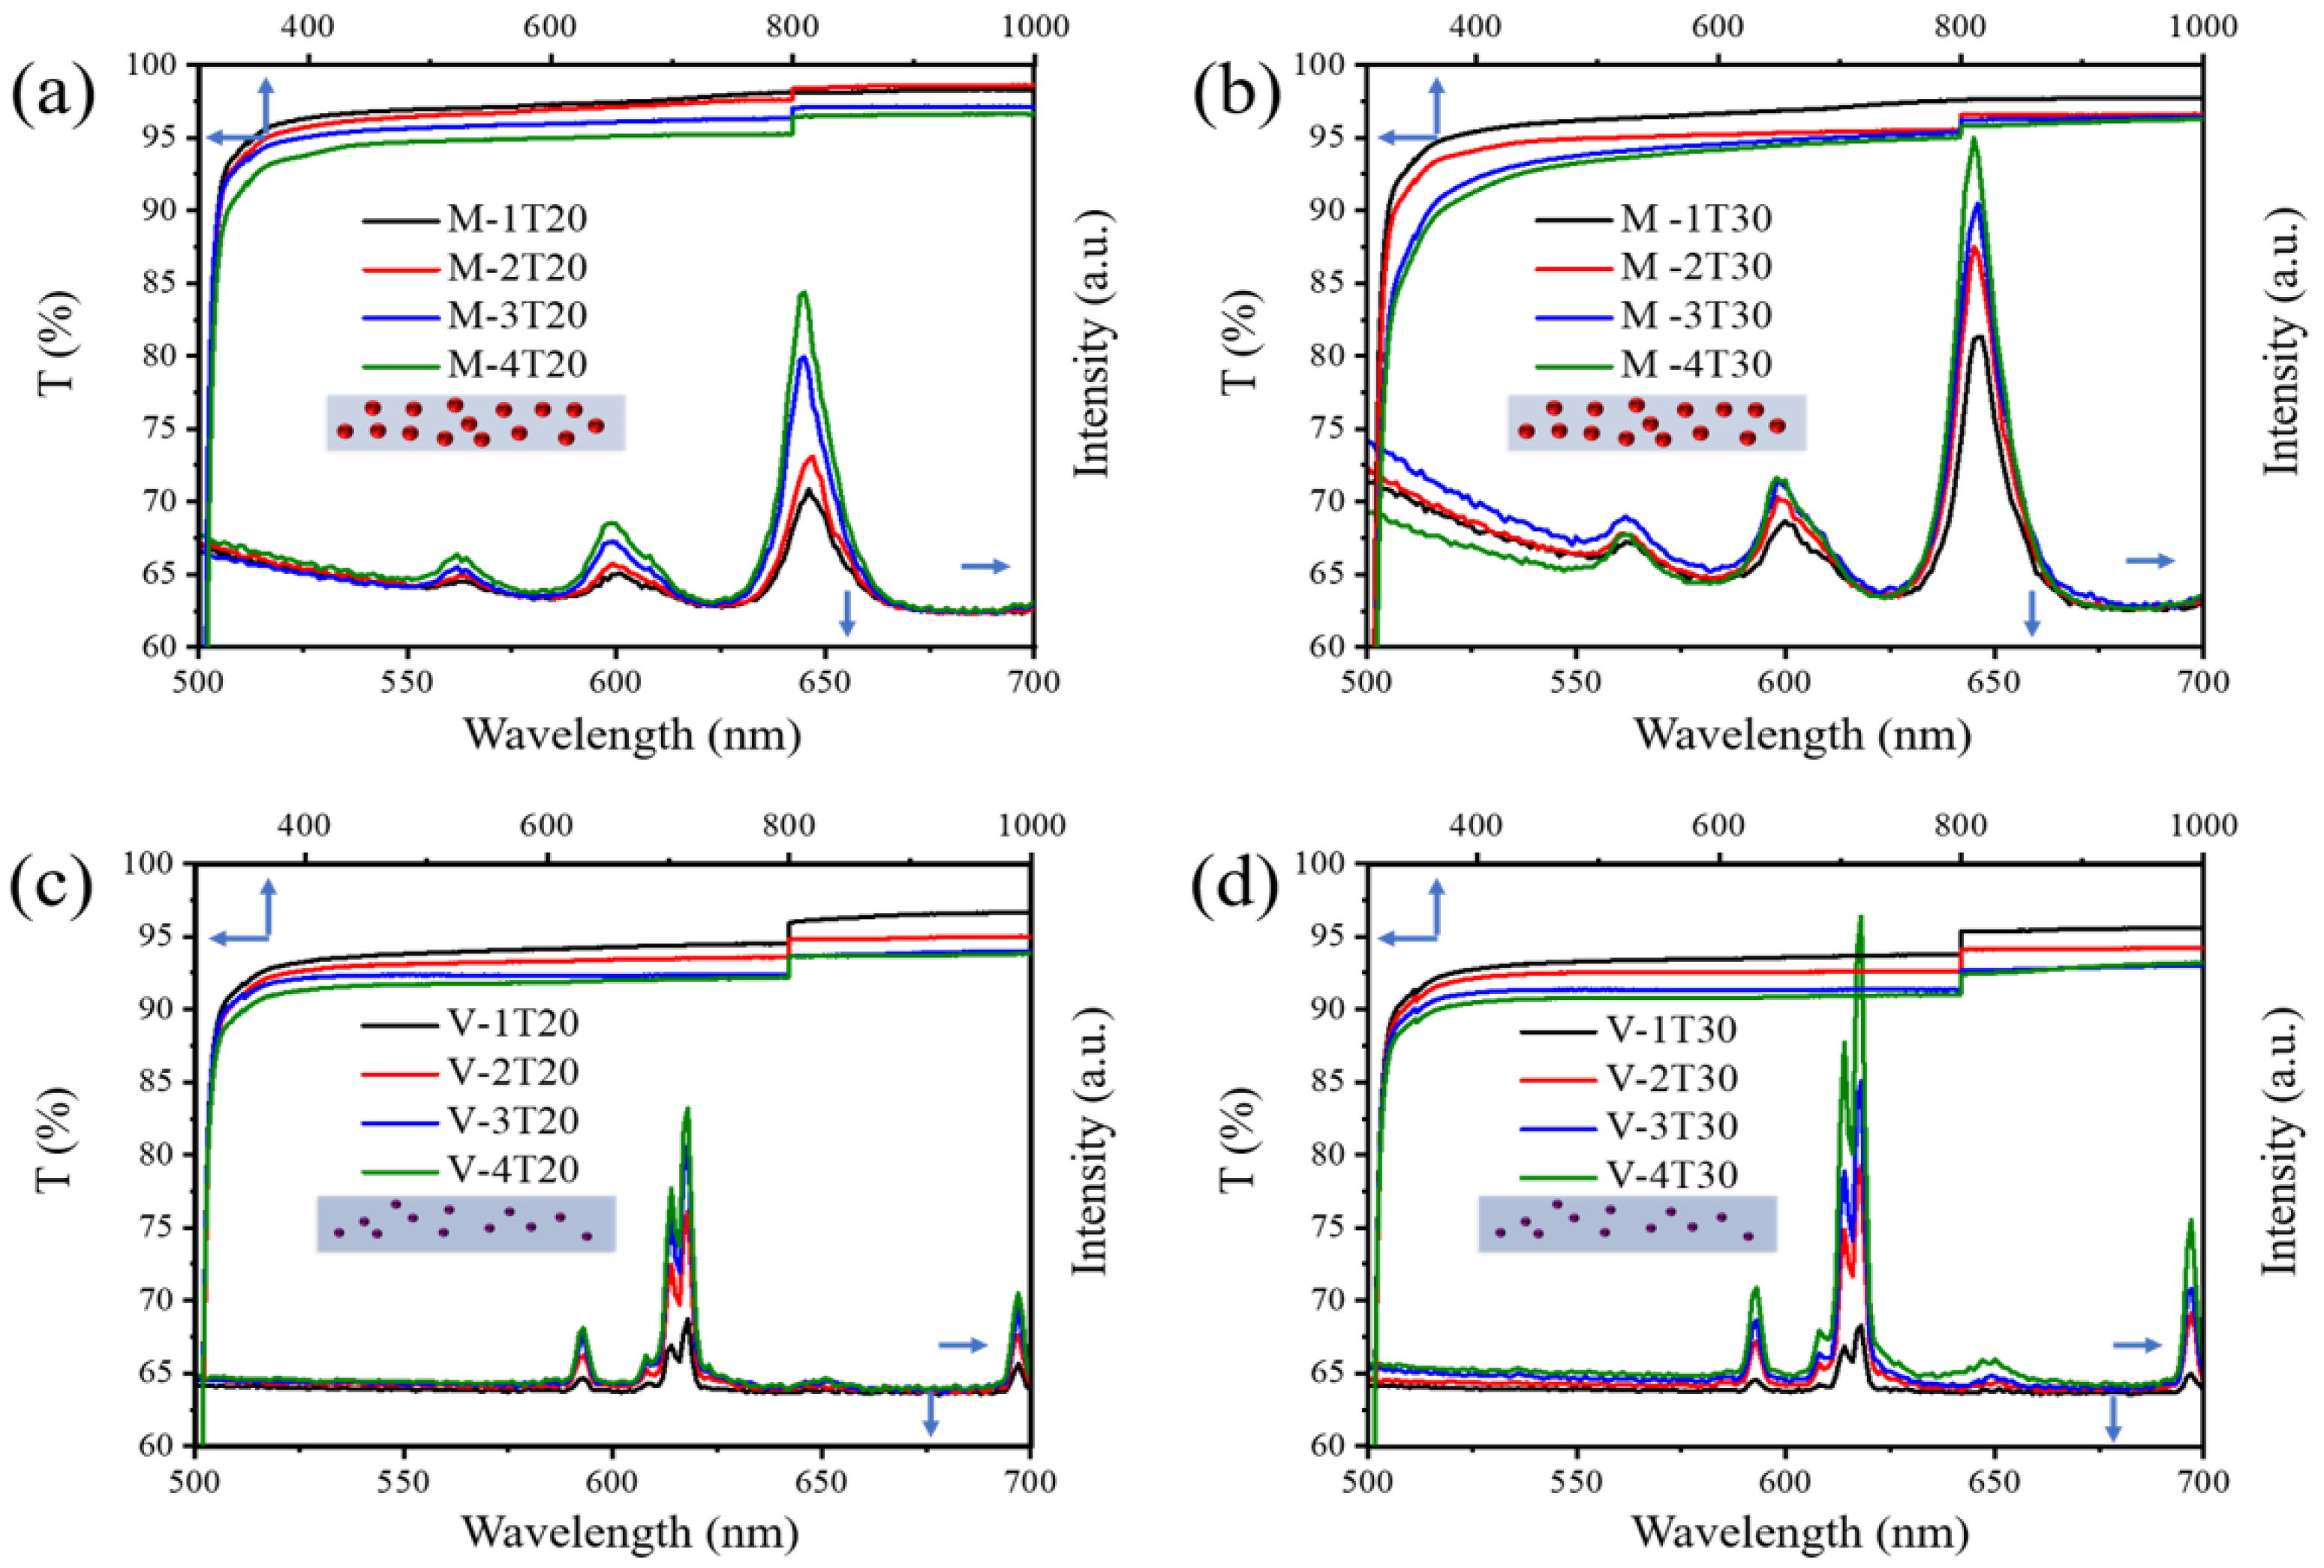
3.4. Preparations and Properties of Luminescent Polymeric Coatings
4. Conclusions
Author Contributions
Funding
Institutional Review Board Statement
Informed Consent Statement
Data Availability Statement
Acknowledgments
Conflicts of Interest
References
- Huang, X.; Han, S.; Huang, W.; Liu, X. Enhancing solar cell efficiency: The search for luminescent materials as spectral converters. Chem. Soc. Rev. 2013, 42, 173–201. [Google Scholar] [CrossRef] [PubMed] [Green Version]
- Morassaei, M.S.; Salehabadi, A.; Akbari, A.; Tavassoli, S.H.; Salavati-Niasari, M. Enhanced dye sensitized solar cells efficiency by utilization of an external layer of CaCe2(MoO4)4:Er3+/Yb3+ nanoparticles. J. Alloy Compd. 2018, 769, 732–739. [Google Scholar] [CrossRef]
- Xiao, L.; Lai, T.; Liu, X.; Liu, F.; Russell, T.P.; Liu, Y.; Huang, F.; Peng, X.; Cao, Y. A low-bandgap dimeric porphyrin molecule for 10% efficiency solar cells with small photon energy loss. J. Mater. Chem. A 2018, 6, 18469–18478. [Google Scholar] [CrossRef]
- De Vos, A.; Szymanska, A.; Badescu, V. Modelling of solar cells with down-conversion of high energy photons, anti-reflection coatings and light trapping. Energy Convers. Manag. 2009, 50, 328–336. [Google Scholar] [CrossRef]
- Richards, B.S. Luminescent layers for enhanced silicon solar cell performance: Down-conversion. Sol. Energy Mater. Sol. Cells 2006, 90, 1189–1207. [Google Scholar] [CrossRef]
- Gunji, R.; Santos, E.A.; Bordon, C.; Garcia, J.; Gómez-Malagón, L.; Kassab, L. Germanate glass layer containing Eu3+ ions and gold nanoparticles for enhanced silicon solar cell performance. J. Lumin. 2020, 226, 117497. [Google Scholar] [CrossRef]
- Zhang, A.; Jia, M.; Sun, Z.; Liu, G.; Fu, Z.; Sheng, T.; Li, P.; Lin, F. High concentration Eu3+-doped NaYb(MoO4)(2) multifunctional material: Thermometer and plant growth lamp matching phytochrome P-R. J. Alloy Compd. 2019, 782, 203–208. [Google Scholar] [CrossRef]
- Wu, X.; Meng, F.; Zhang, Z.; Yu, Y.; Liu, X.; Meng, J. Broadband down-conversion for silicon solar cell by ZnSe/phosphor heterostructure. Opt. Express 2014, 22, A735–A741. [Google Scholar] [CrossRef] [PubMed]
- Wang, L.; Zhang, H.; Zhou, X.; Liu, Y.; Lei, B. A dual-emitting core-shell carbon dot-silica-phosphor composite for LED plant grow light. RSC Adv. 2017, 7, 16662–16667. [Google Scholar] [CrossRef] [Green Version]
- Lin, J.; Wang, R.-Z.; Li, R.; Yan, H. A high efficient antireflective down-conversion Y2O3:Bi3+, Yb3+ thin films. Opt. Quantum Electron. 2017, 49, 7411. [Google Scholar] [CrossRef]
- Wang, S.; Yao, H.; Wu, D.; Lin, Z.; Ling, Q. Highly efficient white emission from UV-driven hybrid LEDs through down-conversion of arylmaleimide-based branched polymers. J. Lumin. 2021, 230, 117742. [Google Scholar] [CrossRef]
- Bierman, D.M.; Lenert, A.; Chan, W.R.; Bhatia, B.; Celanović, I.; Soljačić, M.; Wang, E.N. Enhanced photovoltaic energy conversion using thermally based spectral shaping. Nat. Energy 2016, 1, 16068. [Google Scholar] [CrossRef]
- Kumar, V.; Ntwaeaborwa, O.M.; Soga, T.; Dutta, V.; Swart, H.C. Rare earth doped zinc oxide nanophosphor powder: A future material for solid state lighting and solar cells. ACS Photonics 2017, 4, 2613–2637. [Google Scholar] [CrossRef]
- Day, J.; Senthilarasu, S.; Mallick, T.K. Improving spectral modification for applications in solar cells: A review. Renew. Energy 2019, 132, 186–205. [Google Scholar] [CrossRef]
- Rodriguez Burbano, D.C.; Sharma, S.K.; Dorenbos, P.; Viana, B.; Capobianco, J.A. Persistent and photostimulated red emission in CaS:Eu2+,Dy3+. Nanophosphors Adv. Opt. Mater. 2015, 3, 551–557. [Google Scholar] [CrossRef]
- Meng, L.; Wu, X.-G.; Ma, S.; Shi, L.; Zhang, M.; Wang, L.; Chen, Y.; Chen, Q.; Zhong, H. Improving the efficiency of silicon solar cells using in situ fabricated perovskite quantum dots as luminescence downshifting materials. Nanophotonics 2019, 9, 93–100. [Google Scholar] [CrossRef]
- Zhao, L.; Shen, X.; Liu, Q.; Wu, W.; Li, H.; Chen, Z.; Li, Y. Core-shell structured layered lanthanide-organic complexes with stilbazolium-type dye encapsulation for multifunctional performances. Chem. Asian J. 2019, 15, 136–147. [Google Scholar] [CrossRef] [PubMed] [Green Version]
- Zhao, L.; Xu, P.; Fan, F.; Yu, J.; Shang, Y.; Li, Y.; Huang, L.; Yu, R. Synthesis and photoluminescence properties of Sm3+ and Dy3+ ions activated double perovskite Sr2MgTeO6 phosphors. J. Lumin. 2019, 207, 520–525. [Google Scholar] [CrossRef]
- Bu, F.; Shen, W.; Zhang, X.; Wang, Y.; Belfiore, L.A.; Tang, J. Hybrid ZnO electron transport layer by down conversion Complexes for dual improvements of photovoltaic and stable performances in polymer solar cells. Nanomaterials 2020, 10, 80. [Google Scholar] [CrossRef] [PubMed] [Green Version]
- Cardoso, M.; Correia, S.; Frias, A.; Gonçalves, H.; Pereira, R.; Nunes, S.; Armand, M.; André, P.; Bermudez, V.D.Z.; Ferreira, R. Solar spectral conversion based on plastic films of lanthanide-doped ionosilicas for photovoltaics: Down-shifting layers and luminescent solar concentrators. J. Rare Earths 2020, 38, 531–538. [Google Scholar] [CrossRef]
- Rahman, N.U.; Khan, W.U.; Li, W.; Khan, S.; Khan, J.; Zheng, S.; Su, T.; Zhao, J.; Aldred, M.P.; Chi, Z. Simultaneous enhancement in performance and UV-light stability of organic–inorganic perovskite solar cells using a samarium-based down conversion material. J. Mater. Chem. A 2018, 7, 322–329. [Google Scholar] [CrossRef]
- Schmiechen, S.; Strobel, P.; Hecht, C.; Reith, T.; Siegert, M.; Schmidt, P.J.; Huppertz, P.; Wiechert, D.; Schnick, W. Nitridomagnesosilicate Ba[Mg3SiN4]:Eu2+ and structure—Property relations of similar narrow-band red nitride phosphors. Chem. Mater. 2015, 27, 1780–1785. [Google Scholar] [CrossRef]
- Watanabe, H.; Yamane, H.; Kijima, N. Crystal structure and luminescence of Sr0.99Eu0.01AlSiN3. J. Solid State Chem. 2008, 181, 1848–1852. [Google Scholar] [CrossRef]
- Park, W.B.; Singh, S.P.; Yoon, C.; Sohn, K.-S. Combinatorial chemistry of oxynitride phosphors and discovery of a novel phosphor for use in light emitting diodes, Ca1.5Ba0.5Si5N6O3:Eu2+. J. Mater. Chem. C 2013, 1, 1832–1839. [Google Scholar] [CrossRef]
- Park, W.B.; Jeong, Y.S.; Singh, S.P.; Sohn, K.-S. A yellow-emitting oxynitride phosphor: Ce4−xCaxSi12O3+xN18−x:Eu2+. ECS J. Solid State Sci. Technol. 2012, 2, R3100–R3106. [Google Scholar] [CrossRef]
- Ding, D.; Gao, J.; Zhang, S.; Duo, L. The photoluminescence properties of Pr3+-Yb3+ co-doped gallo-germanate glasses and glass ceramics as energy converter. J. Lumin. 2020, 226, 117512. [Google Scholar] [CrossRef]
- Dai, W.B.; Lei, Y.F.; Zhou, J.; Xu, M.; Chu, L.; Li, L.; Zhao, P.; Zhang, Z.H. Near-infrared quantum-cutting and long-persistent phosphor Ca3Ga2Ge3O12: Pr3+, Yb3+ for application in in vivo bioimaging and dye-sensitized solar cells. J. Alloy Compd. 2017, 726, 230–239. [Google Scholar]
- de Luna, M.S.; Filippone, G. Effects of nanoparticles on the morphology of immiscible polymer blends—Challenges and opportunities. Eur. Polym. J. 2016, 79, 198–218. [Google Scholar] [CrossRef]
- González-Pérez, S.; Sanchiz, J.; González-Díaz, B.; Holinski, S.; Borchert, D.; Hernández-Rodríguez, C.; Guerrero-Lemus, R. Luminescent polymeric film containing an Eu(III) complex acting as UV protector and down-converter for Si-based solar cells and modules. Surf. Coat. Technol. 2015, 271, 106–111. [Google Scholar] [CrossRef]
- Fix, T.; Nonat, A.; Imbert, D.; Di Pietro, S.; Mazzanti, M.; Slaoui, A.; Charbonnière, L.J. Enhancement of silicon solar cells by downshifting with Eu and Tb coordination complexes. Prog. Photovolt. Res. Appl. 2016, 24, 1251–1260. [Google Scholar] [CrossRef]
- Ho, W.-J.; Shen, Y.-T.; Liu, J.-J.; You, B.-J.; Ho, C.-H. Enhancing photovoltaic performance using broadband luminescent down-shifting by combining multiple species of Eu-doped silicate phosphors. Nanomaterials 2017, 7, 340. [Google Scholar] [CrossRef]
- Song, H.; Wang, J.; Chen, B.; Peng, H.; Lu, S. Size-dependent electronic transition rates in cubic nanocrystalline europium doped yttria. Chem. Phys. Lett. 2003, 376, 1–5. [Google Scholar] [CrossRef]
- Chen, H.-Y.; Chang, C.-W. Solvatochromism study of DCM encapsulated in ZIF-90 and the potential application of DCM/ZIF-90 as the fluorescence down-conversion layer for an LED chip. J. Phys. Chem. C 2020, 124, 8854–8860. [Google Scholar] [CrossRef]
- Xu, W.; Zhu, Y.; Chen, X.; Wang, J.; Tao, L.; Xu, S.; Liu, T.; Song, H. A novel strategy for improving upconversion luminescence of NaYF4:Yb, Er nanocrystals by coupling with hybrids of silver plasmon nanostructures and poly(methyl methacrylate) photonic crystals. Nano Res. 2013, 6, 795–807. [Google Scholar] [CrossRef]
- Zhang, X.; Li, B.; Jiang, M.; Zhang, L.; Ma, H. Core–spacer–shell structured NaGdF4:Yb3+/Er3+@NaGdF4@Ag nanoparticles for plasmon-enhanced upconversion luminescence. RSC Adv. 2016, 6, 36528–36533. [Google Scholar] [CrossRef]
- Podhorodecki, A.; Banski, M.; Noculak, A.; Sojka, B.; Pawlik, G.; Misiewicz, J. On the nature of carrier relaxation and ion-ion interactions in ultrasmall beta-NaYF4:Eu3+ nanocrystals—Effect of the surface. Nanoscale 2013, 5, 429–436. [Google Scholar] [CrossRef]
- Maurya, A.; Bahadur, A.; Rai, S. Enhanced red emission from Eu3+, A+ (Li+, Na+, K+) co-doped CaZrO3 phosphor. J. Lumin. 2018, 203, 714–722. [Google Scholar] [CrossRef]
- Liu, S.; Liang, Y.; Zhu, Y.; Li, H.; Chen, J.; Wang, M.; Li, W. Enhancing emission intensity and thermal stability by charge compensation in Sr2 Mg3P4O15:Eu3+. J. Am. Ceram. Soc. 2017, 101, 1655–1664. [Google Scholar] [CrossRef]
- Puchalska, M. High enhancement of Eu3+ luminescence in SrAl4 O7 phosphor by means of charge compensation with Na+ ions. Opt. Mater. 2017, 72, 452–458. [Google Scholar] [CrossRef]
- Zhang, Z.; Han, C.-L.; Shi, W.-W.; Kang, Y.-Y.; Wang, Y.-S.; Zhang, W.-G.; Wang, D.-J. Enhanced novel white emission in Ca3(PO4)2:Dy3+ single-phase full-color phosphor by charge compensation. J. Mater. Sci. Mater. Electron. 2014, 26, 1923–1931. [Google Scholar] [CrossRef]
- Ding, X.; Zhu, G.; Geng, W.; Wang, Q.; Wang, Y. Rare-earth-free high-efficiency narrow-band red-emitting Mg3Ga2GeO8:Mn4+ phosphor excited by near-UV light for white-light-emitting diodes. Inorg. Chem. 2016, 55, 154–162. [Google Scholar] [CrossRef]
- Huang, H.; Li, H.; Wang, Z.; Wang, P.; Zheng, Z.; Liu, Y.; Dai, Y.; Li, Y.; Huang, B. Efficient near-infrared photocatalysts based on NaYF4:Yb3+,Tm3+@NaYF4:Yb3+,Nd3+@TiO2 core@shell nanoparticles. Chem. Eng. J. 2019, 361, 1089–1097. [Google Scholar] [CrossRef]
- Zhang, L.; Sun, B.; Shao, C.; Zhen, F.; Wei, S.; Bu, W.; Yao, Q.; Jiang, Z.; Chen, H. Preparation, band-structure and luminescence of double perovskite Ba2MgMoO6:Eu3+ orange-red phosphor for white LEDs. Ceram. Int. 2018, 44, 17305–17312. [Google Scholar] [CrossRef]
- Wang, L.; Noh, H.M.; Moon, B.K.; Park, S.H.; Kim, K.H.; Shi, J.; Jeong, J.H. Dual-mode luminescence with broad near UV and blue excitation band from Sr2CaMoO6:Sm3+ phosphor for white LEDs. J. Phys. Chem. C 2015, 119, 15517–15525. [Google Scholar] [CrossRef]
- Li, Q.; Dong, J.; Wang, Q.; Xue, Y.; Tang, H.; Xu, X.; Xu, J. Crystal growth, spectroscopic characteristics, and Judd-Ofelt analysis of Tm:GdScO3. Opt. Mater. 2020, 109, 110298. [Google Scholar] [CrossRef]
- Liu, J.; Wang, K.; Zheng, W.; Huang, W.; Li, C.-H.; You, X.-Z. Improving spectral response of monocrystalline silicon photovoltaic modules using high efficient luminescent down-shifting Eu3+ complexes. Prog. Photovolt. Res. Appl. 2012, 21, 668–675. [Google Scholar] [CrossRef]
- Wang, L.; Noh, H.M.; Moon, B.K.; Choi, B.C.; Jeong, J.H.; Shi, J. Luminescent properties and energy transfer of Sm3+ doped Sr2CaMo1−xWxO6 as a potential phosphor for white LEDs. J. Alloy Compd. 2016, 663, 808–817. [Google Scholar] [CrossRef]


| Name | SrCO3 | CaCO3 | MoO3 | Sm2O3 | Na2CO3 |
|---|---|---|---|---|---|
| Sm20Na00 | 1.980 | 1 | 1 | 0.0100 | 0.0000 |
| Sm10Na10 | 1.980 | 1 | 1 | 0.0050 | 0.0050 |
| Sm15Na15 | 1.970 | 1 | 1 | 0.0075 | 0.0075 |
| Sm20Na20 | 1.960 | 1 | 1 | 0.0100 | 0.0100 |
| Sm25Na25 | 1.950 | 1 | 1 | 0.0125 | 0.0125 |
| Sm30Na30 | 1.940 | 1 | 1 | 0.0150 | 0.0150 |
| Sm25Na00 | 1.975 | 1 | 1 | 0.0125 | 0.0000 |
| Sm25Na15 | 1.960 | 1 | 1 | 0.0125 | 0.0075 |
| Sm25Na20 | 1.955 | 1 | 1 | 0.0125 | 0.0100 |
| Sm25Na30 | 1.945 | 1 | 1 | 0.0125 | 0.0150 |
| Sm25Na35 | 1.940 | 1 | 1 | 0.0125 | 0.0175 |
| Name | Y2O3 | NH4VO3 | Bi2O3 | Eu2O3 |
|---|---|---|---|---|
| Eu01 | 0.475 | 1 | 0.02 | 0.005 |
| Eu02 | 0.470 | 1 | 0.02 | 0.010 |
| Eu03 | 0.465 | 1 | 0.02 | 0.015 |
| Eu04 | 0.460 | 1 | 0.02 | 0.020 |
| Eu05 | 0.455 | 1 | 0.02 | 0.025 |
| Name a | Sm25Na25 Weight Ratio | Thickness b (μm) | Name a | Eu04 Weight Ratio | Thickness b (μm) |
|---|---|---|---|---|---|
| M-1T20 | 1‰ | 20 | V-1T20 | 1‰ | 20 |
| M-2T20 | 2‰ | 20 | V-2T20 | 2‰ | 20 |
| M-3T20 | 3‰ | 20 | V-3T20 | 3‰ | 20 |
| M-4T20 | 4‰ | 20 | V-4T20 | 4‰ | 20 |
| M-1T30 | 1‰ | 30 | V-1T30 | 1‰ | 30 |
| M-2T30 | 2‰ | 30 | V-2T30 | 2‰ | 30 |
| M-3T30 | 3‰ | 30 | V-3T30 | 3‰ | 30 |
| M-4T30 | 4‰ | 30 | V-4T30 | 4‰ | 30 |
| Schematic diagram | |||||
 |  | ||||
 Molybdate Molybdate |  Vanadate Vanadate | ||||
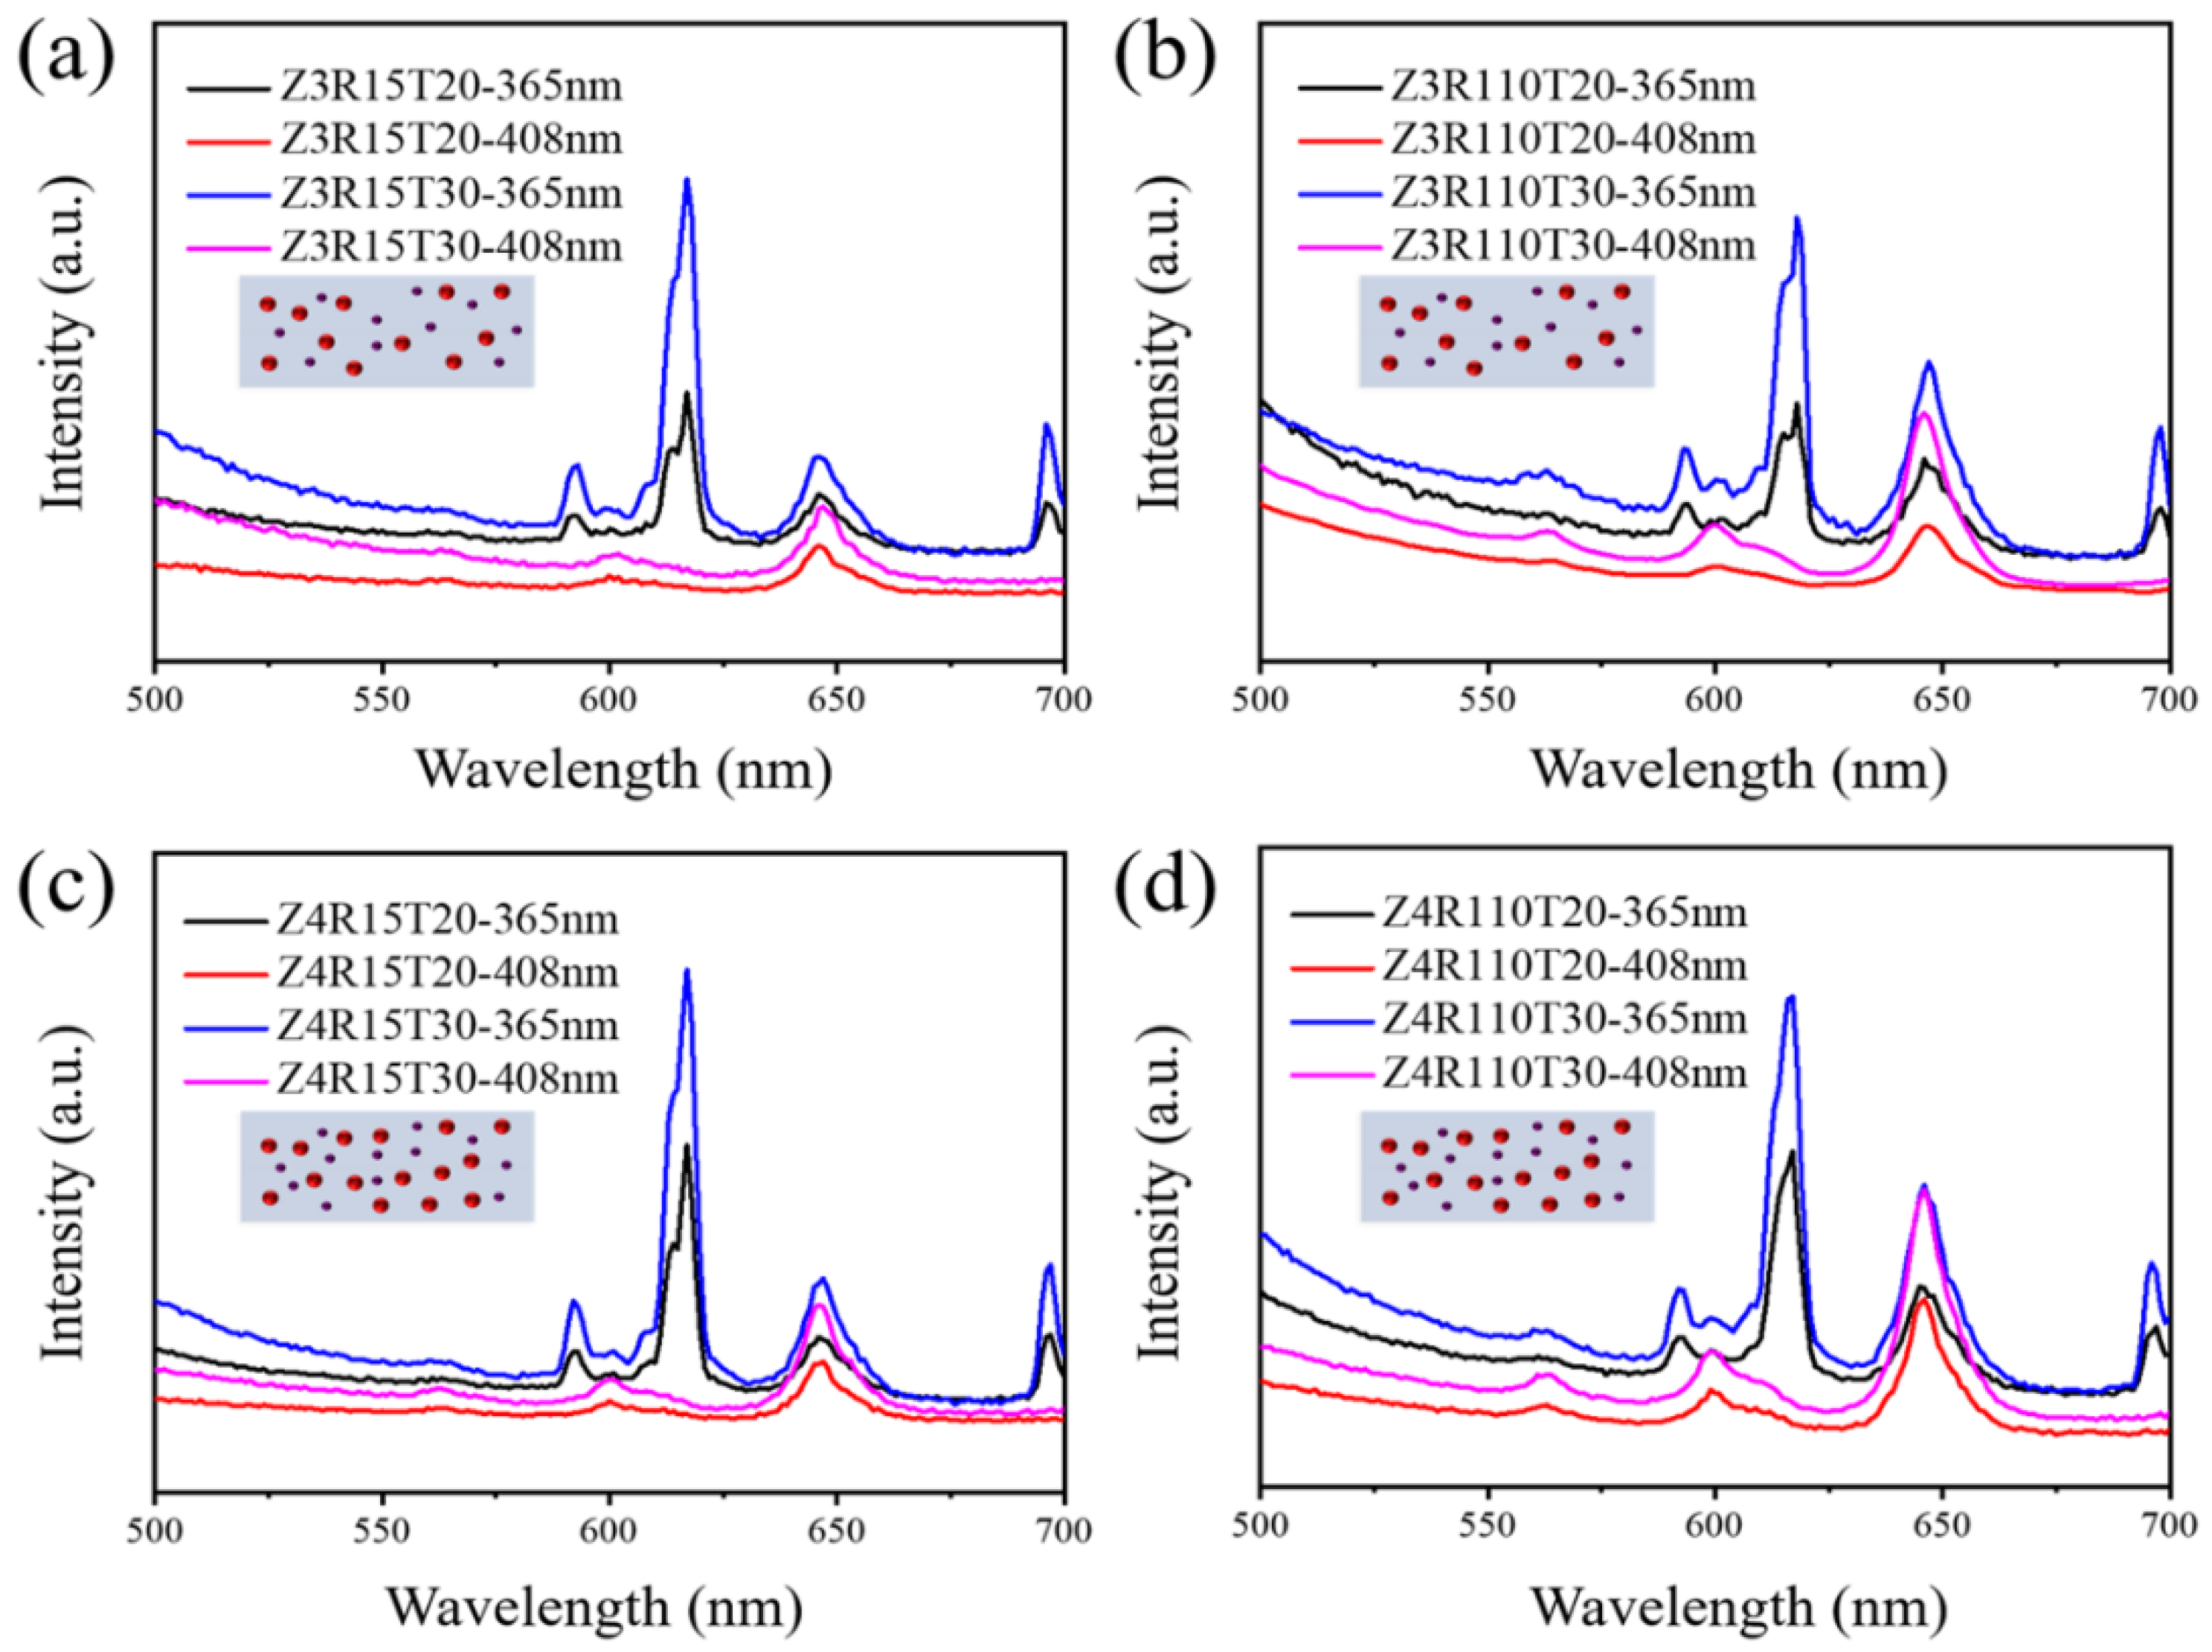
| Name a | Ratio (Eu04:Sm25Na25) | Total Powder Weight Ratio | Thickness b (μm) |
|---|---|---|---|
| Z3R15T20 | 1:5 | 3‰ | 20 |
| Z3R15T30 | 1:5 | 3‰ | 30 |
| Z3R110T20 | 1:10 | 3‰ | 20 |
| Z3R110T30 | 1:10 | 3‰ | 30 |
| Z4R15T20 | 1:5 | 4‰ | 20 |
| Z4R15T30 | 1:5 | 4‰ | 30 |
| Z4R110T20 | 1:10 | 4‰ | 20 |
| Z4R110T30 | 1:10 | 4‰ | 30 |
| Schematic diagram | |||
 | |||
| Name a | Total Powder Weight Ratio | Ratio (Eu04:Sm25Na25) | Upper Layer | Lower Layer | |
|---|---|---|---|---|---|
| Bi3R15SE | 3‰ | 1:5 | Sm25Na25 | Eu04 | |
| Bi3R110SE | 3‰ | 1:10 | Sm25Na25 | Eu04 | |
| Bi4R15SE | 4‰ | 1:5 | Sm25Na25 | Eu04 | |
| Bi4R110SE | 4‰ | 1:10 | Sm25Na25 | Eu04 | |
| Bi3R15ES | 3‰ | 1:5 | Eu04 | Sm25Na25 | |
| Bi3R110ES | 3‰ | 1:10 | Eu04 | Sm25Na25 | |
| Bi4R15ES | 4‰ | 1:5 | Eu04 | Sm25Na25 | |
| Bi4R110ES | 4‰ | 1:10 | Eu04 | Sm25Na25 | |
| Schematic diagram of Sm25Na25 in the upper layer | Schematic diagram of Eu04 in the upper layer | ||||
 |  | ||||
Publisher’s Note: MDPI stays neutral with regard to jurisdictional claims in published maps and institutional affiliations. |
© 2021 by the authors. Licensee MDPI, Basel, Switzerland. This article is an open access article distributed under the terms and conditions of the Creative Commons Attribution (CC BY) license (http://creativecommons.org/licenses/by/4.0/).
Share and Cite
Fang, J.; Liu, W.; Zhou, W.; Zhu, C.; Ni, Y.; Fang, L.; Lu, C. Down-Conversion Polymer Composite Coatings with Multipeak Absorption and Emission. Coatings 2021, 11, 282. https://doi.org/10.3390/coatings11030282
Fang J, Liu W, Zhou W, Zhu C, Ni Y, Fang L, Lu C. Down-Conversion Polymer Composite Coatings with Multipeak Absorption and Emission. Coatings. 2021; 11(3):282. https://doi.org/10.3390/coatings11030282
Chicago/Turabian StyleFang, Jun, Wenting Liu, Wenying Zhou, Cheng Zhu, Yaru Ni, Liang Fang, and Chunhua Lu. 2021. "Down-Conversion Polymer Composite Coatings with Multipeak Absorption and Emission" Coatings 11, no. 3: 282. https://doi.org/10.3390/coatings11030282