
Effects of Advanced Amines on Magnetite Deposition of Steam Generator Tubes in Secondary System


Abstract
:
1. Introduction
2. Experimental Methods
2.1. Preparation of Specimens and Test Solutions
2.2. SG Tube Fouling Loop System
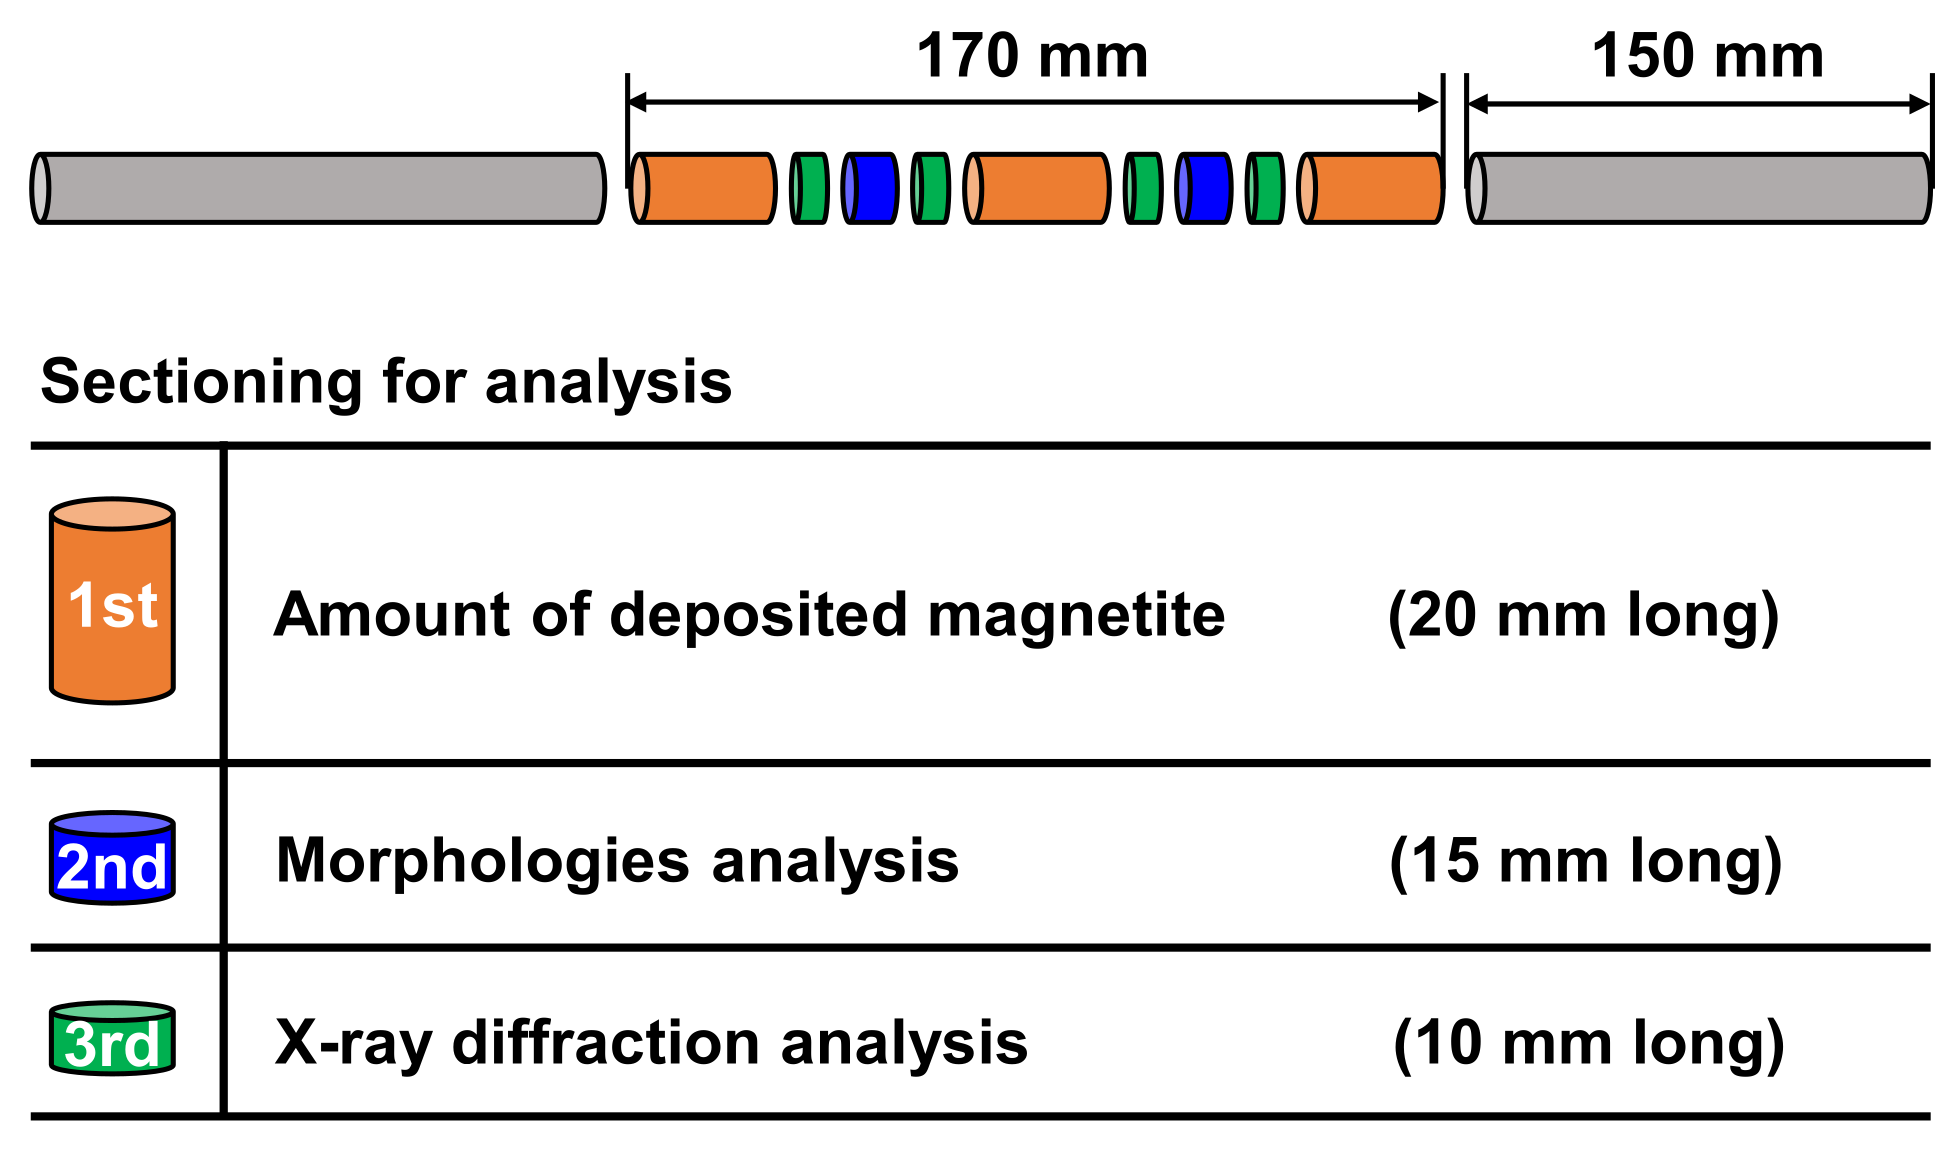
2.3. Characterization of the Simulated Deposits
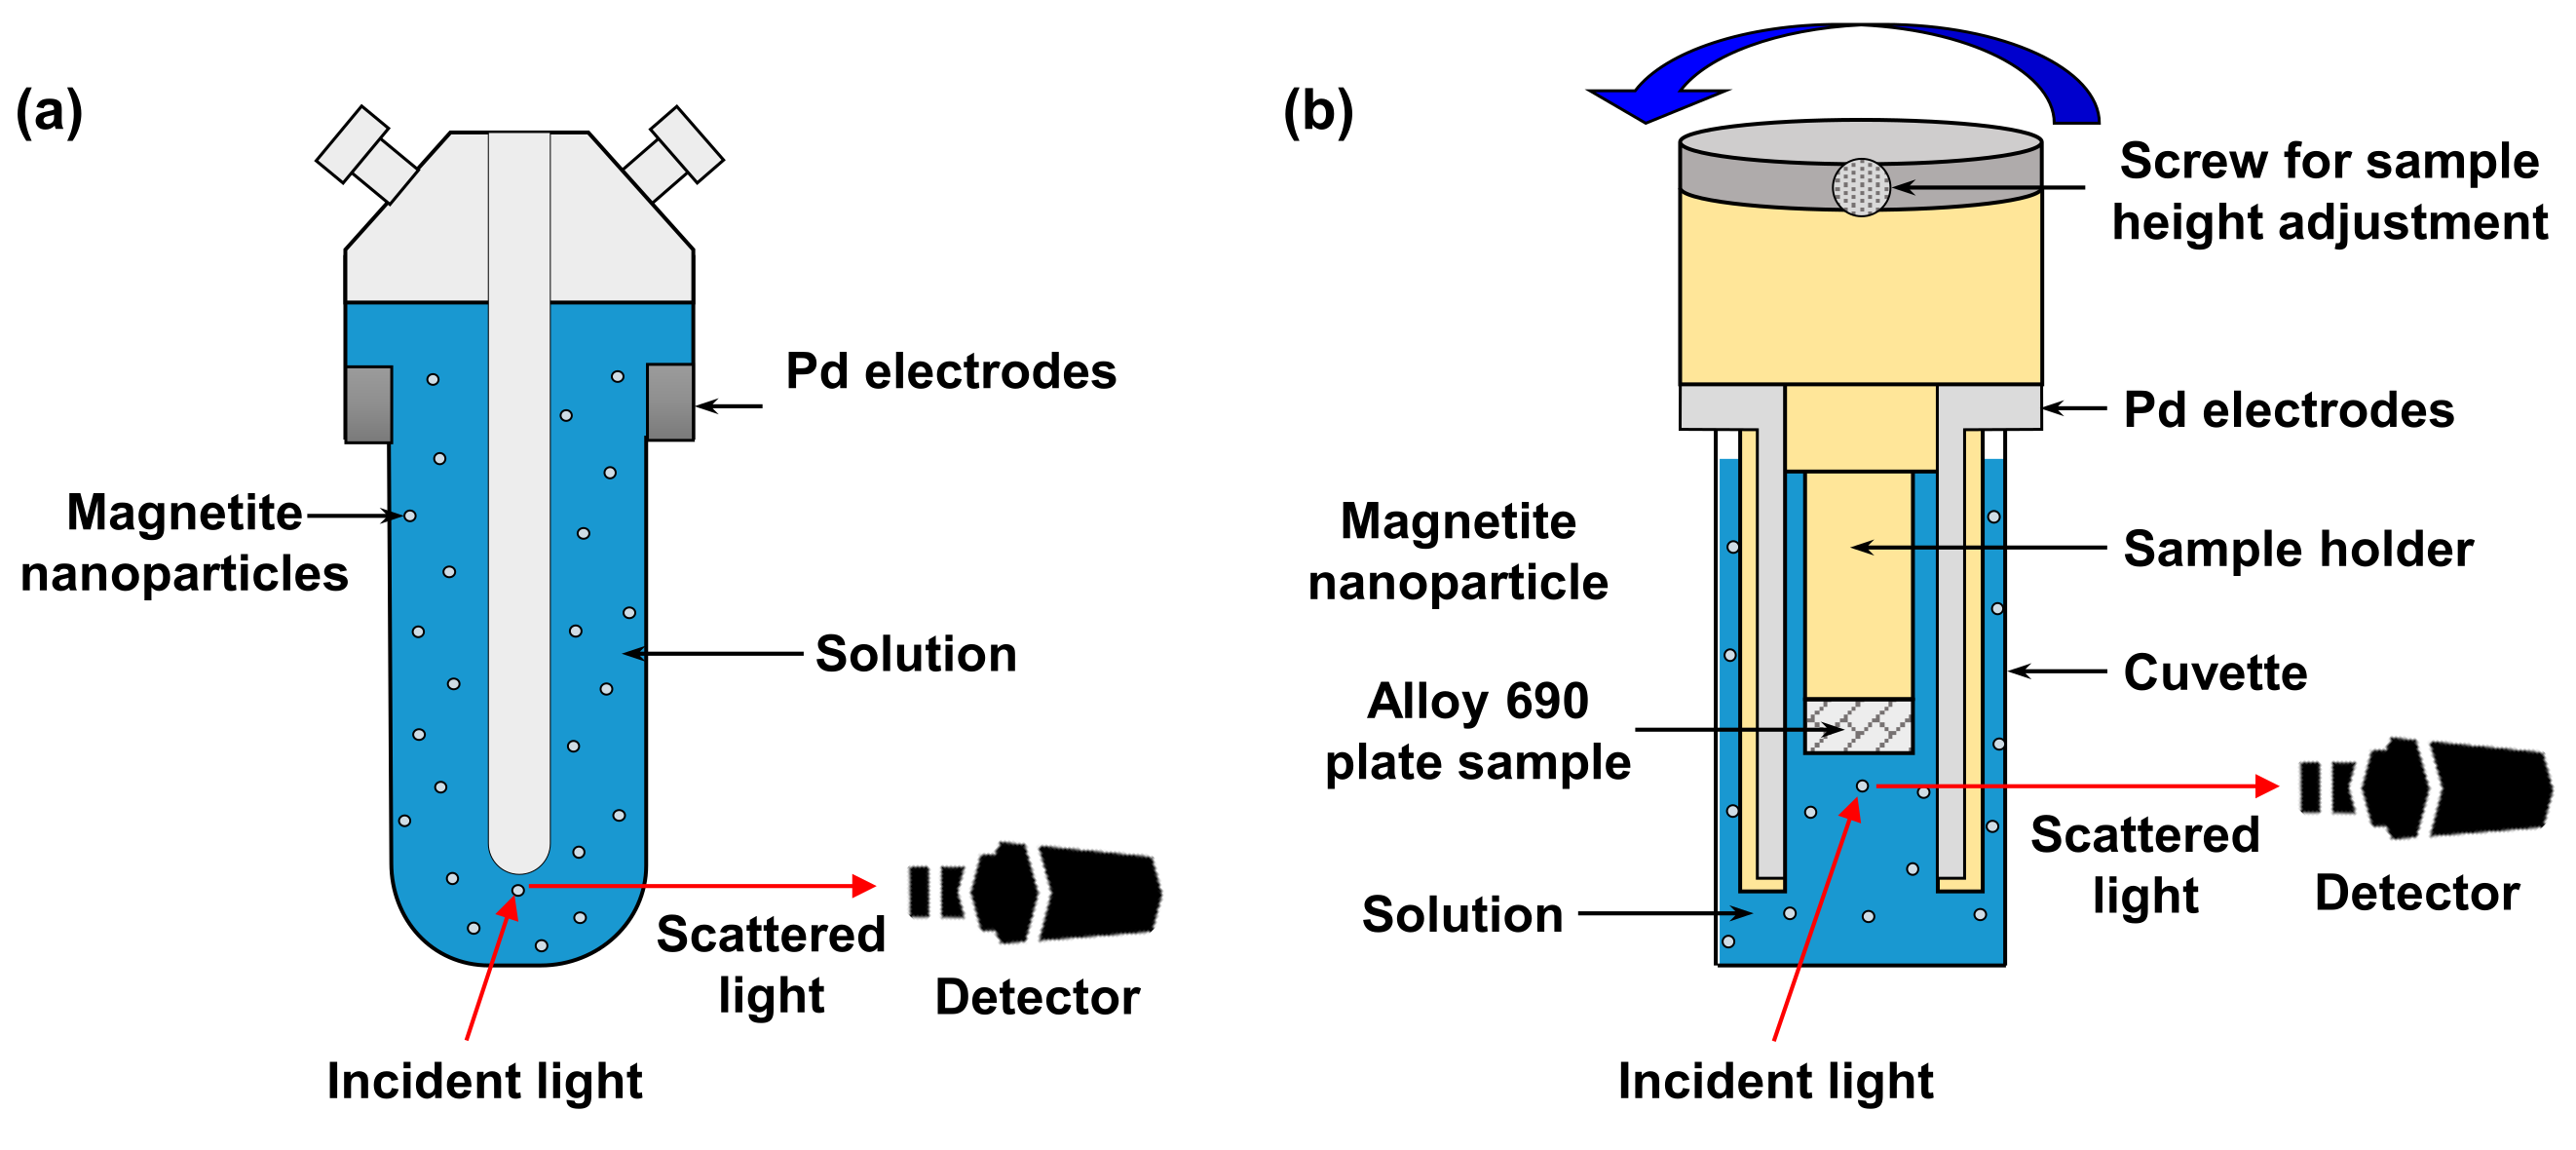
2.4. Zeta Potential Measurement
3. Results and Discussion
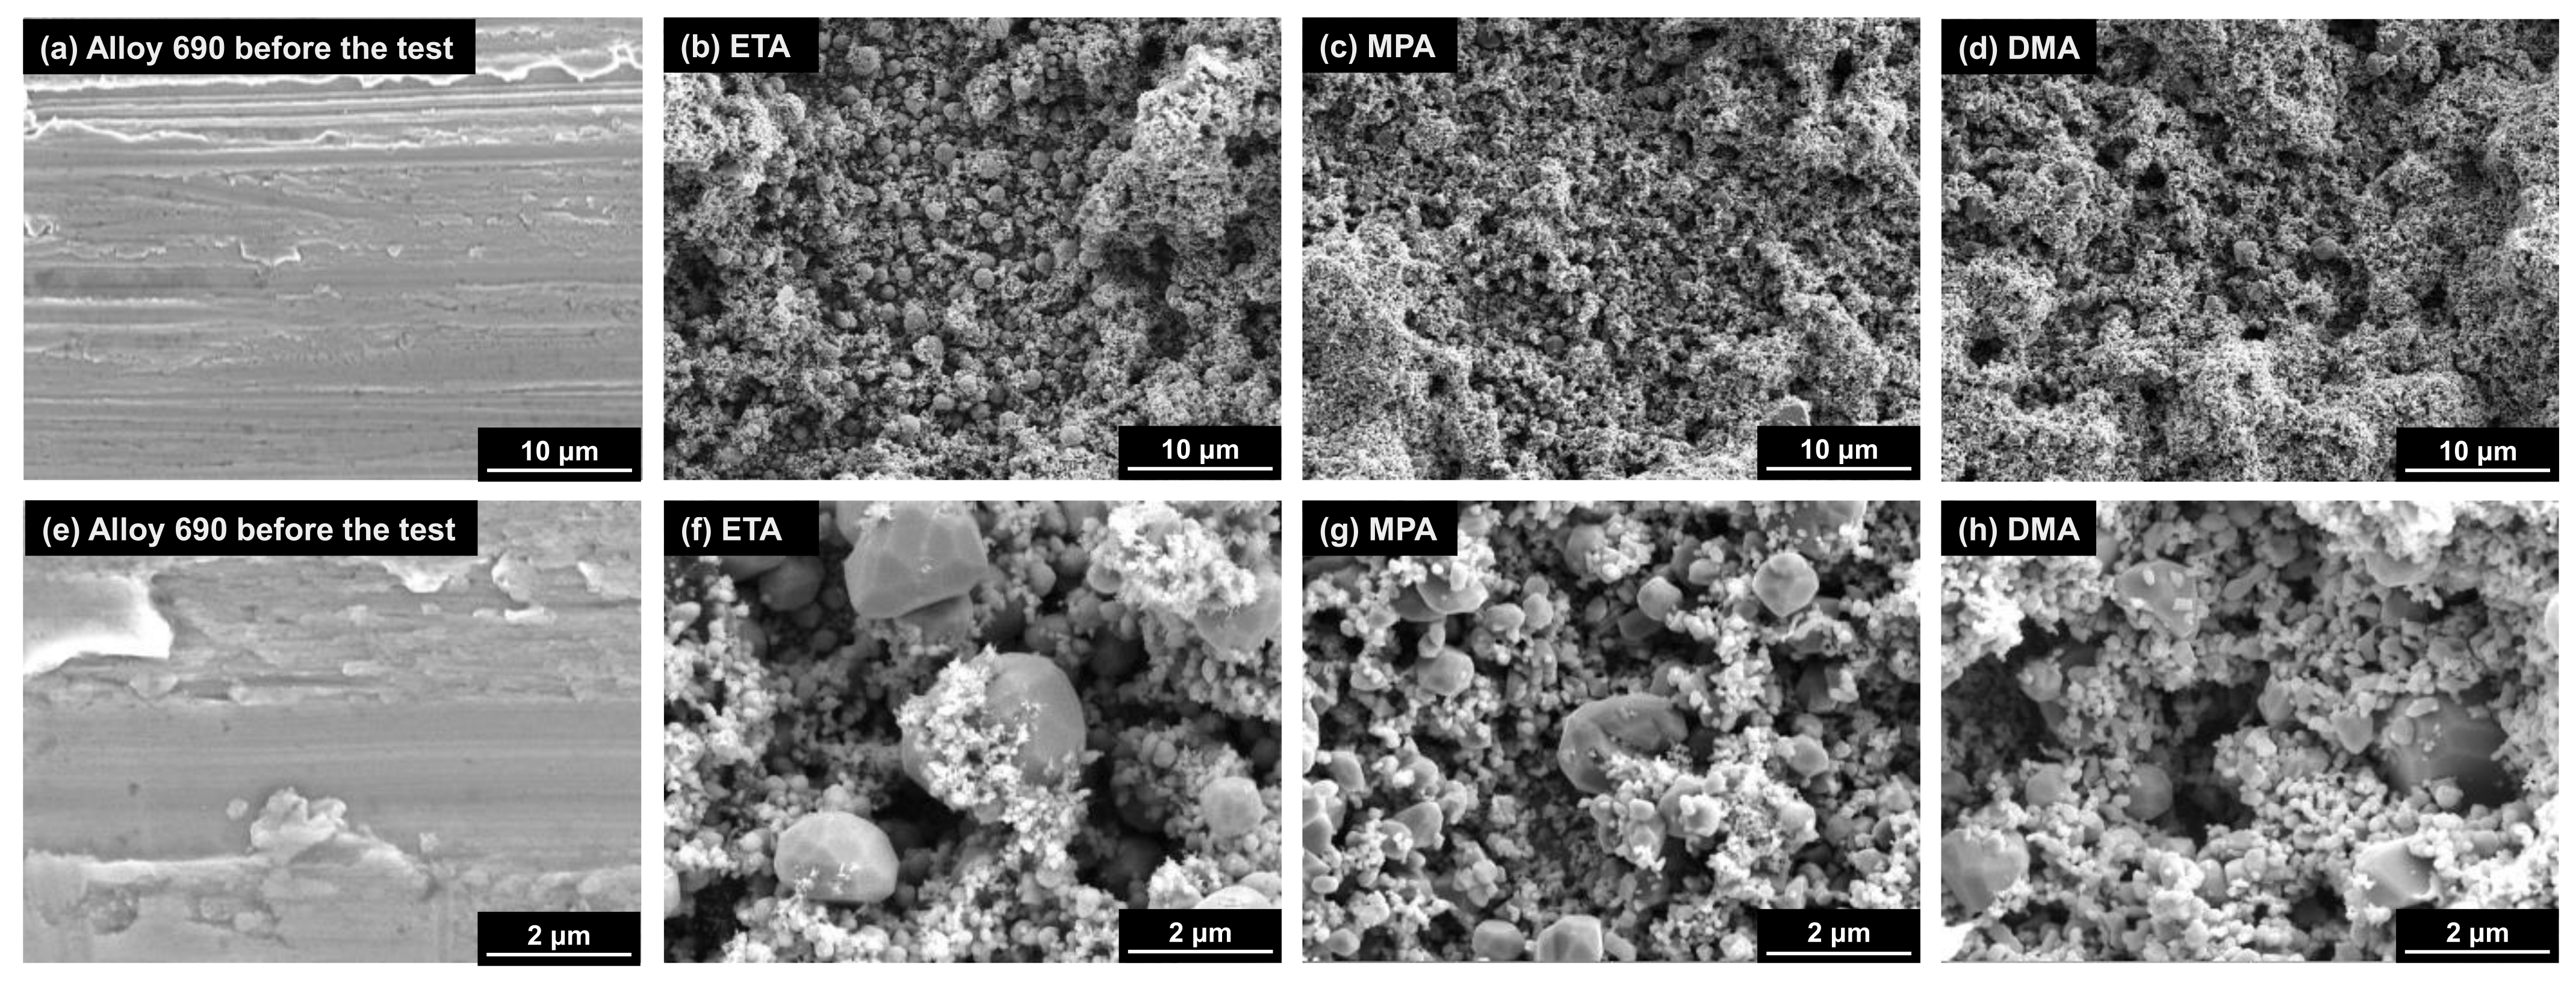
3.1. Morphologies of Deposits
3.2. Identification of Simulated Deposits
3.3. Amount of Magnetite Deposits
3.4. Consideration of the Possibility of Using Alternative Advanced Amines Instead of ETA
4. Conclusions
- (1)
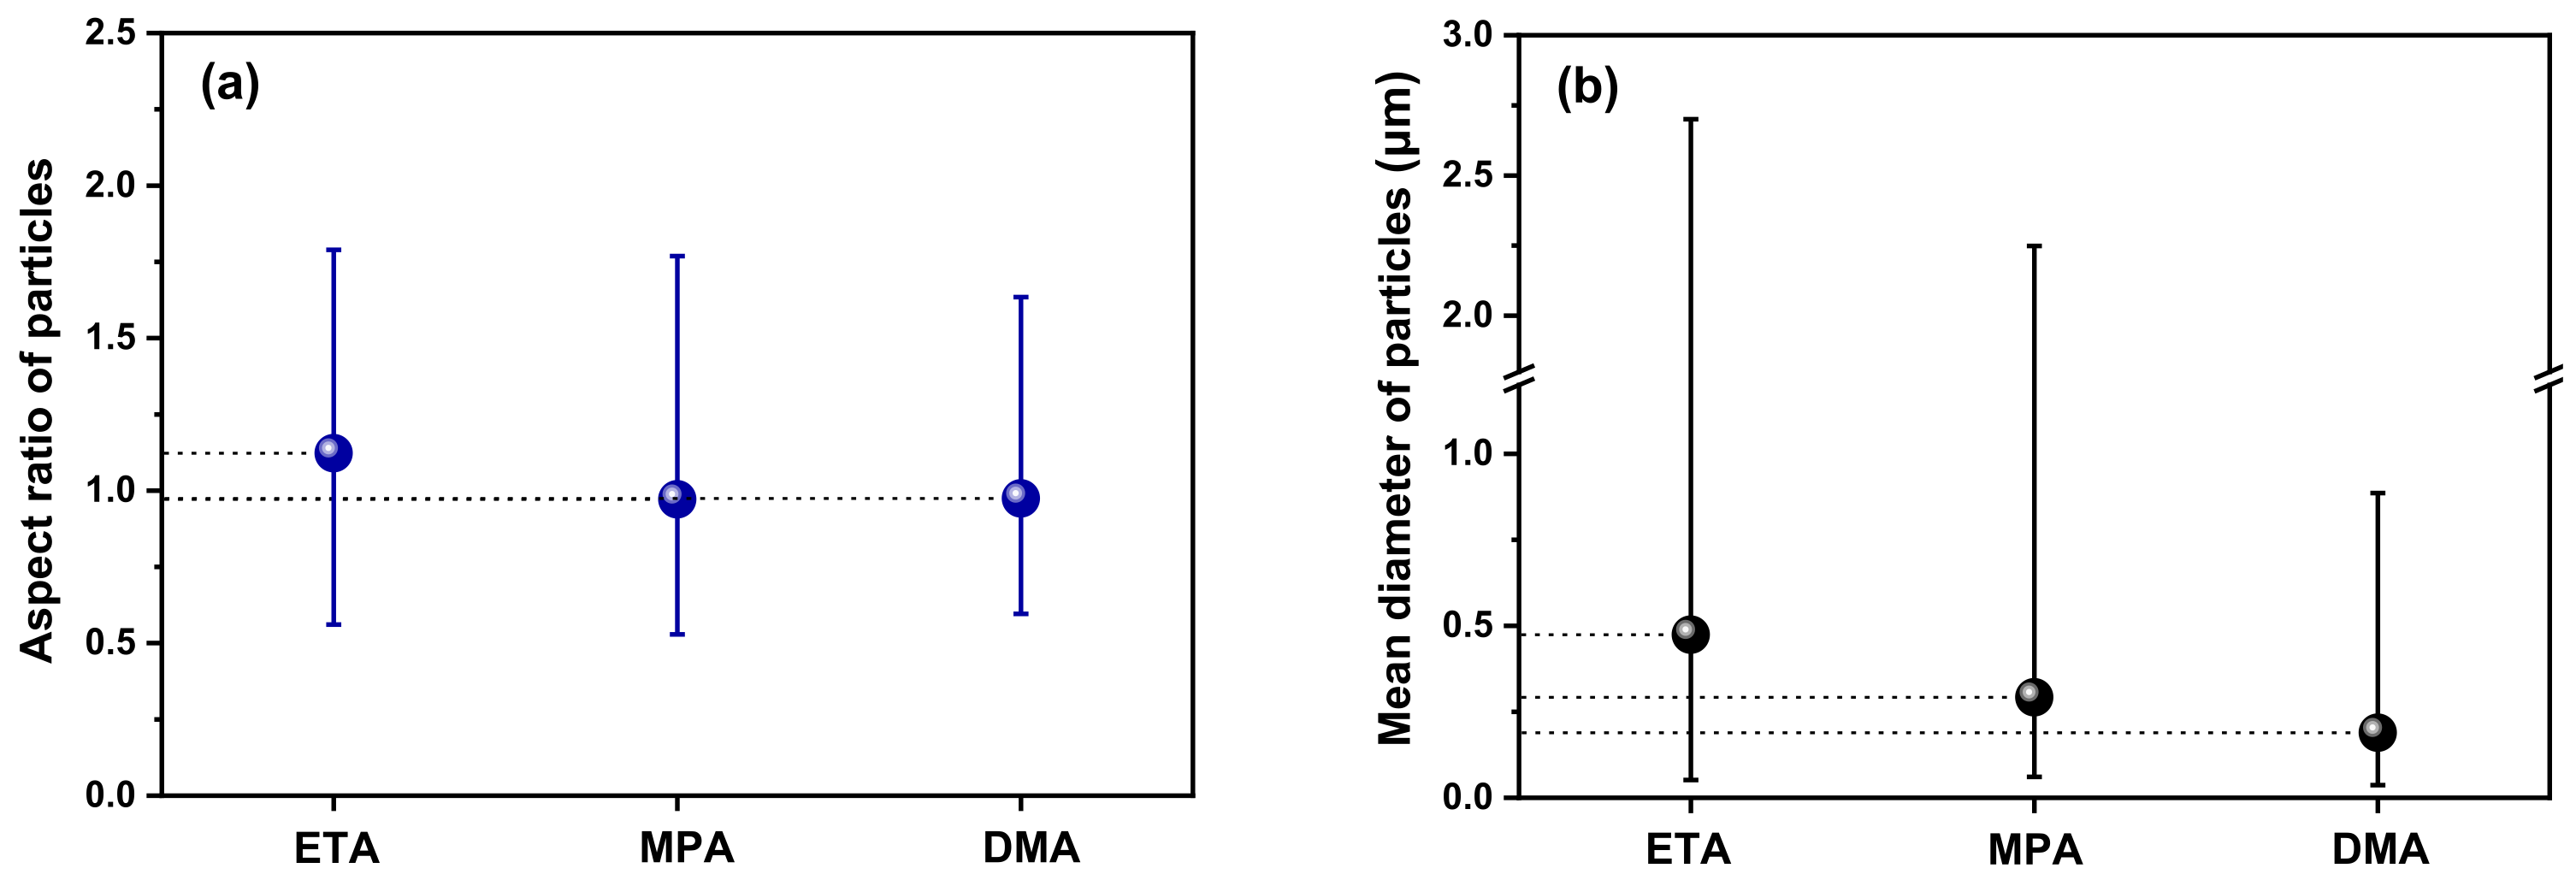
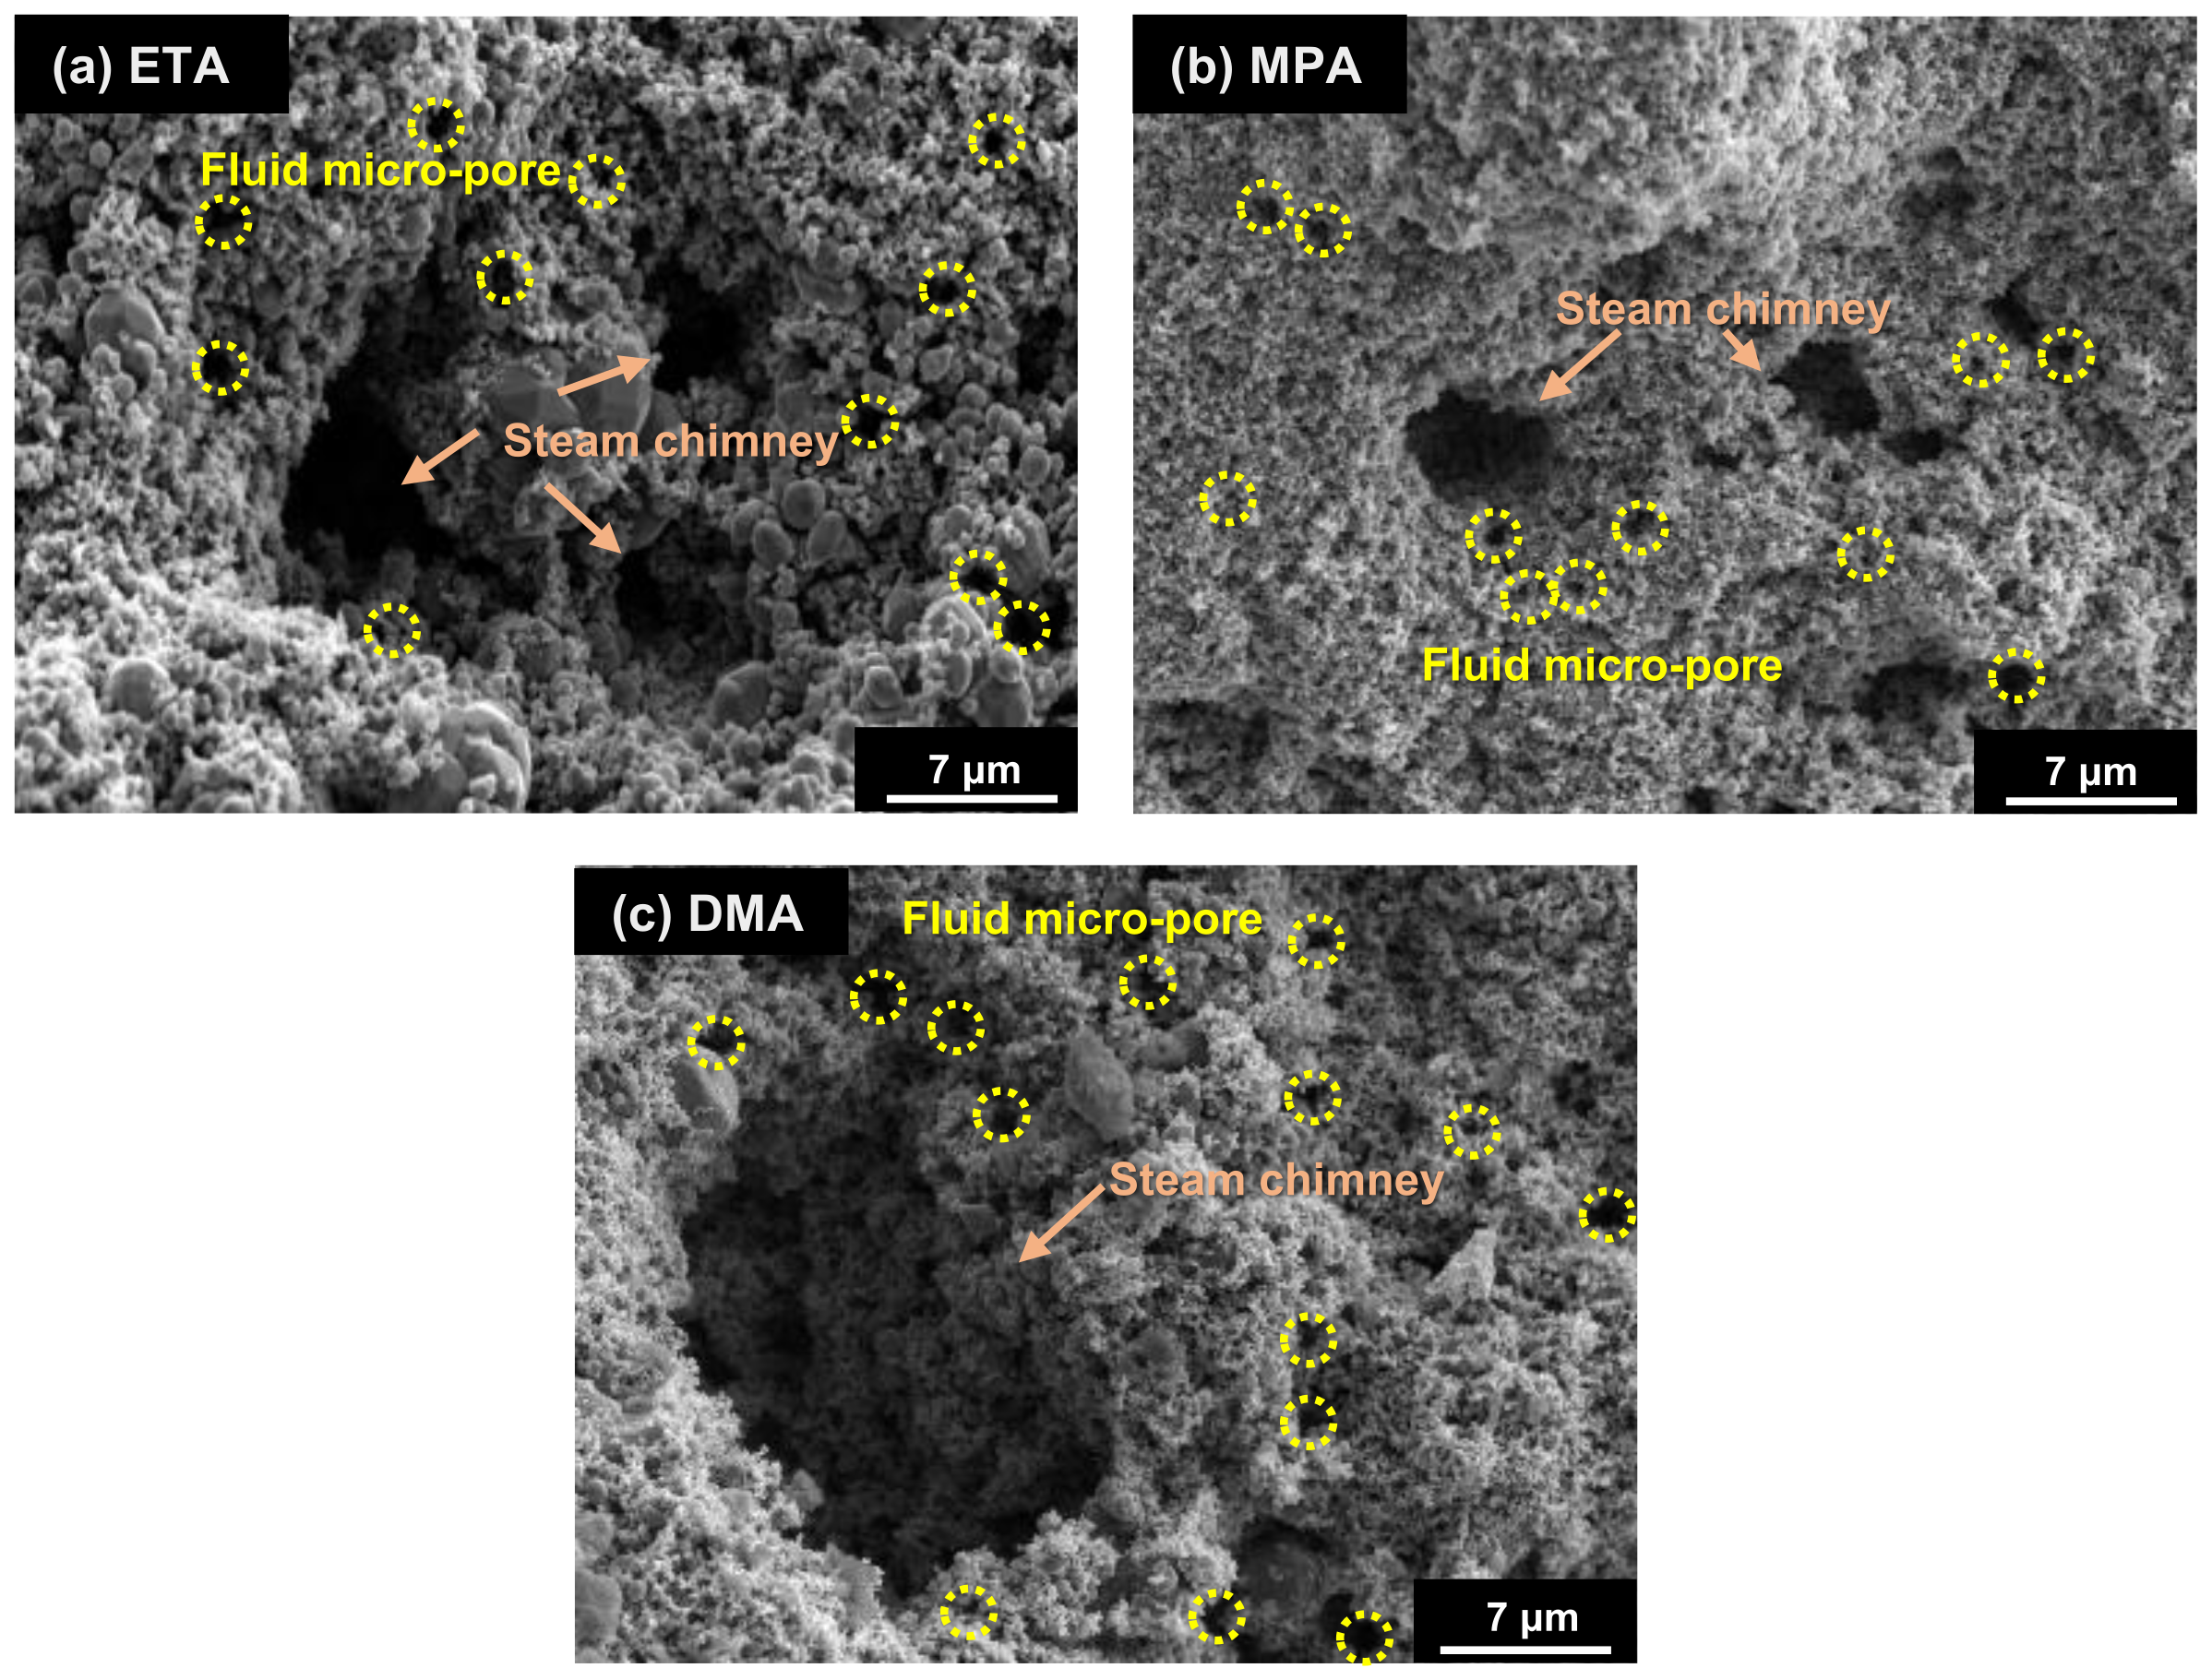
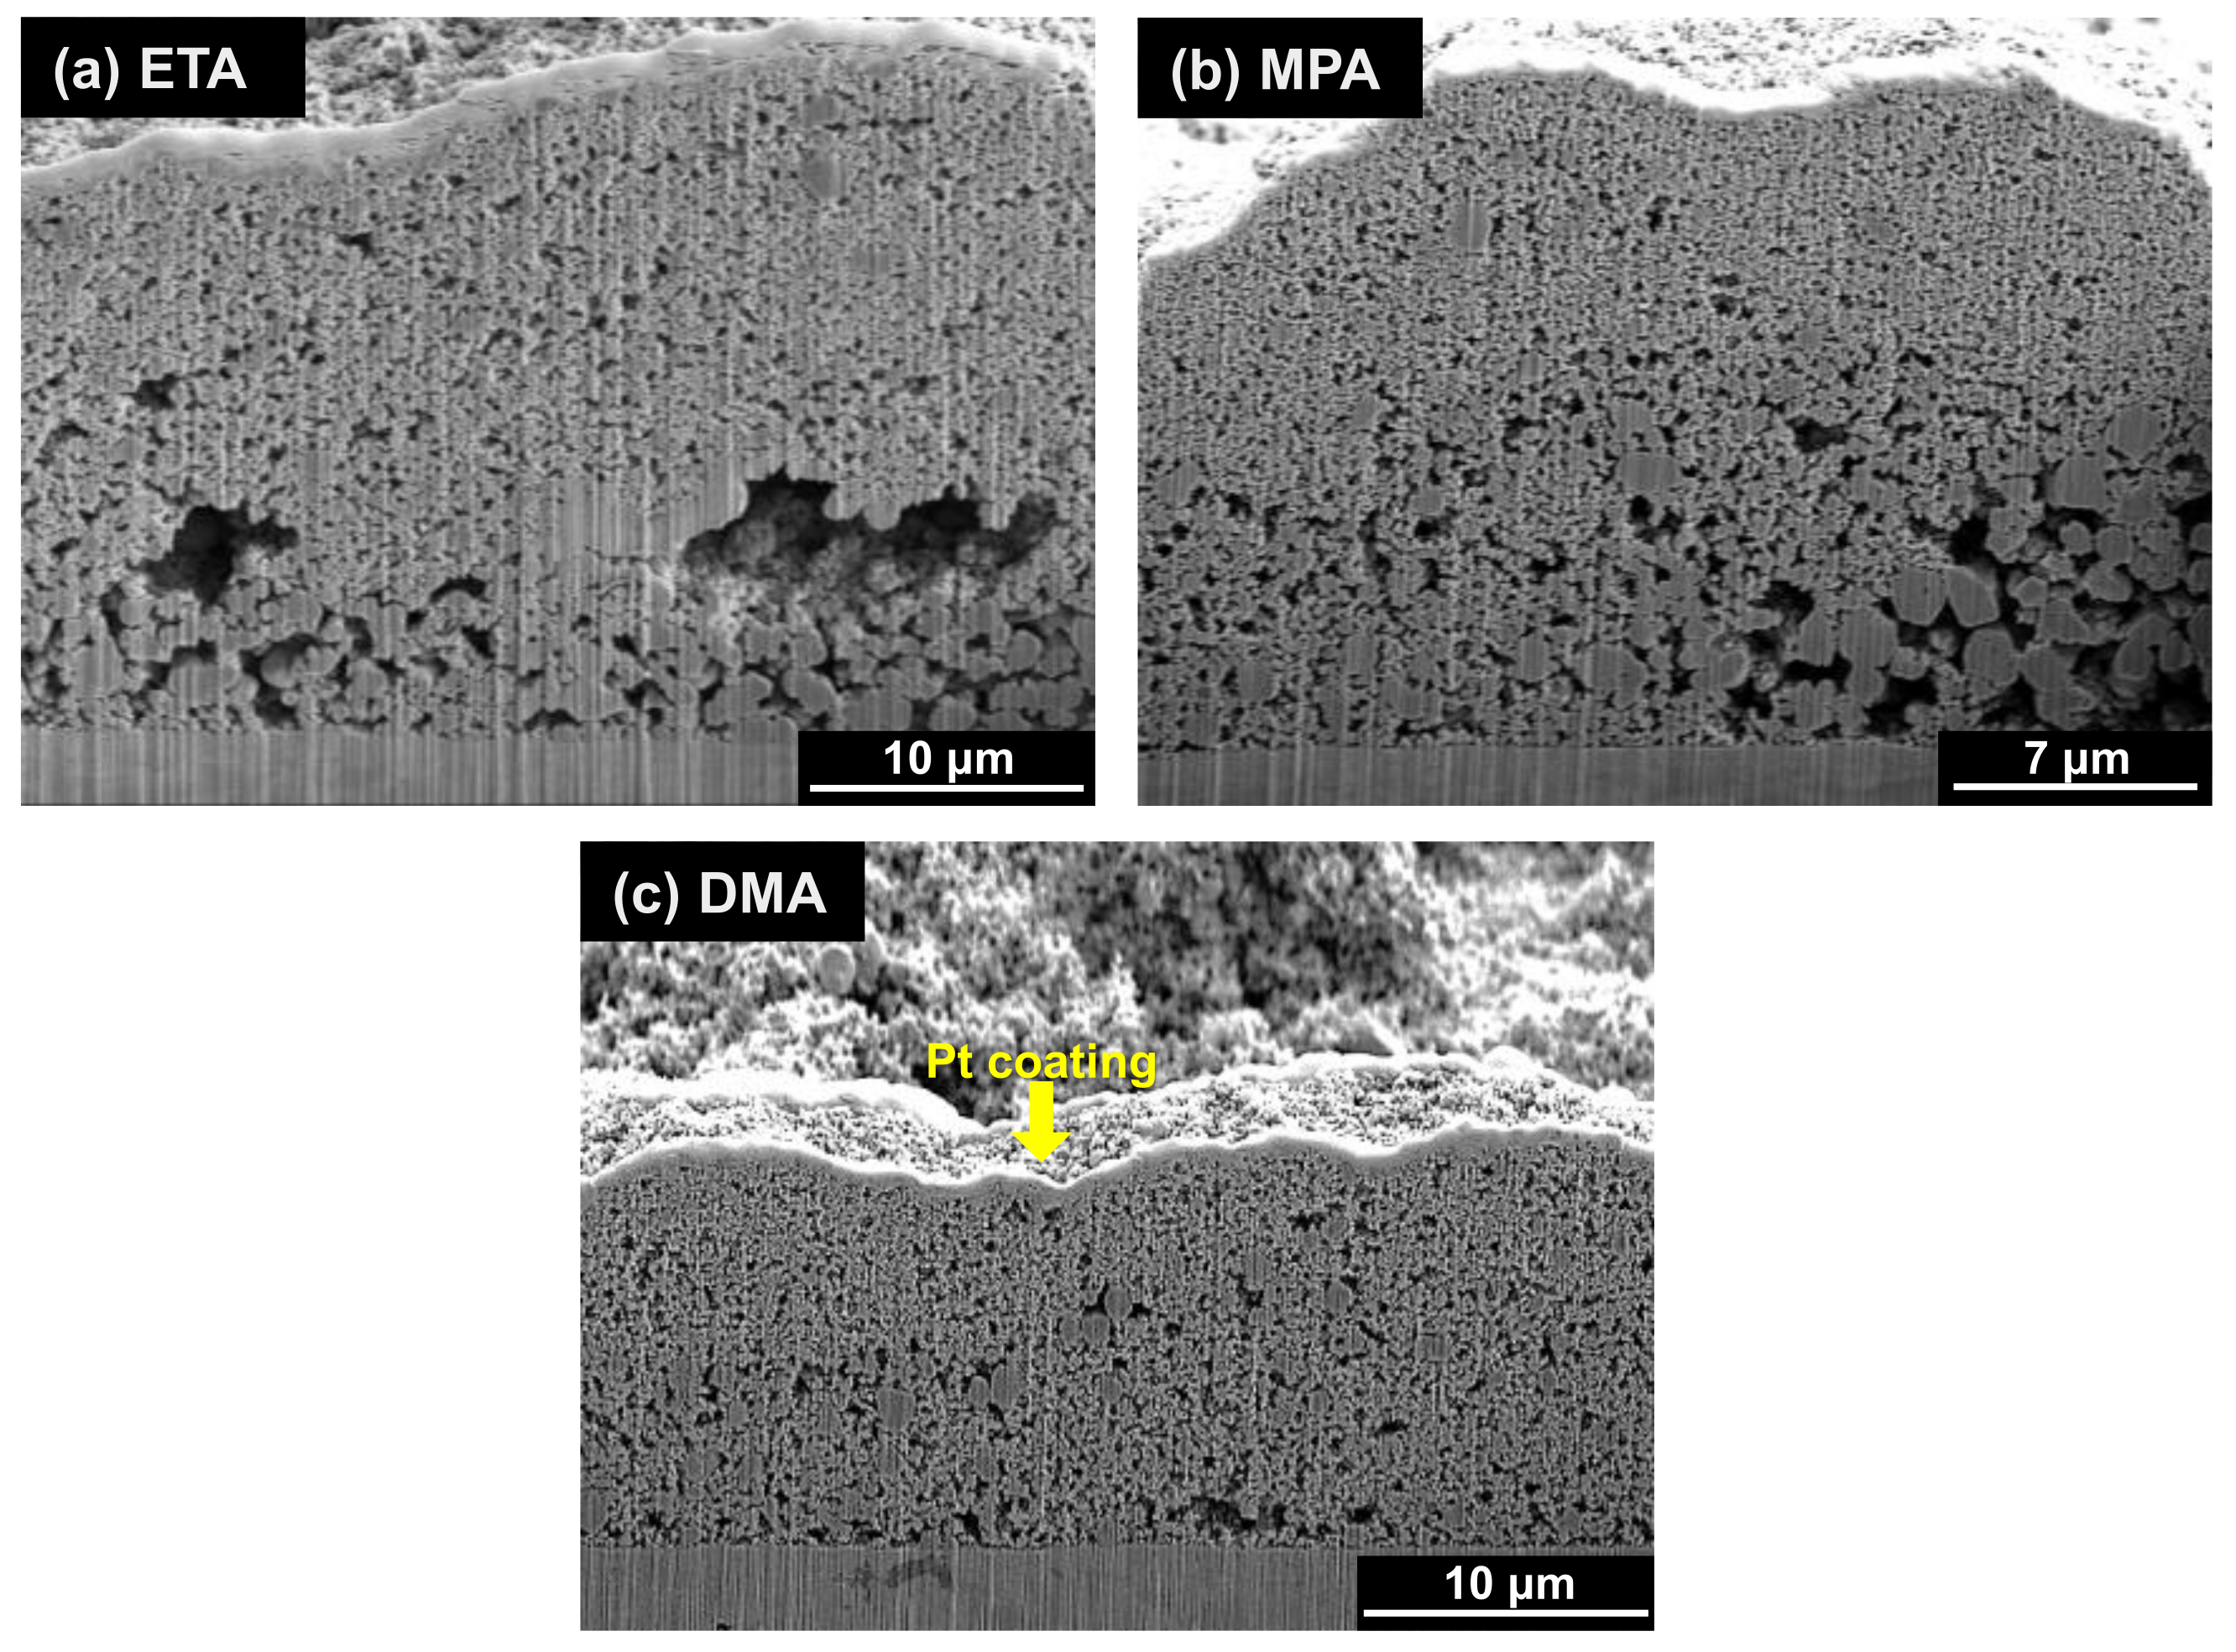
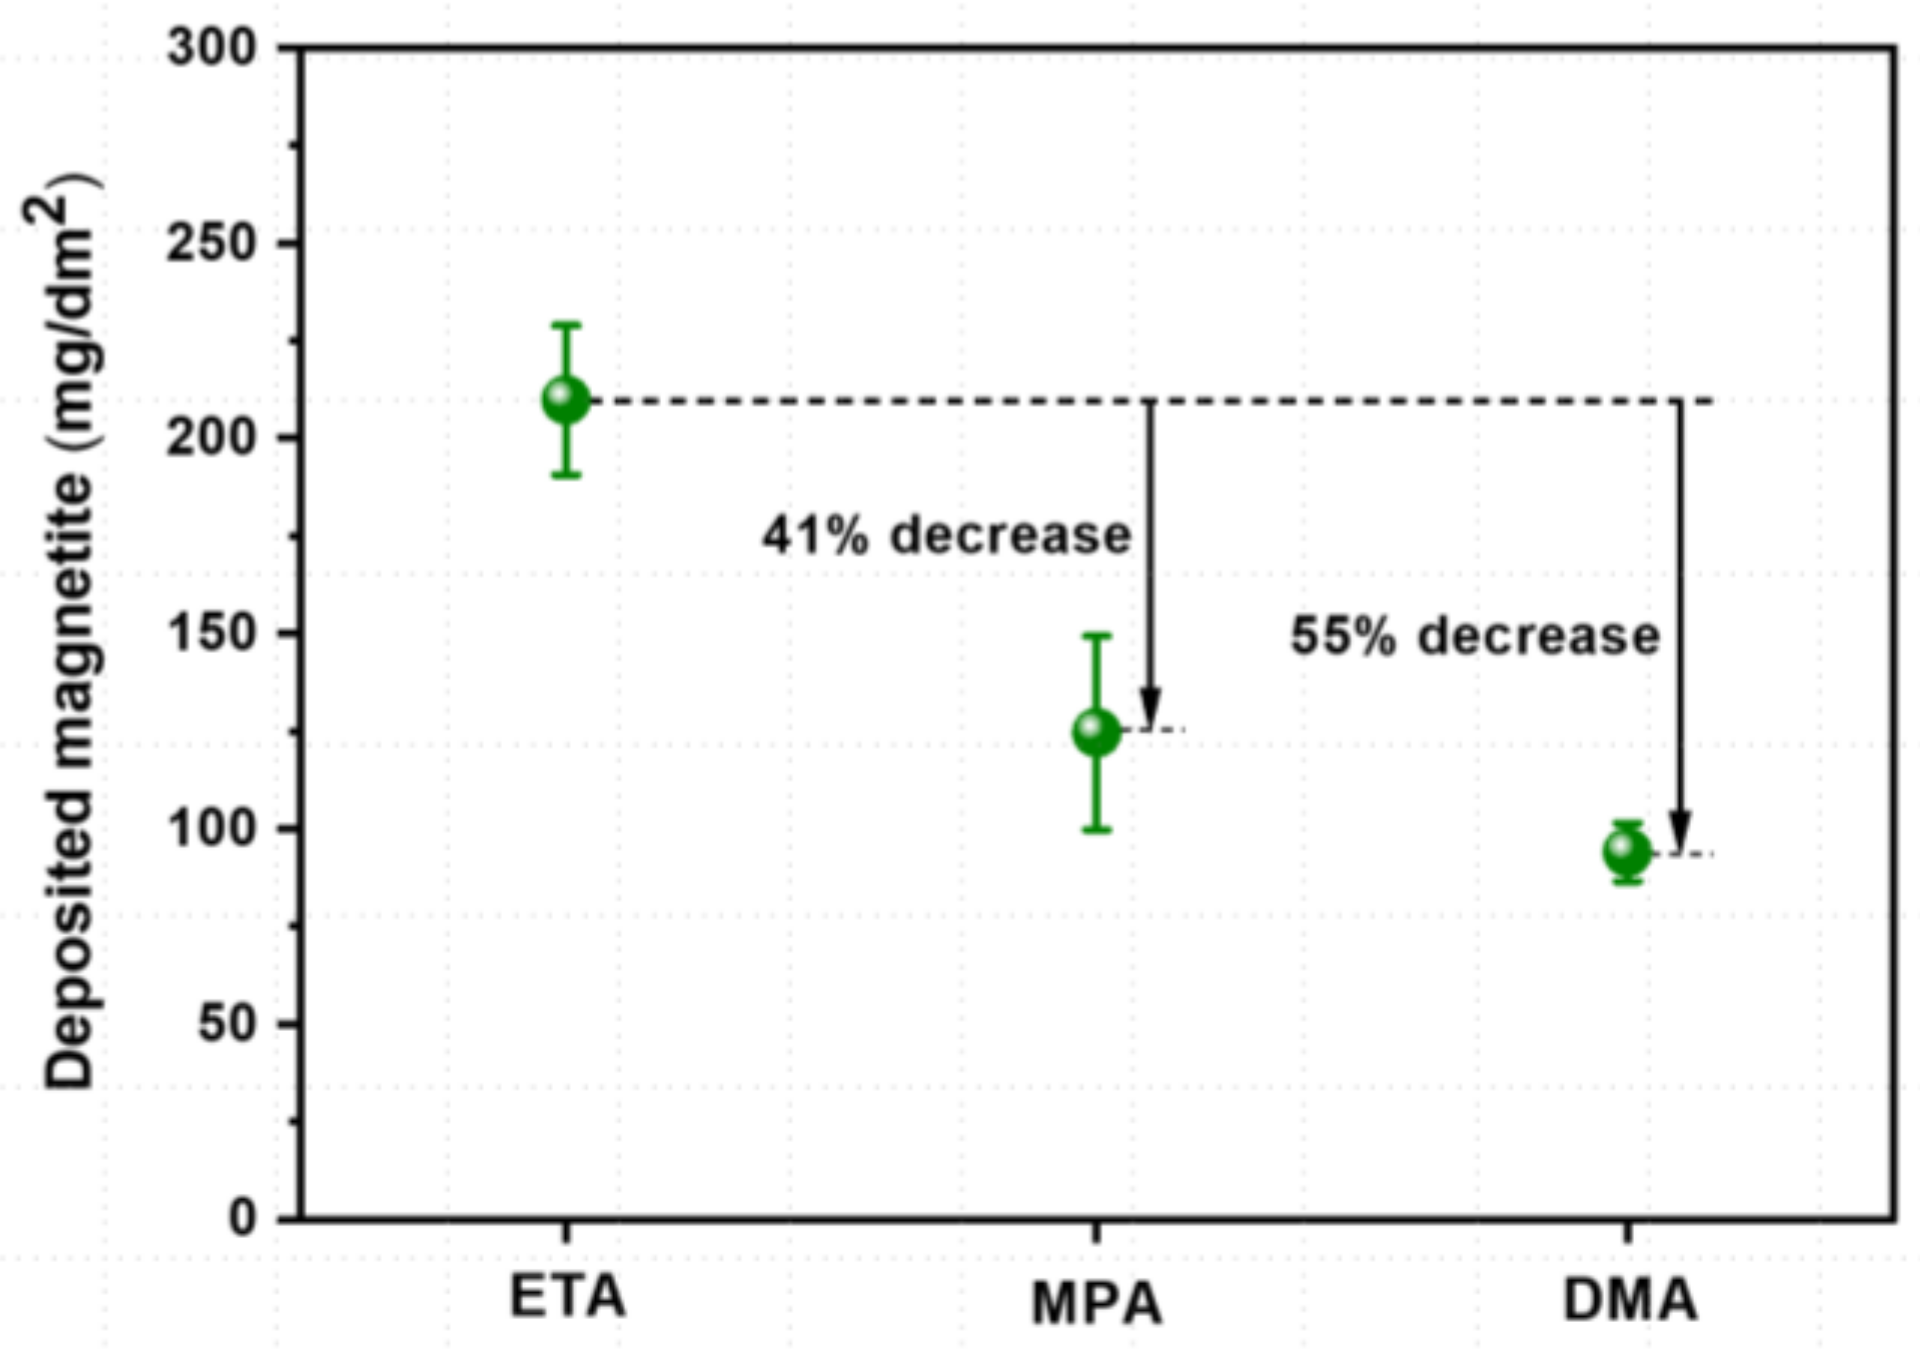
- The deposited magnetite particles were polyhedral or spherical, ranging in size from tens of nanometers to several micrometers with all three amines. The average porosity when using ETA, MPA, and DMA was approximately 34.7%, 33.0%, and 24.6%, respectively. Compared to ETA, the amount of magnetite deposited with MPA and DMA was significantly less (by about 41% and 55%, respectively).
- (2)
- Based on the particle characteristic data, the particle size decreases when MPA and DMA are used, compared to the case using ETA. The mean diameter of the deposited particles is largest (0.474 µm) when using ETA. In contrast, when using MPA and DMA, they are 0.292 and 0.189 µm, respectively.
- (3)
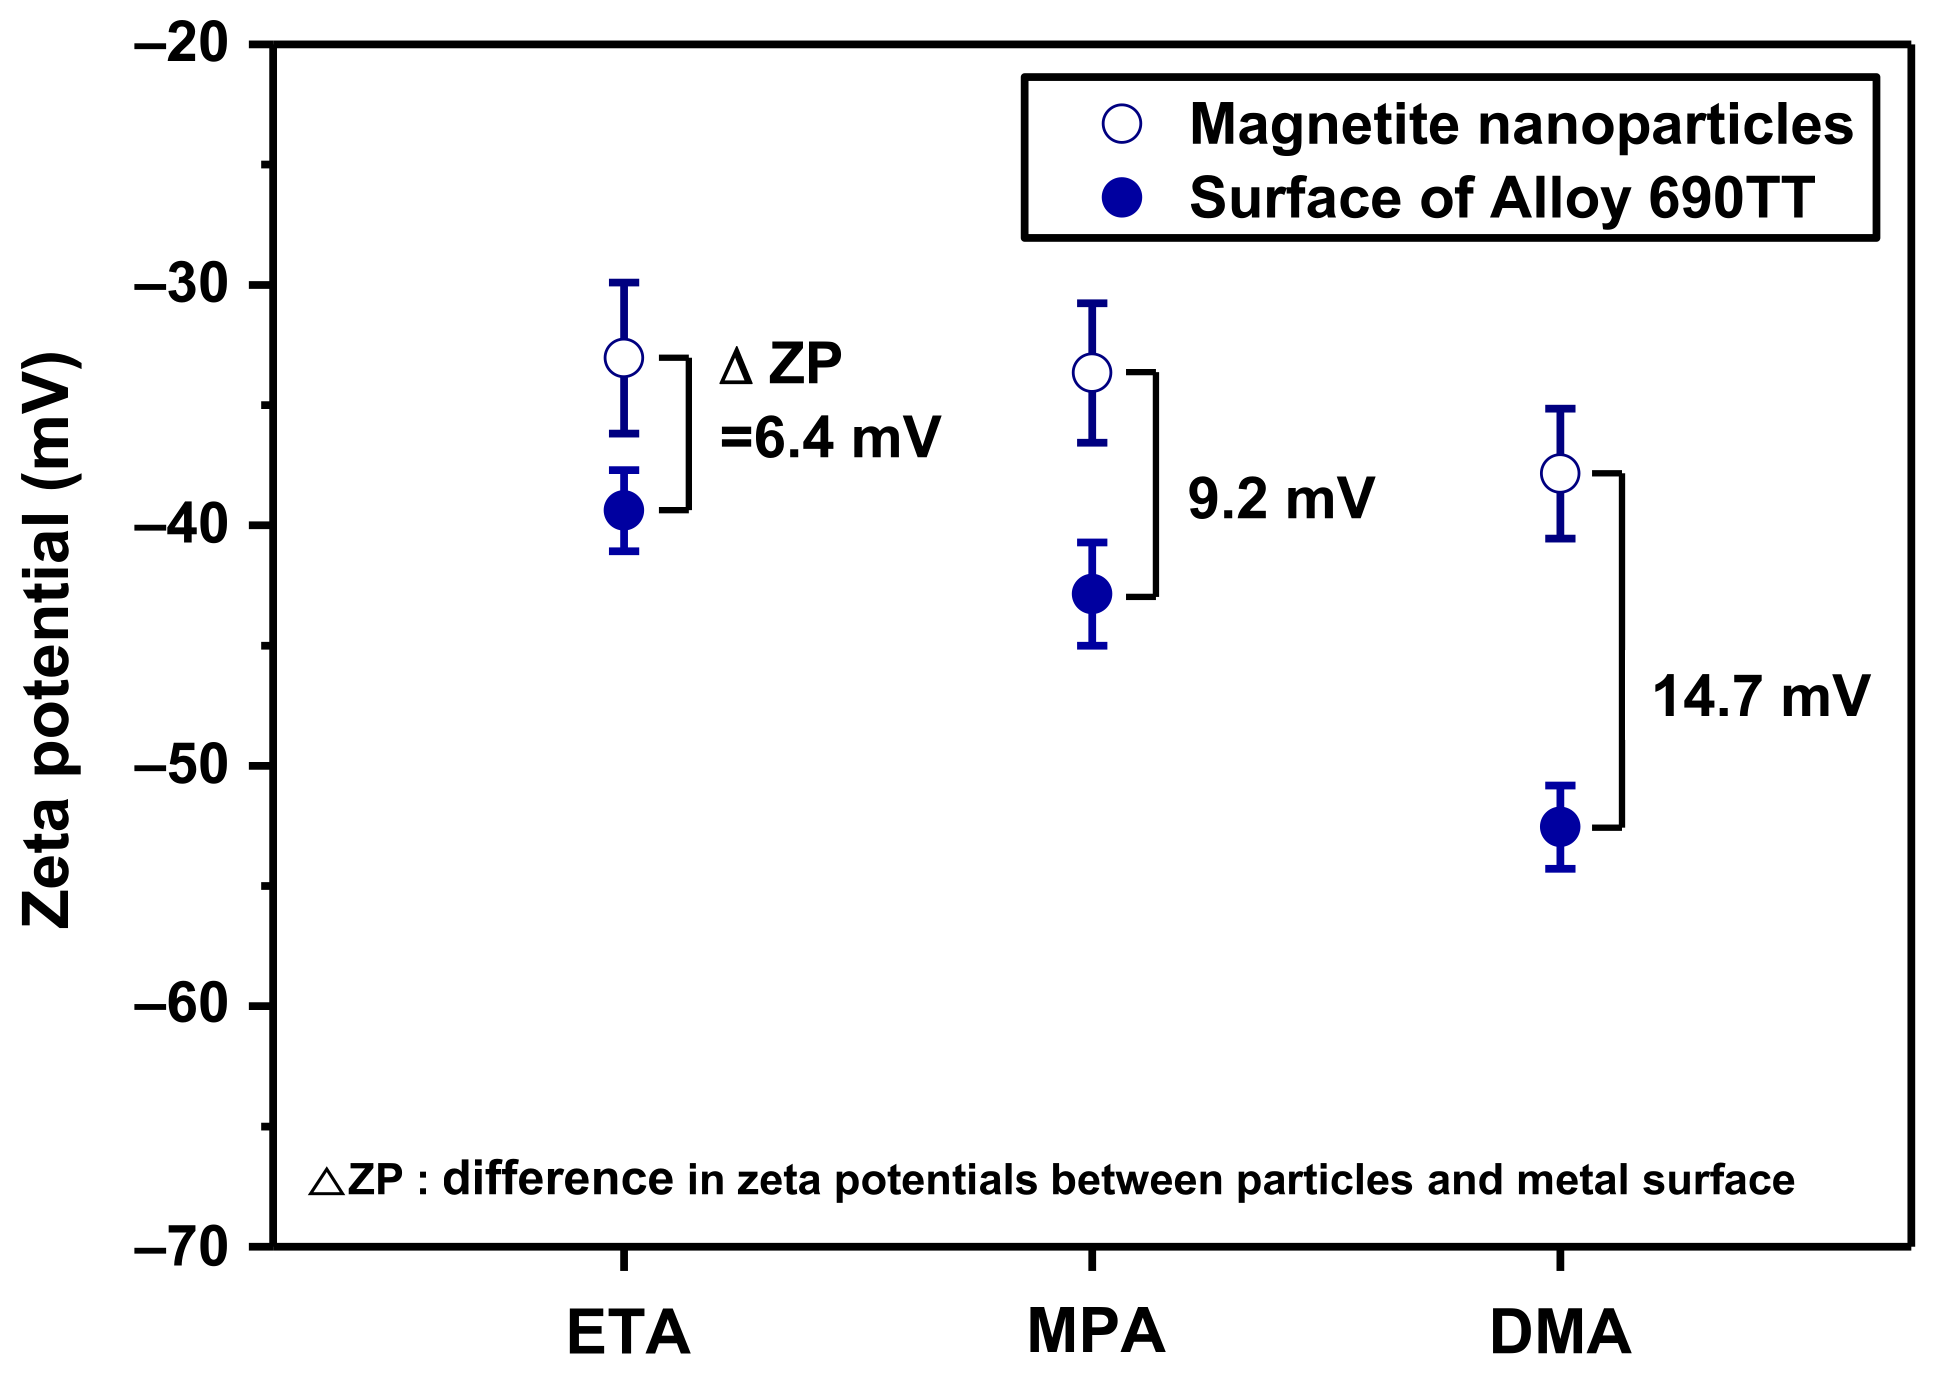
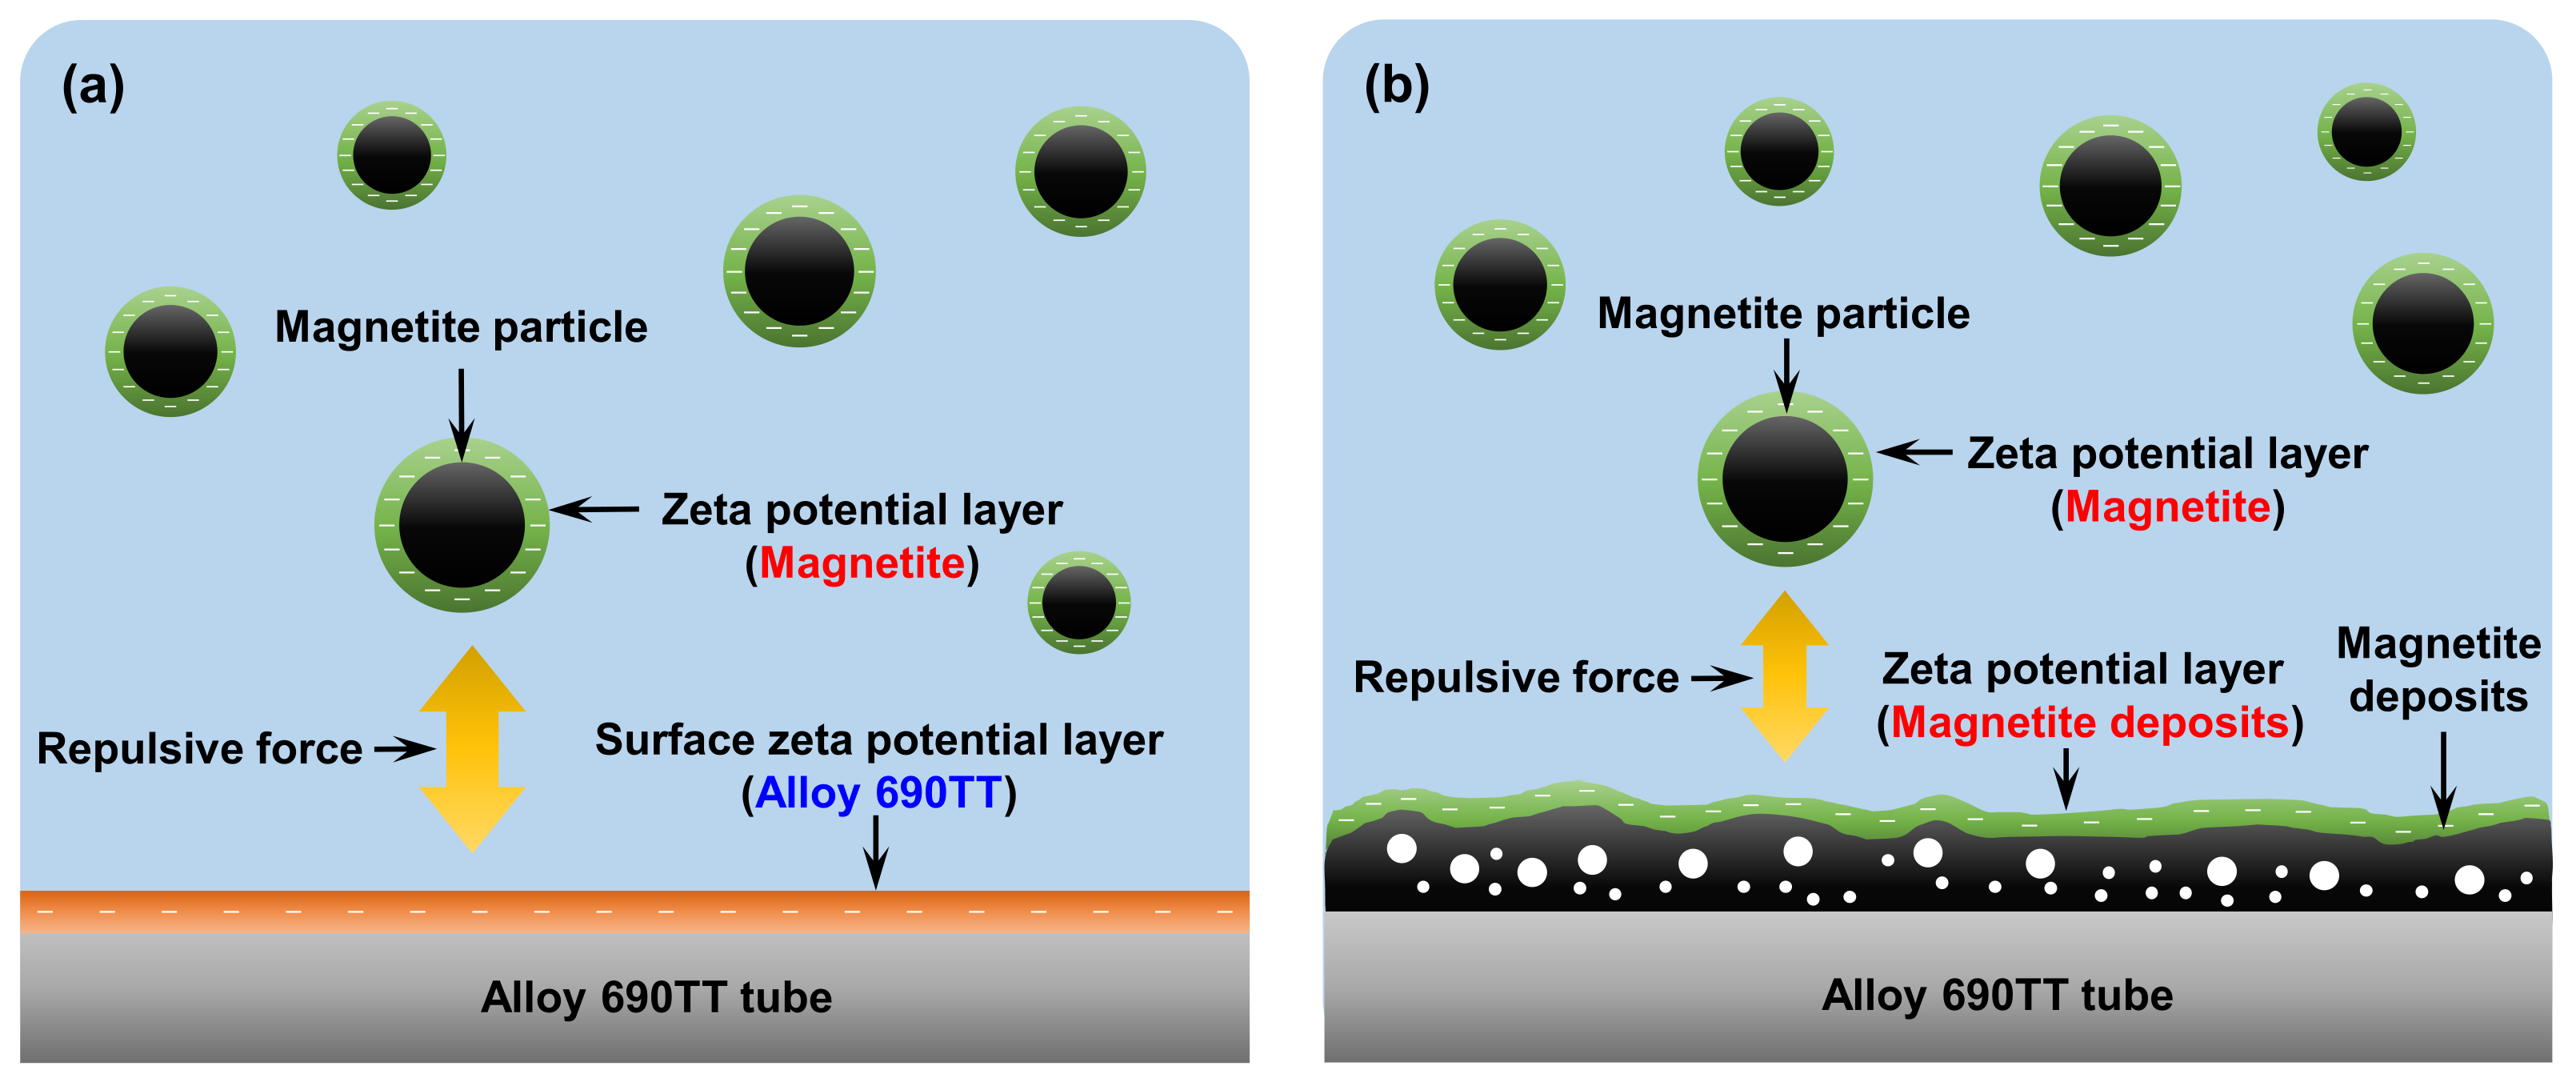
- In the initial stage of magnetite deposition, the deposition mechanism could be explained by the difference in the zeta potential of magnetite particles and the surface of the Alloy 690TT tubes. When using DMA, the difference in zeta potential was largest, so the greatest electrostatic repulsion occurs between the magnetite particles and the surface of Alloy 690TT tubes during the deposition. As magnetite deposition proceeds, the electrostatic force between the already deposited magnetite and magnetite particles in secondary water would be a major factor in the mechanism of deposit growth. The repulsive force between the magnetite nanoparticles was highest in the DMA solution, resulting in the minimum amount of magnetite deposition.
- (4)
- Compared to ETA, DMA has many advantages in terms of SG fouling control, human safety, and environmental treatment cost, so it is worth considering DMA as an alternative pH control agent to replace ETA, which is currently widely used for this purpose in PWRs. However, several issues such as amine cost, stability, and decomposition products of other substances should be considered to before applying DMA as an alternative to ETA in real NPPs.
Author Contributions
Funding
Institutional Review Board Statement
Informed Consent Statement
Data Availability Statement
Conflicts of Interest
Abbreviations
| BPR | Back-pressure regulator |
| COD | Chemical oxygen demand |
| DI | Deionized |
| DMA | Dimethylamine |
| DO | Dissolved oxygen |
| EDS | Energy-dispersive X-ray spectrometer |
| ELS | Electrophoretic light scattering |
| EPRI | Electric Power Research Institute |
| ETA | Ethanolamine |
| FAC | Flow accelerated corrosion |
| FIB | Focused ion beam |
| FWHM | Full-width at half-maximum |
| HP | High-pressure |
| HR-XRD | High resolution X-ray diffractometer |
| ICP-AES | Inductively coupled plasma atomic emission spectroscope |
| ID | Inner diameter |
| MPA | 3-methoxypropylamine |
| MSR | Moisture separator re-heater |
| NPP | Nuclear power plants |
| OD | Outer diameter |
| PWR | Pressurized water reactor |
| RV | Relative volatility |
| SCC | Stress corrosion cracking |
| SEM | Scanning electron microscope |
| SG | Steam generator |
| SNB | Subcooled nucleate boiling |
| T/C | Thermo-couple |
| T-N | Total nitrogen |
| TSP | Tube support plate |
| TT | Thermally treated |
| USAPHC | U.S. Army Public Health Command |
References
- Prince, A.A.M.; Velmurugan, S.; Narasimhan, S.V.; Ramesh, C.; Murugesan, N.; Raghavan, P.S.; Gopalan, R.J. Dissolution behaviour of magnetite film formed over carbon steel in dilute organic acid media. J. Nucl. Mater. 2001, 289, 281–290. [Google Scholar] [CrossRef]
- Ramesh, C.; Murugesan, N.; Prince, A.A.M.; Velmurugan, S.; Narasimhan, S.V.; Ganesan, V. Applied of polymer electrolyte based hydrogen sensor to study corrosion of carbon steel in acid medium. Corros. Sci. 2001, 43, 1865–1875. [Google Scholar]
- Bignold, G.J.; Garbett, K.; Garnsey, R.; Woolsey, I.S. Erosion corrosion of nuclear steam generators, water chemistry of nuclear reactor systems 2. Br. Nucl. Energy Soc. 1981, 1, 5–18. [Google Scholar]
- Marks, C. Steam Generator Management Program: Effects of Different pH Control Agents on Pressurized Water Reactor Plant Systems and Components; EPRI: Palo Alto, CA, USA, 2009. [Google Scholar]
- Vepsäläinen, M.; Saario, T. Magnetite Dissolution and Deposition in NPP Secondary Circuit; VTT Technical Research Centre of Finland (VTT): Espoo, Finland, 2010. [Google Scholar]
- Robert, D.V., Jr. Deposit accumulation in PWR steam generators. In Steam Generators for Nuclear Power Plants; Woodhead Publishing: Cambridge, UK, 2017; Volume 11, pp. 323–363. [Google Scholar]
- Turner, C.W.; Khumsa-Ang, K. Corrosion product transport and fouling in nuclear steam generators. In Steam Generators for Nuclear Power Plants; Woodhead Publishing: Cambridge, UK, 2017; Volume 9, pp. 215–271. [Google Scholar]
- Wolfe, R. Steam Generator Management Program: Steam Generator Deposit Removal Strategies Sourcebook; EPRI: Palo Alto, CA, USA, 2015. [Google Scholar]
- Turner, C.W.; Shamsuzzaman, K.; Tapping, R.L. Factors Affecting the Consolidation of Steam Generator Sludge; AECL-10759; AECL: Chalk River, ON, Canada, 1993. [Google Scholar]
- Turner, C.W.; Brimkie, M.E.; Lavoie, P.A. Physical and Chemical Factors Affecting Sludge Consolidation; AECL-611674; AECL: Chalk River, ON, Canada, 1997. [Google Scholar]
- Jeon, S.-H.; Song, G.D.; Hur, D.H. Micro-galvanic corrosion of steam generator materials within pores of magnetite flakes in alkaline solutions. Metals 2018, 8, 899. [Google Scholar] [CrossRef] [Green Version]
- Jeon, S.-H.; Shim, H.-S.; Lee, J.-M.; Han, J.O.; Hur, D.H. Simulation of porous magnetite deposits on steam generator tubes in circulating water at 270 °C. Crystals 2020, 10, 107486. [Google Scholar] [CrossRef]
- Yang, G.; Pointeau, E.; Tevissen, E.; Chagnes, A. A review on clogging of recirculating steam generators in pressurized-water reactors. Prog. Nucl. Energy 2017, 97, 182–196. [Google Scholar] [CrossRef] [Green Version]
- Tyapkov, V.F.; Erpyleva, S.F. Erpyleva. Water chemistry of the secondary circuit at a nuclear power station with a VVER power reactor. Thermal Eng. 2017, 64, 357–363. [Google Scholar] [CrossRef]
- Beal, K.; Million-Picallion, L.; Lefèvre, G.; Berger, G.; Delaunay, S.; Goujon, C.; Bretelle, J.-L. Formation and Consolidation of Hard Sludge under Secondary Circuit Conditions. In Proceedings of the 20th NPC International Conference, Brighton, UK, 2–7 October 2016; p. 138. [Google Scholar]
- Lee, J.-M.; Jeon, S.-H.; Kim, K.-S.; Han, J.O.; Hur, D.H. Effects of pH control agents on magnetite deposition on steam generator tubes. Ann. Nucl. Energy 2020, 143, 729. [Google Scholar]
- Lee, J.-M.; Jeon, S.-H.; Han, J.O.; Hur, D.H. Effects of NaCl on magnetite deposition on the outer surfaces of steam generator tubes. Ann. Nucl. Energy 2021, 151, 107886. [Google Scholar] [CrossRef]
- Millett, P. PWR Advanced Amine Application Guidelines-Revision 2; TR-102952-R2; EPRI: Palo Alto, CA, USA, 1997. [Google Scholar]
- Turner, C. Identification and Testing of Amines for Steam Generator Chemistry and Deposit Control; EPRI: Palo Alto, CA, USA, 2002. [Google Scholar]
- Varrin, R. Characterization of PWR Steam Generator Deposits; TR-106048; EPRI: Palo Alto, CA, USA, 1996. [Google Scholar]
- Fruzzetti, K. Multivariable Assessment of Flow Accelerated Corrosion and Steam Generator Fouling, Literature Review; EPRI: Palo Alto, CA, USA, 2003. [Google Scholar]
- Fruzzetti, K. Pressurized Water Reactor Secondary Water Chemistry Guidelines-Revision 8; EPRI: Palo Alto, CA, USA, 2017. [Google Scholar]
- Vijayakumar, R.; Koltypin, Y.; Felner, I.; Gedanken, A. Gedanken. Sonochemical synthesis and characterization of pure nanometer-sized Fe3O4 particles. Mater. Sci. Eng. A. 2000, 286, 101–105. [Google Scholar] [CrossRef]
- Gotić, M.; Musić, S. Synthesis of nanocrystalline iron oxide particles in the iron(III) acetate/alcohol/acetic acid system. Eur. J. Inorg. Chem 2008, 6, 966–973. [Google Scholar] [CrossRef]
- Fruzzetti, K. Multivariable Assessment of Flow Accelerated Corrosion and Steam Generator Fouling, Loop Tests to Investigate the Role of Dissolved Iron in Steam Generator Fouling; EPRI: Palo Alto, CA, USA, 2006. [Google Scholar]
- Dooley, R.B. Flow-accelerated corrosion in fossil and combined cycle/HRSG plants. Powerpl. Chem. 2008, 10, 68–89. [Google Scholar]
- Cullity, B.D. Elements of X-Ray Diffraction; Addision-Wesley: Reading, MA, USA, 1978. [Google Scholar]
- Carlson, J.J.; Kawatra, S.K. Factors affecting zeta potential of iron oxides. Miner. Process. Extr. Metall. 2013, 34, 269–303. [Google Scholar] [CrossRef]
- Ohshima, H. Zeta potential. In Encyclopedia of Colloid and Interface Science; Tadros, T., Ed.; Publisher: Berlin/Heidelberg, Germany, 2013; pp. 1423–1436. [Google Scholar]
- Shim, H.-S.; Park, M.-S.; Baek, S.H.; Hur, D.H. Effect of aluminum oxide coated on fuel cladding surface on crud deposition in simulated PWR primary water. Ann. Nucl. Energy 2018, 121, 607–614. [Google Scholar] [CrossRef]
- Choi, W.-I.; Song, G.D.; Jeon, S.-H.; Kim, S.J.; Hur, D.H. Magnetite-accelerated stress corrosion cracking of alloy 600 in water containing 100 ppm lead oxide at 315 °C. J. Nucl. Mater. 2019, 522, 54–63. [Google Scholar] [CrossRef]
- Millet, P.J.; Fenton, J.M. A Detailed Model of Localized Concentration Processes in Porous Deposits of SGs. In Proceedings of the 5th International Symposium on Environmental Degradation of Materials in Nuclear Power Systems-Water Reactors, Monterey, CA, USA, 25–29 August 1991; pp. 745–751. [Google Scholar]
- Paine, J.P.N.; Hobart, S.A.; Sawochka, S.G. Predicting Steam Generator Crevice Chemistry. In Proceedings of the 5th International Symposium on Environmental Degradation of Materials in Nuclear Power Systems-Water Reactors, Monterey, CA, USA, 25–29 August 1991; pp. 739–744. [Google Scholar]
- Plonski, I.J. Effect of bare metal surface on the dissolution in aqueous citrate solutions of magnetite films on carbon steel. J. Appl. Electrochem. 1997, 27, 1184–1192. [Google Scholar] [CrossRef]
- Song, G.D.; Jeon, S.-H.; Kim, J.G.; Hur, D.H. Synergistic effect of chloride ions and magnetite on the corrosion of Alloy 690 in alkaline solutions. Corros. Sci. 2017, 131, 71–80. [Google Scholar]
- Xia, D.-H.; Behnamian, Y.; Luo, J.-L. Review—Factors influencing sulfur induced corrosion on the secondary side in pressurized water reactors (PWRs). J. The Electrochem. Soc. 2019, 166, C49–C64. [Google Scholar] [CrossRef]
- Turner, C.W.; Klimas, S.J.; Brideau, M.G. Thermal resistance of steam-generator tube deposits under single-phase forced convection and flow-boiling heat transfer. Can. J. Chem. Eng. 2000, 78, 53–60. [Google Scholar]
- Smith, D.S.; Alzina, A.; Bourret, J.; Nait-Ali, B.; Pennec, F.; Tessier-Doyen, N.; Otsu, K.; Matsubara, H.; Elser, P.; Gonzenbach, U.T. Thermal conductivity of porous materials. J. Mater. Res. 2013, 28, 2260–2272. [Google Scholar] [CrossRef] [Green Version]
- Jeon, S.-H.; Hong, S.; Kwon, H.-C.; Hur, D.H. Characteristics of steam generator tube deposits in an operating pressurized water reactor. J. Nucl. Mater. 2018, 507, 371–380. [Google Scholar] [CrossRef]
- Essi, J.; Konsta, S.; Timo, S. Determining Zeta Potential of Magnetite Particles in PWR Secondary Side Water Treated with Ammonia or Ethanolamine by Using Streaming Potential Technique. In Proceedings of the 20th NPC International Conference, Brighton, UK, 2–7 October 2016; p. 151. [Google Scholar]
- Vidojkovic, S.M.; Rakin, M.P. Surface properties of magnetite in high temperature aqueous electrolyte solutions: A review. Adv. Colloid Interface Sci. 2017, 245, 108–129. [Google Scholar] [CrossRef]
- Matthew, M.A. Methodology for Developing Chemical Exposure Guidelines for Deployed Military Personnel; USAPHC: Palo Alto, CA, USA, 2009. [Google Scholar]
- Klimas, S.J.; Fruzzetti, K.; Turner, C.W.; Balakrishnan, P.V.; Strati, G.L.; Tapping, R.L. Identification and testing of amines for steam generator corrosion and fouling control. In Proceedings of the ECI Conference on Heat Exchanger Fouling and Cleaning: Fundamentals and Applications, Santa Fe, NM, USA, 18–22 May 2003. [Google Scholar]


| pH Control Agent | Chemical Formula | Density (g/cm3) | Boiling Point (°C) | Basicity (pK) | Half-Life Times at 185 °C (min) | |
|---|---|---|---|---|---|---|
| 25 °C | 275 °C | |||||
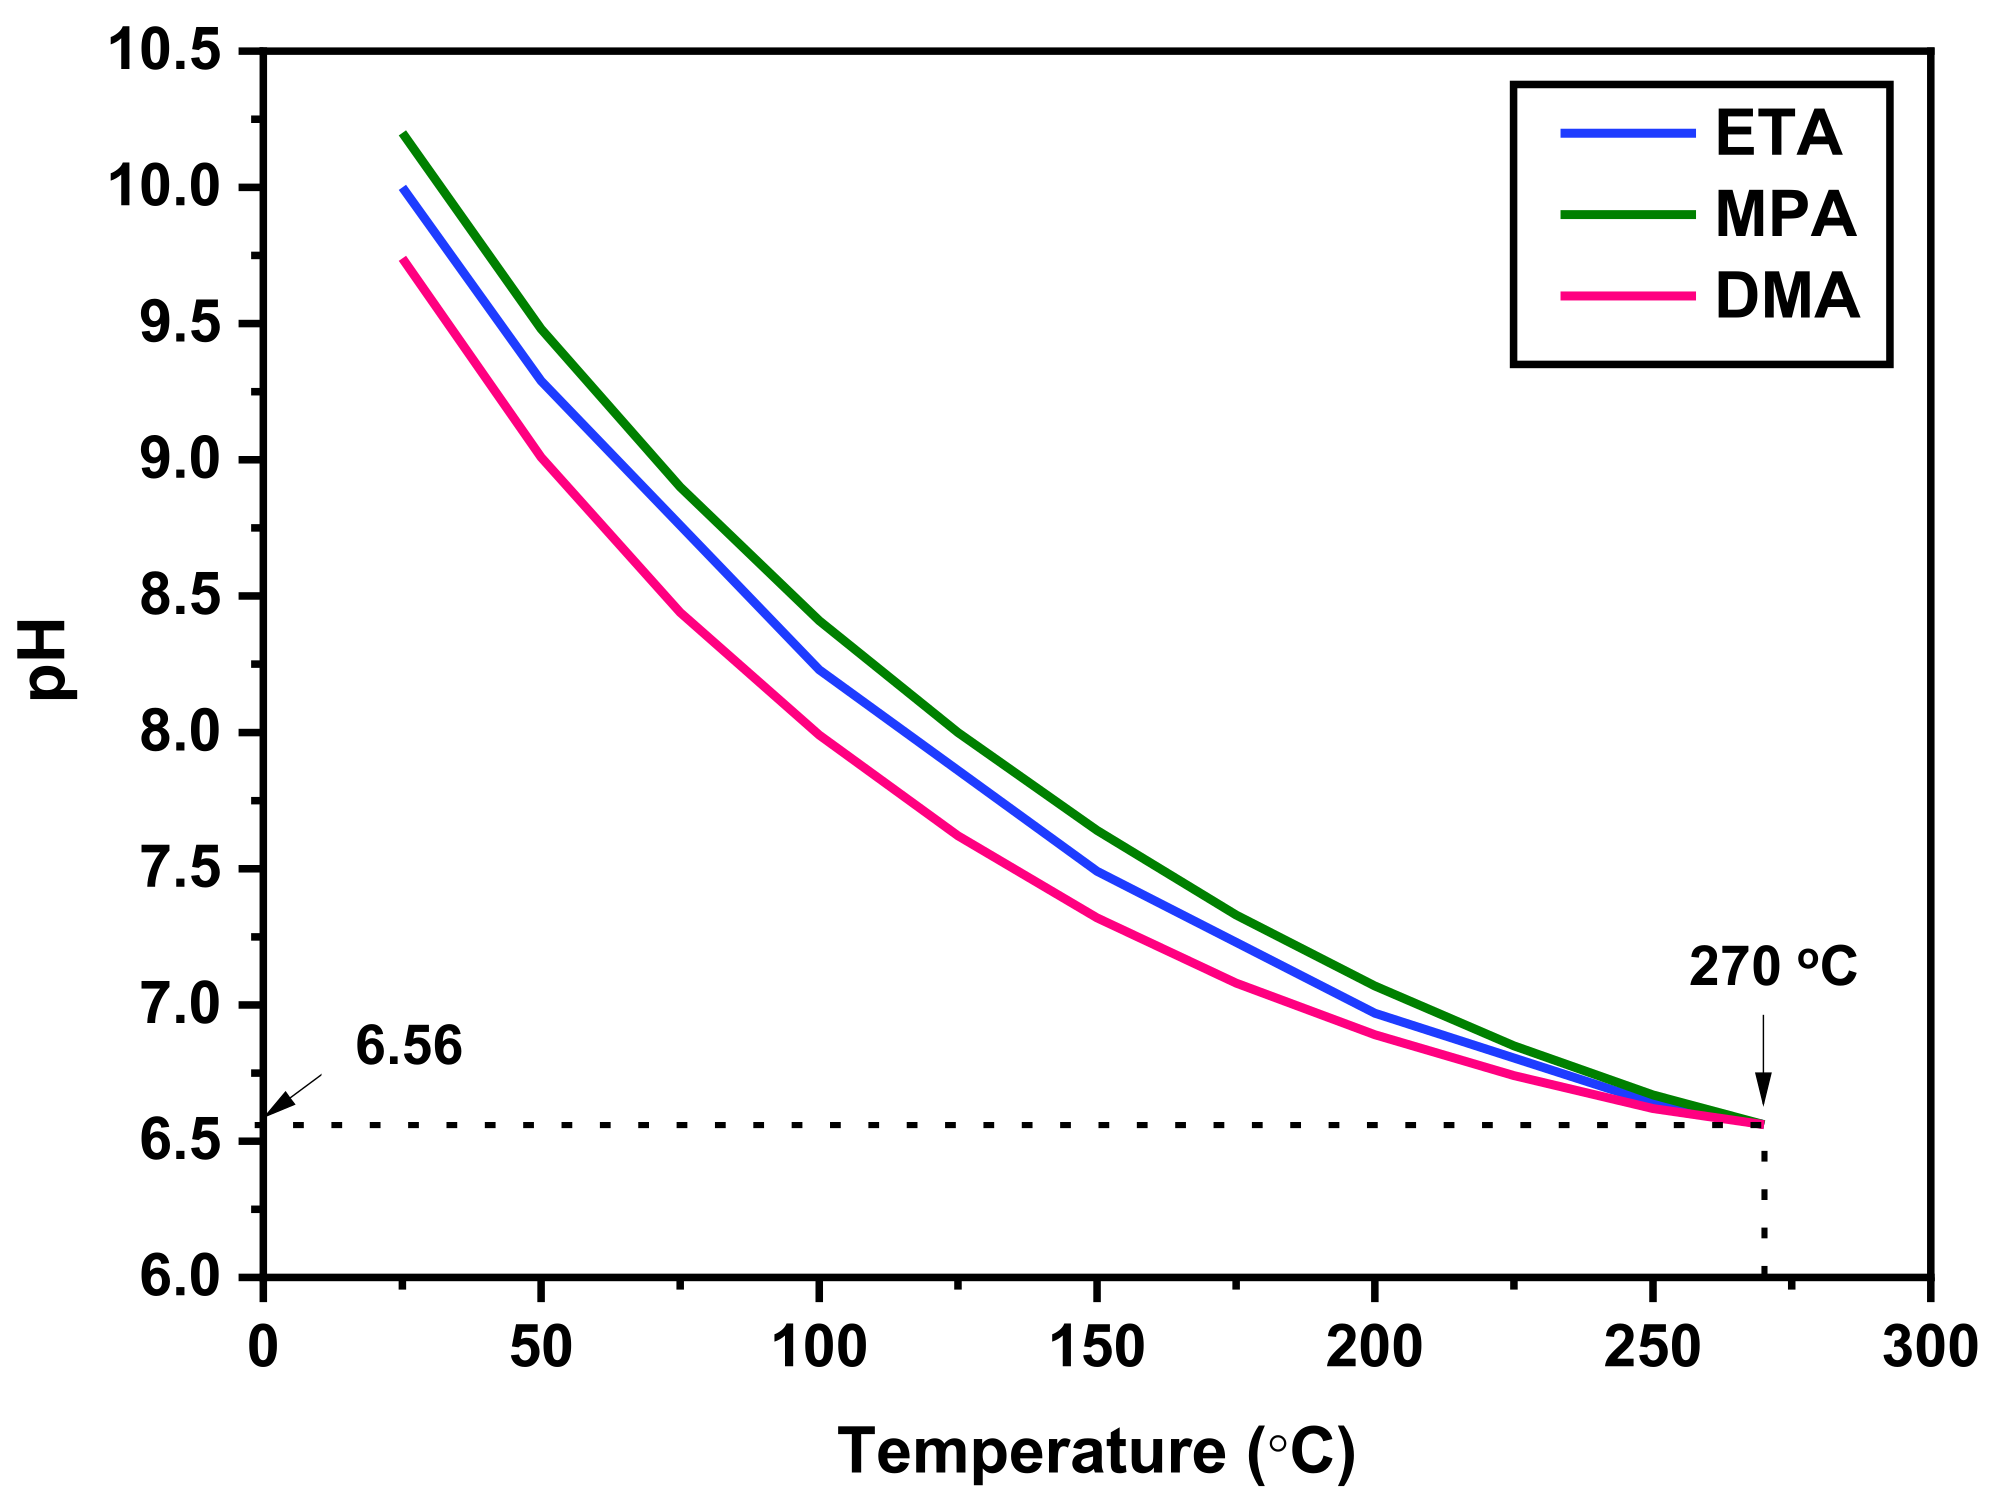
| ETA | C2H7NO | 1.01 | 170 | −9.50 | −5.25 | 5 |
| MPA | CH3O(CH2)3NH2 | 0.87 | 135 | −9.88 | −5.16 | 4 |
| DMA | (CH3)2NH | 0.67 | 7 | −10.78 | −6.25 | 35 |
| Cr | Fe | Si | Mn | Ti | Al | Cu | Co | C | Ni |
|---|---|---|---|---|---|---|---|---|---|
| 29.3 | 10.4 | 0.3 | 0.3 | 0.3 | 0.2 | 0.01 | 0.01 | 0.02 | 59.16 |
| Peaks | ETA | MPA | DMA |
|---|---|---|---|
| D220 | 1.019 | 0.863 | 0.746 |
| D311 | 1.022 | 0.862 | 0.733 |
| D400 | 1.021 | 0.858 | 0.742 |
| D422 | 0.990 | 0.772 | 0.839 |
| D511 | 0.901 | 0.784 | 0.696 |
| D440 | 0.929 | 0.759 | 0.715 |
| Average | 0.980 | 0.816 | 0.745 |
| pH Agent | Environmental Problem | Integrity of SG | Human Hazard | ||||
|---|---|---|---|---|---|---|---|
| Number of Atoms of C, N | Basicity (pK) | Relative Volatility (RV) | Amount of Deposits (mg/dm2) | Porosity of Deposits (%) | Concentration of Exposed in Air (mg/m3∙h) | ||
| 25 °C | 275 °C | ||||||
| ETA | C:2, N:1 | −9.50 | −5.25 | <1 | 209.83 | 34.7 | 75 |
| MPA | C:4, N:1 | −9.88 | −5.16 | =1 | 124.01 | 33.0 | 150 |
| DMA | C:2, N:1 | −10.78 | −6.25 | >1 | 94.01 | 24.6 | 460 |
Publisher’s Note: MDPI stays neutral with regard to jurisdictional claims in published maps and institutional affiliations. |
© 2021 by the authors. Licensee MDPI, Basel, Switzerland. This article is an open access article distributed under the terms and conditions of the Creative Commons Attribution (CC BY) license (https://creativecommons.org/licenses/by/4.0/).
Share and Cite
Lee, Y.-B.; Lee, J.-M.; Hur, D.-H.; Lee, J.-H.; Jeon, S.-H. Effects of Advanced Amines on Magnetite Deposition of Steam Generator Tubes in Secondary System. Coatings 2021, 11, 514. https://doi.org/10.3390/coatings11050514
Lee Y-B, Lee J-M, Hur D-H, Lee J-H, Jeon S-H. Effects of Advanced Amines on Magnetite Deposition of Steam Generator Tubes in Secondary System. Coatings. 2021; 11(5):514. https://doi.org/10.3390/coatings11050514
Chicago/Turabian StyleLee, Yong-Beom, Ji-Min Lee, Do-Haeng Hur, Jong-Hyeon Lee, and Soon-Hyeok Jeon. 2021. "Effects of Advanced Amines on Magnetite Deposition of Steam Generator Tubes in Secondary System" Coatings 11, no. 5: 514. https://doi.org/10.3390/coatings11050514