Article

High-Speed Laser Cladding on Thin-Sheet-Substrates—Influence of Process Parameters on Clad Geometry and Dilution

Department for Cutting and Joining Manufacturing Processes, Institute for Production Technologies and Logistics, University of Kassel, Kurt-Wolters-Straße 3, 34125 Kassel, Germany
*
Author to whom correspondence should be addressed.
Coatings 2021, 11(8), 952; https://doi.org/10.3390/coatings11080952
Submission received: 20 July 2021 / Revised: 3 August 2021 / Accepted: 5 August 2021 / Published: 9 August 2021
(This article belongs to the Special Issue The Applications of Laser Processing and Additive Manufacturing)

Abstract

:
Laser-based Directed Energy Deposition (DED-LB) represents a production method of growing importance for cladding and additive manufacturing through the use of metal powders. Yet, most studies utilize substrate materials with thicknesses of multiple millimeters, for which laser cladding of thin-sheet substrates with thicknesses less than 1 m m have only been scarcely studied in the literature. Most studies cover the use of pulsed laser sources, since sheet distortion due to excess energy input is a key problem in laser cladding of thin-sheet substrates. Hence, the authors of the present investigation seek to expand the boundaries of cladding thin-sheet substrates through the use of a high-speed laser cladding approach which utilizes a continuous-wave, ytterbium fiber laser and traverse speeds of 90 m m s 1 to clad stainless steel sheets with a thickness of 0.8 m m . Furthermore, fundamental process–property relationships for the target values of clad width, clad height, and dilution depth are studied and thoroughly discussed. Additionally, process maps for the target values are established based on manifold experiments, and the significance of process parameters on target values is studied using analysis of variance. The results demonstrate that clad widths as high as 1413 μm and dilution depths as low as 144 μm can be obtained by high-speed laser cladding of thin-sheet substrates. Thus, pathways toward thin-sheet substrates with enhanced performance are opened.

1. Introduction

Laser cladding is a production process which utilizes the continuous feed of powder or wire material and the focused energy of a laser beam to create metallurgically bonded, three-dimensional contours on manifold substrate materials [1]. Based on the localized heat input of the laser beam, partial melting of the substrate surface and simultaneous melting of the powder or wire material are achieved in the process zone, whereby a melt pool is established on the surface. Hence, minimal dilution with the substrate material and a refined clad microstructure are obtained [2]. As the melt pool moves on the substrate surface, a heat-affected zone is created beneath [3]. Based on these characteristics, laser cladding can be used to repair existing structures [4,5], add protective layers against corrosive or abrasive wear [6], and—if the cladding process is carried out repeatedly—perform additive manufacturing of monolithic materials, such as nickel-alloys [7]. Moreover, powder-based laser cladding may also be used to fabricate multi-material structures through an in-process adaption of powder flow [8,9]. Based on the use of a locally focused heat source, laser cladding is classified as an additive manufacturing process with Directed Energy Deposition (DED) in ISO 52900 [10]. Nonetheless, laser cladding is, in the literature, often referred to as Laser Metal Deposition (LMD) or Laser Engineered Net Shaping (LENS).
Typically, laser cladding is performed on substrates with thicknesses of multiple millimeters, such as cylinders [11,12] or plates [13,14]. The application of laser cladding on thin-sheet substrates was first reported by Burmester et al. [15] and has only been scarcely studied in the literature for sheets with a thickness below 10 m m [16,17], as well as below 1 m m [15,18,19]. As the use of high-power, continuous-wave (cw) lasers have yielded excess energy input and distortion, Burmester et al. [15] employed a pulsed Nd:YAG-laser to limit the energy input and a chilled clamping device, which allows for cooling of the sheet during laser cladding. As a result, they were able to obtain NiCrSiB-clads with a height/width ratio of up to 0.88. Moreover, Burmester et al. [15] stated that the process was more sensitive to the influence of process parameters due to possible instabilities of the melt pool and distortion of the sheet. In consequence of these results, Corbin et al. [16] also employed a pulsed Nd:YAG-laser to clad iron-aluminide on mild steel plates with a thickness of 5 m m . With a focus on solidification and microstructural evolution, a pulsed Nd:YAG-laser was also used by Farnia et al. [17] to clad pre-placed Stellite 6 powder on sheets of low-carbon steel. Laser systems operating in cw-mode were first used for cladding of sheet metal by Gabriel et al. [18] and Tebaay et al. [19]. While Gabriel et al. [18] used an ytterbium-fiber laser with powers up to 82 W to clad cobalt-based powder onto Inconel 718 substrates with a thickness of 0.2   m m , Tebaay et al. [19] investigated the use of a 2.5   k W diode-laser for cladding of AISI 316L powder on a DC01 sheet in either cold-rolled steel or a condition after incremental sheet-forming. The use of laser cladding for reinforcement of aluminum [20] or steel sheets [21,22] prior to forming operations has also recently attracted pronounced attention.
While Gabriel et al. [18] reported that the influence of process parameters during laser cladding of thin-sheet substrates was similar to the effects observed when cladding bulk substrates, the reader has to bear in mind that a maximum traverse speed of 1.67   m m was used, for which the literature review does not yet provide information about the cladding process of thin-sheet material with a thickness of less than 1 m m and very high traverse speeds of up to 90 m m s 1 . The importance of high traverse speeds for enhanced productivity in laser cladding has been supported by the recent development of the extreme high-speed laser material deposition technique (EHLA) [3,12]. Yet, fundamental process–property relationships during the laser cladding of thin sheets with high traverse speeds have not been documented in the literature. It remains unclear in which manner the clad geometry is affected by the reflecting surface of thin-sheet substrates and to which degree the mechanisms of absorption and reflection during laser material processing [23] are thus transferable. For this reason, the authors of the present investigation seek to provide a thorough investigation of the interrelationships between clad geometry, dilution, and fundamental process parameters, for which process maps in resemblance to the ones provided by Bax et al. [24] shall be established.

2. Materials and Methods

2.1. Materials and Process Setup

As substrate material, sheets of titanium-stabilized, AISI 430Ti ferritic stainless steel with a thickness of 0.8   m m were used. The chemical composition of the substrate material is depicted in Table 1. The sheets were laser-cladded in cold-rolled and blank-annealed surface condition. For additional information about the used substrates and clamping devices, the reader may be referred to [25]. AISI 316L austenitic stainless steel with nominal powder size distributions of 20–53 μ m (GTV Verschleißschutz GmbH, Luckenbach, Germany), as well as 50–150 μ m (DEW Specialty Steel GmbH and Co. KG, Krefeld, Germany) were employed as feedstock. Measurements of the respective particle size distributions are illustrated in Figure 1. Moreover, the chemical composition of the two batches can be derived from Table 2.
For a continuous powder feed to the laser-cladding optics (Reis Lasertec MWO44, KUKA Industries GmbH & Co. KG, Aachen, Germany), a two-disc powder feeder (GTV PF2/2, GTV Verschleißschutz GmbH, Luckenbach, Germany) using Argon carrier-gas (grade 4.6, purity ≥ 99.996 %) was employed. As a powder-nozzle, a three-jet coaxial powder-nozzle (Fraunhofer ILT, Aachen, Germany) with a default standoff distance of 12 m m was used. A six-axis robot (Reis RV30-26, KUKA Industries GmbH & Co. KG, Obernburg, Germany) was utilized for the feed motion during laser cladding. As a laser source, a 2 k W , a continuous-wave ytterbium-fiber laser (IPG YLS-2000-S2, IPG Laser GmbH, Burbach, Germany) with a nominal wavelength of 1070 n m and multi-mode intensity profile was employed. The laser beam was guided to the modular cladding optics using a fiber with a diameter of 400 μ m . The use of the aforementioned, modular cladding optics enabled the utilization of interchangeable focal lenses with different focal lengths, whereby the beam diameter on the workpiece could be adjusted. A summary of the relevant optical characteristics is given in Table 3. In addition to the carrier gas, Argon shielding gas (grade 4.6, purity ≥ 99.996 %) was fed through the coaxial outlet of the powder-nozzle with different flow rates.

2.2. Design of Experiments

It has been shown that numerous process parameters, of which the most important are depicted in Table 4, pose an influence on the outcome of powder-based DED-LB processes [1,7]. This, on the other hand, hinders the use of full-factorial experimental designs to investigate underlying effects as the number of experiments is increased exponentially with an increase in parameters. In the present investigation, the authors seek to establish process maps for laser cladding of thin-sheet substrates in resemblance of the ones proposed by Bax et al. [24]. Thus, the relevant target values for these maps shall be described by the clad width b, the clad height h, and the dilution depth a.
As the number of parameters demonstrates, a full-factorial design may not be constructive to yield targeted or meaningful results from an engineering perspective. Therefore, the authors employed an iterative approach with multiple full-factorial designs in order to propose a holistic overview of the interdependencies. First, the inherent fluid mechanical mechanisms of the powder-nozzle are described through an analysis of the influence of carrier and shielding gas flow. For an overview of all experimental designs, the reader may be referred to Appendix A in the appendix of this paper. Based on the outcome of this characterization, two full-factorial designs, one for each laser beam diameter, were employed to investigate the inter-dependencies between linear energy input and powder mass flow with regard to the previously defined target values. Lastly, another full-factorial design was used to analyze the inter-dependencies between the nozzle standoff distance and focal offset of the laser beam, whereby the influence of laser and powder defocussing on the clad geometry could be studied. In order to realize high-productivity laser cladding, all experiments were performed with a traverse speed of 90 m m s 1 . Moreover, results were obtained for both powder size distributions, for which the effects of the latter could also be investigated. For each set of parameters, five repetitions were carried out to mitigate random errors. All results thus represent the mean value of five individual measurements.
Furthermore, one-way analysis of variance (ANOVA) was carried out for the full-factorial designs of laser power and mass flow with respect to the target values of clad width, clad height, and dilution depth. The significance level was set to a value of 0.05 for the calculations. One analysis of variance was carried out for each target value, powder size distribution, and influencing factor of laser power or mass flow, respectively. For the sake of readability, the results of the analysis of variance are depicted in Appendix B in the appendix of the paper. As zero hypothesis, it was assumed that the factor depicted in Table A7 and Table A8 did not possess an influence on the respective target value. This hypothesis could then be verified by the outcome of the analysis of variance.

2.3. Specimen Characterization

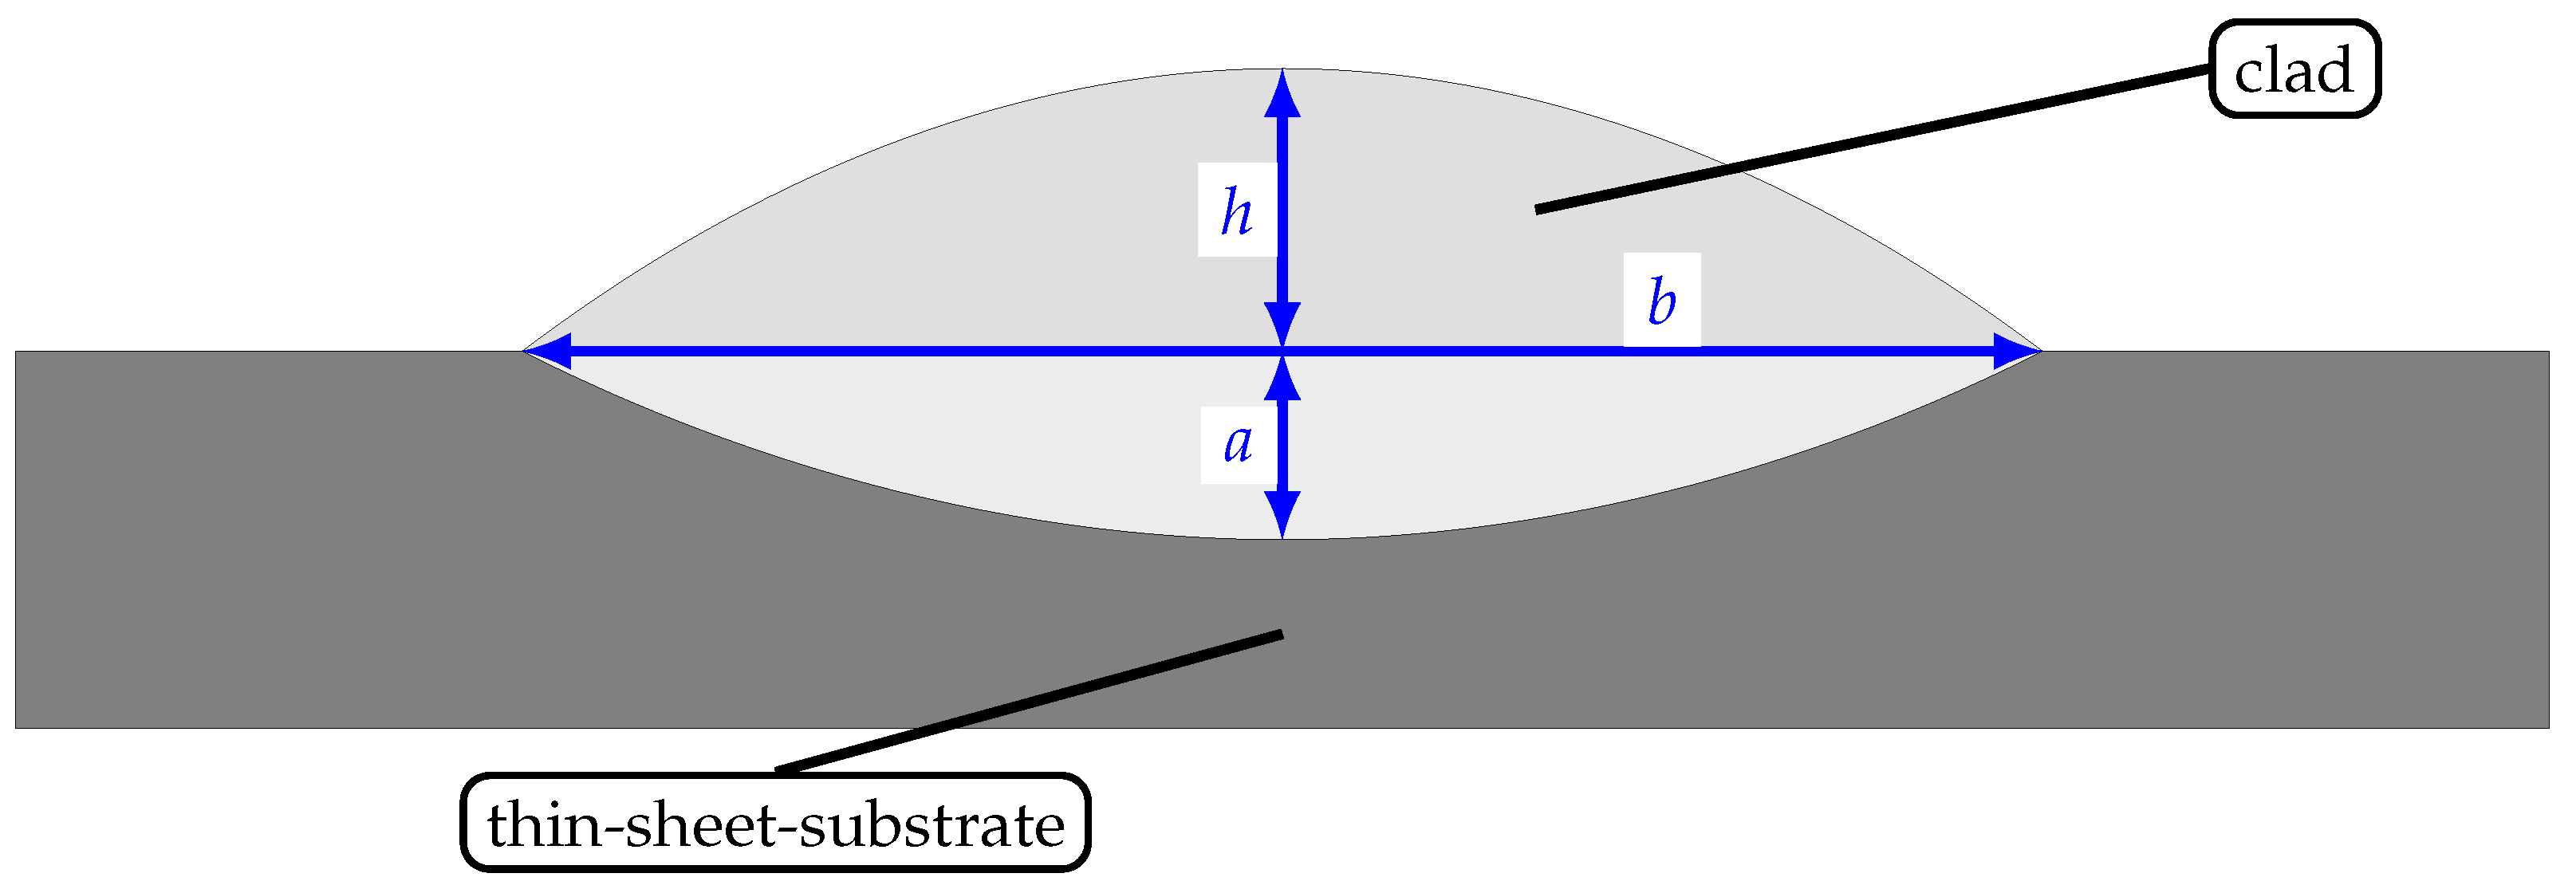
Following the cladding process, the specimens were cut perpendicular to the traverse direction using a wet-grinding machine and embedded in cold-curing mounting material. Subsequently, the specimens were ground with SiC-paper and polished with diamond-suspension (grit size 1 μ m ), which allowed for an inspection by optical microscopy (DM2600, Leica Microsystems GmbH, Wetzlar, Germany). Here, the target values of clad width, clad height, and dilution depth were measured and stored, as visualized in Figure 2.

3. Results and Discussion

3.1. Variation of Carrier and Shielding Gas Flow

The carrier gas flow is used to transport the powder particles to the process zone where they interact with the laser beam and—after solidification—form the clad geometry. Regarding powder efficiency, as the share of powder that is melted by the laser beam, for example, may vary [26,27], pronounced attention has to be given to the interaction volume of laser and powder. Under the assumption that no powder is lost during transportation from the powder feeder to the nozzle and that friction losses along the transportation may be neglected, a change in carrier gas flow can be directly correlated with additional particle velocity at the nozzle outlet based on the continuity equation of fluid mechanics [28].
The results of studies on the influence of carrier gas flow are depicted in Figure 3 and give an overview on the interdependencies of the latter and the clad geometry. The underlying experimental plan can be found in Table A2. Figure 3a,b demonstrate that the influence of carrier gas flow on clad width is negligible for a constant shielding gas flow, as both particle size distributions exhibit only minimal changes and an almost constant width along increasing carrier gas flow. Thus, it can also be concluded that the particle velocity at the nozzle outlet and, hence, the interaction time between the powder particle and laser beam only has a minimal influence on clad width. For both investigated particle size distributions, the clad width is represented by the laser beam diameter in good approximation, for which the laser beam diameter appears to be the relevant process parameter for clad widths, albeit changes in carrier gas flow.
This effect is constrained with regard to clad height (cf. Figure 3c,d). Firstly, it is to be observed that the particle size distribution exhibits a significant influence on clad height, as clads of the 50–150 μ m distribution are characterized by a reduced height when compared to the distribution of 20–53 μ m . This phenomenon can be attributed to the correspondingly higher packing density in a finer particle size distribution, such as 20–53 μ m , for a constant mass flow and the incumbent amplification of laser absorption in the interaction zone. Additionally, an increase in carrier gas flow corresponds to a decrease of clad height within the distribution of 20–53 μ m , which further supports the aforementioned findings. Obviously, the interaction times of the powder particle and laser beam pose a significant influence on phenomena of reflection and absorption when such fine powder materials are used. For a rather coarse powder, such as 50–150 μ m , the influence of carrier gas flow on clad height is negligible. Hence, an increased interaction time of the particles and laser beam does not allow for higher clads when such coarse powders are used.
Additionally, the dilution depth during laser cladding of thin-sheet substrates is characterized by interdependencies to carrier gas flow, as Figure 3e,f visualizes. For both powder size distributions, the dilution depth is minimal for a carrier gas flow of 5 L min 1 and subsequently increased by more carrier gas flow. Finally, the dilution depth is decreased again for high flow rates of 25 L min 1 . As the dilution depth directly corresponds to the depth of the melt pool, the results shown indicate that an increase of carrier gas flow furthers a deeper melt pool until a certain threshold is reached. The authors propose that, from this threshold onwards, the increase in carrier gas flow accounts for additional turbulence of the particle stream for which the melt pool and dilution depth are decreased again. Similar findings were presented by Zhong et al. [29] who proposed that particle velocity was the dominant factor for melt pool penetration depth when using a three-jet nozzle. Moreover, Shah et al. [30] reported an increase of melt pool depth for increasing carrier gas flows. Thus, it appears to be appropriate to conclude that these findings concur with the ones in the present investigation, for which they can be transferred to laser cladding of thin-sheet substrates.
As it was described in the preceding section, shielding gas is fed through the coaxial outlet of the powder-nozzle to prevent oxidation of the clad. Under the previous section’s analogue assumption that no shielding gas is lost during its feed through the optics, an increased shielding gas flow rate corresponds to a higher flow speed at the coaxial nozzle outlet. Further, the shielding gas flow is therefore directed towards the interaction zone of powder and laser focus, where it may manipulate the interaction of the latter, as it was proposed by Segerstark [7]. For this reason, it was to be investigated whether an increase of shielding gas flow had an influence on the target values for a given constant of carrier gas flow. Based on the prior results, carrier gas flows of 5 L min 1 and 10 L min 1 were further considered with variable shielding gas flows. The results of the investigation are depicted in Figure 4. As can be derived from Figure 4b, the clad width is insignificantly affected by an increase of shielding gas flow when coarse powder particles of 50–150 μ m and a carrier gas flow of 5 L min 1 are used. Yet, when higher carrier gas flows and, thus, higher particle velocities in the interaction zone are employed, shielding gas flow does exhibit an influence on clad width for particles of 50–150 μ m . While the clad width is somewhat constant for shielding gas flows to a threshold of 15 L min 1 , a sudden increase is observed afterwards. As a possible explanation, it is proposed that an increase in shielding gas flow may lead to turbulence, diversion of in-flight powder particles, and may therefore widen the powder focus. Finer powder particles of size 20–53 μ m also exhibit a threshold-value of 15 L min 1 after which the clad width is increased again with more shielding gas flow.
For a smaller particle diameter range of 20–53 μ m , the clad height is reduced with increasing shielding gas flow for both investigated carrier gas flows. Based on the fact that clad height is strongly dependent on the interaction time between lasers and powders, this can be seen as support of the preceding proposition that the shielding gas flow may interact with the carrier gas flow. Similar results can be identified for larger particle diameters of 50–150 μ m , even if the overall clad height is lower (cf. Figure 4d). Yet, for low carrier gas flows of only 5 L min 1 , a sudden increase in clad height can be observed when using 20 L min 1 of shielding gas flow.
With regard to dilution depth, somewhat similar results could be obtained for both particle size distributions. Firstly, lower dilution depths are obtained for lower carrier gas flows which undergirds the previous findings when varying carrier gas flow. Moreover, an increase in shielding gas flow leads to a reduction of dilution. Apparently, the use of larger shielding gas flow rates facilitates a shallower melt pool. In correlation with the previously seized suggestions of Zhong et al. [29], it can be concluded that an increase in shielding gas flow leads to increased interaction and, thus, turbulence with the carrier gas flow, for which the powder particles cannot penetrate the melt pool as deeply as before.
Based on the given particle-beam interaction during high-speed laser cladding of thin-sheet substrates, which was evaluated using varying carrier and shielding gas flows, further characterization was performed with a static shielding and carrier gas flow of 10 L min 1 and 5 L min 1 , respectively.

3.2. Influence of Laser Power and Mass Flow

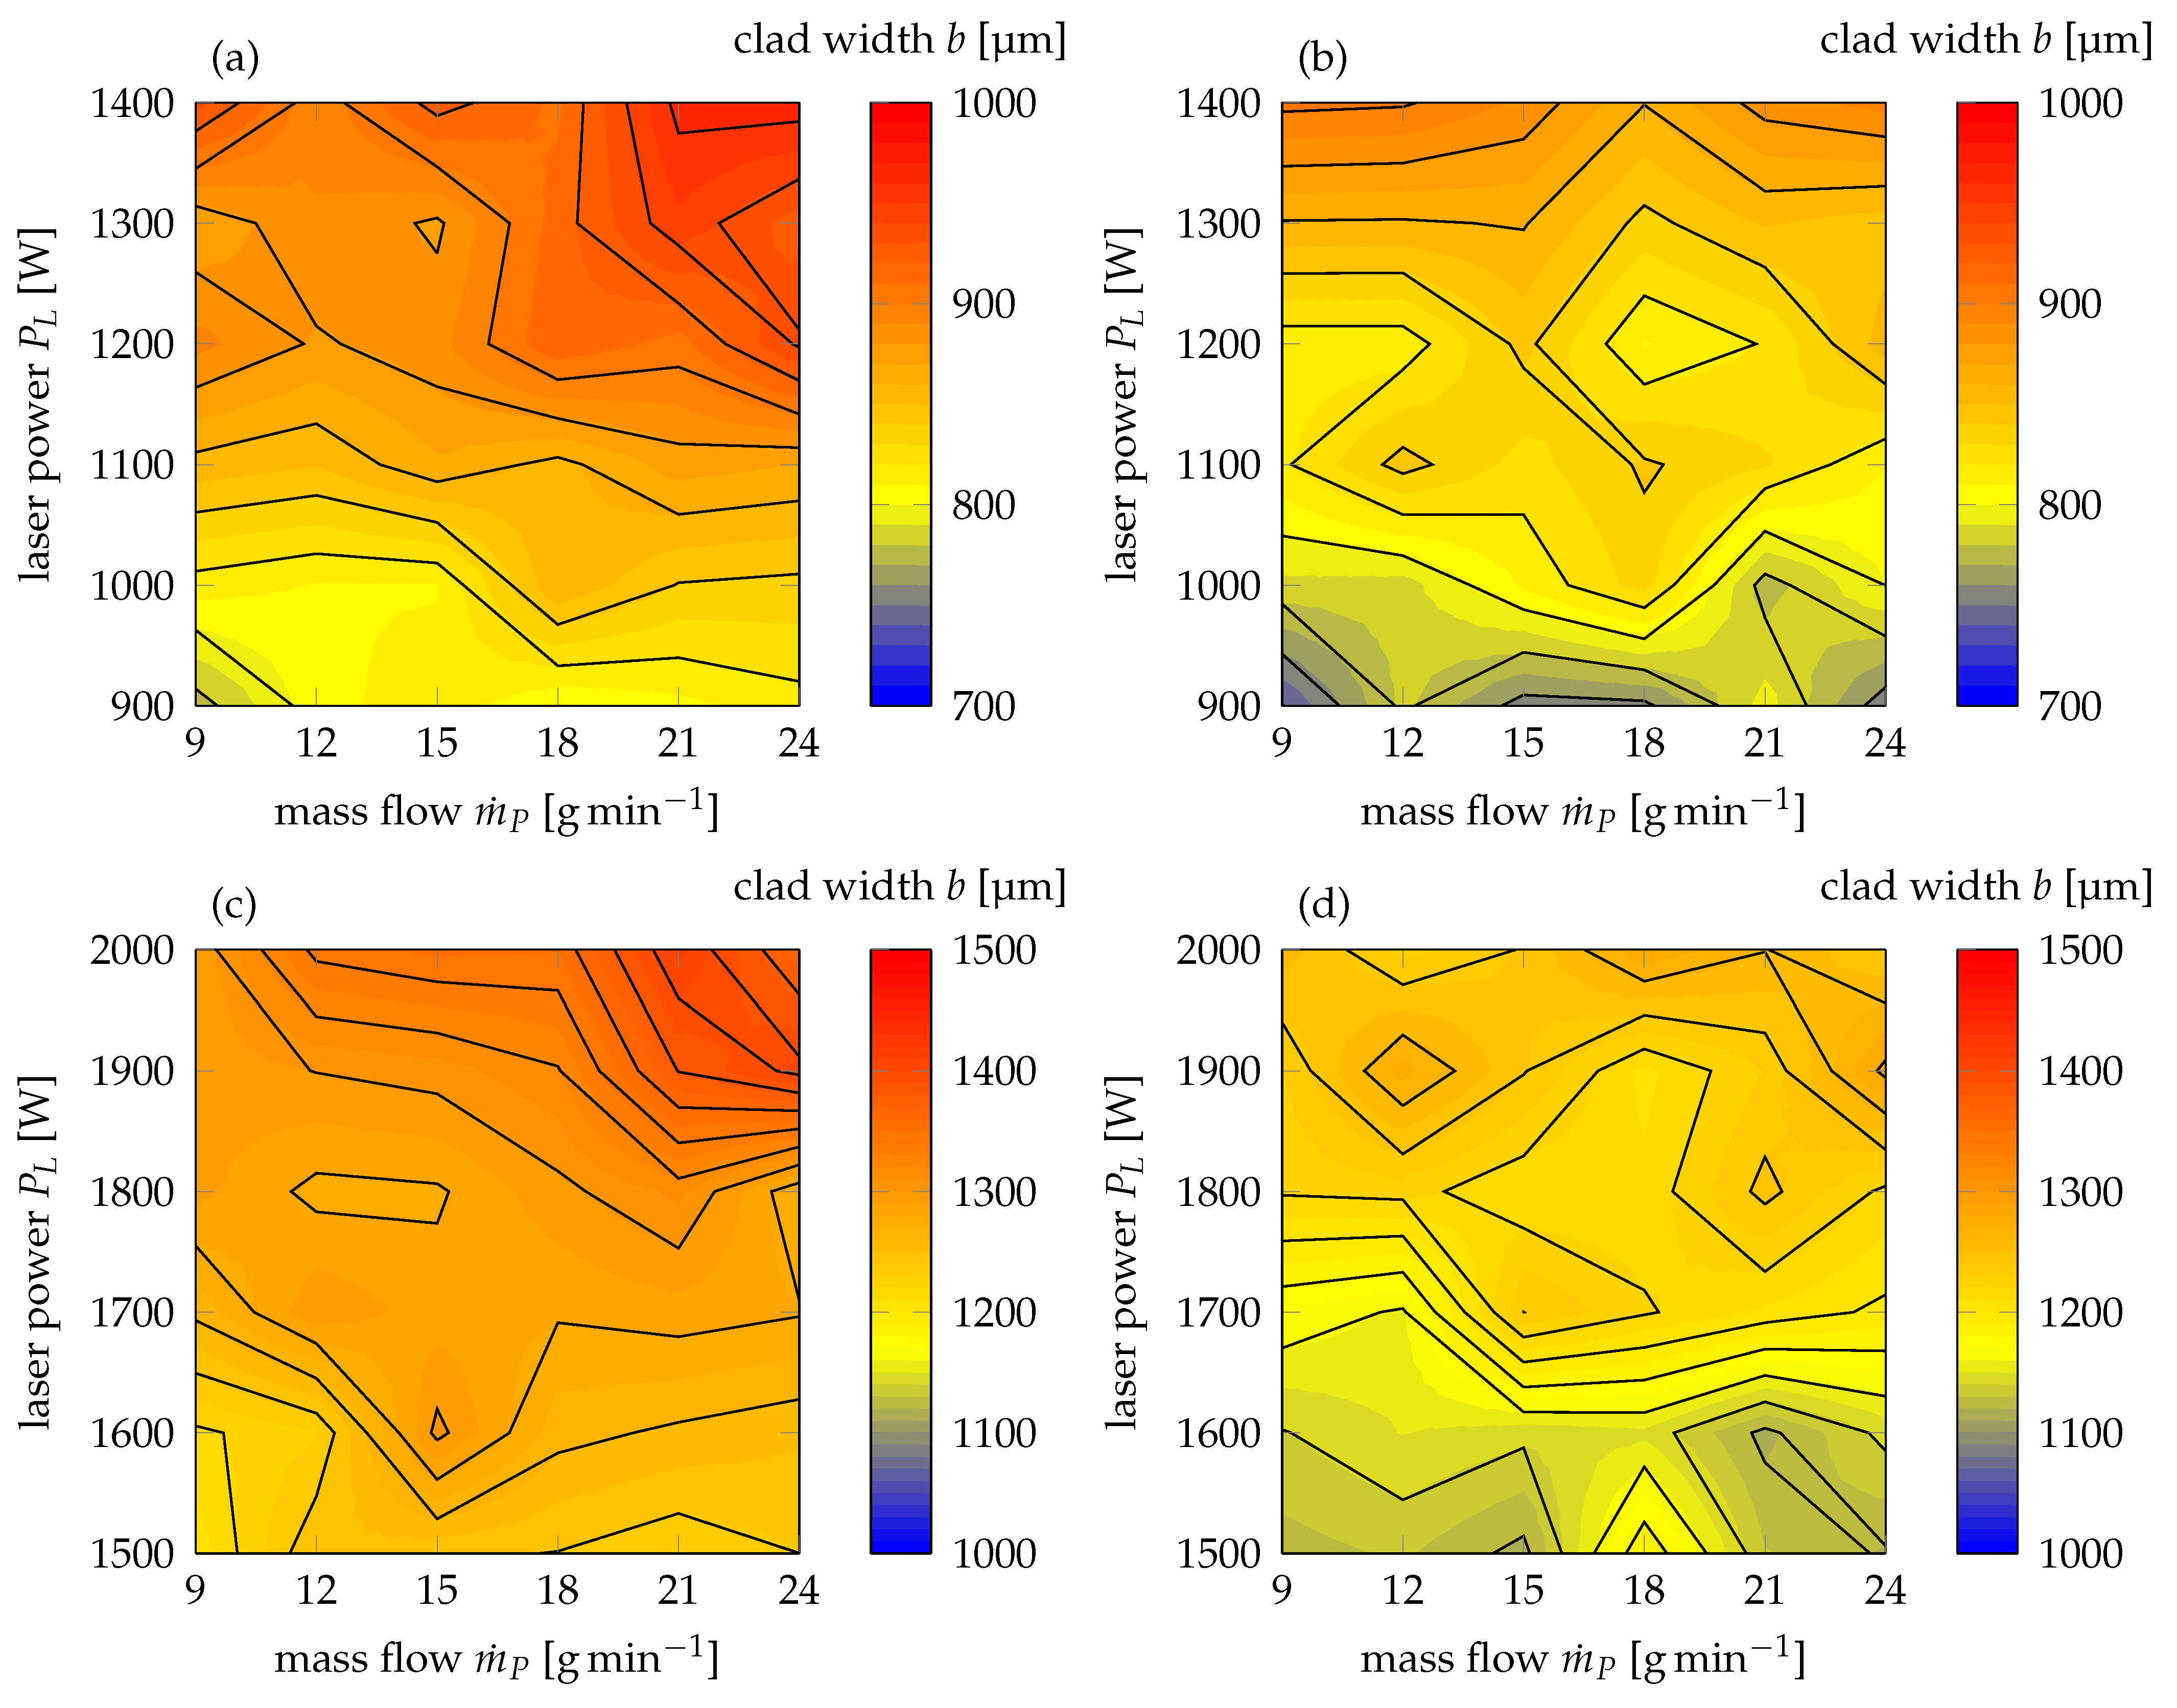
The use of full-factorial plans with regard to laser power P L and mass flow m ˙ P for each laser beam diameter yielded the establishment of process maps for high-speed laser cladding of thin-sheet substrates with a thickness of 0.8   m m . As can be derived from Figure 5a,b, the clad width for a constant laser beam diameter of 0.8   m m ranges from 740 μ m to 960 μ m depending on the utilized powder size distribution. The contour lines of a specific clad height can be approximated by constant ratios of laser power and mass flow. In this context, it is to be noted that for all given combinations of laser power and mass flow, the achievable clad width is higher for powder with a diameter of 20–53 μ m than for 50–150 μ m . Obviously, the finer powder particles lead to enhanced absorption during laser cladding of thin-sheets as phenomena, such as multiple reflection and, thus, absorption is promoted due to the higher packing density of the powder within the interaction volume. Additionally, the clad width extends farther as the laser beam diameter on the workpiece for both particle size distributions, for which heat conduction effects can be attributed. While for maximum laser power and mass flow of 1400 W and 24 g min 1 , respectively, a clad width of 966 μ m can be obtained for particles of size 20–53 μ m , the clad width only reaches 893 μ m for 50–150 μ m . As a result of this observation, the authors propose that the finer powder particles lead to pronounced re-reflection and absorption of laser light, for which the interaction zone on the workpiece, and, subsequently, the clad width are widened. In addition to that, it shall be noted that for very low laser powers of 900 W , the clad width is reduced to values below the actual laser beam diameter, albeit changes in mass flow for a powder size of 50–150 μ m . Obviously, this marks a threshold value for which insufficient melting of the substrate surface is reached. This observation is further supported by the results of the ANOVA in Table A7. The computed p-values of 1.1543 × 10 10 and 4.4505 × 10 12 (No. 1.1 and 1.3) with respect to laser power for a particle size distribution of 20–53 μ m and 50–150 μ m , respectively, emphasize that the laser power has a significant impact on clad width.
In order to maintain comparable intensities on the work piece, the range of investigated laser powers was adopted to 1500 W to 2000 W for a laser beam diameter of 1.2   m m . Corresponding results of the clad width measurements are to be found in Figure 5c,d, from which it can be deduced that the achievable clad width during high-speed laser cladding of thin-sheet substrates with a laser beam diameter of 1.2   m m ranges from 1116 μ m to 1413 μ m , depending on the utilized particle size distribution. Similar to a beam diameter of 0.8   m m , the contour lines of clad height can be approximated by almost constant ratios of laser power and mass flow. Additionally, the clad width is higher for all investigated combinations of laser power and mass flow when a finer particle size distribution of 20–53 μ m is used. For a maximum laser power of 2000 W and a mass flow of 24 g min 1 , a clad width of 1365 μ m and 1240 μ m can be obtained for particles of size 20–53 μ m and 50–150 μ m , respectively. This supports the proposition of the preceding paragraph that finer particles lead to increased reflection and absorption phenomena within the interaction volume of a laser beam and powder stream. Notably, the threshold values of laser power, under which the clad width falls below the laser beam diameter, lies around 1700 W for particles of size 50–150 μ m , while it does not fall short of the laser beam diameter for a size distribution of 20–53 μ m . In consideration of the identical behavior for a beam diameter of 0.8   m m , it can be concluded that the larger particles obviously lead to increased shading, for which somewhat limited amounts of laser light reach the substrate surface. Hence, it is proposed that the melt pool width on the surface and, thus, achievable clad width are reduced. Additionally, the computed p-values of the ANOVA (cf. Table A8 No. 1.1 and 1.3) affirm the significance of laser power for clad width, rather than mass flow.
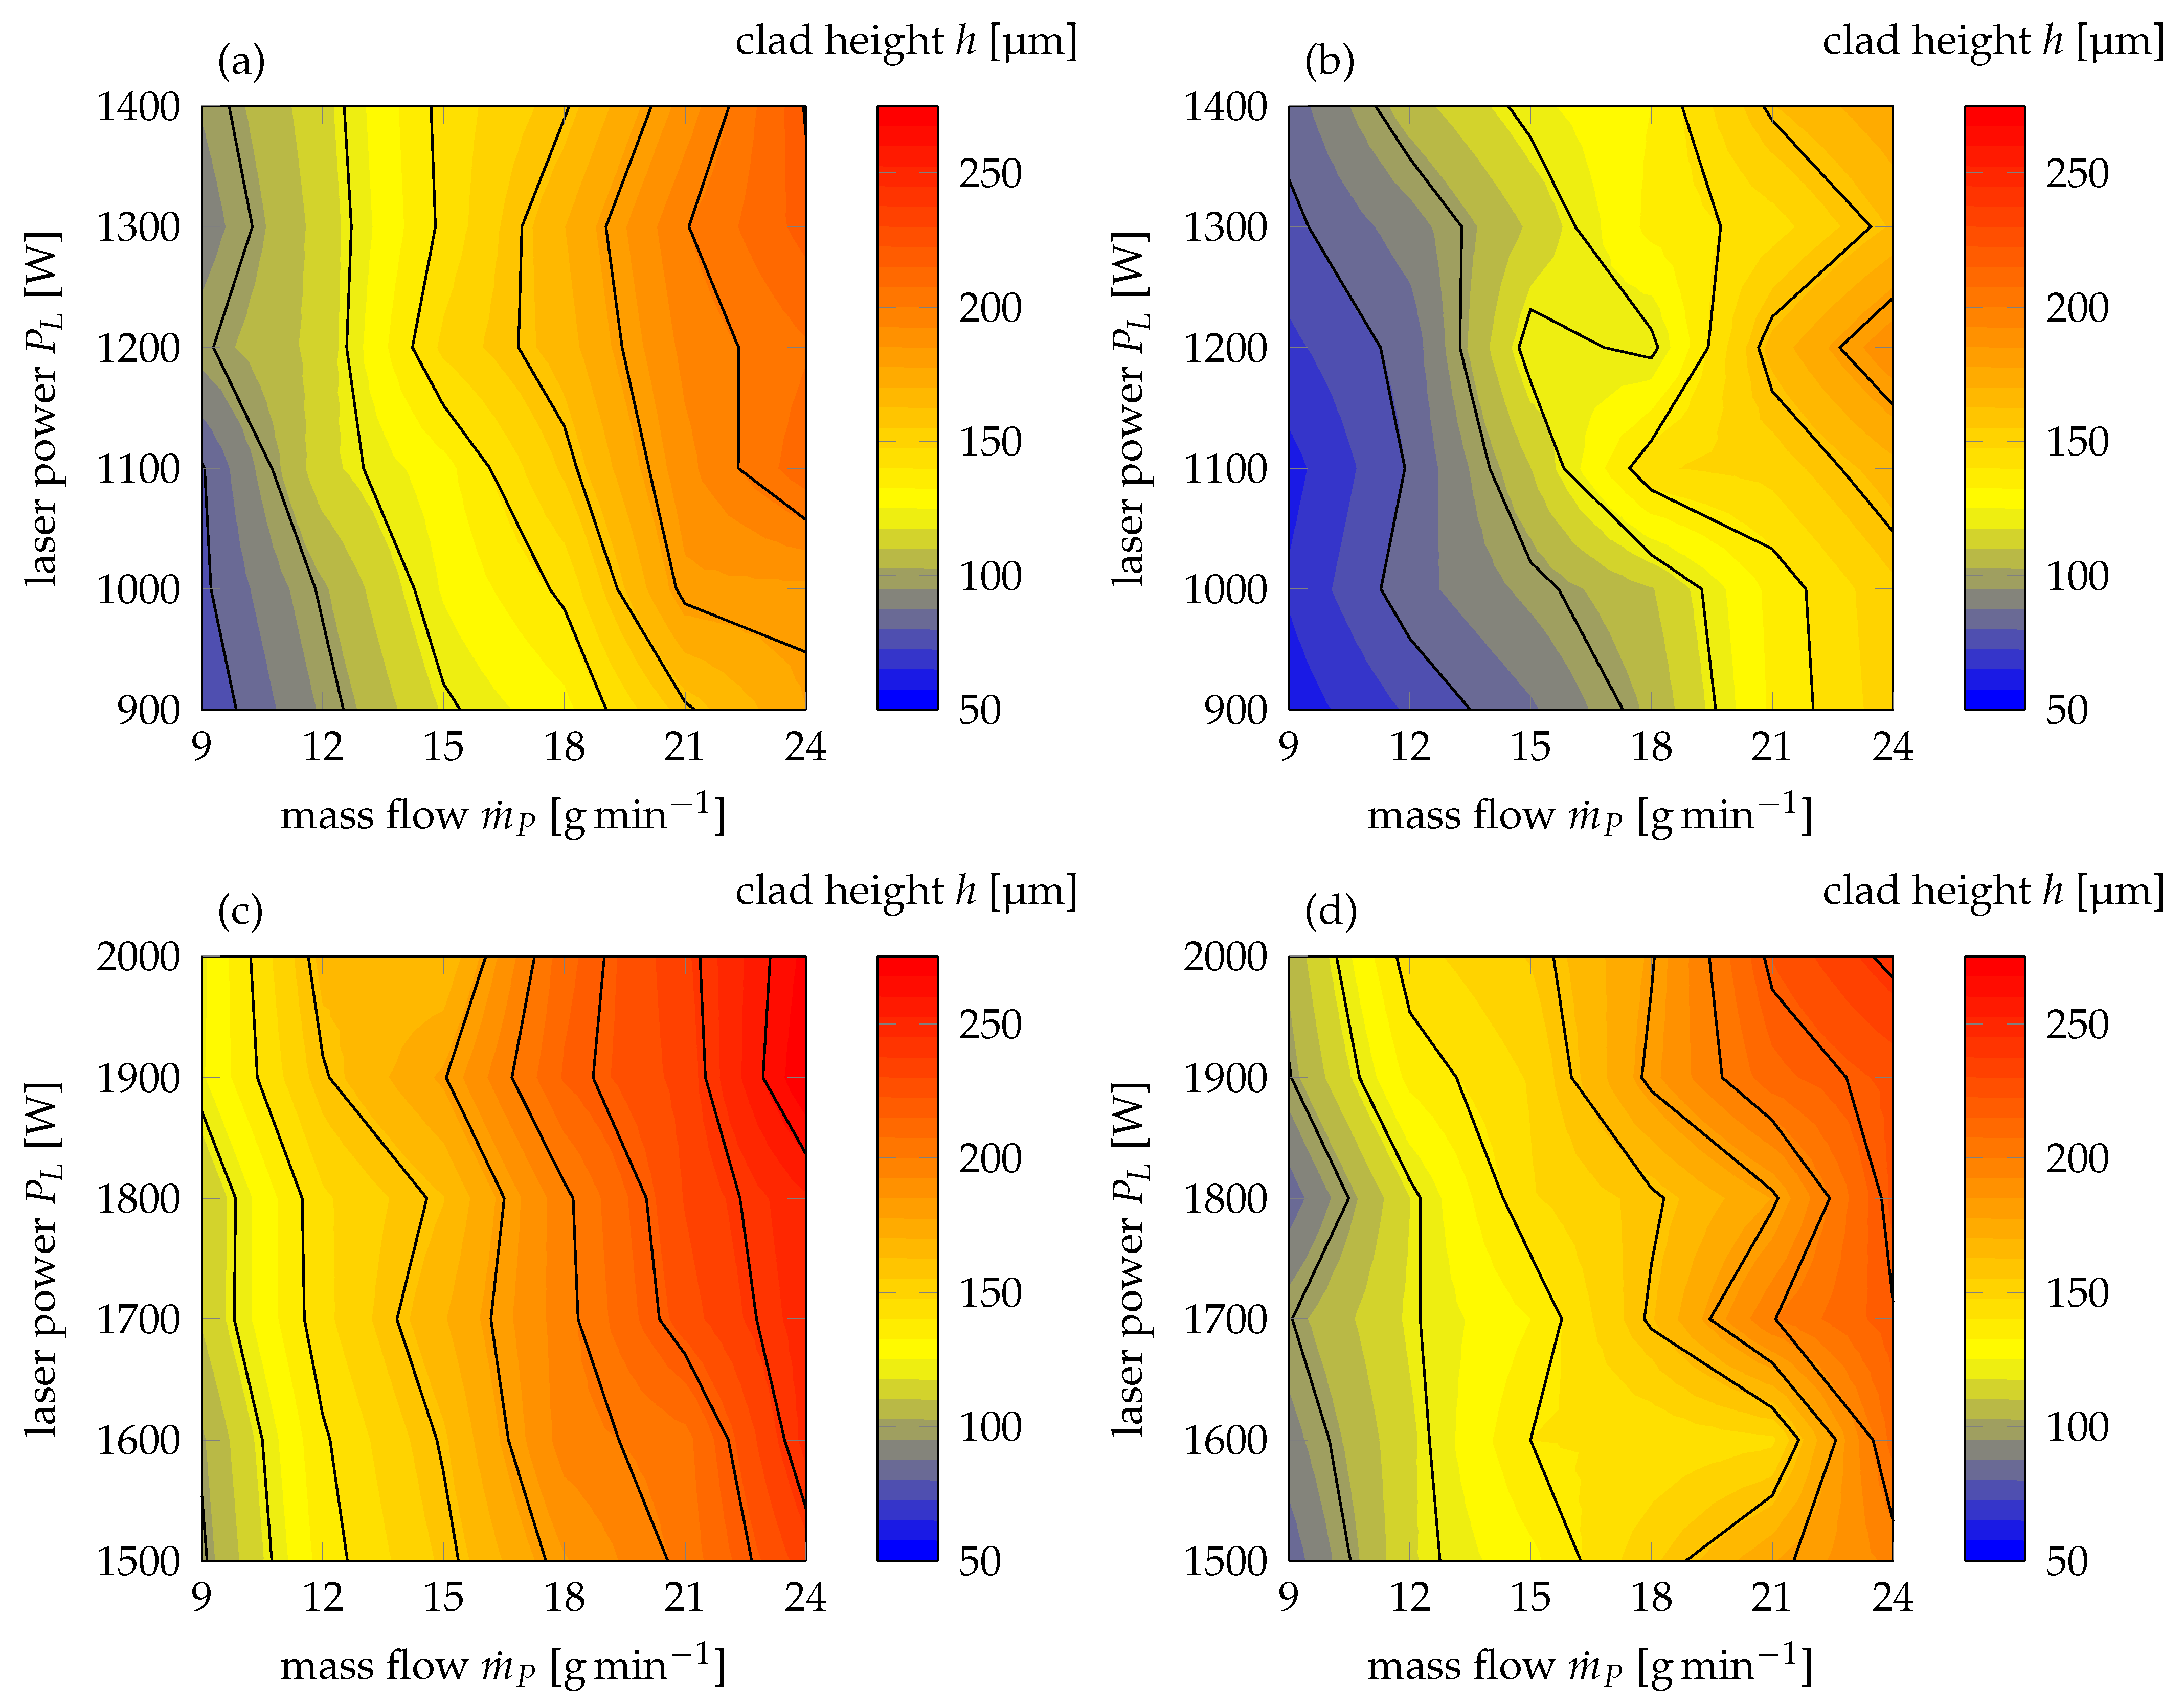
The clad height, on the other hand, exhibited different characteristics for a beam diameter of 0.8   m m , as can be deduced from Figure 6a,b. Clad heights ranging from 60 μ m to 220 μ m can be obtained during high-speed laser cladding of thin-sheet substrates in dependence on the powder size distribution employed. In contrast to the previous findings though, the contour lines of clad height within the established maps of laser power and mass flow proceed parallel to increasing laser power and perpendicular to an increase in mass flow. Hence, it is evident that powder mass flow is the dominant factor for achieving a desired clad height during high-speed laser cladding of thin-sheet substrates. This conclusion can also be supported by results of the ANOVA where p-values of mass flow are substantially below the significance level of 0.05 for all investigated particle size distributions (cf. Table A7 No. 2.2 and 2.4). Nonetheless, it can also be derived that for all given combinations of laser power and mass flow, the finer particle size of 20–53 μ m yields higher clads. Exemplary, the clad height for a laser power of 1200 W and a mass flow of 24 g min 1 is 191 μ m , when a powder size of 50–150 μ m is employed. When a finer particle size distribution is used, a clad height of 220 μ m can be achieved using the otherwise unchanged boundary conditions. For this reason, it can be concluded that the use of a finer particle size distribution amplifies the absorption of laser light and, thus, increases the clad height for which at a constant mass flow, the powder efficiency is obviously also enhanced.
Similar results can be obtained when a laser beam diameter of 1200 μ m is used, as Figure 6c,d illustrates. These observations can also be supported by the outcome of the ANOVA (cf. Table A8 No. 2.2 and 2.4). p-values of 2.3128 × 10 18 and 4.1007 × 10 13 emphasize the importance of powder mass flow for clad height during high-speed laser cladding of thin-sheet substrates. While the contour lines therefore feature an identical orientation as the ones observed for a beam diameter of 800 μ m , the overall achievable height is higher as compared to the smaller beam diameter for both investigated particle size distributions. An increase of clad width when using a larger laser beam diameter during high-speed laser cladding of thin-sheet substrates was to be expected on the basis of an elementary beam-matter interaction. Yet, the aforementioned findings also indicate that a larger beam diameter yields increased clad heights for all given mass flows independently of the laser power employed. From this, it can be derived that an increase of laser beam diameter not only increases the effective interaction volume perpendicular, but also parallel to the laser beam propagation direction, for which larger quantities of powder can be melted and, subsequently, form a higher clad. Through the utilization of a beam diameter of 1200 μ m , clad heights of up to 274 μ m at a laser power of 1900 W and a powder mass flow of 24 g min 1 can be achieved when using a powder size distribution of 20–53 μ m .
On the basis of the results illustrated in Figure 7a,b, the dilution depth during high-speed laser cladding of thin-sheet substrates is strongly dependent on both laser power and mass flow, as reachable values vary between 141 μ m and 330 μ m . From the orientation of the contour lines, the interdependencies of dilution depth, laser power and mass flow can be observed as counterpart to the interrelationships of the latter with clad width, which have been discussed before. Here, the contour lines proceed perpendicular to the contour lines of clad width, as well as perpendicular to constant ratios of laser power and mass flow. Interestingly, p-values of the ANOVA are below a significance level of 0.05 for laser power (cf. Table A7; No. 3.1 and 3.3) while ranging slightly above the significance level for mass flow (cf. Table A7; No. 3.2 and 3.4). Based on the ANOVA for mass flow, the interdependency of dilution depth and mass flow may be described as insignificant. Yet, when results of a laser beam diameter of 1200 μ m are taken into account as well (cf. Table A8 No. 3.2 and 3.4), it is evident that the mass flow does possess a significant influence on dilution depth as p-values reach 0.0142 and 0.0173. For that, it is to be summarized that if dilution is to be kept constant for a desired application, an increase in laser power should also incorporate a further increase of mass flow. Remarkably, the findings at the outmost parameter combinations within the process maps exhibit substantial differences with regard to the particle size distribution that is employed during cladding. As such, for a laser power of 1400 W and a mass flow of 9 g min 1 , the dilution depth is maximized for powder particles of 20–53 μ m at 330 μ m . Yet, at the given laser power and mass flow, the usage of a powder size distribution of 50–150 μ m yields a dilution depth of 315 μ m . Contrary to this, when the laser power is minimal at 900 W and mass flow is maximized at 24 g min 1 , the particle size distribution of 20–53 μ m only exhibits a dilution depth of 141 μ m as opposed to 163 μ m for a size of 50–150 μ m . As dilution depth directly correlates with laser power on the substrate surface for a constant mass flow, the observed differences can only be attributed to varying reflection and absorption phenomena in the interaction volume. For a comparatively low mass flow of 9 g min 1 and a particle size of 20–53 μ m , a larger number of powder particles is available to reflect the incoming laser light, for which multiple reflection to the substrate surface is amplified. On the contrary, as particle size is larger, a lesser number of surfaces is available to reflect the incident light. Further, as smaller powder particles heat up faster [26], additional residual laser energy is available to melt the substrate surface. When the mass flow is raised to 24 g min 1 , the packing density of a finer particle size distribution, such as 20–53 μ m , is substantially increased within the interaction volume for which a larger number of surfaces is available to reflect and re-absorb incident laser light as compared to particle sizes of 50–150 μ m . Therefore, the dilution depth is higher for a larger particle size distribution of 50–150 μ m at the maximum mass flow and minimal laser power investigated.
For a larger laser beam diameter of 1.2   m m , dilution varies between 176 μ m and 355 μ m for a powder size distribution of 20–53 μ m , as well as 208 μ m and 337 μ m for a particle size of 50–150 μ m . As can be derived from these results, the dilution depth is slightly increased as compared to a beam diameter of 0.8   m m , which may be attributed to the greater laser powers employed for this specific beam diameter. As the beam-powder interaction volume is increased by the larger beam diameter, which could also be demonstrated by an increased clad height, a larger effective number of surfaces is available to initiate re-reflection and absorption phenomena. Thus, the effects described in the preceding paragraphs are amplified.
From the different process maps for high-speed laser cladding of thin-sheet substrates, it can be derived that clads with a maximum width of 1413 μ m , a maximum height of 274 μ m , and a minimal dilution of up to 141 μ m can be obtained depending on the laser beam diameter and powder size distribution employed. However, it needs to be concluded that for a maximum of the laser power and powder mass flow, the usage of finer 20–53 μ m powders yields better results than the use of 50–150 μ m powders due to enhanced powder efficiency. Therefore, further characterization with regard to powder and laser defocussing, which is discussed in the following paragraph, shall be undertaken using the powder size distribution of 20–53 μ m .

3.3. Effects of Powder and Laser Defocussing

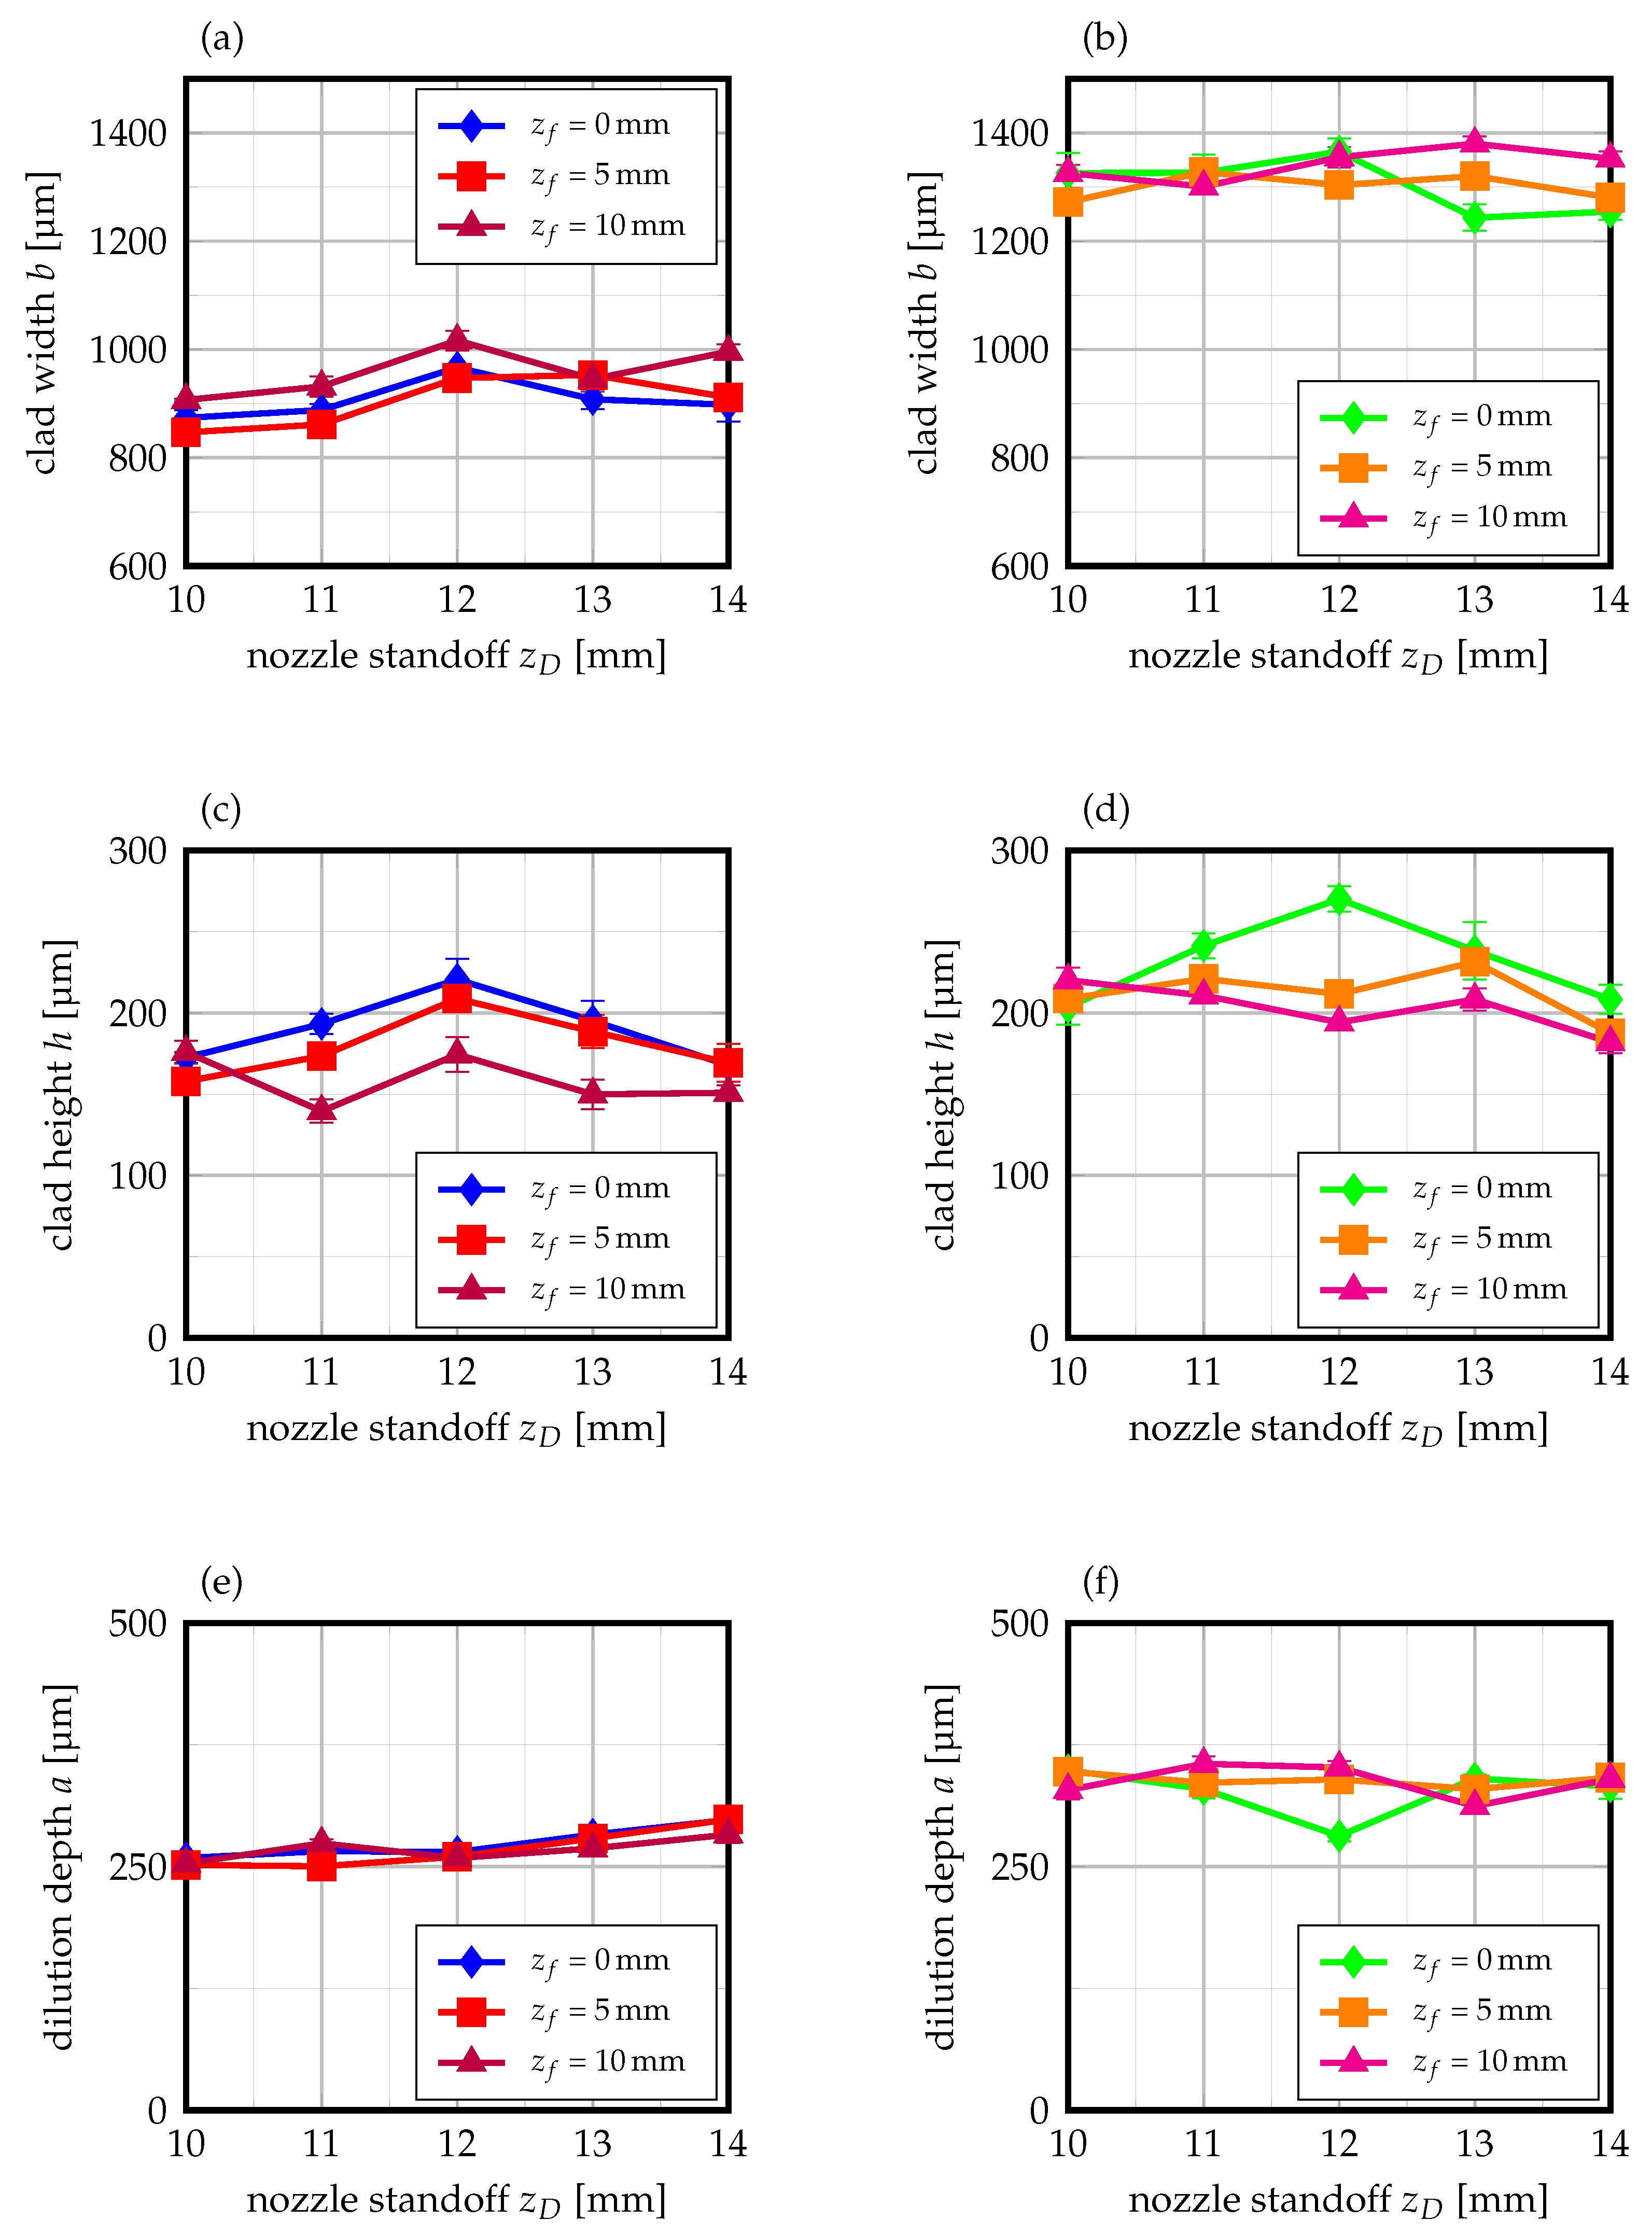
Through the utilization of a nozzle with an adaptive standoff distance and focussing optics with interchangeable lenses, defocussing of the powder stream and laser beam could be realized in order to study their effects on clad geometry and dilution independently from one another. The results of this investigation are presented in Figure 8. Here, a reduced nozzle standoff represents a shorter distance from the nozzle outlet to the substrate surface. The default standoff distance of the employed three-jet, coaxial-nozzle is 12 m m . Consequently, the focal offset z f describes the distance from the laser beam focus to the substrate surface, which was level for all previous investigations. In this study, an increased focal offset can be associated with the laser beam focus moving upward from the substrate surface, hence widening the near-Gaussian beam again, for which the diameter on the workpiece is increased.
As can be derived from Figure 8a,b, the clad width and nozzle standoff exhibit different interrelationships for the varying beam diameters and focal offset employed. With a beam diameter of 0.8   m m , the highest clad widths are obtained for a nozzle standoff of 12 m m , whereby the powder focus is level with the substrate surface. This observation applies for all focal offsets, whereas it has to be mentioned that a focal offset of 10 m m yields the highest clad width. Given the fact that the beam diameter is widened once the laser is defocussed, these findings appear to be appropriate. Yet, when the nozzle standoff is changed, the clad width is reduced. In particular, a reduction of nozzle standoff, which corresponds to a powder focus below the substrate surface, is detrimental to clad width of thin-sheet substrates. For a laser beam diameter of 1.2   m m , similar phenomena can be observed. For a focal offset of 0 m m , the highest clad width is achieved for a nozzle standoff of 12 m m . A reduction or increase of the nozzle standoff yields lower clads widths again. Interestingly, a focal offset of 5 m m cannot increase the clad width when the nozzle standoff is set below the default value of 12 m m . Only when the nozzle standoff is increased above the default value, such as when the powder focus is lifted above the substrate surface, higher clad widths than for a focal offset of 0 m m are obtained. A similar trend can also be identified for a focal offset of 10 m m , which leads to highest clad widths when the nozzle standoff is raised above its default value. Obviously, the defocussing of the beam facilitates an increase of effective diameters on surface, for which the clad width is increased. Nonetheless, the reader has to bear in mind that the Raygleigh length is two times as high for a focal length of 300 m m when compared to a focal length of 200 m m (cf. Table 3), for which widening of the laser beam at a given focal offset is not as pronounced as with a focal length of 200 m m due to the correspondingly smaller aperture [23].
With regard to clad height, the interrelationships of nozzle standoff and focal offset are similar for both beam diameters investigated, as can be derived from Figure 8c,d. In both cases, the highest clad is obtained by a focal offset of 0 m m and a nozzle standoff distance of 0 m m , for which the powder and laser focus are level on the substrate surface. As the nozzle standoff is either reduced or increased, the clad height is decreased. As it has been found in the preceding paragraphs, the clad height is highly dependent on powder utilization. On the basis of the present findings, it can thus be concluded that powder defocussing obviously leads to decreased powder efficiency and, thus, lower clad heights during high-speed laser cladding of thin-sheet substrates. Hence, the propositions of Segerstark et al. [7] and Zhu et al. [31] can be confirmed for high-speed laser cladding of thin-sheet substrates as well. Moreover, the effects of a laser focal offset are detrimental to clad height for both investigated beam diameters. Under consideration that the multi-mode intensity-profile of the fiber laser employed during the experiments is only obtained in the focal plane ( z f = 0 m m ) and alleviated at its slopes when a focal offset is used [7], the identified observations can be explained. Obviously, the laser defocussing leads to a substantial change in its intensity distribution on the basis of which the interaction of the laser beam and powder stream is reduced. Thus, a decreased clad height is obtained when a defocussed laser beam is used for high-speed laser cladding of thin-sheet substrates.
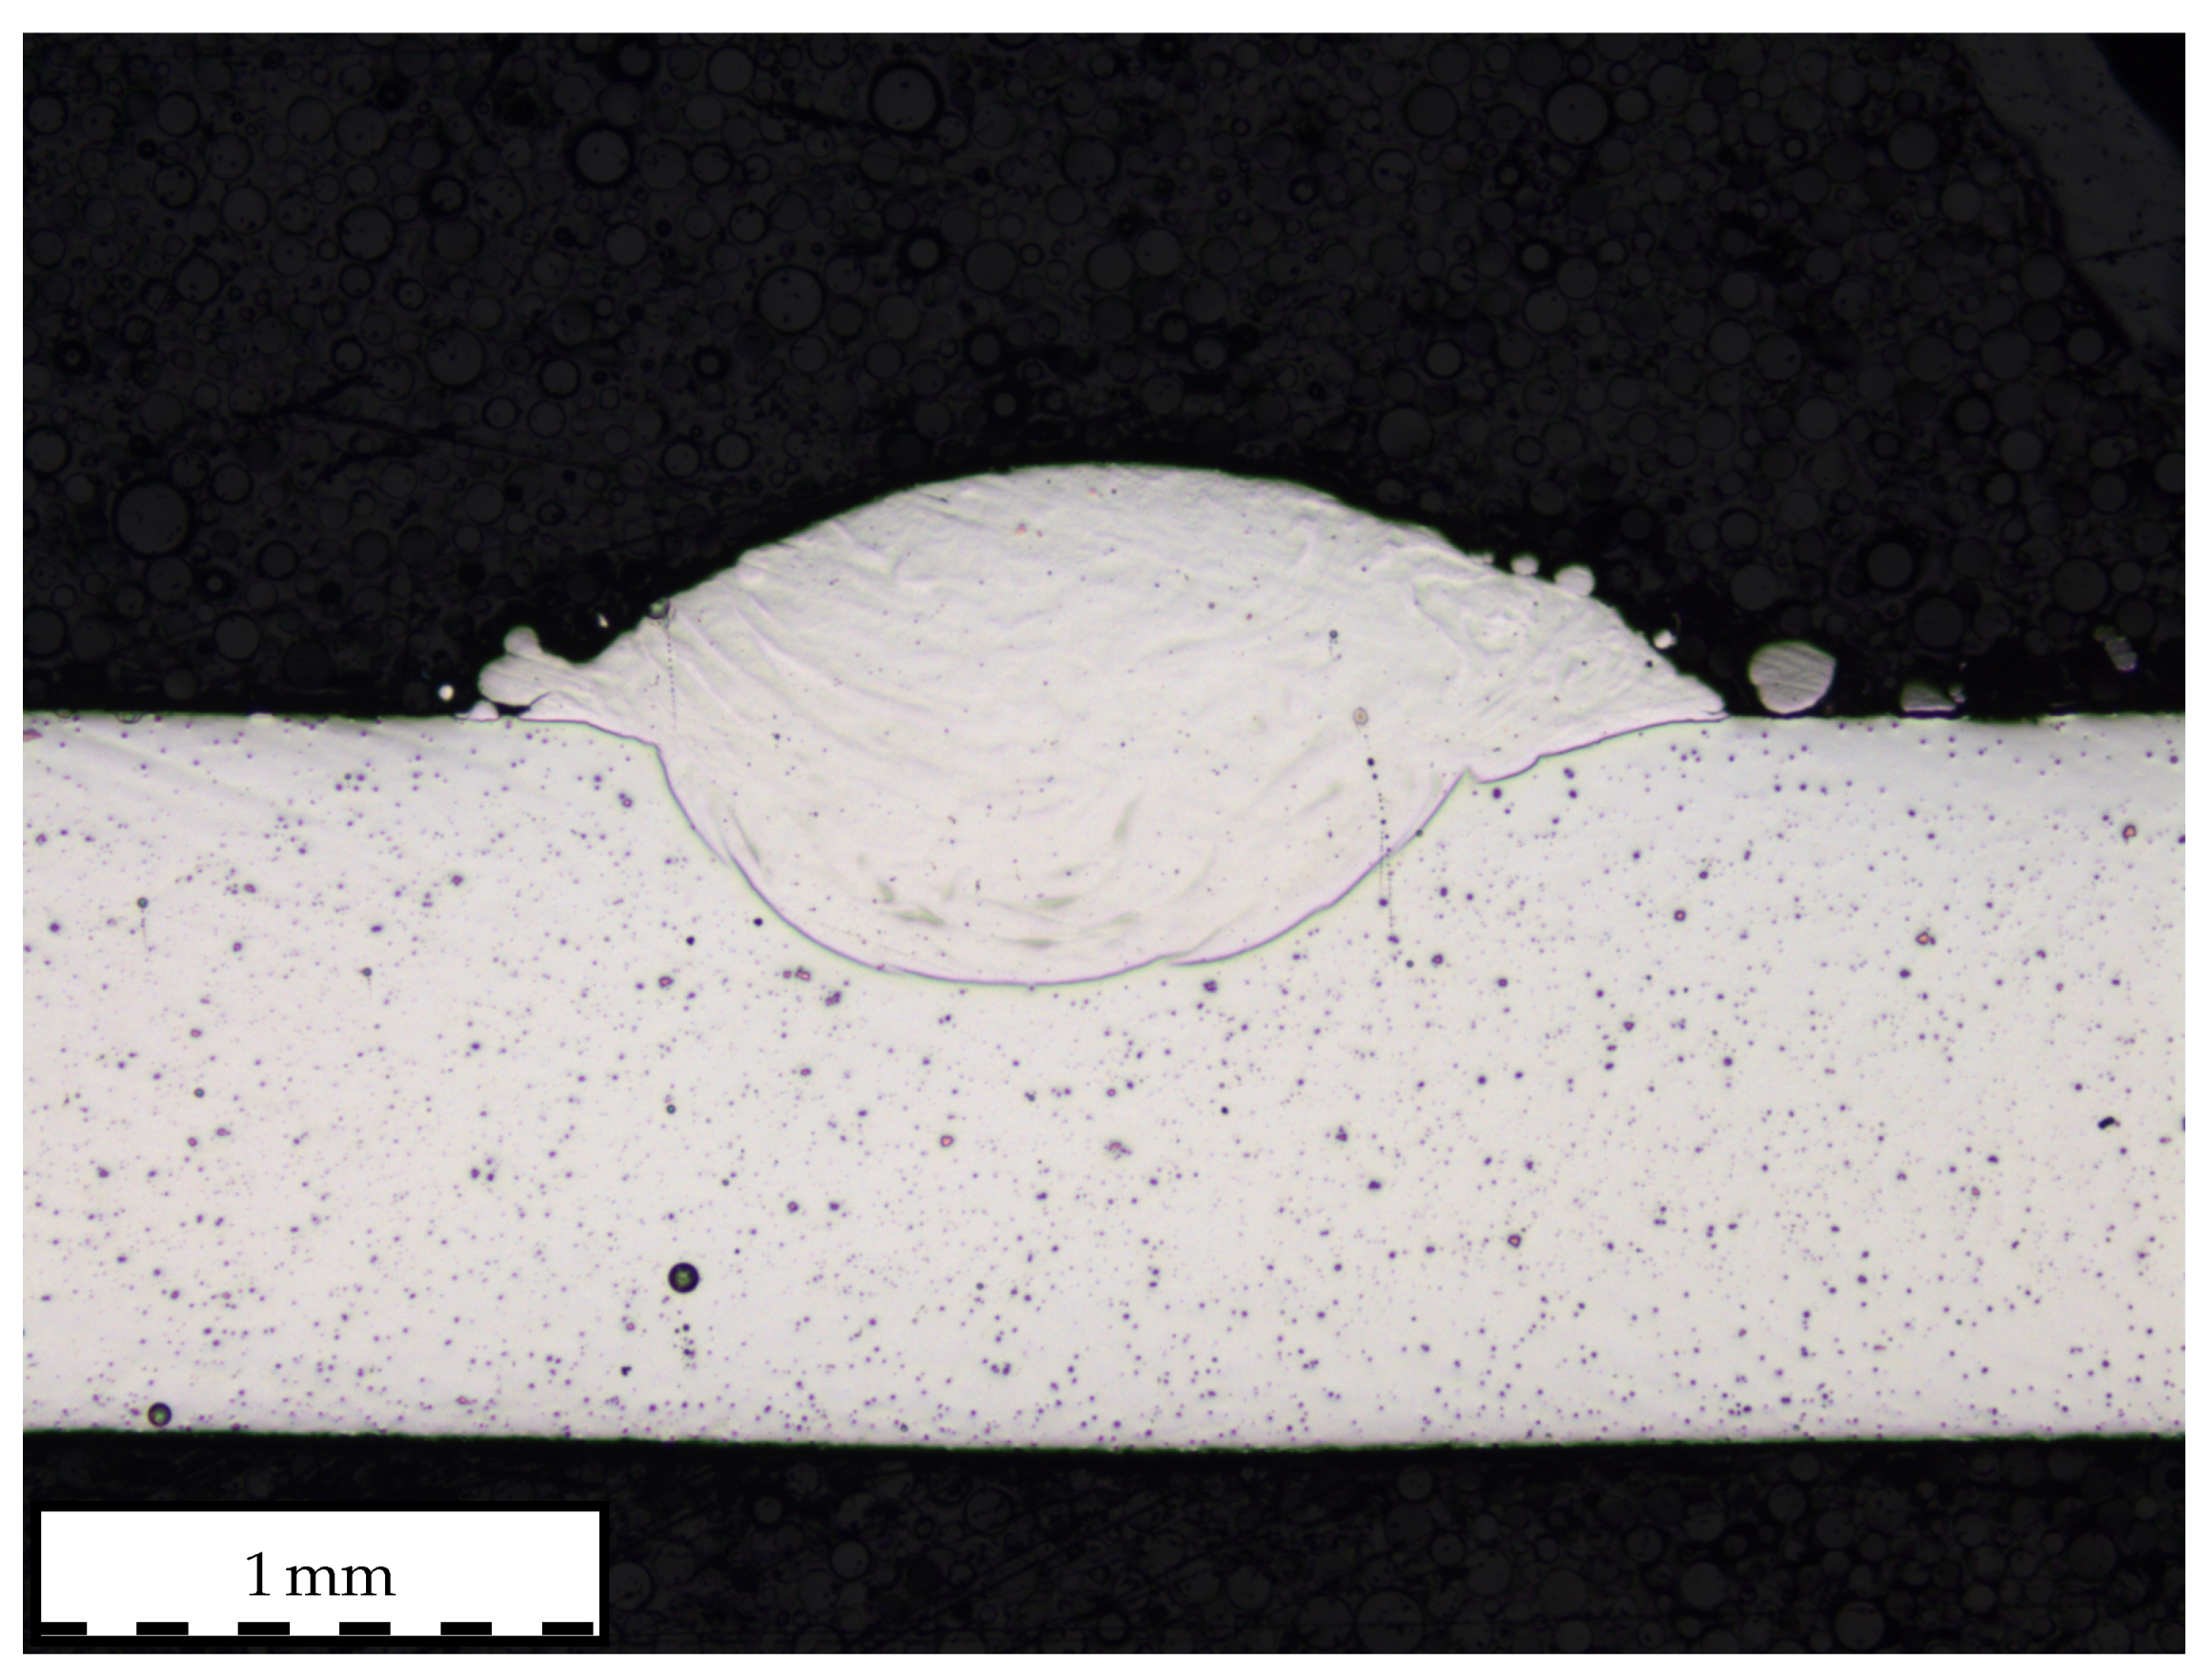
These findings also possess direct implications on the interrelationships of powder and laser defocussing on dilution depth, as can be deduced from Figure 8e,f. Here, dilution depth is minimal for a default nozzle standoff of 12 m m and a focal offset of 0 m m , which very well corresponds to the previous findings where clad height and, subsequently, powder utilization were maximized for analogue settings. Hence, it can be derived that laser and powder defocussing is also detrimental to dilution depth based on the explanations given in the preceding paragraph. As the interaction of laser beams and powder streams is mitigated through the incumbent change of intensity distribution, more laser light can effectively reach the substrate surface, cause increased melting and, thus, dilution depth. An example of one obtained clad geometry during high-speed laser cladding of thin-sheet substrates is depicted in Figure 9.

4. Conclusions

In the present investigation, high-speed laser cladding of thin-sheet substrates with a thickness of 0.8   m m was studied. In order to provide thorough insight into the underlying process–property relationships, manifold experiments were carried out to evaluate the influence of the process parameters involved. The findings demonstrate that a continuous-wave, ytterbium fiber laser can be used to clad stainless steel sheets with a thickness of only 0.8   m m and a pulsed laser source does not necessarily have to be used. Furthermore, the established process maps for target values of clad width, clad height, and dilution depth demonstrate the possibilities to tailor the clad properties to desired values. Additionally, inherent interaction phenomena during high-speed laser cladding of thin-sheet substrates are discussed. Based on an analysis of variance, the significance of laser power and mass flow for the three target values of clad width, clad height, and dilution depth were studied. From the results, it can be deduced that the laser power has a substantial influence on clad width for both the particle size distributions and laser beam diameters studied. On the contrary, mass flow is the dominant influencing factor when clad height is the target value. While only laser power was found to be influential on dilution depth for a laser beam diameter of 800 μ m based on the ANOVA, computed results of the ANOVA for a beam diameter of 1.2   m m prove that mass flow also exhibits a significant influence on the dilution depth. It can be derived that interaction phenomena of conventional, powder-based DED-LB processes are also applicable for high-speed laser cladding of thin-sheet substrates. Thereby, clad widths of up to 1413 μ m and dilution depths of up to only 141 μ m can be realized depending on the laser beam diameter, laser power, and powder mass flow employed. Yet, with respect to the limitations of this study, it has to be stated that the given results may only be applicable for the given sheet thickness, surface condition, and thermal conductivity. Thus, additional studies are required to transfer the results on other sheet thicknesses. Furthermore, the influence of laser and powder defocussing was studied. It is demonstrated that laser and powder defocussing exhibit detrimental effects on clad width and dilution depth during high-speed laser cladding of thin-sheet substrates due to the changed interaction phenomena of laser beams and powder streams.
With the present investigation, pathways towards the application of conventional laser cladding systems for thin-sheet substrates with enhanced performance are opened. Further research will have to detail the mechanical properties of the clad-sheet bond, as well as its formability.

Author Contributions

Conceptualization, N.S.; methodology, N.S.; validation, N.S. and S.B.; formal analysis, N.S.; investigation, N.S. and F.S.; resources, S.B.; data curation, N.S. and F.S.; writing—original draft preparation, N.S.; writing—review and editing, N.S. and S.B.; visualization, N.S.; supervision, N.S.; project administration, N.S.; funding acquisition, S.B. All authors have read and agreed to the published version of the manuscript.

Funding

The shown results were achieved in the project “Kombiniertes in-situ Laserstrahl-/ Laserstrahlauftragschweißen bei nichtrostenden Stählen zum Schutz vor interkristalliner Korrosion” (reference IGF 20.129N), which is supervised by the Forschungsvereinigung Schweißen und verwandte Verfahren e.V. of the German Welding Society and funded by the German Federation of Industrial Research Associations (AiF) by means of the Federal Ministry of Economic Affairs and Energy (BMWi) on the basis of a decision by the German Bundestag.

Institutional Review Board Statement

Not applicable.

Informed Consent Statement

Not applicable.

Data Availability Statement

Data of the present publication cannot be disclosed as it is part of an ongoing investigation.

Acknowledgments

The authors would like to thank Miele and Cie. KG (Gütersloh, Germany), in particular, Alix Gaspard and Robert Austermann, for providing the sheet materials used in the present study. In addition to that, the authors would like to express their gratitude to Philipp Kluge (DEW Specialty Steel GmbH and Co. KG, Krefeld, Germany) and Andreas Wank (GTV Verschleißschutz GmbH, Luckenbach, Germany) for supporting the study through the allocation of powder materials.

Conflicts of Interest

The authors declare no conflict of interest. The funders had no role in the design of the study; in the collection, analyses, or interpretation of data; in the writing of the manuscript, or in the decision to publish the results.

Abbreviations

The following abbreviations are used in this manuscript:
AISIAmerican Iron and Steel Institute
AMadditive manufacturing
ANOVAanalysis of variance
CCarbon
CrChromium
DEDdirected energy deposition
DED-LBlaser-based directed energy deposition
FeIron
LBlaser beam
LENSlaser-engineered net-shaping
LMDlaser metal deposition
MoMolybdenum
NNitrogen
NiNickel
SEMstandard error of mean
SiCSilicon-Carbide
TiTitanium
VVanadium

Appendix A. Experimental Plans

Table A1. Experimental design to investigate the influence of carrier gas flow on shielding gas flow. P L = 1350  W , v L = 90  m m   s 1 , m ˙ P = 15  g   min 1 , z f = 0  m m , z D = 12  m m , d K = 50–150  μ m and 20–53  μ m , d L ≈ 800  μ m .
Shielding Gas Flow V ˙ S [L min 1 ]Carrier Gas Flow V ˙ P [L min 1 ]
15510152025
Table A2. Experimental design to investigate the influence of shielding gas flow on carrier gas flow. P L = 1350  W , v L = 90  m m   s 1 , m ˙ P = 15  g   min 1 , z f = 0  m m , z D = 12  m m , d K = 50–150  μ m and 20–53  μ m , d L ≈ 800  μ m .
Carrier Gas Flow V ˙ P [L min 1 ]Shielding Gas Flow V ˙ S [L min 1 ]
55101520
105101520
Table A3. Full-factorial design to study the interdependencies between linear energy input and mass flow. v L = 90  m m   s 1 , V ˙ S = 10  L   min 1 , V ˙ P = 5  L   min 1 , z f = 0  m m , z D = 12  m m , d L ≈ 800  μ m .
Laser Power P L [W]Mass Flow m ˙ P [g min 1 ]
9009
100012
110015
120018
130021
140024
Table A4. Full-factorial design to investigate the interdependencies of focal offset and nozzle standoff. v L = 90  m m   s 1 , P L = 1400  W , m ˙ P = 24  g   min 1 , V ˙ S = 10  L   min 1 , V ˙ P = 5  L   min 1 , d L ≈ 800  μ m .
Focal Offset Laser z f [mm]Nozzle Standoff z D [mm]
010
511
1012
13
14
Table A5. Full-factorial design to study the interdependencies of linear energy input and mass flow. v L = 90  m m   s 1 , V ˙ S = 10  L   min 1 , V ˙ P = 5  L   min 1 , z f = 0  m m , z D = 12  m m , d L ≈ 1200  μ m .
Laser Power P L [W]Mass Flow m ˙ P [g min 1 ]
14009
150012
160015
180018
190021
200024
Table A6. Full-factorial design to investigate the interdependencies of focal offset and nozzle standoff. v L = 90  m m   s 1 , P L = 2000  W , m ˙ P = 24  g   min 1 , V ˙ S = 10  L   min 1 , V ˙ P = 5  L   min 1 , d L ≈ 1200  μ m , d K  = 20–53 μ m .
Focal Offset Laser z f [mm]Nozzle Standoff z D [mm]
010
511
1012
13
14

Appendix B. Analysis of Variance

Table A7. Overview of the results of analysis of variance for varying laser power and mass flow. v L = 90  m m   s 1 , V ˙ S = 10  L   min 1 , V ˙ P = 5  L   min 1 , z f = 0  m m , z D = 12  m m , d L ≈ 800  μ m .
No.Target ValueSize [ μ m]FactorF-Valuep-ValueCritical F
1.1b20–53 P L 29.1499 1.1543 × 10 10 2.5336
1.2b20–53 m ˙ P 0.59390.70472.5336
1.3b50–150 P L 37.8323 4.4505 × 10 12 2.5336
1.4b50–150 m ˙ P 0.05160.99822.5336
2.1h20–53 P L 0.44000.81702.5336
2.2h20–53 m ˙ P 65.7769 2.9638 × 10 15 2.5336
2.3h50–150 P L 0.50620.76922.5336
2.4h50–150 m ˙ P 44.2173 5.9512 × 10 13 2.5336
3.1a20–53 P L 17.2567 4.8556 × 10 8 2.5336
3.2a20–53 m ˙ P 1.85640.13192.5336
3.3a50–150 P L 12.2392 1.6204 × 10 6 2.5336
3.4a50–150 m ˙ P 1.87120.12922.5336
Table A8. Overview of the results of analysis of variance for varying laser power and mass flow. v L = 90  m m   s 1 , V ˙ S = 10  L   min 1 , V ˙ P = 5  L   min 1 , z f = 0  m m , z D = 12  m m , d L ≈ 1200  μ m.
No.Target ValueSize [ μ m]FactorF-Valuep-ValueCritical F
1.1b20–53 P L 13.9877 4.3467 × 10 7 2.5336
1.2b20–53 m ˙ P 0.75590.58852.5336
1.3b50–150 P L 28.1274 1.7821 × 10 10 2.5336
1.4b50–150 m ˙ P 0.08760.99362.5336
2.1h20–53 P L 0.27180.92492.5336
2.2h20–53 m ˙ P 110.0211 2.3139 × 10 18 2.5336
2.3h50–150 P L 0.51120.76562.5336
2.4h50–150 m ˙ P 45.4958 4.1007 × 10 13 2.5336
3.1a20–53 P L 8.5124 4.1639 × 10 5 2.5336
3.2a20–53 m ˙ P 3.44080.01422.5336
3.3a50–150 P L 7.2210 1.5316 × 10 4 2.5336
3.4a50–150 m ˙ P 3.29250.01732.5336

References

  1. Mahamood, R.M. Laser Metal Deposition Process of Metals, Alloys, and Composite Materials; Engineering Materials and Processes; Springer International Publishing: Cham, Switerland, 2018. [Google Scholar] [CrossRef]
  2. Graf, B.; Gumenyuk, A.; Rethmeier, M. Laser Metal Deposition as Repair Technology for Stainless Steel and Titanium Alloys. Phys. Procedia 2012, 39, 376–381. [Google Scholar] [CrossRef]
  3. Schopphoven, T.; Gasser, A.; Backes, G. EHLA: Extreme High-Speed Laser Material Deposition. Laser Tech. J. 2017, 14, 26–29. [Google Scholar] [CrossRef] [Green Version]
  4. Song, J.; Deng, Q.; Chen, C.; Hu, D.; Li, Y. Rebuilding of metal components with laser cladding forming. Appl. Surf. Sci. 2006, 252, 7934–7940. [Google Scholar] [CrossRef]
  5. Koehler, H.; Partes, K.; Seefeld, T.; Vollertsen, F. Laser reconditioning of crankshafts: From lab to application. Phys. Procedia 2010, 5, 387–397. [Google Scholar] [CrossRef] [Green Version]
  6. Abioye, T.E.; McCartney, D.G.; Clare, A.T. Laser cladding of Inconel 625 wire for corrosion protection. J. Mater. Process. Technol. 2015, 217, 232–240. [Google Scholar] [CrossRef] [Green Version]
  7. Segerstark, A. Laser Metal Deposition Using Alloy 718 Powder: Influence of Process Parameters on Material Characteristics. Ph.D. Thesis, Högskolan Väst, Trollhättan, Sweden, 2017. [Google Scholar]
  8. Nam, S.; Cho, H.; Kim, C.; Kim, Y.M. Effect of Process Parameters on Deposition Properties of Functionally Graded STS 316/Fe Manufactured by Laser Direct Metal Deposition. Metals 2018, 8, 607. [Google Scholar] [CrossRef] [Green Version]
  9. Brueckner, F.; Riede, M.; Müller, M.; Marquardt, F.; Willner, R.; Seidel, A.; Lopéz, E.; Leyens, C.; Beyer, E. Enhanced manufacturing possibilities using multi-materials in laser metal deposition. J. Laser Appl. 2018, 30, 032308. [Google Scholar] [CrossRef]
  10. Deutsches Institut für Normung e. V. Additive Fertigung—Grundlagen—Terminologie (ISO/ASTM DIS 52900:2018): Deutsche und Englische Fassung prEN ISO/ASTM 52900:2018; Deutsches Institut für Normung e.V.: Berlin, Germany, 2018. [Google Scholar]
  11. Li, T.; Zhang, L.; Bultel, G.G.P.; Schopphoven, T.; Gasser, A.; Schleifenbaum, J.H.; Poprawe, R. Extreme High-Speed Laser Material Deposition (EHLA) of AISI 4340 Steel. Coatings 2019, 9, 778. [Google Scholar] [CrossRef] [Green Version]
  12. Schopphoven, T. Experimentelle und Modelltheoretische Untersuchungen zum Extremen Hochgeschwindigkeits-Laserauftragschweißen; Fraunhofer Verlag: Stuttgart, Germany, 2020. [Google Scholar]
  13. Ng, G.K.L.; Jarfors, A.E.W.; Bi, G.; Zheng, H.Y. Porosity formation and gas bubble retention in laser metal deposition. Appl. Phys. A 2009, 97, 641–649. [Google Scholar] [CrossRef]
  14. Ruiz, J.E.; Cortina, M.; Arrizubieta, J.I.; Lamikiz, A. Study of the Influence of Shielding Gases on Laser Metal Deposition of Inconel 718 Superalloy. Materials 2018, 11, 1388. [Google Scholar] [CrossRef] [Green Version]
  15. Burmester, I.; Zhong, M.; Becker, H.; von Alvensleben, F.; Liu, W.; Haferkamp, H. Precision Nd:YAG laser cladding with coaxial powder feeding on very thin sheet. In Proceedings of the SPIE Proceedings Laser Processing of Materials and Industrial Applications II, Beijing, China, 16–19 September 1998; p. 269. [Google Scholar] [CrossRef]
  16. Corbin, S.F.; Toyserkani, E.; Khajepour, A. Cladding of an Fe-aluminide coating on mild steel using pulsed laser assisted powder deposition. Mater. Sci. Eng. A 2003, 354, 48–57. [Google Scholar] [CrossRef]
  17. Farnia, A.; Malek Ghaini, F.; Ocelík, V.; de Hosson, J.T.M. Microstructural characterization of Co-based coating deposited by low power pulse laser cladding. J. Mater. Sci. 2013, 48, 2714–2723. [Google Scholar] [CrossRef]
  18. Gabriel, T.; Rommel, D.; Scherm, F.; Gorywoda, M.; Glatzel, U. Laser Cladding of Ultra-Thin Nickel-Based Superalloy Sheets. Materials 2017, 10, 279. [Google Scholar] [CrossRef] [PubMed] [Green Version]
  19. Tebaay, L.M.; Hahn, M.; Tekkaya, A.E. Distortion and Dilution Behavior for Laser Metal Deposition onto Thin Sheet Metals. Int. J. Precis. Eng. Manuf. Green Technol. 2020, 7, 625–634. [Google Scholar] [CrossRef]
  20. Bambach, M.; Sviridov, A.; Weisheit, A.; Schleifenbaum, J. Case Studies on Local Reinforcement of Sheet Metal Components by Laser Additive Manufacturing. Metals 2017, 7, 113. [Google Scholar] [CrossRef] [Green Version]
  21. Ünsal, I.; Hama-Saleh, R.; Sviridov, A.; Bambach, M.; Weisheit, A.; Schleifenbaum, J.H. Mechanical properties of sheet metal components with local reinforcement produced by additive manufacturing. In Proceedings of the 21st International ESAFORM Conference on Material Forming; Fratini, L., Di Lorenzo, R., Buffa, G., Ingarao, G., Eds.; Conference Collection; AIP Publishing: Melville, NY, USA, 2018; p. 160028. [Google Scholar] [CrossRef]
  22. Ünsal, I.; Hirtler, M.; Sviridov, A.; Bambach, M.; Hama-Saleh, R.; Weisheit, A.; Schleifenbaum, J.H.; Kamaliev, M.; Tekkaya, A.E. Investigation of martensite-transformation and forming properties of additively reinforced 22MnB5 sheet metals. In Proceedings of the 22nd International ESAFORM Conference on Material Forming, AIP Conference Proceedings, Vitoria-Gasteiz, Spain, 8–10 May 2019; Galdos, L., Arrazola, P., Saenz de Argandona, E., Otegi, N., Mendiguren, J., Madariaga, A., de Buruaga, M.S., Eds.; AIP Publishing: Melville, NY, USA, 2019; p. 170019. [Google Scholar] [CrossRef]
  23. Bliedtner, J.; Müller, H.; Barz, A. Lasermaterialbearbeitung: Grundlagen-Verfahren-Anwendungen- Beispiele; Hanser: München, Germany, 2013. [Google Scholar] [CrossRef]
  24. Bax, B.; Rajput, R.; Kellet, R.; Reisacher, M. Systematic evaluation of process parameter maps for laser cladding and directed energy deposition. Addit. Manuf. 2018, 21, 487–494. [Google Scholar] [CrossRef]
  25. Sommer, N.; Kryukov, I.; Wolf, C.; Wiegand, M.; Kahlmeyer, M.; Böhm, S. On the Intergranular Corrosion Properties of Thin Ferritic Stainless Steel Sheets Welded by Fiber-Laser. Metals 2020, 10, 1088. [Google Scholar] [CrossRef]
  26. Thompson, S.M.; Bian, L.; Shamsaei, N.; Yadollahi, A. An overview of Direct Laser Deposition for additive manufacturing; Part I: Transport phenomena, modeling and diagnostics. Addit. Manuf. 2015, 8, 36–62. [Google Scholar] [CrossRef]
  27. Wolf, M. Improving the Efficiency of the DMLD Process. Laser Tech. J. 2016, 13, 32–34. [Google Scholar] [CrossRef] [Green Version]
  28. Spurk, J.; Aksel, N. Strömungslehre: Einführung in Die Theorie der Strömungen, 9th, ed; Springer: Berlin/Heidelberg, Germany, 2019. [Google Scholar] [CrossRef]
  29. Zhong, C.; Pirch, N.; Gasser, A.; Poprawe, R.; Schleifenbaum, J. The Influence of the Powder Stream on High-Deposition-Rate Laser Metal Deposition with Inconel 718. Metals 2017, 7, 443. [Google Scholar] [CrossRef] [Green Version]
  30. Shah, K.; Pinkerton, A.J.; Salman, A.; Li, L. Effects of Melt Pool Variables and Process Parameters in Laser Direct Metal Deposition of Aerospace Alloys. Mater. Manuf. Process. 2010, 25, 1372–1380. [Google Scholar] [CrossRef] [Green Version]
  31. Zhu, G.; Li, D.; Zhang, A.; Pi, G.; Tang, Y. The influence of laser and powder defocusing characteristics on the surface quality in laser direct metal deposition. Opt. Laser Technol. 2012, 44, 349–356. [Google Scholar] [CrossRef]
Figure 1. Particle size distribution of the two powder batches used in the present investigation. Nominal distribution: (a) 20–53 μ m , (b) 50–150 μ m , as provided by the material supplier.
Coatings 11 00952 g001
Figure 2. Schematic representation of target values’ clad width b, clad height h, and dilution depth a during high-speed laser cladding of thin-sheet substrates.
Coatings 11 00952 g002
Figure 3. Target values of clad width b, clad heigth h, and dilution depth a for varying carrier gas flow rates V ˙ P at a constant shielding gas flow rate V ˙ S . Mean values of five measurements, with standard error of the mean (SEM). (a,c,e): 20–53 μ m , (b,d,f): 50–150 μ m .
Coatings 11 00952 g003
Figure 4. Target values of clad width b, clad heigth h, and dilution depth a for varying shielding gas flow rates V ˙ S and two constant carrier gas flow rates V ˙ P . Mean values of five measurements, with SEM. (a,c,e): 20–53 μ m , (b,d,f): 50–150 μ m .
Coatings 11 00952 g004
Figure 5. Development of clad width b in dependence on laser power P L and mass flow m ˙ P . Top: laser beam diameter d L ≈ 800 μ m , bottom: laser beam diameter d L ≈ 1200 μ m : (a,c) 20–53 μ m , (b,d) 50–150 μ m .
Coatings 11 00952 g005
Figure 6. Development of clad height h in dependence on laser power P L and mass flow m ˙ P . Top: laser beam diameter d L ≈ 800 μ m , bottom: laser beam diameter d L ≈ 1200 μ m . (a,c) 20–53 μ m , (b,d) 50–150 μ m .
Coatings 11 00952 g006
Figure 7. Development of dilution depth a in dependence on laser power P L and mass flow m ˙ P . Top: laser beam diameter d L ≈ 800 μ m , bottom: laser beam diameter d L ≈ 1200 μ m . (a,c) 20–53 μ m , (b,d) 50–150 μ m .
Coatings 11 00952 g007
Figure 8. Evolution of target values’ clad width b, clad height h, and dilution depth a for varying nozzle standoff distances z D and focal offsets of the laser beam z f . Mean values of five measurements, with SEM. (a,c,e): Focal length F f = 200 m m , (b,d,f): Focal length F f = 300 m m .
Coatings 11 00952 g008
Figure 9. Example of obtained clad geometry during high-speed laser cladding of thin-sheet substrates. Parameters: d L ≈ 1200 μ m , P L = 2000 W , v L = 90 m m / s , m ˙ P = 24 g   min , V ˙ S = 10 L / min , V ˙ P = 5 L / min , z f = 0 m m , z D = 12 m m , d K = 20–53 μ m .
Coatings 11 00952 g009
Table 1. Chemical composition of AISI 430Ti sheet material [25].
GradeChemical Composition [wt.%]
FeCNCrTiNiMo
AISI 430Tibal.0.0180.07916.180.3260.2600.046
Table 2. Chemical composition of AISI 316L austenitic stainless steel powders, provided by material supplier.
Size [ μ m]Chemical Composition [wt.%]
CMnCrMoNi
20–530.0261.317.12.411.0
50–1500.030.516.52.113.0
Table 3. Overview of optical parameters used in the investigation.
Focal Length [mm]Collimation Length [mm]Beam Diameter [mm]Rayleigh Length [mm]
2001000.813.845
3001001.229.681
Table 4. Relevant process parameters of powder-based DED-LB processes. Compiled from [1,7] and supplemented.
DescriptionSymbol
Particle Diameter d K
Beam Diameter d L
Traverse Speed v L
Laser Power P L
Mass Flow m ˙ P
Nozzle Standoff z D
Focal Offset Laser z f
Shielding Gas Flow V ˙ S
Carrier Gas Flow V ˙ P
Publisher’s Note: MDPI stays neutral with regard to jurisdictional claims in published maps and institutional affiliations.