
Tailoring Al–Li Alloy Surface Wettability with a Femtosecond Laser and Its Effect on Bonding Performance


Abstract
:1. Introduction
2. Materials and Methods
2.1. Materials
2.2. Procedures
2.2.1. Sample Preparation
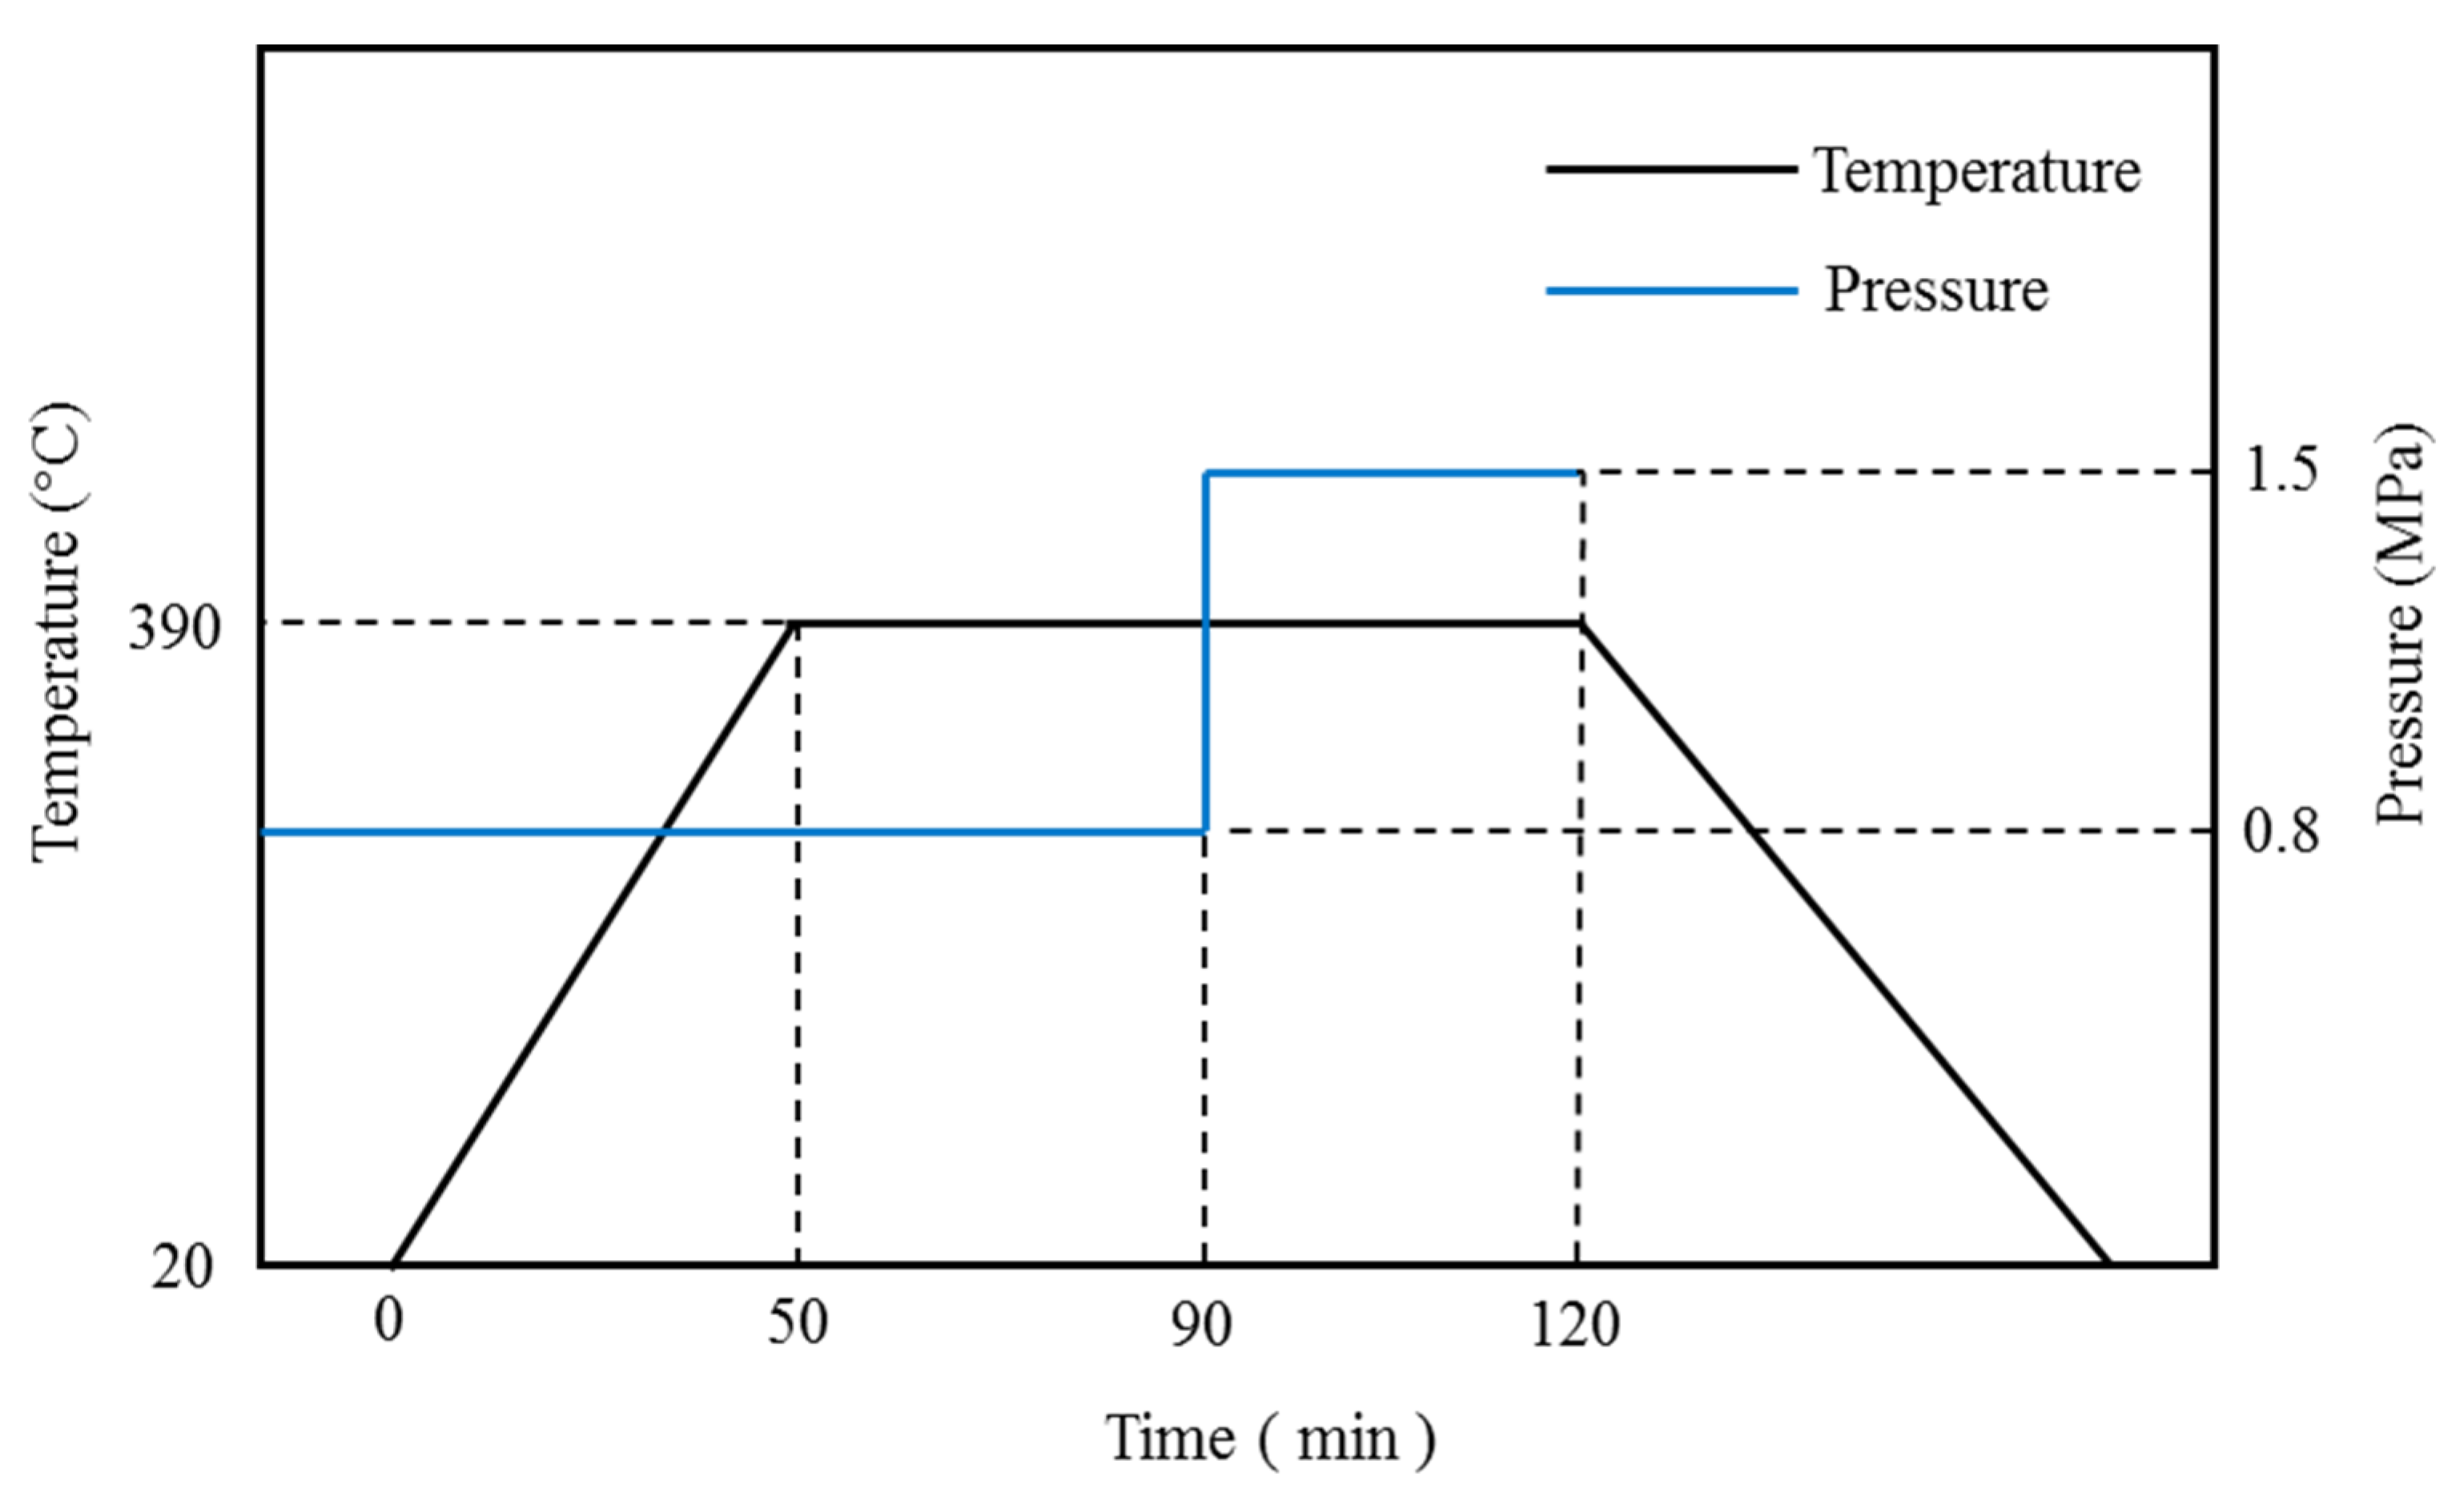
2.2.2. Bonding Test
2.3. Experimental Characterization
2.3.1. Surface Characteristics
2.3.2. Surface Wettability
2.3.3. Shear Strength Test
3. Results and Discussion
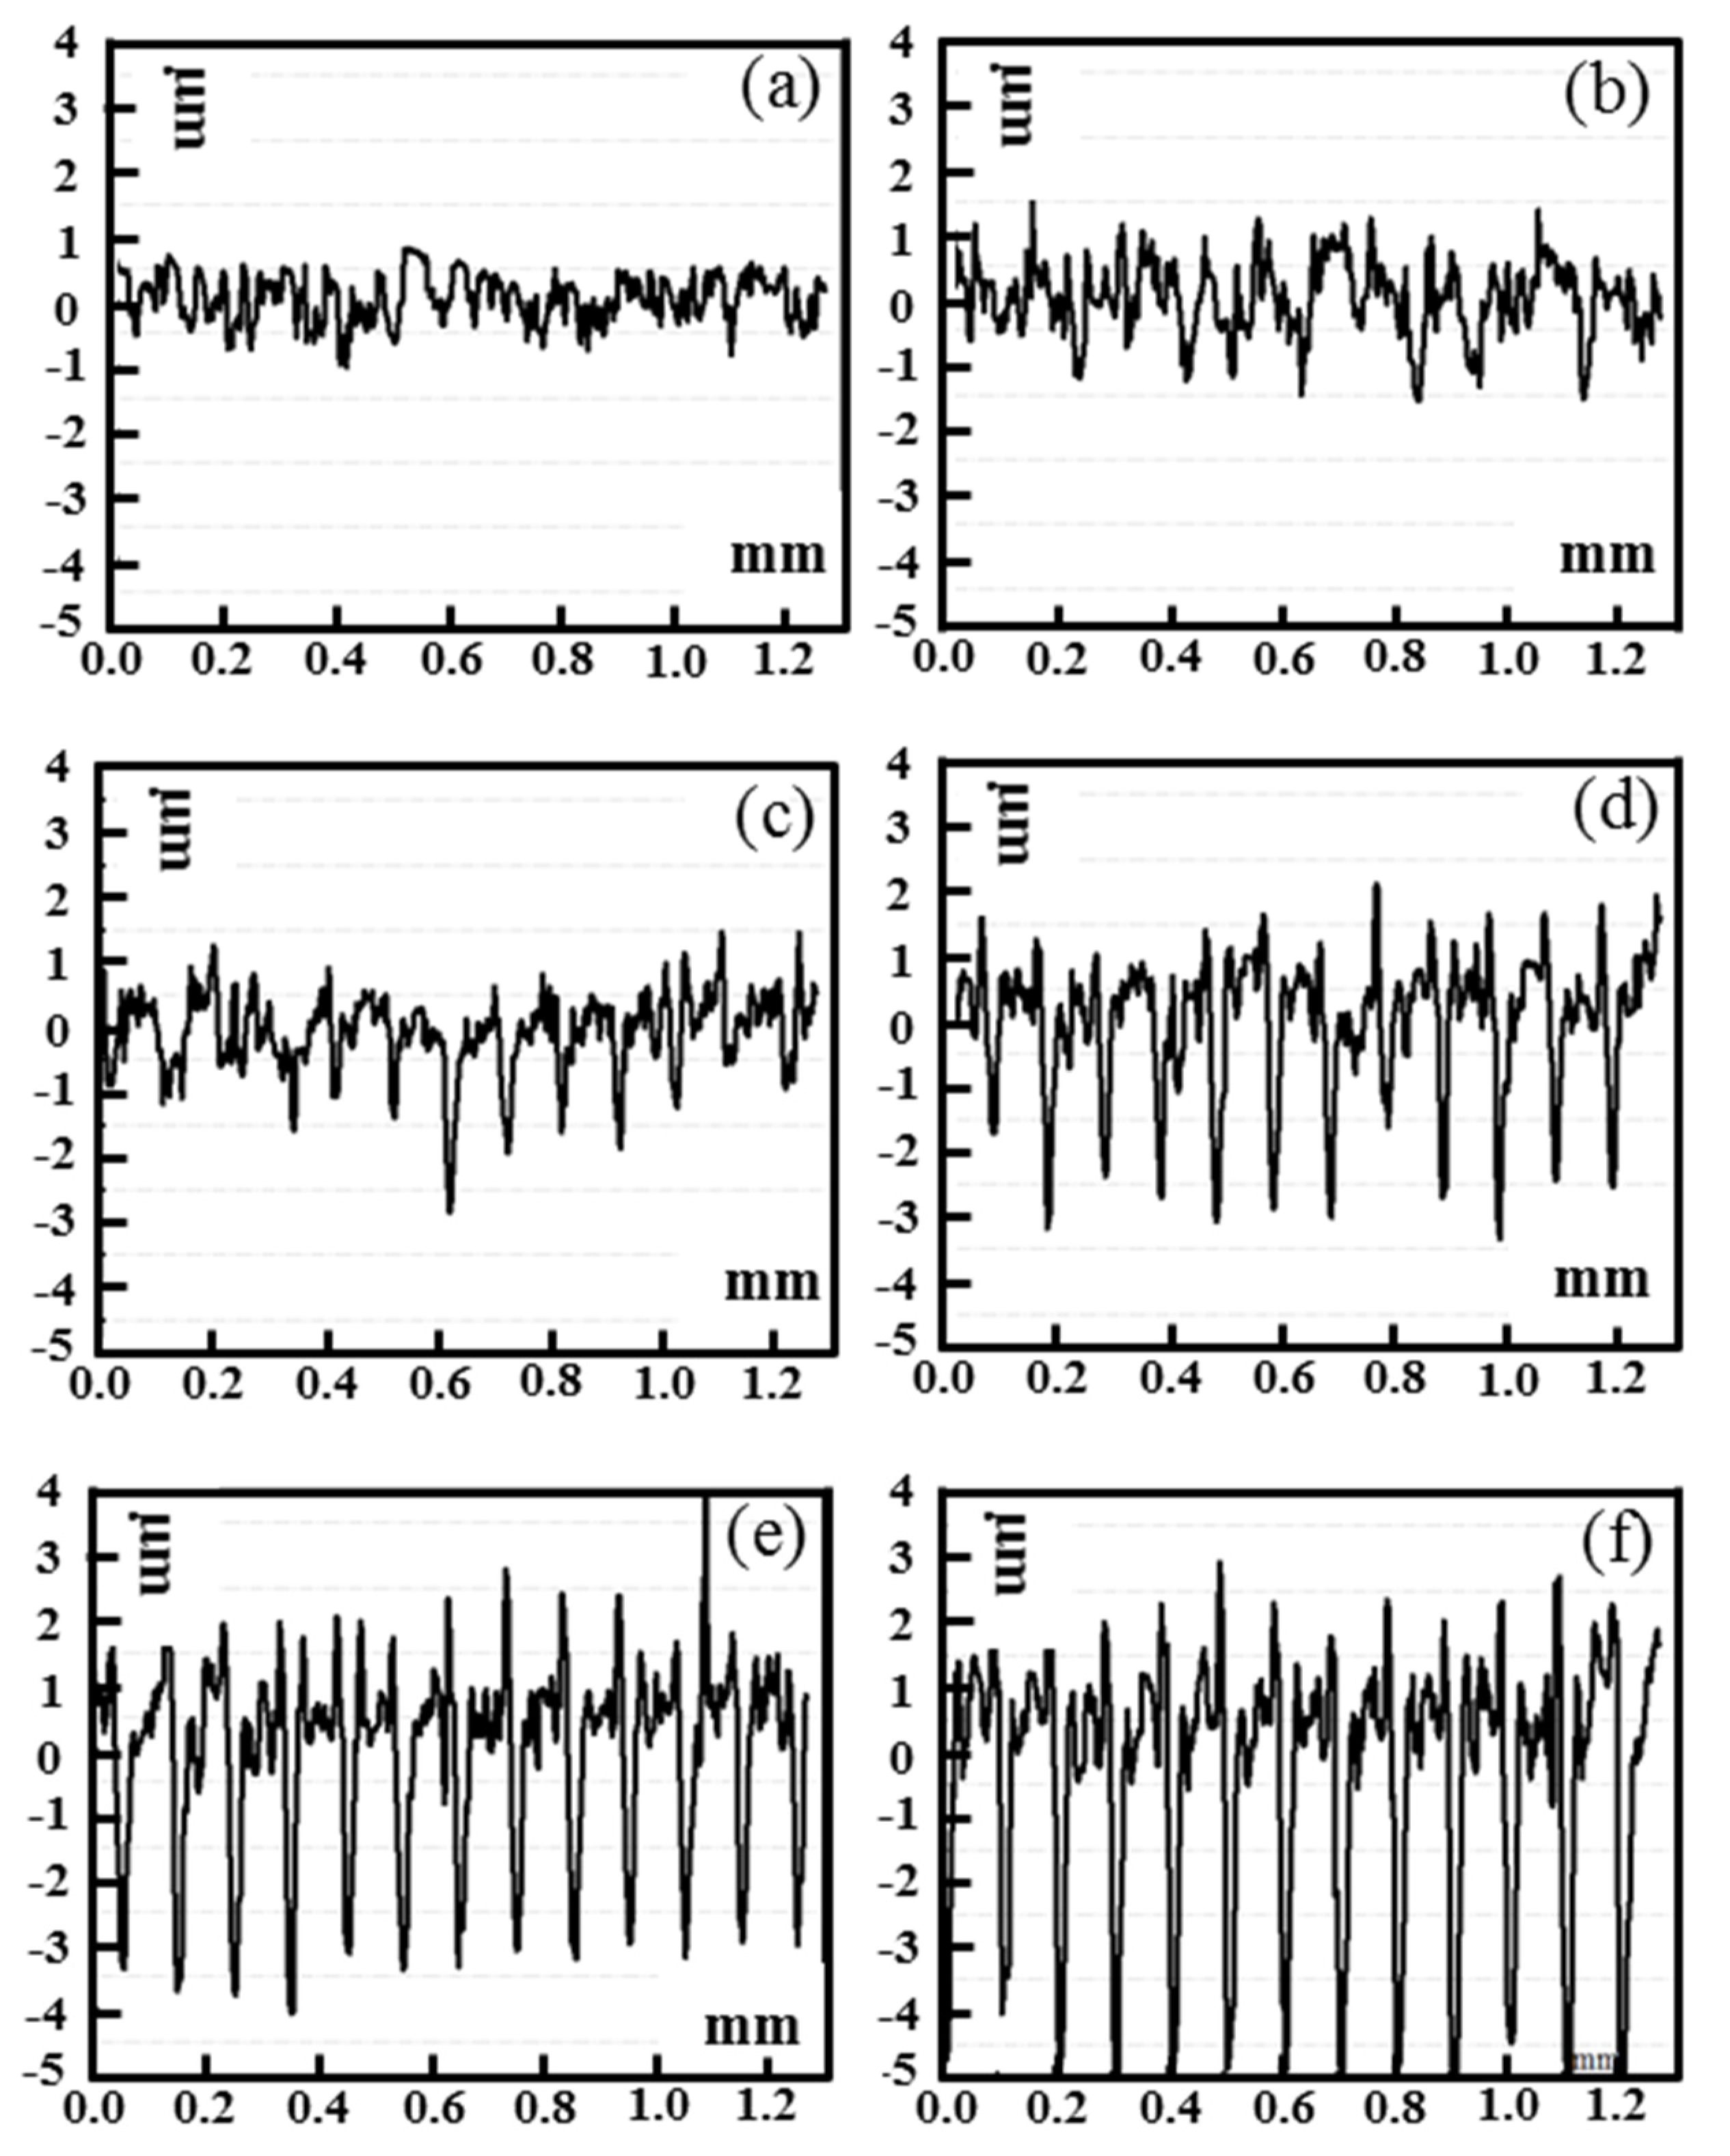
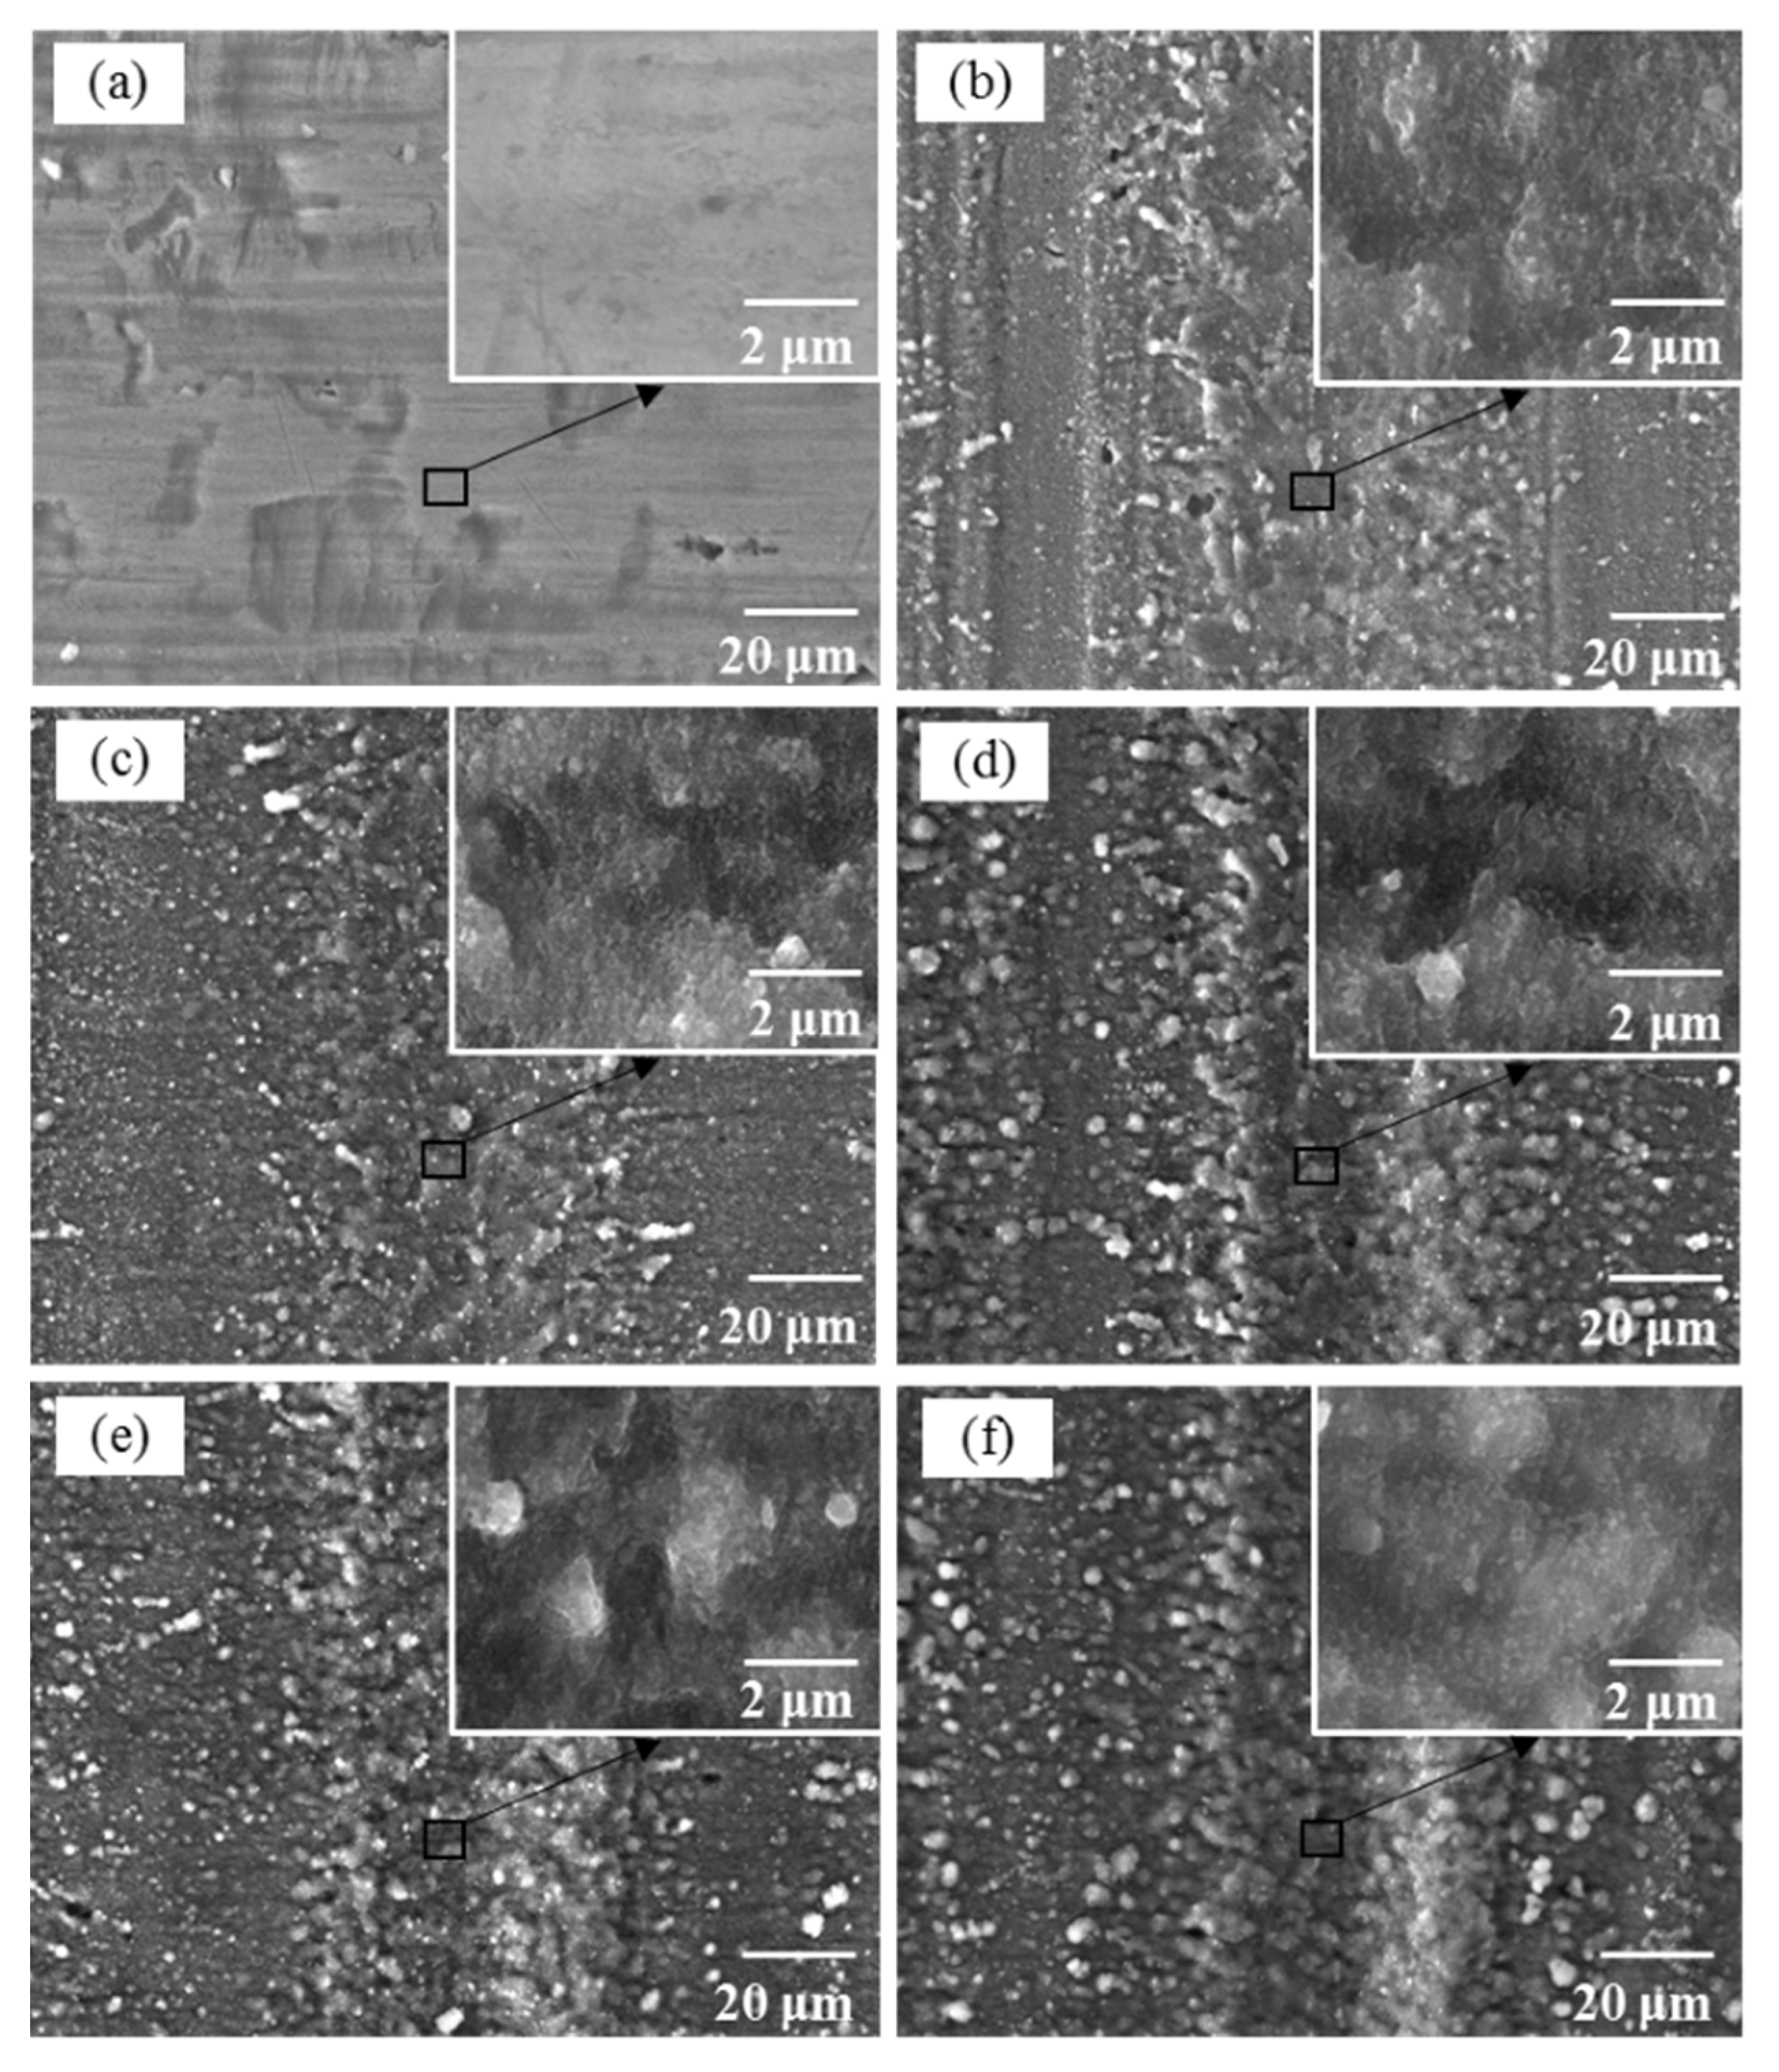
3.1. Surface Characteristics
3.2. Contact Angle and Surface Free Energy
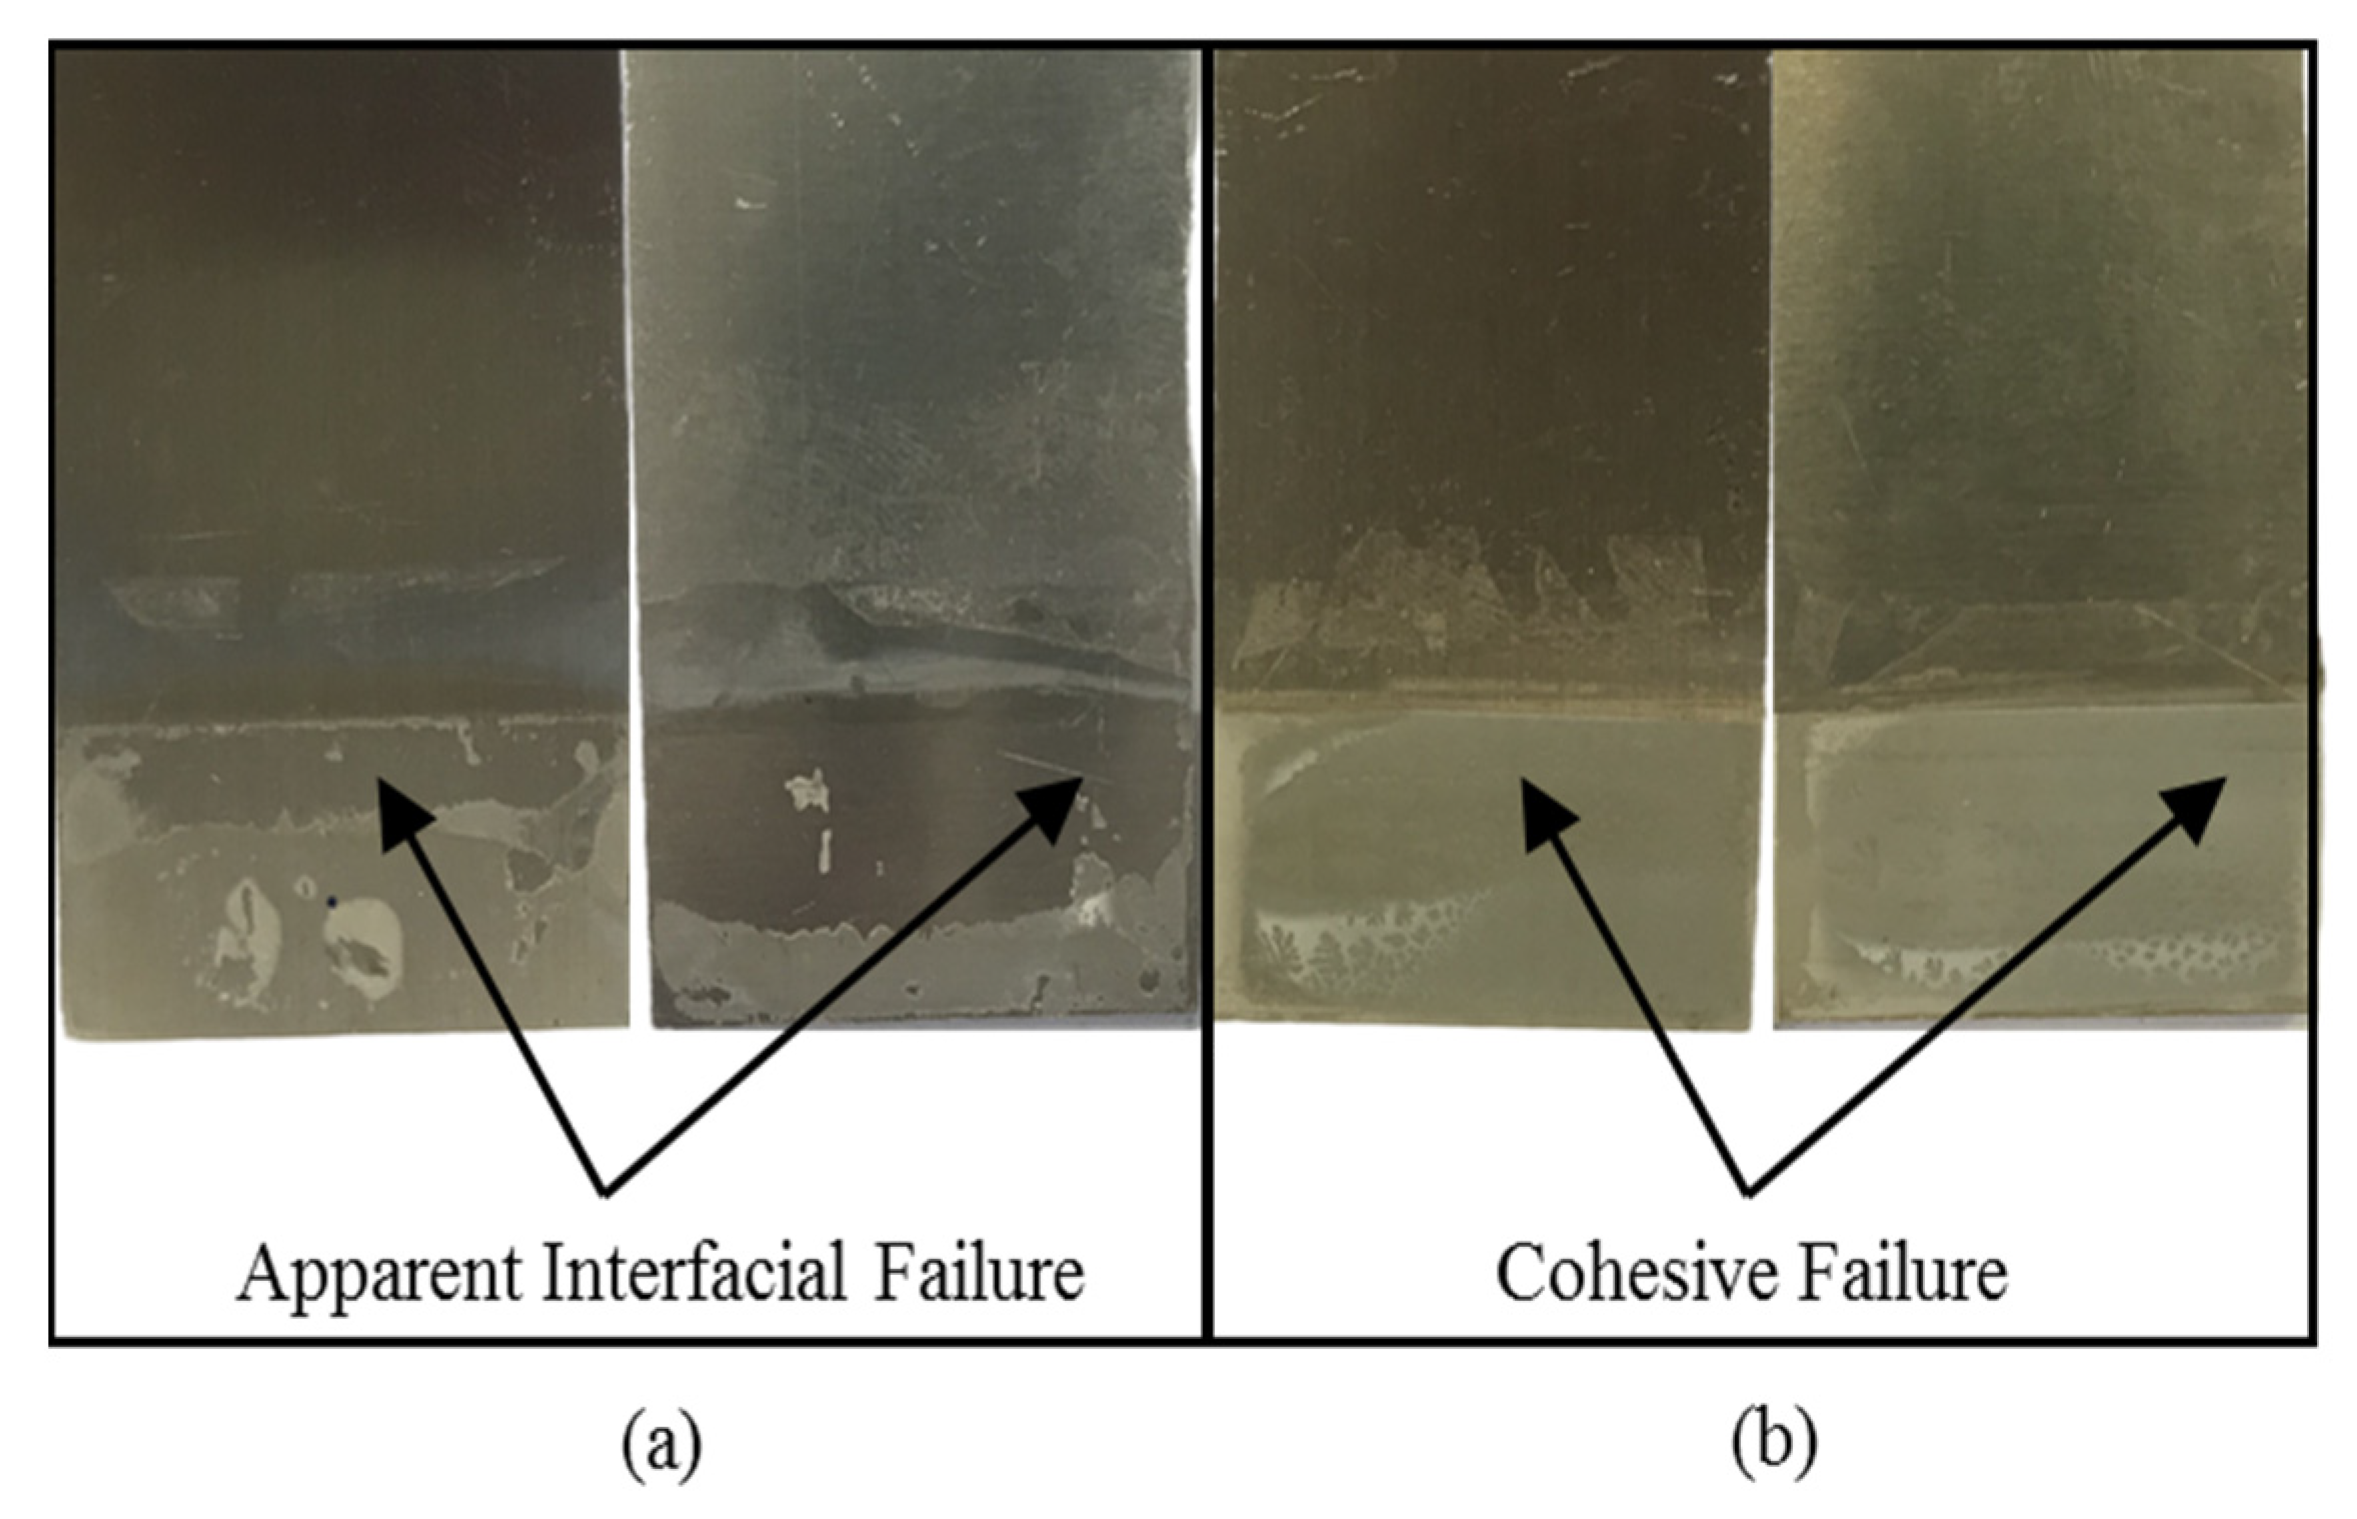
3.3. Adhesion Property
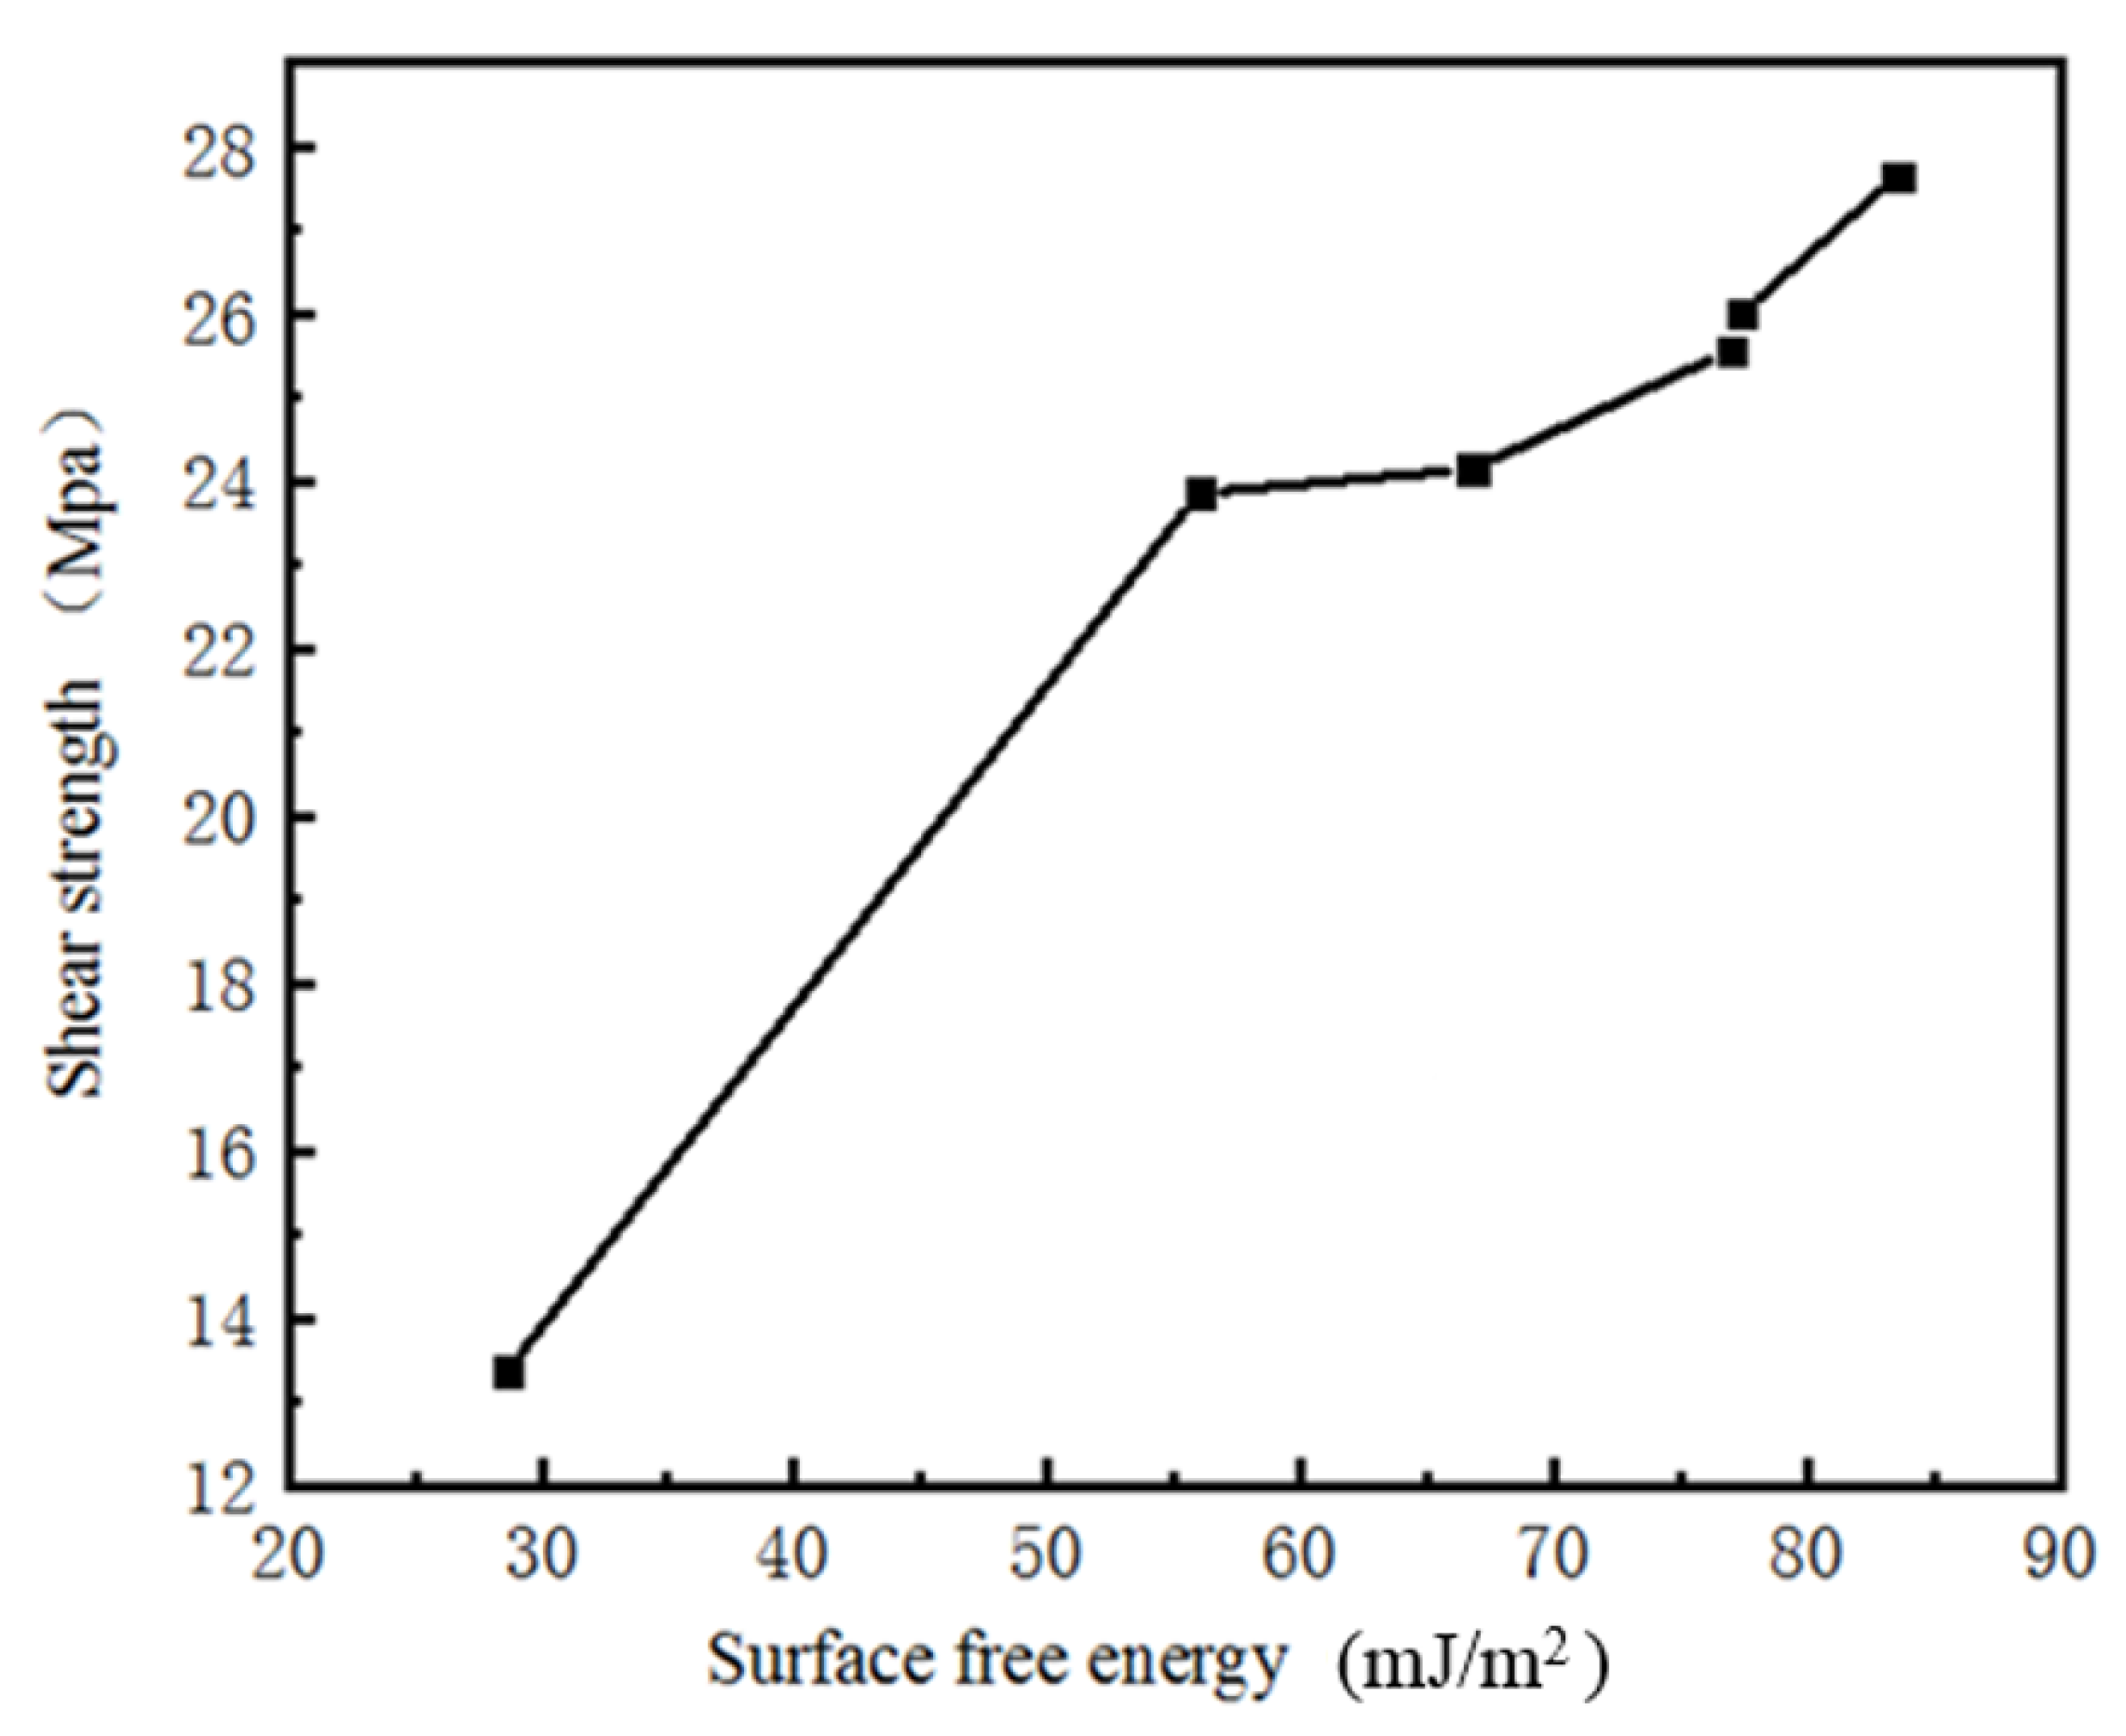
3.4. Relationships between Laser Scanning Speed, Surface Free Energy, and Shear Strength
4. Conclusions
- (1)
- Femtosecond laser etching of the Al–Li alloy surface had an important influence on its wettability. The surface wettability of samples could be changed by changing the laser scanning speed, and the surface free energy of the samples increased by 133%, 170%, 192%, 169%, and 95%, at the scanning speeds of 25, 20, 15, 10, and 5 mm/s, respectively.
- (2)
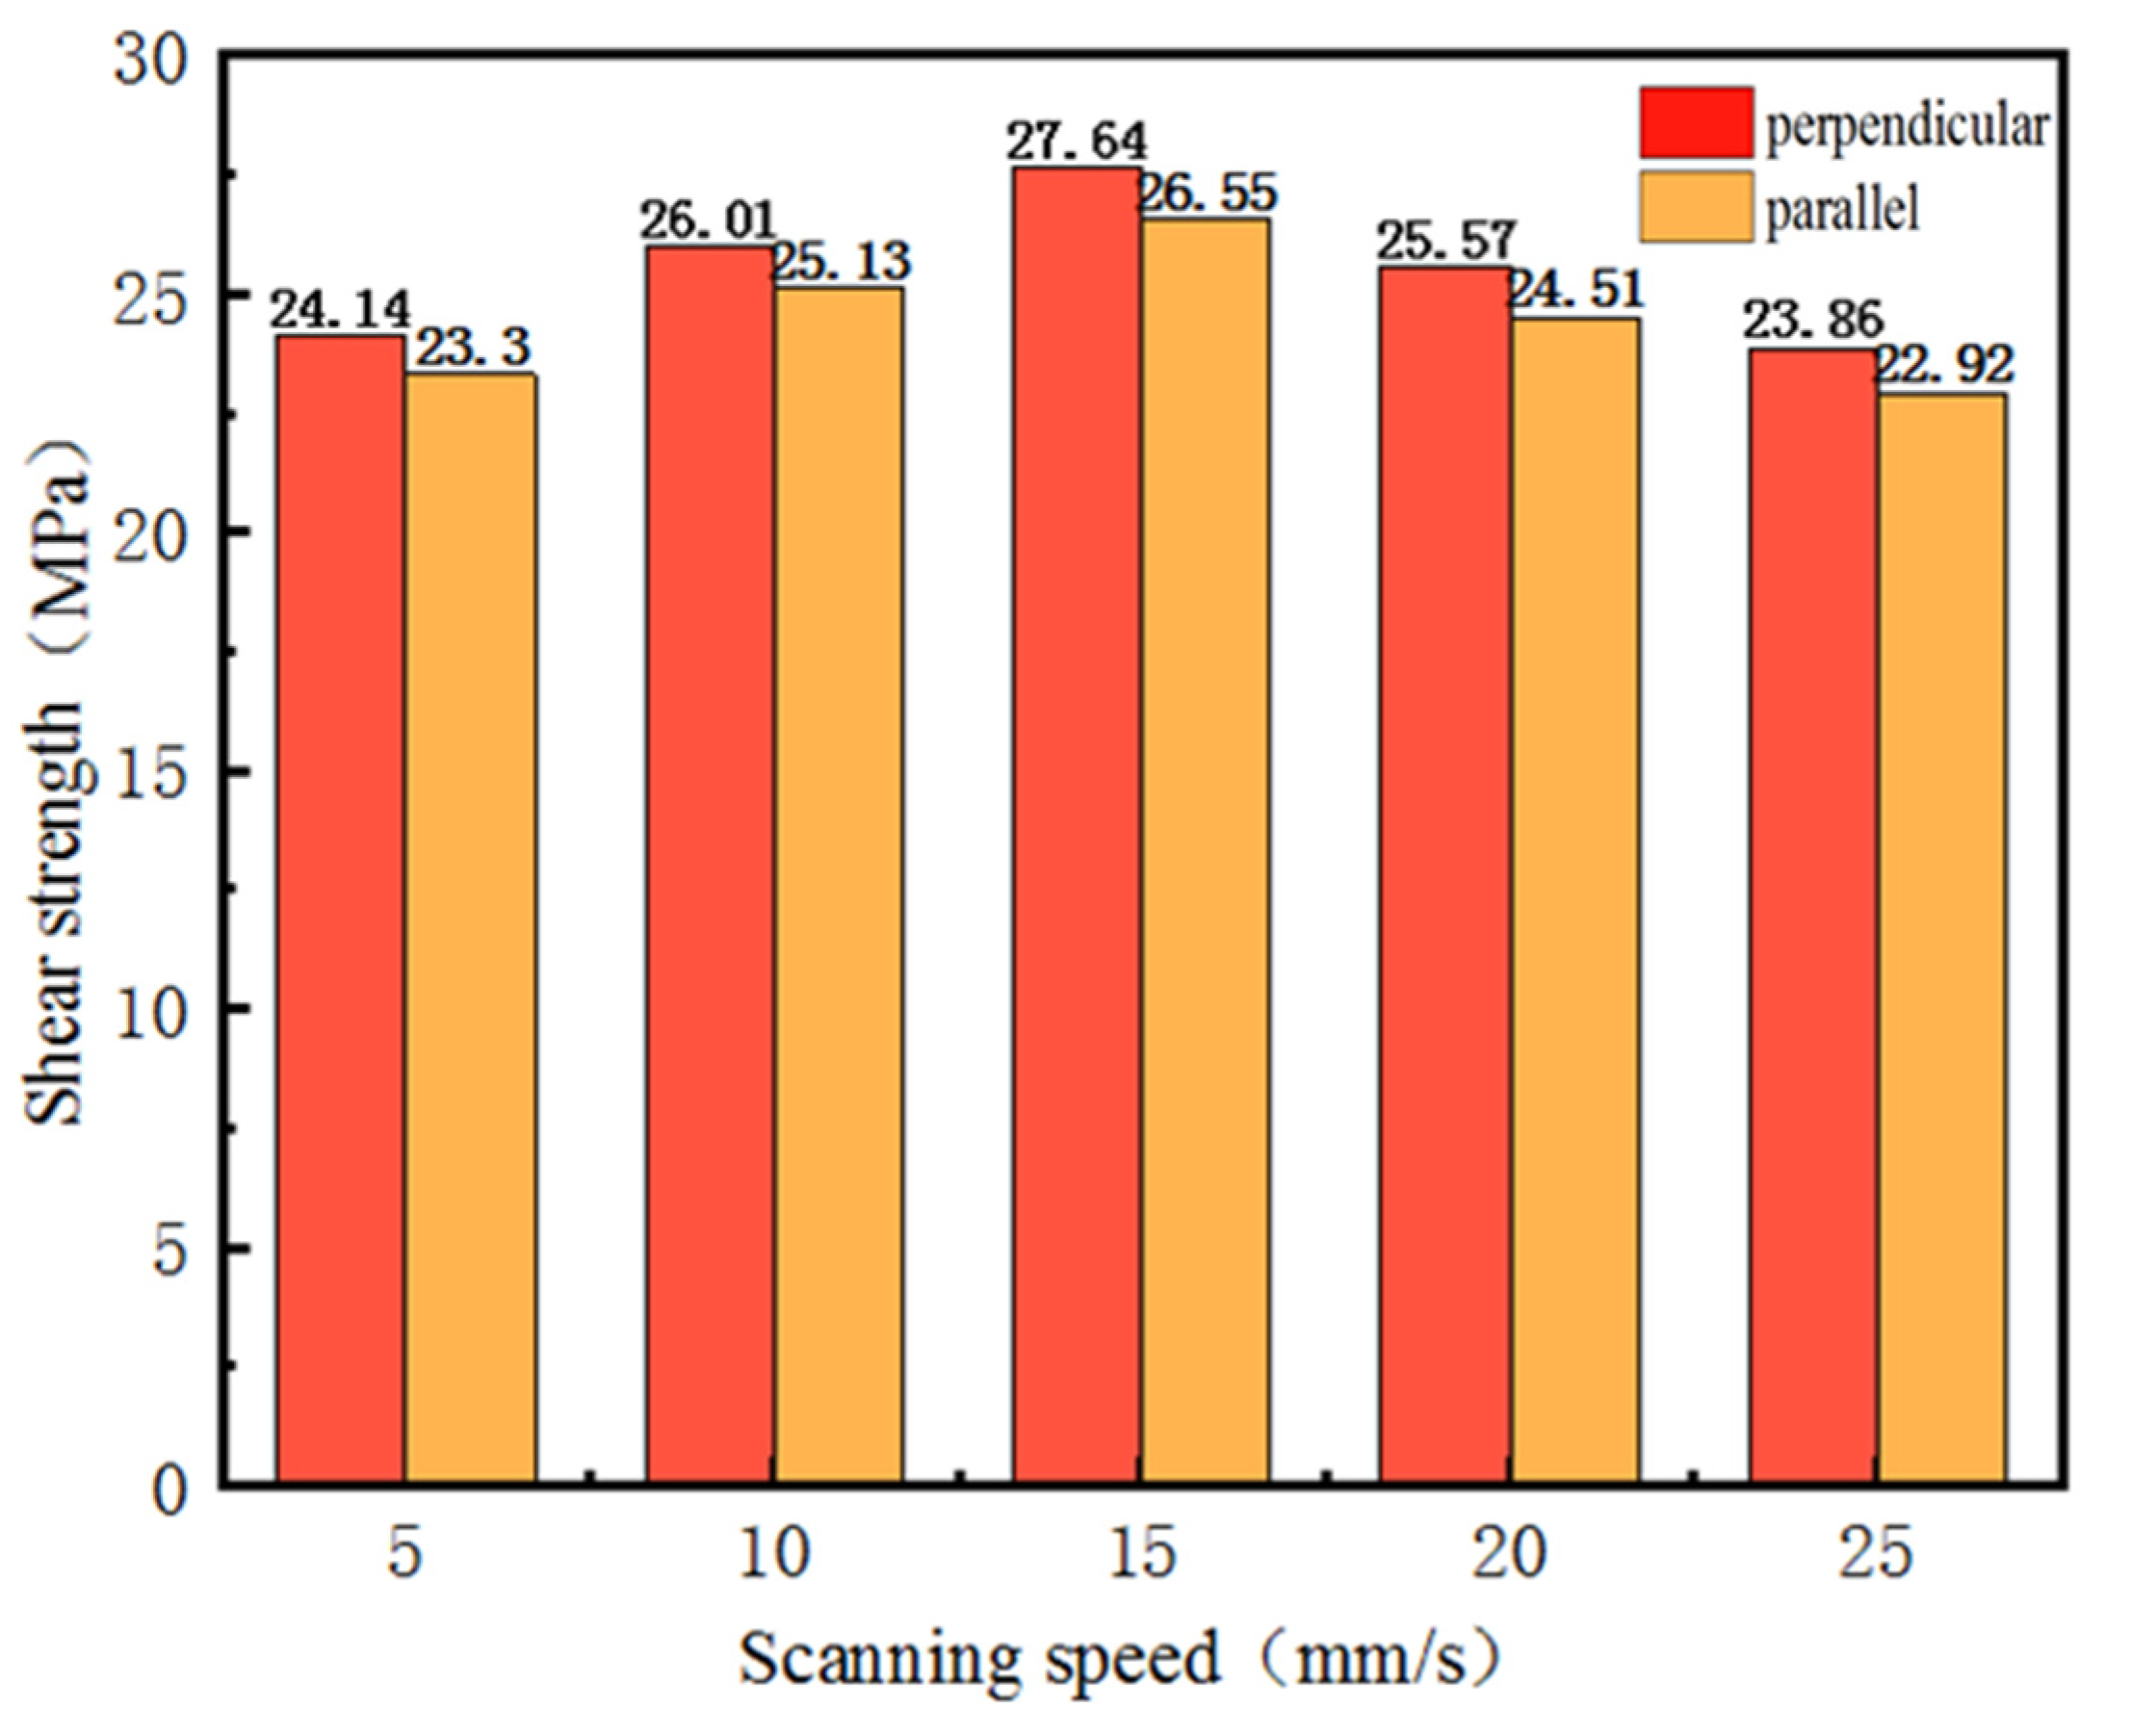
- Femtosecond laser etching of the Al–Li alloy surface had an important influence on its bonding performance. The bonding strength of the Al–Li alloy samples increased by 81%, 95%, 107%, 91%, and 78%, at the scanning speeds of 25, 20, 15, 10, and 5 mm/s, respectively.
- (3)
- Femtosecond laser etching of the Al–Li alloy surface mainly changed the surface roughness and surface micromorphology of the Al–Li alloy, thereby changing the surface free energy and bonding strength. Over-high (over-low scanning energy) and over-low (over-high scanning energy) scanning speed reduced the surface free energy and bonding strength of the samples.
- (4)
- Femtosecond laser etching improved the bonding performance of the Al–Li alloy mainly by improving the surface free energy of the samples, and its scanning path had a slight effect on the bonding strength (<5%).
Author Contributions
Funding
Institutional Review Board Statement
Informed Consent Statement
Data Availability Statement
Conflicts of Interest
References
- Pramanik, A.; Basak, A.; Dong, Y.; Sarker, P.; Uddin, M.; Littlefair, G.; Dixit, A.R.; Chattopadhyaya, S. Joining of carbon fibre reinforced polymer (CFRP) composites and aluminium alloys—A review. Compos. Part A Appl. Sci. Manuf. 2017, 101, 1–29. [Google Scholar] [CrossRef] [Green Version]
- Li, J.; Li, Y.; Huang, M.; Xiang, Y.; Liao, Y. Improvement of aluminum lithium alloy adhesion performance based on sandblasting techniques. Int. J. Adhes. Adhes. 2018, 84, 307–316. [Google Scholar] [CrossRef]
- Zhang, C.; Chen, L.; Zhang, Y.; Wang, G.; Jin, J. Effect of laser processing microstructure on the bonding strength and failure mode of 7075-T6 aluminum alloy adhesive joints. J. Manuf. Process. 2021, 66, 302–312. [Google Scholar] [CrossRef]
- Cui, J.; Wang, S.; Wang, S.; Chen, S.; Li, G. Strength and failure analysis of adhesive single-lap joints under shear loading: Effects of surface morphologies and overlap zone parameters. J. Manuf. Process. 2020, 56, 238–247. [Google Scholar] [CrossRef]
- Sinmazçelik, T.; Avcu, E.; Bora, M.Ö.; Çoban, O. A review: Fibre metal laminates, background, bonding types and applied test methods. Mater. Des. 2011, 32, 3671–3685. [Google Scholar] [CrossRef]
- Tiringer, U.; Kovač, J.; Milošev, I. Effects of mechanical and chemical pre-treatments on the morphology and composition of surfaces of aluminium alloys 7075-T6 and 2024-T3. Corros. Sci. 2017, 119, 46–59. [Google Scholar] [CrossRef]
- Salstela, J.; Suvanto, M.; Pakkanen, T.T. Influence of hierarchical micro-micro patterning and chemical modifications on adhesion between aluminum and epoxy. Int. J. Adhes. Adhes. 2016, 66, 128–137. [Google Scholar] [CrossRef]
- Lee, S.; Kim, D.; Kim, Y.; Jung, U.; Chung, W. Effect of aluminum anodizing in phosphoric acid electrolyte on adhesion strength and thermal performance. Met. Mater. Int. 2016, 22, 20–25. [Google Scholar] [CrossRef]
- Won, S.J.; Kim, H.S. Effects of laser parameters on morphological change and surface properties of aluminum alloy in masked laser surface texturing. J. Manuf. Process. 2019, 48, 260–269. [Google Scholar] [CrossRef]
- Feng, Z.; Zhao, H.; Tan, C.; Zhu, B.; Xia, F.; Wang, Q.; Chen, B.; Song, X. Effect of laser texturing on the surface characteristics and bonding property of 30CrMnSiA steel adhesive joints. J. Manuf. Process. 2019, 47, 219–228. [Google Scholar] [CrossRef]
- Wan, H.; Min, J.; Lin, J.; Carlson, B.E.; Maddela, S.; Sun, C. Effect of laser spot overlap ratio on surface characteristics and adhesive bonding strength of an Al alloy processed by nanosecond pulsed laser. J. Manuf. Process. 2021, 62, 555–565. [Google Scholar] [CrossRef]
- Li, Y.; Meng, S.; Gong, Q.; Huang, Y.; Gan, J.; Zhao, M.; Liu, B.; Liu, L.; Zou, G.; Zhuang, D. Experimental and theoretical investigation of laser pretreatment on strengthening the heterojunction between carbon fiber-reinforced plastic and aluminum alloy. ACS Appl. Mater. Interfaces 2019, 11, 22005–22014. [Google Scholar] [CrossRef]
- Spadaro, C.; Sunseri, C.; Dispenza, C. Laser surface treatments for adhesion improvement of aluminium alloys structural joints. Radiat. Phys. Chem. 2007, 76, 1441–1446. [Google Scholar] [CrossRef]
- Wu, Y.; Lin, J.; Carlson, B.E.; Lu, P.; Balogh, M.P.; Irish, N.P.; Mei, Y. Effect of laser ablation surface treatment on performance of adhesive-bonded aluminum alloys. Surf. Coat. Technol. 2016, 304, 340–347. [Google Scholar] [CrossRef]
- Romoli, L.; Moroni, F.; Khan, M. A study on the influence of surface laser texturing on the adhesive strength of bonded joints in aluminium alloys. CIRP Ann. 2017, 66, 237–240. [Google Scholar] [CrossRef]
- Phillips, K.C.; Gandhi, H.H.; Mazur, E.; Sundaram, S.K. Ultrafast laser processing of materials: A review. Adv. Opt. Photon. 2015, 7, 684–712. [Google Scholar] [CrossRef]
- Chichkov, B.N.; Momma, C.; Nolte, S.; Von Alvensleben, F.; Tünnermann, A. Femtosecond, picosecond and nanosecond laser ablation of solids. Appl. Phys. A Mater. Sci. Process. 1996, 63, 109–115. [Google Scholar] [CrossRef]
- Pan, L.; Pang, X.; Wang, F.; Huang, H.; Shi, Y.; Tao, J. Effect of surface micro-pits on mode-II fracture toughness of Ti-6Al-4V/PEEK interface. Compos. Struct. 2019, 229, 111333. [Google Scholar] [CrossRef]
- Sun, Z.; Huang, M. Fatigue crack propagation of new aluminum lithium alloy bonded with titanium alloy strap. Chin. J. Aeronaut. 2013, 26, 601–605. [Google Scholar] [CrossRef] [Green Version]
- Li, J.; Li, Y.; Xiang, Y.; Chen, J. Effect of low-velocity impact on the strength and durability of bonded joint in hygrothermal environment. J. Adhes. 2020, 1–16. [Google Scholar] [CrossRef]
- Hertveldt, I.; Cooman, B.C.D.; Meseure, K.; Xhoffer, C. ASTM D1002-72 Standard test method for strength properties of adhesive in shear by tension loading (metal-to-metal), 1983. ISIJ Int. 1999, 39, 1280–1288. [Google Scholar] [CrossRef]
- Amoruso, S.; Ausanio, G.; Barone, A.C.; Bruzzese, R.; Gragnaniello, L.; Vitiello, M.; Wang, X. Ultrashort laser ablation of solid matter in vacuum: A comparison between the picosecond and femtosecond regimes. J. Phys. B At. Mol. Opt. Phys. 2005, 38, L329–L338. [Google Scholar] [CrossRef]
- Fan, P.; Bai, B.; Zhong, M.; Zhang, H.; Long, J.; Han, J.; Wang, W.; Jin, G. General strategy toward dual-scale-controlled metallic micro–nano hybrid structures with ultralow reflectance. ACS Nano 2017, 11, 7401–7408. [Google Scholar] [CrossRef] [PubMed]
- Xu, Y.; Li, H.; Shen, Y.; Liu, S.; Wang, W.; Tao, J. Improvement of adhesion performance between aluminum alloy sheet and epoxy based on anodizing technique. Int. J. Adhes. Adhes. 2016, 70, 74–80. [Google Scholar] [CrossRef] [Green Version]
- Zhang, X.; Zhang, Y.; Ma, Q.; Dai, Y.; Hu, F.; Wei, G.; Xu, T.; Zeng, Q.; Wang, S.; Xie, W. Effect of surface treatment on the corrosion properties of magnesium-based fibre metal laminate. Appl. Surf. Sci. 2017, 396, 1264–1272. [Google Scholar] [CrossRef]
- Baldan, A. Adhesion phenomena in bonded joints. Int. J. Adhes. Adhes. 2012, 38, 95–116. [Google Scholar] [CrossRef]
- Park, S.-J.; Cho, M.-S.; Lee, J.-R. Studies on the surface free energy of carbon–carbon composites: Effect of filler addition on the ilss of composites. J. Colloid Interface Sci. 2000, 226, 60–64. [Google Scholar] [CrossRef]
- Zheng, R.; Lin, J.; Wang, P.-C.; Zhu, C.; Wu, Y. Effect of adhesive characteristics on static strength of adhesive-bonded aluminum alloys. Int. J. Adhes. Adhes. 2015, 57, 85–94. [Google Scholar] [CrossRef]
- Dalet, P.; Papon, E.; Villenave, J.-J. Surface free energy of polymeric materials: Relevancy of conventional contact angle data analyses. J. Adhes. Sci. Technol. 1999, 13, 857–870. [Google Scholar] [CrossRef]
- Shang, J.; Flury, M.; Harsh, J.B.; Zollars, R.L. Comparison of different methods to measure contact angles of soil colloids. J. Colloid Interface Sci. 2008, 328, 299–307. [Google Scholar] [CrossRef]
- Tian, F.; Li, B.; Ji, B.; Yang, J.; Zhang, G.; Chen, Y.; Luo, Y. Antioxidant and antimicrobial activities of consecutive extracts from Galla chinensis: The polarity affects the bioactivities. Food Chem. 2009, 113, 173–179. [Google Scholar] [CrossRef]
- Van Honschoten, J.W.; Brunets, N.; Tas, N.R. Capillarity at the nanoscale. Chem. Soc. Rev. 2010, 39, 1096–1114. [Google Scholar] [CrossRef]
- Bico, J.; Tordeux, C.; Quere, D. Rough wetting. Europhys. Lett. 2001, 55, 214–220. [Google Scholar] [CrossRef] [Green Version]
- Kim, J.G.; Choi, I.; Gil Lee, D. Contact angle and wettability of hybrid surface-treated metal adherends. J. Adhes. Sci. Technol. 2013, 27, 794–810. [Google Scholar] [CrossRef]
- Flanagan, J.; Schütze, P.; Dunne, C.; Twomey, B.; Stanton, K.T. Use of a blast coating process to promote adhesion between aluminium surfaces for the automotive industry. J. Adhes. 2018, 96, 580–601. [Google Scholar] [CrossRef]
- Zheng, R.; Lin, J.; Wang, P.-C.; Wu, Q.; Wu, Y. Effects of a sheet metal stamping lubricant on static strength of adhesive-bonded aluminum alloys. J. Adhes. Sci. Technol. 2015, 29, 1382–1402. [Google Scholar] [CrossRef]
- Mathijsen, D. The black magic of carbon fiber reinforced thermoplastics. Reinf. Plast. 2015, 59, 185–189. [Google Scholar] [CrossRef]
- Rudawska, A.; Danczak, I.; Müller, M.; Valasek, P. The effect of sandblasting on surface properties for adhesion. Int. J. Adhes. Adhes. 2016, 70, 176–190. [Google Scholar] [CrossRef]
- Bresson, G.; Jumel, J.; Shanahan, M.E.; Serin, P. Strength of adhesively bonded joints under mixed axial and shear loading. Int. J. Adhes. Adhes. 2012, 35, 27–35. [Google Scholar] [CrossRef]
- Prolongo, S.G.; Rosario, G.; Ureña, A. Study of the effect of substrate roughness on adhesive joints by SEM image analysis. J. Adhes. Sci. Technol. 2006, 20, 457–470. [Google Scholar] [CrossRef]
- Prolongo, S.G.; del Rosario, G.; Ureña, A. Comparative study on the adhesive properties of different epoxy resins. Int. J. Adhes. Adhes. 2006, 26, 125–132. [Google Scholar] [CrossRef]


| Fe | Si | Cu | Mn | Mg | Ag | Zn | Li | Zr | Ti | Al |
|---|---|---|---|---|---|---|---|---|---|---|
| 0.03 | 0.01 | 3.64 | 0.29 | 0.71 | 0.32 | 0.36 | 0.68 | 0.12 | 0.03 | Bal |
| Property | Al–Li Alloy [20] | PEEK |
|---|---|---|
| Tensile strength σb (MPa) | 532 | 116 a |
| Elastic modulus (GPa) | 75.9 | 3.73 a |
| Poisson’s ratio | 0.33 | 0.28 [18] |
| Elongation (%) | 12.5 | - |
| Parameters | P-0 | P-1 | P-2 | P-3 | P-4 | P-5 |
|---|---|---|---|---|---|---|
| Scanning speed/(mm/s) | untreated | 25 | 20 | 15 | 10 | 5 |
| Parameter | Value |
|---|---|
| Mean power/W | 0.35 a |
| Repetition frequency/kHz | 1 b |
| Pulse width/fs | 120 b |
| Beam diameter/μm | 5 b |
| Hatch spacing/μm | 100 |
| Wetting Liquids | |||
|---|---|---|---|
| Distilled water | 72.8 | 21.8 | 51.0 |
| Glycol | 48.3 | 29.3 | 19.0 |
| Samples | Contact Angle (°) | Polar Component (mJ/m2) | Dispersive Component (mJ/m2) | Surface Free Energy (mJ/m2) | |
|---|---|---|---|---|---|
| Distilled Water | Glycol | ||||
| P-0 | 82.32 | 58.51 | 7.79 | 20.86 | 28.65 |
| P-1 | 31.18 | 9.37 | 59.84 | 6.94 | 66.78 |
| P-2 | 20.30 | 5. 66 | 73.44 | 4.00 | 77.44 |
| P-3 | 12.07 | 4.04 | 80.74 | 2.81 | 83.55 |
| P-4 | 20.92 | 6.94 | 72.99 | 4.04 | 77.03 |
| P-5 | 41.79 | 11.12 | 43.37 | 12.60 | 55.97 |
| Parameters | P-0 | P-1 | P-2 | P-3 | P-4 | P-5 |
|---|---|---|---|---|---|---|
| Al/at.% | 93.45 | 86.03 | 86.07 | 85.92 | 85.71 | 84.82 |
| O/at.% | 5.42 | 12.07 | 12.64 | 12.75 | 13.40 | 13.77 |
| Others/at.% | 1.13 | 1.90 | 1.29 | 1.33 | 0.89 | 1.41 |
Publisher’s Note: MDPI stays neutral with regard to jurisdictional claims in published maps and institutional affiliations. |
© 2021 by the authors. Licensee MDPI, Basel, Switzerland. This article is an open access article distributed under the terms and conditions of the Creative Commons Attribution (CC BY) license (https://creativecommons.org/licenses/by/4.0/).
Share and Cite
Chen, J.; Li, Y.; Huang, M.; Dong, L. Tailoring Al–Li Alloy Surface Wettability with a Femtosecond Laser and Its Effect on Bonding Performance. Coatings 2021, 11, 995. https://doi.org/10.3390/coatings11080995
Chen J, Li Y, Huang M, Dong L. Tailoring Al–Li Alloy Surface Wettability with a Femtosecond Laser and Its Effect on Bonding Performance. Coatings. 2021; 11(8):995. https://doi.org/10.3390/coatings11080995
Chicago/Turabian StyleChen, Jun, Yibo Li, Minghui Huang, and Lei Dong. 2021. "Tailoring Al–Li Alloy Surface Wettability with a Femtosecond Laser and Its Effect on Bonding Performance" Coatings 11, no. 8: 995. https://doi.org/10.3390/coatings11080995