Article

The Relationship between Coating Property and Solid Particle Erosion Resistance of AIP-Deposited TiAlN Coatings with Different Al Contents

1
Applied Physics Research Laboratory, Kobe Steel Ltd., 1-5-5 Takatuskadai Nishiku, Kobe 651-2271, Hyogo, Japan
2
Fukui Tecco Co., Ltd., Fukui 910-0831, Japan
3
Department of Mechanical Engineering, University of Fukui, Fukui 910-8507, Japan
*
Author to whom correspondence should be addressed.
Coatings 2021, 11(8), 992; https://doi.org/10.3390/coatings11080992
Submission received: 29 June 2021 / Revised: 28 July 2021 / Accepted: 17 August 2021 / Published: 20 August 2021
(This article belongs to the Special Issue Hard Coatings for Surface Engineering Solutions)

Abstract

:
TiAlN coatings with different Al ratios were deposited by the cathodic arc ion plating (AIP) method, and the relationship between solid particle erosion resistance and structural, mechanical properties was investigated by a micro slurry-jet erosion (MSE) test. The crystal structure of TiAlN coating changes depending on the Al ratio. The coating shows a B1 single cubic phase between the Al ratio of 0 and 0.58; above this ratio, formation of a B4 hexagonal phase is observed. The mechanical properties such as hardness and Young’s modulus of the TiAlN coating also depend on the Al ratio and the crystal structure. The erosion rate decreases by increasing the Al ratio up to 0.58, as the coating is a cubic single phase. The TiAlN coating shows the lowest erosion rate at an Al ratio of 0.58. The erosion rate increases drastically as the crystalline phase changes from the B1 cubic to B4 hexagonal phase at the Al ratio of more than 0.58. The change in erosion rate is also discussed in connection with mechanical properties such as erodent particle hardness to coating hardness ratio and coating hardness to Young’s modulus ratio.

1. Introduction

Erosion by hard and solid particles (solid particle erosion or SPE) is commonly observed for various machine elements in many industrial applications, such as the blades used in gas and steam turbines [1,2,3]. In the case of gas turbines for land-based power generation, or jet engines for aerospace applications, the main cause of erosion of turbine blades is by incoming hard, foreign particles such as sand or volcano ash [1,2]. For steam turbines, in thermal power generation plants, oxide scale from the inner surface of the boiler tube is the primary erodent [3]. The erosion changes the component shape and results in deterioration of the aerodynamic properties or a loss in power-generating efficiency.
To prevent SPE, various surface modification techniques are used, such as cladding, thermal spraying, diffusion treatment [4], chemical vapor deposition (CVD) [5,6] and physical vapor deposition (PVD). Among these surface treatments, PVD coating is widely used for erosion resistant applications and various coating materials and architectures of coatings are investigated. TiN is a common coating material for SPE protection; therefore, the effect of coating properties on erosion resistance has been investigated thoroughly [7,8,9,10,11,12]. Sue et al. reported the effect of crystallographic orientation on the SPE resistance of arc-evaporated TiN coatings [7]. TiN coatings with (111) or (200) textures, deposited under various substrate bias, showed a decrease in the erosion rate by increasing the I(111)/I(200) ratio by a factor of two. Sue et al. also reported that SPE behavior was influenced by residual stress for arc-deposited TiN coatings [8]. TiN coatings were deposited on different substrate materials with various thermal expansion coefficients. The coatings had various degrees of residual stress due to thermal expansion mismatch between the substrate and coating. An increasing d (111) value resulted in the erosion rate increasing linearly, which suggested that highly stressed coating had poor erosion resistance. Coating architectures, such as Ti/TiN multilayer coating, have been investigated by several research groups [9,10,11,12].
Adding Al to TiN significantly improves two vital protective features of the coating: hardness and environmental oxidation resistance [13,14]. Applications of TiAlN coating to improve SPE resistance have been reported recently [15,16,17,18,19]. SPE resistance of arc ion plating (AIP)-deposited TiAlN, with unspecified Al content, was investigated in comparison with AlCrN, TiN and CrN coatings [15]. TiAlN coating showed the lowest erosion rate for SiC erodent particles of 40–100 mm with a 90° incident angle, and also showed a correlation between the hardness to elastic modulus ratio H3/E2 and erosion resistance. Ikeda reported that the mechanical as well as chemical properties of TiAlN depended on Al content [13]. The crystal structure of TiAlN coating changed from a cubic rock salt phase (B1) to a hexagonal wurtzite phase (B4) when the Al content was more than 60 at.% (only metallic component). The sudden decrease in hardness was consistent with changes in the crystal structure. Yang et al. reported on the erosion behavior of sputter-deposited TiAlN coatings, with Al composition ranging between 10 at.% and 35 at.% using Al2O3 erodent particles with an average diameter of 50 mm [17]. The erosion rate was lowest at an Al composition between 10 at.% and 30 at.%; however, exact composition was not specified in the literature. Although the coating contained a soft hexagonal wurtzite phase, hardness and Young’s modulus increased almost monotonically with the Al content.
In this paper, an investigation was conducted on the erosion resistance of TiAlN coatings with different Al compositions. The TiAlN coatings were deposited by cathodic arc deposition, and the relationship between the Al content and coating properties such as crystal structure, hardness and residual stress was studied. For these TiAlN coatings, SPE evaluation was conducted by our developed micro slurry-jet erosion (MSE) equipment using an impacting slurry-jet containing angular alumina particles.

2. Materials and Methods

2.1. Coating Deposition

All TiAlN coatings were deposited with a commercial AIP deposition equipment (AIP-SS002, Kobe Steel Ltd., Kobe, Japan) using a magnetically steered cathodic arc evaporation source. Cathodic arc deposition is based on a low voltage vacuum arc discharge between a cathode (evaporation material or target) and an anode (usually a grounded vacuum chamber wall). The cathode material is thermally evaporated by the vacuum arc and ionized. It is then deposited on the substrate. The principle of the deposition method can be found in the relevant literatures [20,21]. The arc source uses a target of 100 mm diameter and 16 mm thickness. The chemical composition of a TiAl target was varied from Al = 0 at.% (pure Ti), 10 at.%, 25 at.%, 30 at.%, 50 at.%, 60 at.%, 66 at.%, to 75 at.% to produce TiAlN coatings with different Al compositions. The targets with Al contents of 50 at.% or less were produced using the melting method, and targets with more Al compositions were produced by the powder metallurgical method. Mixed Al and Ti powder was used as a starting material and densified by hot isostatic pressing or hot forging. Substrates for deposition were mirror-polished WC-Co (UTi20T, MMC) for compositional, structure and mechanical property analysis, and for erosion resistance evaluation, they were mirror-polished precipitation-hardened stainless steel 17–4 PH with a standard heat treatment condition (H1025 JIS G4303:2012). The substrates were cleaned in an ethanol ultrasonic bath and set in a vacuum chamber. After pumping to the base pressure of 10−3 Pa, the samples were heated to 550 °C and cleaned by Ar ion etching using a filament type ion source. Arc deposition of TiAlN coating was performed under the following conditions: arc discharge current = 150 A, substrate bias = −30 V and N2 pressure = 4 Pa. Coating thickness ranged from 5 to 10 mm.

2.2. Coating Analysis

Coating deposited on the WC-Co substrate was used for EDX for compositional, XRD for structural and residual stress and nano-indentation for mechanical property analysis. Chemical composition was measured by SEM (Hitachi, S-3500N, Tokyo, Japan)-EDX (Horiba, EMAX ENERGY EX-420, Kyoto, Japan) with ZAF correction and the resulting Al ratio was defined as Al/(Al+Ti) in atomic ratio. The surface morphology after the erosion test was observed by SEM (Hitachi, S-3000N) and AFM (Shimadzu SPM-9600, Kyoto, Japan). XRD diffraction with Bragg-Brentano geometry (symmetric scan) was conducted by an X-ray diffractometer (Rigaku RINT Ultima-PC, Tokyo, Japan) with a Cu tube X-ray source. Measurement conditions were as follows: Cu ka (graphite (002) monochromated), 40 kV–40 mA and scanning speed was 2°/min. The residual stress of coating was measured using X-ray diffraction by the multiple HKL method [22]. The XRD profile was measured by asymmetric (thin film) geometry at an incident angle of 5°. The peak position of TiAlN in the B1 rock salt phase was calculated by a peak fitting using a Gaussian shape function, and the residual stress was calculated sin2y to strain, where Young’s modulus was derived from nano-indentation measurements, assuming the Young’s modulus was isotropic. A Poisson ratio of 0.22 was used for a typical value of nitride coating [23]. Indentation hardness and Young’s modulus were measured with nano-indentation equipment (Elionix ENT-1100, Hachioji, Japan) with a Berkovich type diamond indenter. Measurement was performed at maximum loads of 2, 5, 7, 10, and 20 mN for each 5 repetitions, and hardness and Young’s modulus were calculated after the indenter tip shape correction proposed by Tanaka [24].

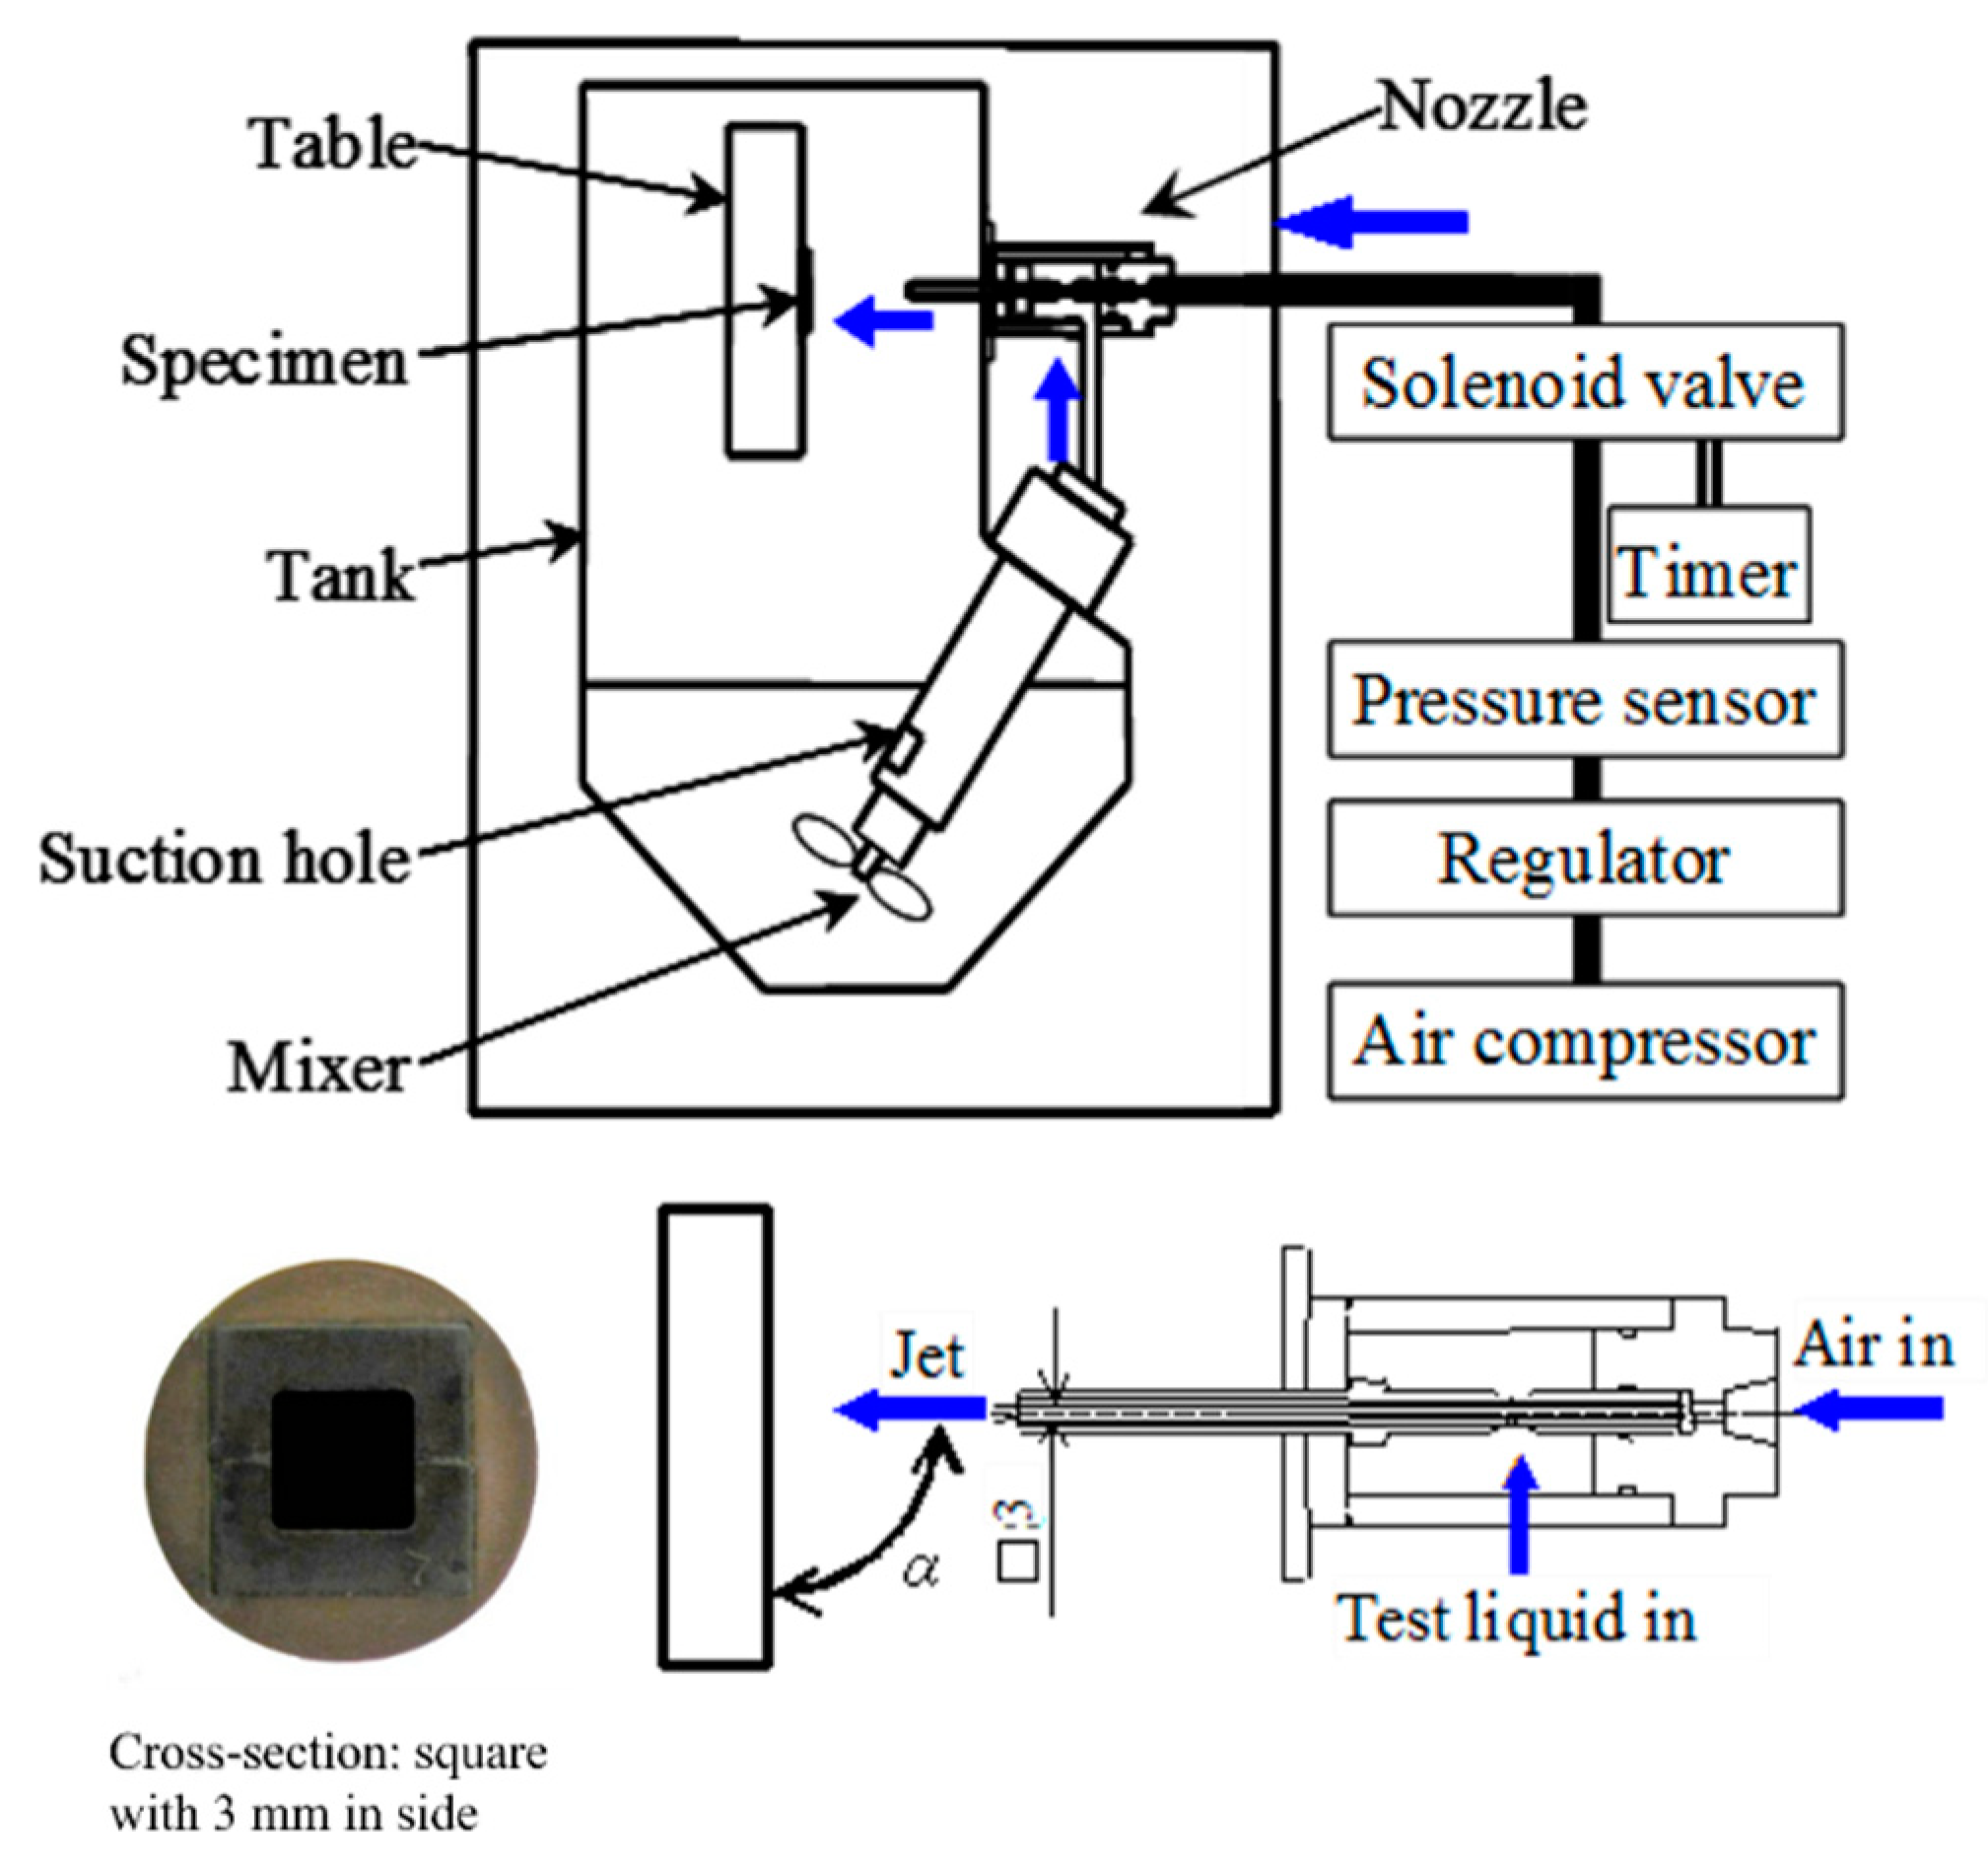
2.3. Erosion Resistance Evaluation

The erosion resistance was evaluated using a micro slurry-jet erosion (MSE, Palmeso Co. Ltd., Nagaoka, Japan) test equipment. The principle of the MSE test is described in [25,26]; a schematic figure of the MSE equipment is shown in Figure 1.
MSE uses a high-speed impingement of slurry-jet containing hard particles (erodents) such as alumina. In this study, alumina particles with an average diameter of approximately 40 mm were used as erodents and mixed with distilled water at 1 wt.%. An SEM image of the alumina particles is shown in Figure 2.
The slurry-jet was ejected from a nozzle with a 3 mm × 3 mm aperture and projected on the sample at a distance of 10 mm. The alumina particles in water were accelerated by compressed air in the nozzle at a pressure of 0.5 MPa and the subsequent velocity of the slurry-jet was estimated to be approximately 100 m/s when at its maximum at the nozzle aperture based on a high-speed video camera observation [27]. The incident angle of the slurry-jet was at a 90° angle to the sample’s surface. The erosion depth of the coated sample was measured periodically during the erosion test by a surface profilometer (Tokyo Seimitsu, SURFCOM 1400D, Hachioji, Japan). Typical erosion profiles of TiAlN coating after the MSE test are shown in Figure 3. At each test interval, the difference in depth between the original and the eroded surface was measured at the deepest area in the central region of the erosion scar, and the measured value was defined as the erosion depth. The erosion test was repeated three times and the erosion rates were calculated for each sample based on the erosion depth increase per minute by taking the average over several measurements during different test periods. All MSE tests were conducted at room temperature.

3. Results

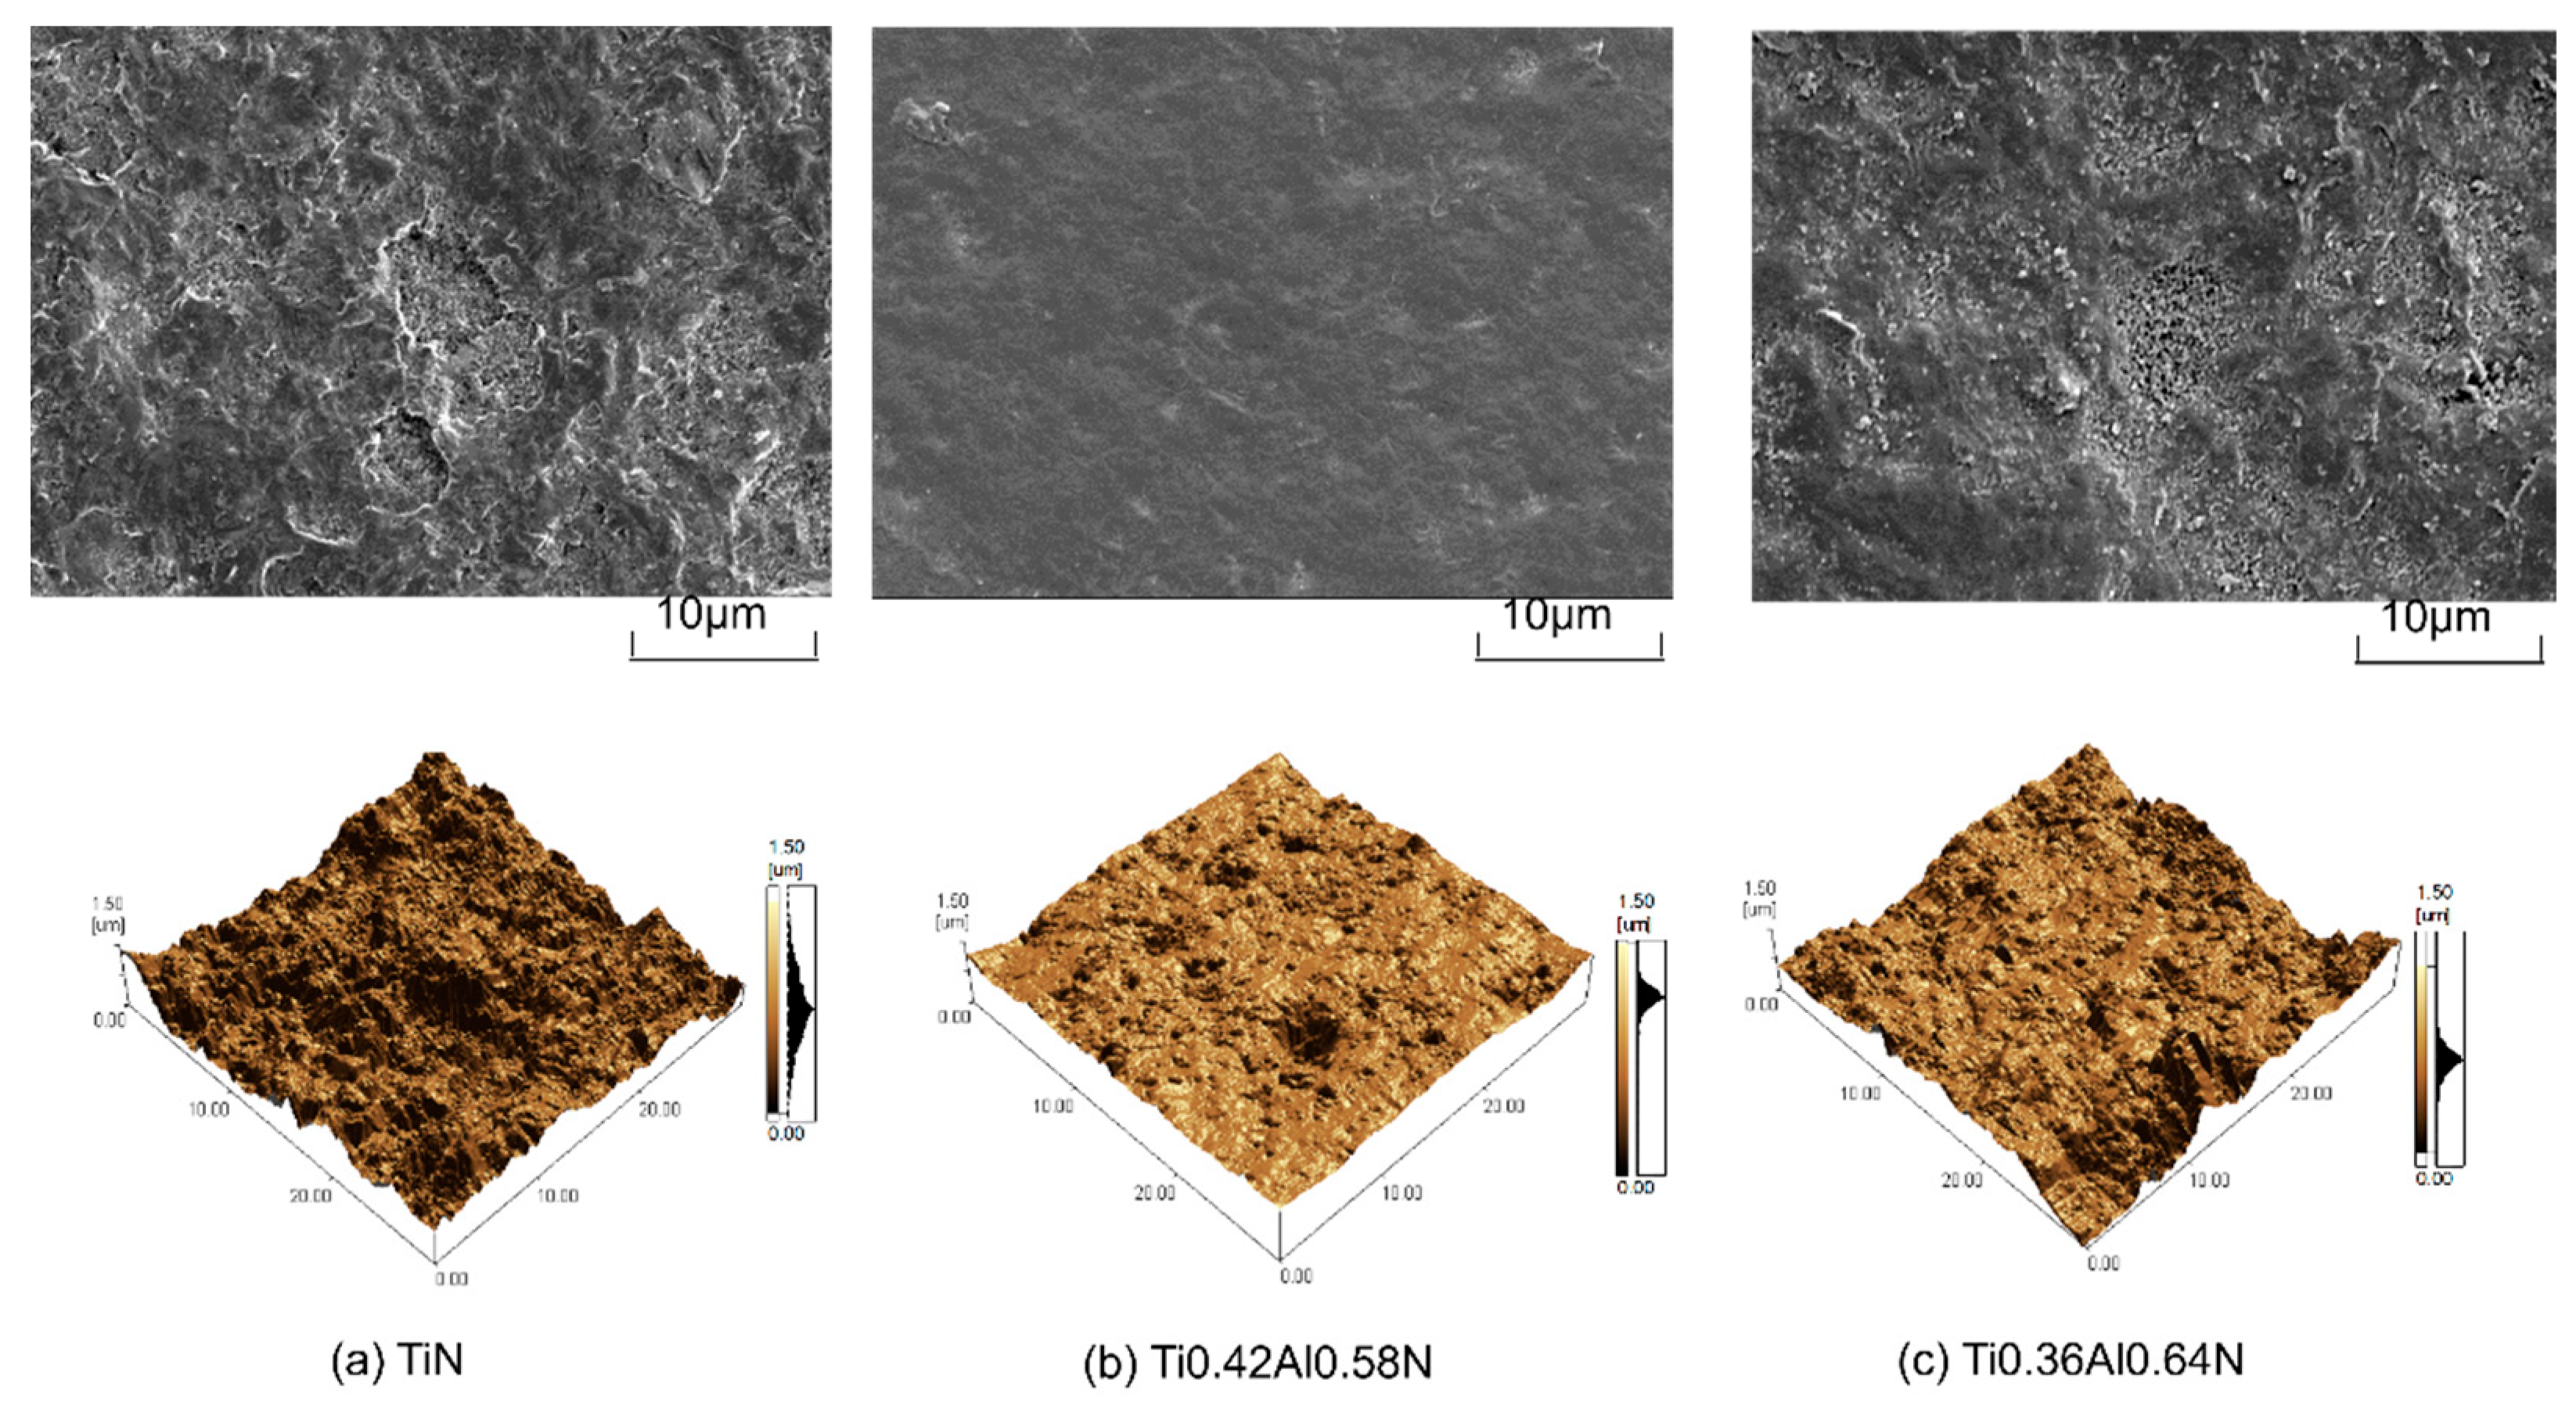
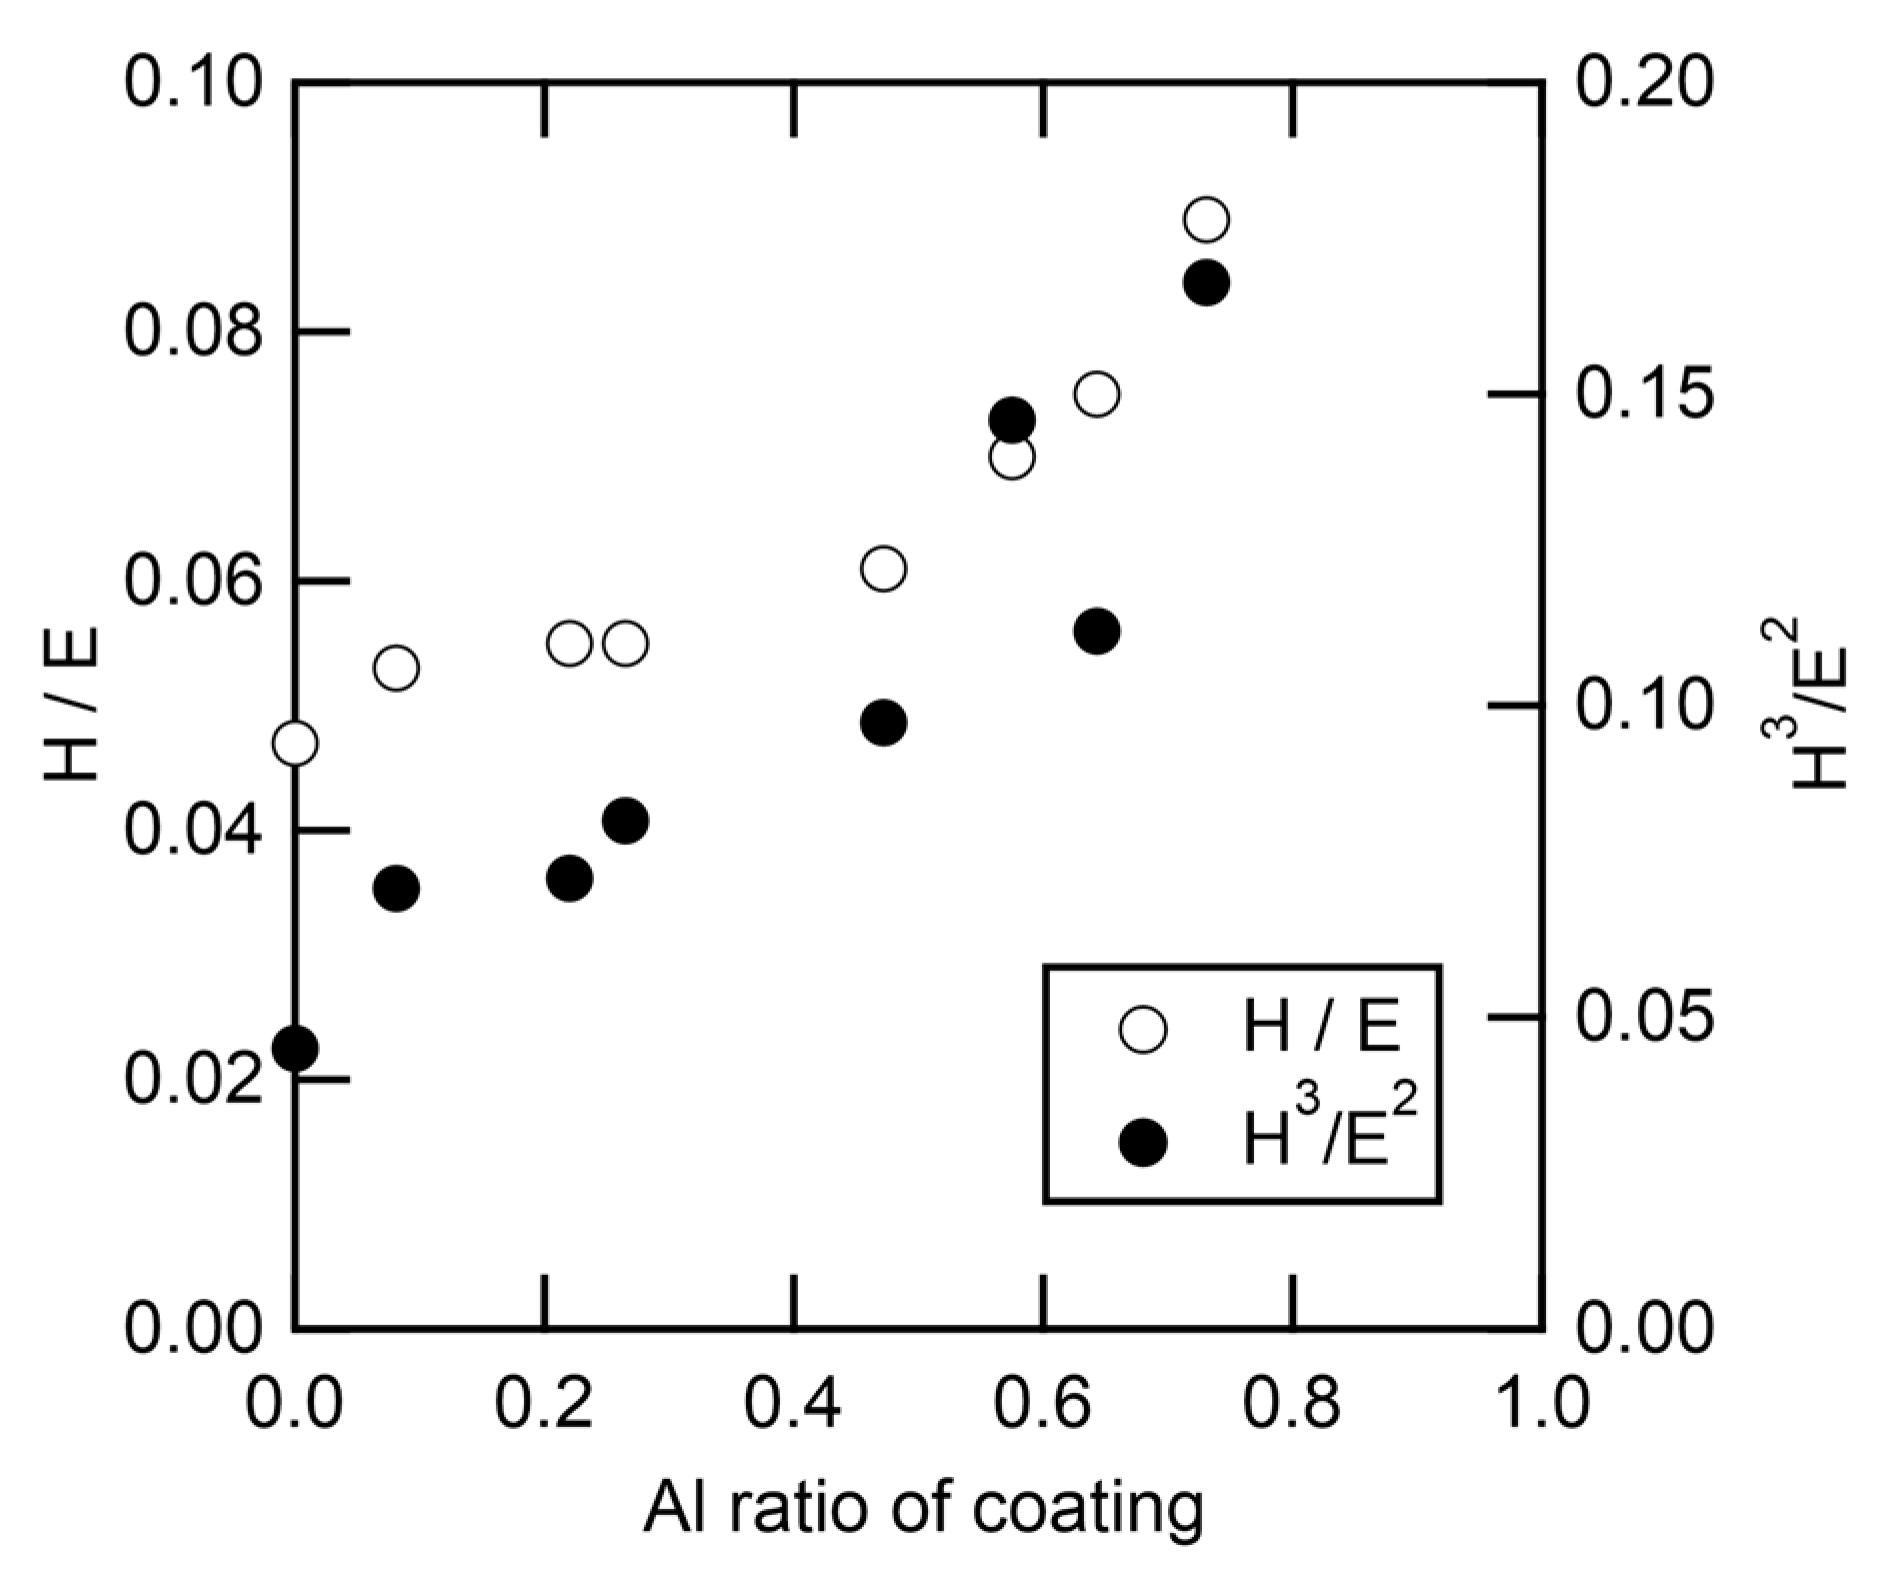
3.1. Coating Characterization

A comparison between the target composition and the coating composition is shown in Table 1.
The Al ratio of the coating is always smaller than that of the target. It is reported that, for a multi-component coating containing elements with different atomic masses, the Al ratio becomes slightly smaller than the Al ratio of the target due to re-sputtering by incoming ions [20]. It is also possible that Al is preferentially scattered by the collision with N2 molecules because Al has an atomic mass close to an N2 molecule. N2 pressure during the deposition is 4 Pa. This is high enough to expect frequent collisions of Al ions with N2 molecules.
Figure 4 shows X-ray diffraction patterns of TiN and TiAlN coatings with different Al ratios.
Diffraction from B4 (100) is located around a diffraction angle of 34°. Diffraction from B1 (111) is from 37° to 38° while B1(200) is from 42° to 44°. These peaks shift slightly to a higher diffraction angle as the Al ratio is increased. For TiN, only diffraction from B1 cubic phase with (111) preferred orientation is observed. Between Al ratios 0.08 and 0.58, the coatings are cubic single phase and only (111) and (200) peaks are observed. Both peaks shift to higher diffraction angles as the Al ratio is increased, suggesting the lattice constant of TiAlN decreases at a higher Al content. In addition, change in diffraction peak width changes with the Al ratio. The increase in the peak width of B1(200) with the Al ratio suggests a decrease in grain size. Above the Al ratio of 0.58, both B4 and B1 peaks are observed, indicating the coating is a mixture of the cubic and hexagonal phase.
Hardness and Young’s modulus of each coating have been measured by nano-indentation, and the results are shown in Figure 5.
The hardness of TiN is approximately 20 GPa and the hardness increases with the Al ratio up to approximately 30 GPa at an Al ratio of 0.58. Hardness, however, decreases significantly when the coating Al ratio is more than 0.58, which corresponds to the change in crystal structure from cubic to hexagonal phase. Young’s modulus shows a similar behavior to hardness and decreases rapidly above an Al ratio of 0.58. This is associated with phase transition from the cubic to the hexagonal phase.
Residual stress was measured by X-ray diffraction method up to the Al ratio of 0.58 using diffraction peaks from the cubic phase, and the value of Young’s modulus was measured by nano-indentation. The results are shown in Figure 6.
Above an Al ratio of 0.58, the intensity of the diffraction peaks from the cubic phase was not sufficient to calculate stress. Residual stress, except for Ti0.92Al0.08N, generally decreases with the Al ratio increases.

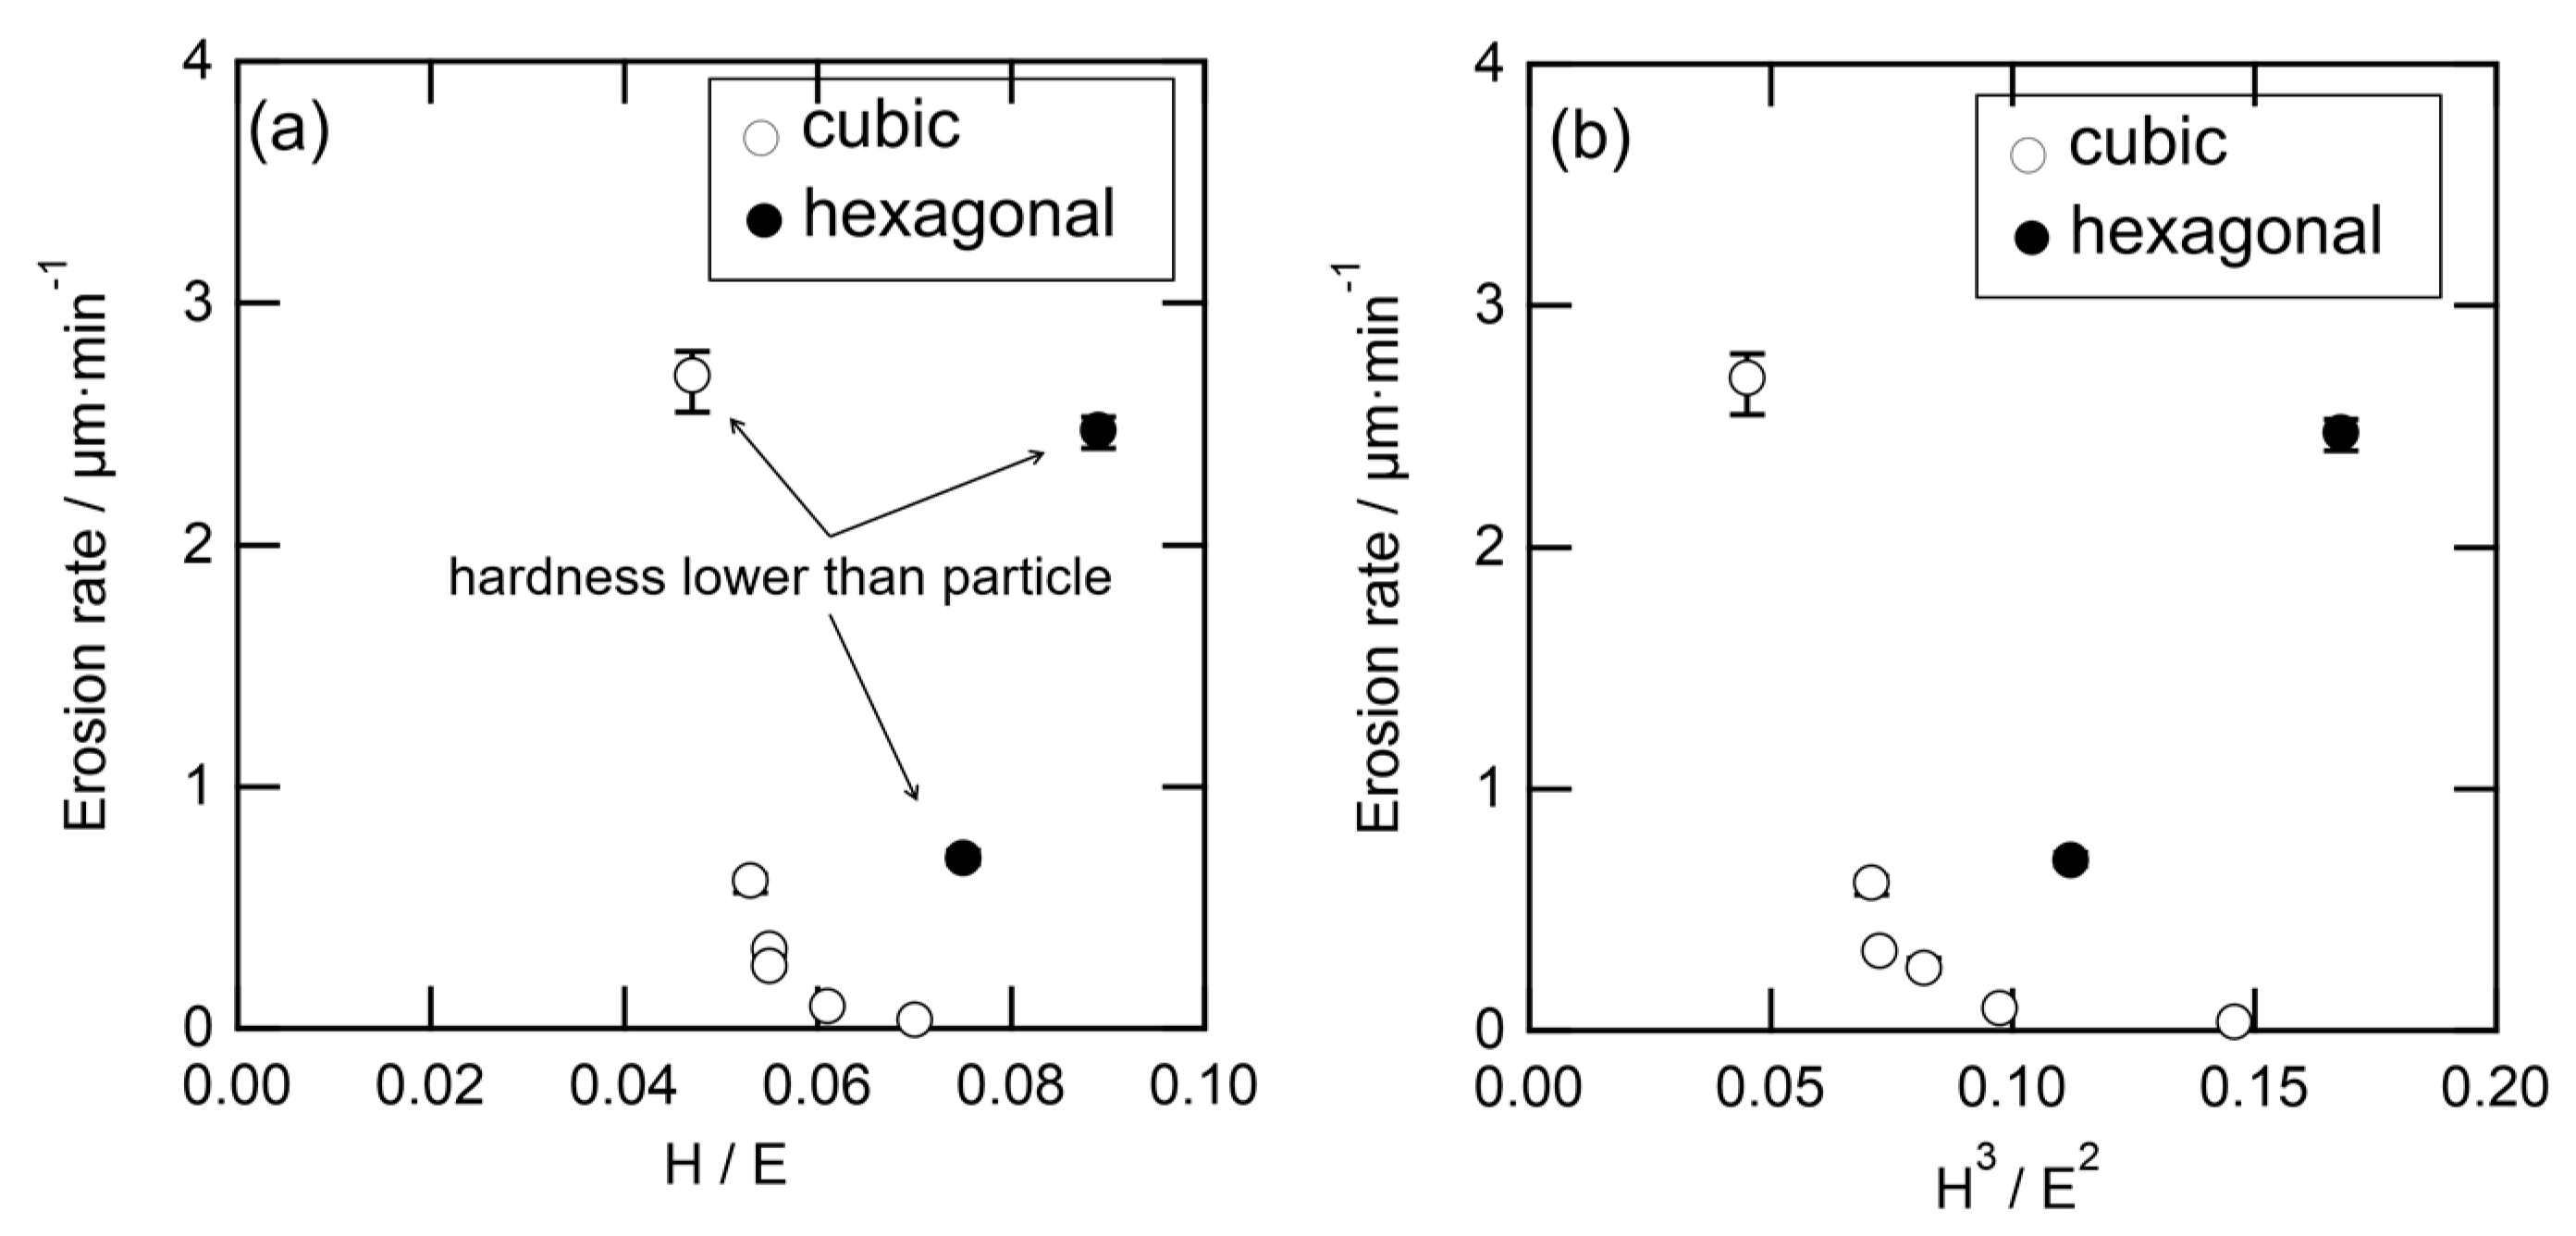
3.2. Erosion Resistance of TiAlN Coatings with Different Al Ratios

Erosion tests were conducted using the MSE equipment and the results are shown in Figure 7. The scatter bar shows the maximum and minimum values of the erosion rates for three tests.
The initial erosion rate of TiN is 2.7 µm/min and starts to decrease abruptly as the Al ratio increases up to 0.58. The lowest erosion rate of 0.036 mm/min is obtained at the Al ratio of 0.58, and a sudden increase is observed when the Al ratio increases more than 0.58. Figure 8 shows SEM and AFM images of TiAlN coatings with different Al ratios after a certain period during the erosion test.
As observed from the AFM and SEM images, the surfaces of the eroded areas with a high erosion rate in Figure 8a,c are rough and flaking, and cracking can be observed compared to the coating with a low erosion rate (in Figure 8b).

4. Discussion

The relationship between erosion rate and Al ratio, as shown in Figure 7, is clearly connected to the structural and mechanical properties of a given coating. The erosion rate decreases monotonically with the Al ratio between 0 and 0.58. In this composition range, crystal structure remains B1 cubic phase, and the erosion rate increases drastically when the crystal structure changes to a mixture of B1 and B4 hexagonal phases. There is a notable change in mechanical properties accompanied with the change in the crystal structure as measured by the nano-indentation (Figure 5).
There are several theories and proposals that describe the relationship between mechanical properties and particle impact erosion behavior. Hardness is an important factor for erosion behavior, and the relationship between erosion rate and particle hardness (Hp) and surface hardness (Ht) is reported [28,29]. Wada reported the particle erosion behavior of ceramic materials using particles with different hardness values. The erosion rate increased drastically when the hardness of the particle (Hp) was higher than the hardness of the ceramics (Ht). Wada also reported that the erosive wear mechanism of ceramic material changed depending on the Ht to Hp ratio. For Ht /Hp < 1, a material fracture with a lateral crack formation is a major mechanism and for Ht /Hp > 1, while scratching and Herzian crack formation at a high kinetic energy region are major mechanisms.
Figure 9 shows the relationship between the hardness and erosion rate of the TiAlN coatings.
There is an abrupt change in erosion rate for hardness at around 20 GPa which is close to the hardness of the alumina particle [29]. For coating (TiN, Ti0.27Al0.73N and Ti0.36Al0.64N) with hardness (Ht), the erosion rate is lower than the alumina particle hardness (Hp). The erosion rate is higher for the coatings with Hp/Ht < 1. For TiN and Ti0.36Al0.64N, cracking and flaking are observed on the eroded surface, which suggests formation of lateral cracking (Figure 8). On the other hand, the surface is relatively smooth, and no sign of cracking can be observed for Ti0.42Al0.58N with Hp/Ht < 1. These observations agree with the erosion mechanism proposed by Wada [28].
Hardness-to-elastic-modulus ratio, H/E or H3/E2, is also proposed [29,30] as a factor affecting the SPE. A material with a large H/E or H3/E2 is considered to be SPE resistant. This also means it has resistance to plastic deformation (large H) and absorbs impact energy (small E). Figure 10 shows the relationship between the Al ratio and H/E or H3/E2 of AlTiN coatings.
H/E and H3/E2 show similar behavior against the Al ratio, and both increase with the Al ratio. In the case of H3/E2, a sudden increase is observed for Ti0.42Al0.58N and scattering is large. Figure 11 shows the relationship between (a) H/E or (b) H3/E2 and erosion rate.
As shown in Figure 11, neither H/E nor H3/E2 can completely explain the observed erosion behavior. However, between the Al ratio of 0 and 0.58, where the crystal structure is cubic single phase, a larger H/E value results in a low erosion rate; however, this tendency is not observed for the coatings containing B4 phase. Based on the discussion of Figure 10 and Figure 11, we think that both hardness and H/E affect the erosion rate of the TiAlN coating. For coatings whose hardness is lower than the erodent particles, a high erosion rate is observed independent of H/E values. However, once the coating hardness becomes larger than the particle, Hp/Ht < 1, the erosion rate is strongly affected by H/E.
Sue et al. reported a correlation between the residual stress and the erosion rate for arc-evaporation TiN coatings [8]. Furthermore, the erosion rate increased with increasing residual stress; this was shown by brittle fractures accompanied by large scale chipping. In this study, the erosion rate decreased when the Al ratio increased up to 0.58 while the compressive residual stress increased, which was the opposite behavior to reference [8]. No sign of brittle fracture was observed for the eroded surface of Ti0.42Al0.58N coating; therefore, the residual stress seemed not to be a major influencing factor in this study.
Another factor which can influence erosion behavior is the grain size of a coating. In Figure 8, SEM and AFM images show different morphologies of the eroded surface. TiN shows a rather rough surface, while Ti0.42Al0.58N shows a much smoother surface after the erosion test. This difference in roughness of eroded surface can be due to the grain size of the TiAlN coating. Figure 12 shows the relationship between the Al ratio of the coating and full width of half maximum (FWHM) of (200) peak of the B1 phase.
By comparing FWHM, Ti0.42Al0.58N have a much smaller grain size than TiN. We reported crack formation at the grain boundary and grain detachment took place in the erosion tests with large particles (which is the same used in this study) [31]. Assuming the same erosion mechanism, the erosion rate of Ti0.42Al0.58N can be smaller than TiN because the amount of grain boundary increases as the grain size decreases. This agrees with the result of our erosion test, and the surface morphology of eroded area suggests the number of detached grains during the erosion process is smaller for Ti0.42Al0.58N (Figure 8).

5. Conclusions

The relationship between the erosion behavior and the properties of AIP-deposited TiAlN coatings with different Al ratios was investigated with our developed micro slurry-jet erosion (MSE) test as a primary erosion evaluation method. TiAlN coating showed a series of structural changes from the cubic B1 to the hexagonal B4 phase, depending on Al composition, and a corresponding change in mechanical properties was observed. The erosion rate strongly depends on the Al ratio of coating, and it decreases as the Al ratio increases up to an Al ratio of 0.58. However, once the Al ratio exceeds 0.58, where the coating becomes a mixture of the cubic and the hexagonal phases, the erosion rate increases rapidly. The change in erosion rate is discussed in connection with the particle’s relative hardness to the coating (Hp/Ht) and the coating’s hardness to Young’s modulus ratio (H/E, H3/E2). For the coatings with Hp/Ht > 1, the primary erosion mechanism is lateral cracking, as suggested from the SEM observation of the eroded surface, and the correlation to H/E, H3/E2 is rather small. However, for the coatings with Hp/Ht < 1, the eroded surface is rather smooth, and the erosion rate strongly depends on H/E. Crystal grain size of the coating is also suggested as a factor that affects erosion rates.

Author Contributions

Conceptualization, Y.I. and K.Y.; methodology, Y.I.; validation, Y.I.; formal analysis, Y.T.; investigation, Y.T. and K.Y.; data curation, Y.I.; writing—original draft preparation, K.Y.; writing—review and editing, Y.I.; super vision, Y.I. All authors have read and agreed to the published version of the manuscript.

Funding

This research received no external funding.

Institutional Review Board Statement

Not applicable.

Informed Consent Statement

Not applicable.

Data Availability Statement

The data presented in this study are available on request from the corresponding author. The data are not publicly available.

Conflicts of Interest

The authors declare no conflict of interest.

References

  1. Hamed, A.A.; Tabakoff, W.; Rivir, R.B.; Das, K.; Arora, P. Turbine blade surface deterioration by erosion. J. Turbomach. 2015, 127, 445–452. [Google Scholar] [CrossRef]
  2. DeMasi-Marcin, J.T.; Gupta, D.K. Protective coatings in the gas turbine engine. Surf. Coat. Technol. 1994, 68–69, 1–9. [Google Scholar] [CrossRef]
  3. Yang, L.; Nakatani, Y.; Yamada, M.; Abe, T.; Kitaguchi, K.; Ono, Y.; Yamamoto, K.; Munemasa, J. Evaluation and application of hard coatings for steam turbine. In Proceedings of the ASME 2017 Power Conference Joint With ICOPE-17, Charlotte, NC, USA, 26–30 June 2017; p. POWER-ICOPE2017-3440. [Google Scholar]
  4. Levy, A.V.; Wang, B. Erosion of hard material coating systems. Wear 1988, 121, 325–346. [Google Scholar] [CrossRef]
  5. Olsson, M.; Hedenqvist, P.; Stridh, S.; Sönderberg, S. Solid particle erosion resistance of hard chemically vapour deposited coatings. Surf. Coat. Technol. 1989, 37, 321–327. [Google Scholar] [CrossRef]
  6. Bose, K.; Wood, R.; Wheeler, D. High energy solid particle erosion mechanisms of superhard CVD coatings. Wear 2005, 259, 135–144. [Google Scholar] [CrossRef]
  7. Sue, J.; Troue, H. Effect of crystallographic orientation on erosion characteristics of arc evaporation titanium nitride coating. Surf. Coat. Technol. 1987, 33, 169–181. [Google Scholar] [CrossRef]
  8. Sue, J.A.; Troue, H.H. Influence of residual compressive stress on erosion behavior of arc evaporation titanium nitride coating. Surf. Coat. Technol. 1988, 36, 695–705. [Google Scholar] [CrossRef]
  9. Bromark, M.; Larsson, M.; Hedenqvist, P.; Hogmark, S. Wear of PVD Ti/TiN multilayer coatings. Surf. Coat. Technol. 1997, 90, 217–223. [Google Scholar] [CrossRef]
  10. Bemporad, E.; Sebastiani, M.; Pecchio, C.; de Rossi, S. High thickness Ti/TiN multilayer thin coatings for wear resistant applications. Surf. Coat. Technol. 2006, 201, 2155–2165. [Google Scholar] [CrossRef]
  11. Feuerstein, A.; Kleyman, A. Ti–N multilayer systems for compressor airfoil sand erosion protection. Surf. Coat. Technol. 2009, 204, 1092–1096. [Google Scholar] [CrossRef]
  12. Bonu, V.; Jeevitha, M.; Kumar, V.P.; Barshilia, H.C. Nanolayered multilayer Ti/TiN coatings: Role of bi-layer thickness and annealing on solid particle erosion behaviour at elevated temperature. Surf. Coat. Technol. 2019, 357, 204–211. [Google Scholar] [CrossRef]
  13. Ikeda, T.; Sato, H. Properties of hard coating in the TiAlN system prepared by the cathodic arc ion plating method. Presented at the 5th International Symposium of the Japan Welding Society 5JWs-II-20, Osaka, Japan, 1990. [Google Scholar]
  14. Münz, W. Titanium aluminum nitride films: A new alternative to TiN coatings. J. Vac. Sci. Technol. A 1986, 4, 2717–2725. [Google Scholar] [CrossRef]
  15. Jianxin, D.; Fengfang, W.; Yunsong, L.; Youqiang, X.; Shipeng, L. Erosion wear of CrN, TiN, CrAlN, and TiAlN PVD nitride coatings. Int. J. Refract. Met. Hard Mater. 2012, 35, 10–16. [Google Scholar]
  16. Yang, Q.; McKellar, R. Nanolayered CrAlTiN and multilayered CrAlTiN–AlTiN coatings for solid particle erosion protection. Tribol. Int. 2015, 83, 12–20. [Google Scholar] [CrossRef]
  17. Yang, Q.; Seo, D.; Zhao, L.; Zeng, X. Erosion resistance performance of magnetron sputtering deposited TiAlN coatings. Surf. Coat. Technol. 2004, 188-189, 168–173. [Google Scholar] [CrossRef]
  18. Cao, X.; He, W.; He, G.; Liao, B.; Zhang, H.; Chen, J.; Lv, C. Sand erosion resistance improvement and damage mechanism of TiAlN coating via the bias-graded voltage in FCVA deposition. Surf. Coat. Technol. 2019, 378, 125009. [Google Scholar] [CrossRef]
  19. Bonu, V.; Jeevitha, M.; Kumar, V.P.; Srinivas, G.; Harish, C. Barshilia Solid particle erosion and corrosion resistance performance of nanolayered multilayered Ti/TiN and TiAl/TiAlN coatings deposited on Ti6Al4V substrates. Surf. Coat. Technol. 2020, 387, 125531. [Google Scholar] [CrossRef]
  20. Yamamoto, K.; Sato, T.; Takahara, K.; Hanaguri, K. Properties of (Ti,Cr,Al)N coatings with high Al content deposited by new plasma enhanced arc-cathode. Surf. Coat. Technol. 2003, 174–175, 620–626. [Google Scholar] [CrossRef]
  21. Yamamoto, K.; Abdoos, M.; Paiva, J.M.; Stolf, P.; Beake, B.; Rawal, S.; Fox-Rabinovich, G.; Veldhuis, S. Cutting performance of low stress thick TiAlN PVD coatings during machining of compacted graphite cast iron (CGI). Coatings 2018, 8, 38. [Google Scholar] [CrossRef] [Green Version]
  22. Vermeulen, A.C. Accurate absolute peak positions for multiple {hkl} residual stress analysis by means of misalignment corrections. Z. Krist. Suppl. 2006, 23, 49–54. [Google Scholar] [CrossRef]
  23. Sue, J.A.; Perry, J.A.; Vetter, J. Young’s modulus and stress of CrN deposited by cathodic vacuum arc evaporation. Surf. Coat. Technol. 1994, 68–69, 126–130. [Google Scholar] [CrossRef]
  24. Sawa, T.; Tanaka, K. Simplified method for analyzing nanoindentation data and evaluating performance of nanoindentation instruments. J. Mater. Res. 2001, 16, 3084–3096. [Google Scholar] [CrossRef]
  25. Iwai, Y.; Honda, T.; Yamada, H.; Matsubara, T.; Larsson, M.; Hogmark, S. Evaluation of wear resistance of thin hard coatings by a new solid particle impact test. Wear 2001, 251, 861–867. [Google Scholar] [CrossRef]
  26. Iwai, Y.; Miyajima, T.; Honda, T.; Matsubara, T.; Kanda, K.; Hogmark, S. Evaluation of erosive wear resistance of TiN coatings by a slurry jet impact test. Wear 2006, 261, 112–118. [Google Scholar] [CrossRef] [Green Version]
  27. Iwai, Y.; Matsubara, T.; Hirai, Y.; Hogmark, S. Development of a new type micro slurry-jet erosion (MSE) tester for evaluation of wear properties of hard thin coatings. Lubr. Sci. 2009, 21, 213–226. [Google Scholar] [CrossRef]
  28. Wada, S. Effects of hardness and fracture toughness of target materials and impact particles on erosion of ceramic materials. Key Eng. Mater. 1992, 71, 51–74. [Google Scholar] [CrossRef]
  29. Bousser, E.; Martinu, L.; Klemberg-Sapieha, J.E. Solid particle erosion mechanisms of hard protective coatings. Surf. Coat. Technol. 2013, 235, 383–393. [Google Scholar] [CrossRef]
  30. Bousser, E.; Martinu, L.; Klemberg-Sapieha, J.E. Solid particle erosion mechanisms of protective coatings for aerospace applications. Surf. Coat. Technol. 2014, 257, 165–181. [Google Scholar] [CrossRef] [Green Version]
  31. Katsumata, T.; Matsubara, T.; Yamamoto, K.; Iwai, Y. Evaluation of coating properties with a Micro Slurry-jet Erosion (MSE) test—Effects of the shape and size of erodent particles on erosion behaviors of TiN coating. Surf. Coat. Technol. 2021, 421, 127443. [Google Scholar] [CrossRef]
Figure 1. Schematic view of a MSE apparatus. The insert shows details of the nozzle.
Coatings 11 00992 g001
Figure 2. SEM image of alumina particles used as erodents in this study. The average diameter of the particles is about 40 mm.
Coatings 11 00992 g002
Figure 3. Typical surface profile change in sample during the MSE test. (coating: Ti0.53Al0.47N).
Coatings 11 00992 g003
Figure 4. X-ray diffraction patterns of AIP-deposited TiN and TiAlN coating with different Al compositions. Compositions show composition of coating. Marks * denote diffraction peaks from the substrate.
Coatings 11 00992 g004
Figure 5. Hardness and Young’s modulus of TiAlN coatings measured by nano-indentation.
Coatings 11 00992 g005
Figure 6. Change in residual stress of TiAlN coatings with different Al compositions.
Coatings 11 00992 g006
Figure 7. Erosion rate of TiAlN coatings with different Al compositions as measured by MSE test.
Coatings 11 00992 g007
Figure 8. SEM and AFM images of (a) TiN, (b) Ti0.42Al0.58N and (c) Ti0.36Al0.64N. Surface observation was conducted when the erosion depth reached approximately half of the total coating thickness.
Coatings 11 00992 g008
Figure 9. Relationship between hardness and erosion rate of TiAlN coating.
Coatings 11 00992 g009
Figure 10. Relationship between Al ratio and H/E or H 3/E2.
Coatings 11 00992 g010
Figure 11. Relationship between (a) H/E or (b) H3/E2 and erosion rate.
Coatings 11 00992 g011
Figure 12. Relationship between Al ratio of the coating and FWHM of (200) peak of B1 phase.
Coatings 11 00992 g012
Table 1. Ti and Al ratio of targets and deposited coatings.
Target CompositionCoating CompositionTarget CompositionCoating Composition
TiTiNTi0.5Al0.5(Ti0.53Al0.47) N
Ti0.9Al0.1(Ti0.92Al0.08) NTi0.4 Al0.6(Ti0.42Al0.58) N
Ti0.75Al0.25(Ti0.78Al0.22) NTi0.34Al0.66 (Ti0.36Al0.64) N
Ti0.7Al0.3(Ti0.73Al0.27) NTi0.25Al0.75 (Ti0.27Al0.73) N
Publisher’s Note: MDPI stays neutral with regard to jurisdictional claims in published maps and institutional affiliations.

