
Enhancement of Cleanliness and Deposition Rate by Understanding the Multiple Roles of the Showerhead Electrode in a Capacitively Coupled Plasma Reactor


Abstract
:1. Introduction
2. Materials and Methods
2.1. Mathematical Model for the CCP Discharges
2.2. Mathematical Model for the Chemical Reactions
2.3. Computational Method
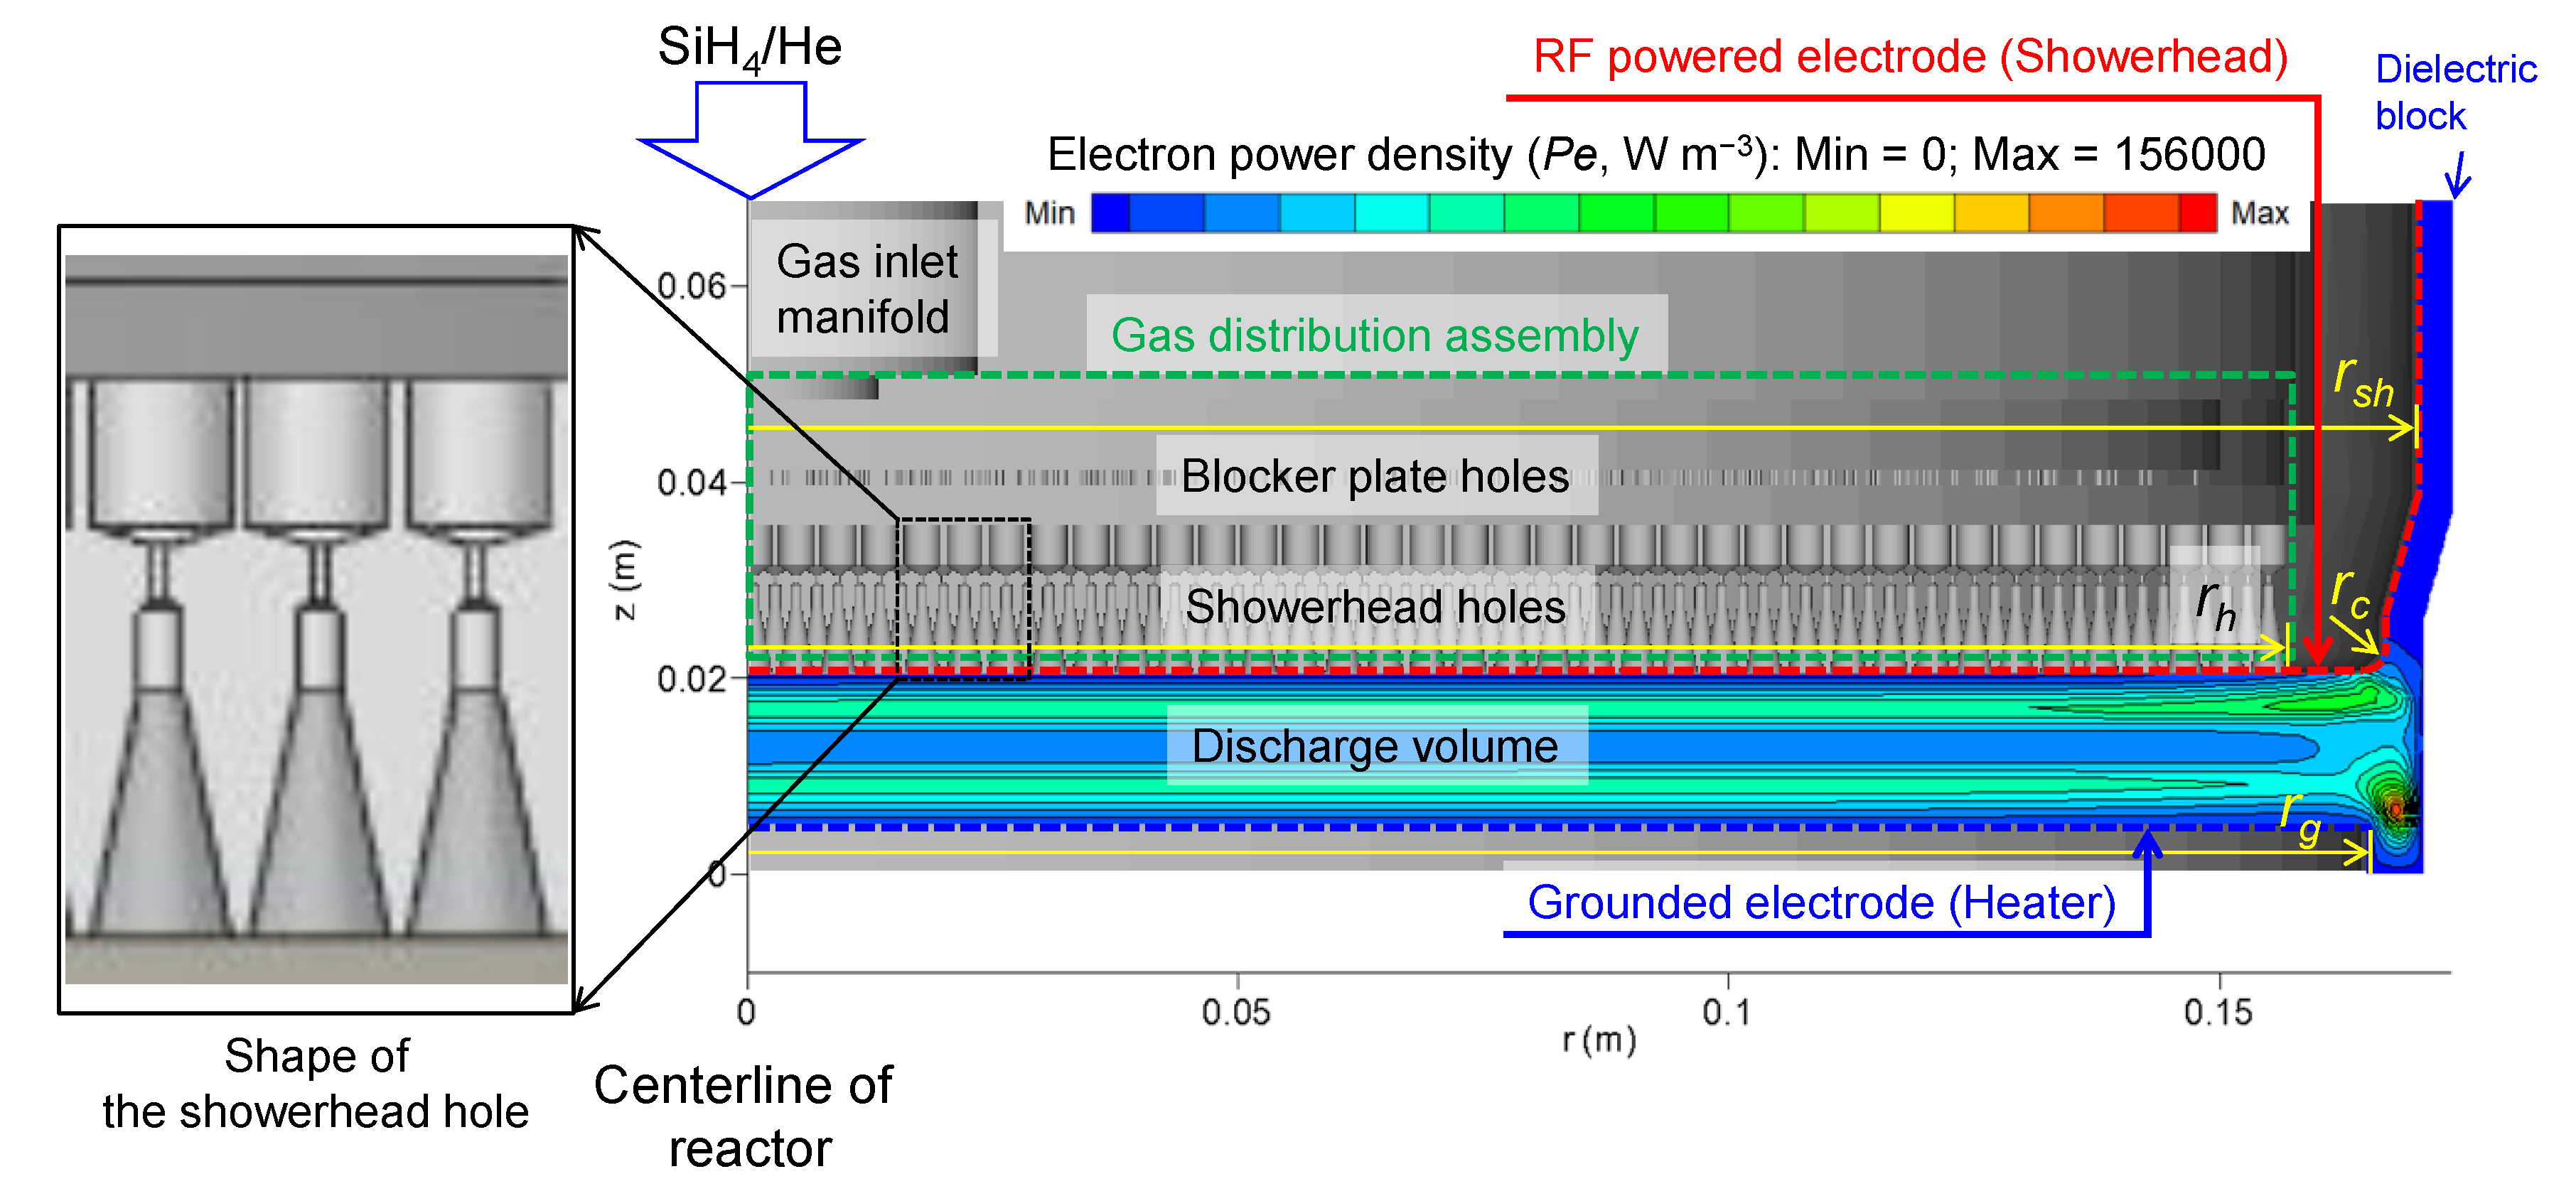
2.4. Reactor Geometry and Problem Settings
2.5. Experimental Details
3. Results and Discussion
3.1. Analysis of Gas Flows in a Three-Dimensional Geometry
3.2. Effects of the Heated Showerhead on Source Density Distributions


3.3. Effects of the Heated Showerhead on Plasma Density Distributions
3.4. Effects of the Heated Showerhead on Radical Density Distributions
3.5. Effects of the Showerhead Temperature on the Deposition Rate Profile
3.6. Effects of the Showerhead Temperature on the Particle Deposition
4. Conclusions
Funding
Institutional Review Board Statement
Informed Consent Statement
Data Availability Statement
Conflicts of Interest
References
- Smith, D.L. Thin-Film Deposition: Principles and Practice; McGraw-Hill: New York, NY, USA, 1995. [Google Scholar]
- Lieberman, M.A.; Lichtenberg, A.J. Principles of Plasma Discharges and Materials Processing; John Wiley & Sons Inc.: Hoboken, NJ, USA, 2005. [Google Scholar]
- Maydan, D. The future of equipment development and semiconductor production. Mater. Sci. Eng. A 2001, 302, 1–5. [Google Scholar] [CrossRef]
- Yavas, O.; Richter, E.; Kluthe, C.; Sickmoeller, M. Wafer-edge yield engineering in leading-edge DRAM manufacturing. Semicond. Fabtech 2009, 39, 1–5. [Google Scholar]
- Hwang, S.; Kanarik, K. Evolution of Across-Wafer Uniformity Control in Plasma Etch. Available online: https://sst.semiconductor-digest.com/2016/08/evolution-of-across-wafer-uniformity-control-in-plasma-etch/ (accessed on 1 August 2021).
- Sansonnens, L.; Howling, A.A.; Hollenstein, C. A gas flow uniformity study in large-area showerhead reactors for RF plasma deposition. Plasma Sources Sci. Technol. 2000, 9, 205–209. [Google Scholar] [CrossRef]
- Leroy, O.; Gousset, G.; Alves, L.L.; Perrin, J.; Jolly, J. Two-dimensional modelling of SiH4-H2 radio-frequency discharges for a-Si:H deposition. Plasma Sources Sci. Technol. 1998, 7, 348. [Google Scholar] [CrossRef]
- Howling, A.A.; Legradic, B.; Chesaux, M.; Hollenstein, C. Plasma deposition in an ideal showerhead reactor: A two-dimensional analytical solution. Plasma Sources Sci. Technol. 2012, 21, 535–542. [Google Scholar] [CrossRef]
- Perrin, J.; Leroy, O.; Bordage, M.C. Cross-sections, rate constants and transport coefficients in silane plasma chemistry. Contrib. Plasma Phys. 1996, 36, 3–49. [Google Scholar] [CrossRef]
- Lee, S.; Won, J.; Choi, J.; Jang, S.; Jee, Y.; Lee, H.; Byun, D. Preparation and analysis of amorphous carbon films deposited from (C6H12)/Ar/He chemistry for application as the dry etch hard mask in the semiconductor manufacturing process. Thin Solid Films 2011, 519, 6737–6740. [Google Scholar] [CrossRef]
- Lee, S.; Won, J.; Choi, J.; Park, J.; Jee, Y.; Lee, H.; Byun, D. Comparative study on the properties of amorphous carbon layers deposited from 1-hexene and propylene for dry etch hard mask application in semiconductor device manufacturing. Thin Solid Films 2011, 519, 6683–6687. [Google Scholar] [CrossRef]
- Lee, S.M.; Won, J.; Yim, S.; Park, S.J.; Choi, J.; Kim, J.; Lee, H.; Byun, D. Effect of deposition temperature and thermal annealing on the dry etch rate of a-C:H films for the dry etch hard process of semiconductor devices. Thin Solid Films 2012, 520, 5284–5288. [Google Scholar] [CrossRef]
- Denpoh, K.; Moroz, P.; Kato, T.; Matsukuma, M. Multiscale plasma and feature profile simulations of plasma-enhanced chemical vapor deposition and atomic layer deposition processes for titanium thin film fabrication. Jpn. J. Appl. Phys. 2020, 59, SHHB02. [Google Scholar] [CrossRef]
- Kim, H.J.; Lee, H.J. Analysis of intermediate pressure SiH4/He capacitively coupled plasma for deposition of an amorphous hydrogenated silicon film in consideration of thermal diffusion effects. Plasma Sources Sci. Technol. 2017, 26, 085003. [Google Scholar] [CrossRef]
- Kim, H.J.; Lee, H.J. Uniformity control of the deposition rate profile of a-Si:H film by gas velocity and temperature distributions in a capacitively coupled plasma reactor. J. Appl. Phys. 2018, 123, 113302. [Google Scholar] [CrossRef]
- Kleijn, C.R.; Meer, T.H.v.d.; Hoogendoorn, C.J. A mathematical model for LPCVD in a single wafer reactor. J. Electrochem. Soc. 1989, 136, 3423. [Google Scholar] [CrossRef]
- Kleijn, C.R.; Hoogendoorn, C.J.; Hasper, A.; Holleman, J.; Middelhoek, J. Transport phenomena in tungsten LPCVD in a single-wafer reactor. J. Electrochem. Soc. 1991, 138, 509. [Google Scholar] [CrossRef]
- CFD, R.C. CFD-ACE Module Manual; ESI US R&D Inc.: Huntsville, AL, USA, 2003. [Google Scholar]
- Farouk, T.; Farouk, B.; Staack, D.; Gutsol, A.; Fridman, A. Simulation of dc atmospheric pressure argon micro glow-discharge. Plasma Sources Sci. Technol. 2006, 15, 676–688. [Google Scholar] [CrossRef]
- Farouk, T.; Farouk, B.; Gutsol, A.; Fridman, A. Atmospheric pressure methane-hydrogen dc micro-glow discharge for thin film deposition. J. Phys. D Appl. Phys. 2008, 41, 175202. [Google Scholar] [CrossRef]
- Kim, H.J.; Lee, H.J. 2D fluid model analysis for the effect of 3D gas flow on a capacitively coupled plasma deposition reactor. Plasma Sources Sci. Technol. 2016, 25, 035006. [Google Scholar] [CrossRef]
- Kim, H.J.; Beskok, A. An algebraic factorisation scheme for spectral element solution of incompressible flow and scalar transport. Int. J. Comp. Fluid Dynamics 2010, 24, 95–108. [Google Scholar] [CrossRef]
- Lee, A.S.; Rajagopalan, N.; Le, M.; Kim, B.H.; M’Saad, H. Development and characterization of a PECVD silicon nitride for damascene applications. J. Electrochem. Soc. 2004, 151, F7–F9. [Google Scholar] [CrossRef]
- Kim, J.-H.; Moon, S.; Kim, J.-W.; Lee, D.; Park, B.C.; Kim, D.-H.; Jeong, Y.; Hand, S.; Osborne, J.; Wolf, P.D.; et al. Advanced measurement and diagnosis of the effect on the underlayer roughness for industrial standard metrology. Sci. Rep. 2019, 9, 1018. [Google Scholar] [CrossRef] [Green Version]
- Perrin, J.; Shiratani, M.; Kae-Nune, P.; Videlot, H.; Jolly, J.; Guillon, J. Surface reaction probabilities and kinetics of H, SiH3, Si2H5, CH3, and C2H5 during deposition of a-Si:H and a-C:H from H2, SiH4, and CH4 discharges. J. Vac. Sci. Technol. A. 1998, 16, 278. [Google Scholar] [CrossRef]
- Danko, S.; Bluhm, D.; Bolsinger, V.; Dobrygin, W.; Schmidt, O.; Brinkmann, R.P. A global model study of silane/hydrogen discharges. Plasma Sources Sci. Technol. 2013, 22, 055009. [Google Scholar] [CrossRef]
- Bird, R.B.; Stewart, W.E.; Lightfoot, E.N. Transport Phenomena; John Wiley & Sons, Inc.: Hoboken, NJ, USA, 2007. [Google Scholar]
- Kushner, M.J. Simulation of the gas-phase processes in remote-plasma-activated chemical-vapor deposition of silicon dielectrics using rare gas-silane-ammonia mixtures. J. Appl. Phys. 1992, 9, 4173–4189. [Google Scholar] [CrossRef] [Green Version]
- Park, H.; Yoon, E.; Lee, G.-D.; Kim, H.J. Analysis of surface adsorption kinetics of SiH4 and Si2H6 for deposition of a hydrogenated silicon thin film using intermediate pressure SiH4 plasmas. Appl. Surf. Sci. 2019, 496, 143728. [Google Scholar] [CrossRef]


| Case No. | Considered Physics | Considered Geometry | Showerhead Temperature (Tsh, K) |
|---|---|---|---|
| 1 | Gas flows only | 3D complex geometry | 473 |
| 2 | Gas flows + Plasma discharges | 2D simplified geometry | 373 |
| 3 | Gas flows + Plasma discharges | 2D simplified geometry | 423 |
| 4 | Gas flows + Plasma discharges | 2D simplified geometry | 473 |
| 5 | Gas flows + Plasma discharges | 2D simplified geometry | 673 |
| 6 | Gas flows + Plasma discharges | 2D simplified geometry | Modified inlet (3D) |
Publisher’s Note: MDPI stays neutral with regard to jurisdictional claims in published maps and institutional affiliations. |
© 2021 by the author. Licensee MDPI, Basel, Switzerland. This article is an open access article distributed under the terms and conditions of the Creative Commons Attribution (CC BY) license (https://creativecommons.org/licenses/by/4.0/).
Share and Cite
Kim, H.J. Enhancement of Cleanliness and Deposition Rate by Understanding the Multiple Roles of the Showerhead Electrode in a Capacitively Coupled Plasma Reactor. Coatings 2021, 11, 999. https://doi.org/10.3390/coatings11080999
Kim HJ. Enhancement of Cleanliness and Deposition Rate by Understanding the Multiple Roles of the Showerhead Electrode in a Capacitively Coupled Plasma Reactor. Coatings. 2021; 11(8):999. https://doi.org/10.3390/coatings11080999
Chicago/Turabian StyleKim, Ho Jun. 2021. "Enhancement of Cleanliness and Deposition Rate by Understanding the Multiple Roles of the Showerhead Electrode in a Capacitively Coupled Plasma Reactor" Coatings 11, no. 8: 999. https://doi.org/10.3390/coatings11080999
APA StyleKim, H. J. (2021). Enhancement of Cleanliness and Deposition Rate by Understanding the Multiple Roles of the Showerhead Electrode in a Capacitively Coupled Plasma Reactor. Coatings, 11(8), 999. https://doi.org/10.3390/coatings11080999