Article

Enhancement of Cleanliness and Deposition Rate by Understanding the Multiple Roles of the Showerhead Electrode in a Capacitively Coupled Plasma Reactor

Department of Mechanical Engineering, Gachon University, 1342, Seongnam-daero, Sujeong-gu, Seongnam-si 13120, Gyeonggi-do, Korea
Coatings 2021, 11(8), 999; https://doi.org/10.3390/coatings11080999
Submission received: 1 August 2021 / Revised: 13 August 2021 / Accepted: 18 August 2021 / Published: 21 August 2021
(This article belongs to the Special Issue Surface Modification by Plasma-Based Processes)

Abstract

:
Increasing the productivity of a showerhead-type capacitively coupled plasma (CCP) reactor requires an in-depth understanding of various physical phenomena related to the showerhead, which is not only responsible for gas distribution, but also acts as the electrode. Thus, we investigated how to enhance the cleanliness and deposition rate by studying the multiple roles of the showerhead electrode in a CCP reactor. We analyzed the gas transport in a three-dimensional complex geometry, and the SiH4/He discharges were simulated in a two-dimensional simplified geometry. The process volume was installed between the showerhead electrode (radio frequency powered) and the heater electrode (grounded). Our aim of research was to determine the extent to which the heated showerhead contributed to increasing the deposition rate and to reducing the size of the large particles generated during processing. The temperature of the showerhead was increased to experimentally measure the number of particles transported onto the heater to demonstrate the effects thereof on the decrease in contamination. The number of particles larger than 45 nm decreased by approximately 93% when the showerhead temperature increased from 373 to 553 K.

1. Introduction

In the semiconductor industry, the thin film processes that are used to deposit various functional layers have been posed many technical challenges [1]. Plasma-enhanced chemical vapor deposition (PECVD) has been chosen as a mainstream deposition method in recent applications because of its wide applicability and technical flexibility [2]. The fabrication of devices currently demands well-designed and highly expensive reactors; however, the acquisition of state-of-the-art PECVD reactors has had serious financial consequences for chip manufacturers. Therefore, chip manufacturers have continuously targeted high production efficiency [3,4,5]. Towards this objective, showerhead-type capacitively coupled plasma (CCP) PECVD reactors operated in the torr regime are often considered the best configuration for performing challenging processes [6,7,8]. This is because these reactors have the ability to deposit films with specified properties and with high uniformity. Enhancing the productivity of a showerhead-type CCP-PECVD reactor requires an understanding of the various physical and chemical phenomena induced by the showerhead electrode from the viewpoint of high cleanliness and a high deposition rate.
Based on the above-mentioned need for productivity enhancement, the deposition rate can be increased by adding a high mole fraction of reactive gases to the inlet gas mixture. However, a higher mole fraction of the reactive gas can also accelerate the generation of large particles (rp > 1.0 × 10⁻⁶ m, where rp is the particle radius) in the homogeneous gas phase nucleation [9]. Importantly, resolving these complex problems related to the cleanliness and the deposition rate requires an understanding of the various physical phenomena related to the showerhead electrode. This importance is ascribed to the showerhead electrode not only being responsible for gas distribution (being installed between the gas line and the process volume), but also forming the electrode in a CCP reactor. In addition, for gases that undergo irreversible reaction in PECVD, the uniform distribution of these gases injected through the showerhead electrode and their reaction products are as important for uniform process results as uniform plasma.
In a plasma-processing reactor, the temperature of the reactor is often considered an important factor that could be adjusted to optimize the process. For instance, the temperature of the wafer pedestal should be finely modulated to heat wafers to the targeted temperatures during the manufacturing process [10,11,12,13]. Similarly, the temperature of the showerhead electrode should also be tightly controlled during the process. Because the density of the gas mixture is governed by the ideal gas law, the volume of the gas mixture expands rapidly near the hotter parts of the reactor. Thus, the heated showerhead electrode can induce a local decrease in the density of the gas mixture near the corresponding sheath. Therefore, the spatial distributions of the plasma variables such as the ionization rate, excitation rate, and dissociation rate can be optimized by heating the showerhead electrode.
The above-mentioned points motivated this study: we conducted numerical investigations of the effects of the heated showerhead electrode on the spatial distributions of the plasma variables inside a CCP deposition reactor. Despite its importance, it was difficult to find previous research results relating to PECVD with the relevant details. Therefore, we analyzed the gas transport in a three-dimensional complex geometry, and simulated the SiH4/He discharges in a two-dimensional simplified geometry. As a case study for PECVD, we used SiH4/He-based CCP discharges to deposit a hydrogenated amorphous silicon (a-Si:H) film. The numerical results were validated by comparing them with practical PECVD experimental data. The ability to lower the number of particles deposited on the reactor surface by increasing the temperature of the showerhead was investigated by conducting experimental measurements to determine the number of particles that were deposited on the targeted surface inside the reactor.

2. Materials and Methods

A self-consistent model for a CCP deposition reactor was built by considering four major physical phenomena: gas flows, thermal energy balances, gas phase and surface phase reactions, and low temperature plasma discharges. Details of their numerical models are skipped here because they are explained in detail in our previous reports [14,15]. Selected descriptions are included here because of their importance.

2.1. Mathematical Model for the CCP Discharges

Based on a drift-diffusion approximation, we consider the continuity in the electron density by solving below:
n e t + J e = S e
J e = D e n e + μ e n e ϕ
Here, ne is the electron density, Je is the electron flux, Se is the source of the electrons, De is the electron diffusion coefficient, μe is the electron mobility, and ϕ is the electric potential.

2.2. Mathematical Model for the Chemical Reactions

Near the heated surface, SiH4 can decompose into SiH2 and H2, and similarly, Si2H6 also can decompose into SiH4 and SiH2 [16,17]. This decomposition initiates a series of gas phase reactions, which generate important silicon-containing products. These silicon-containing species transport to the surface and react there to become a silicon surface. In this study, the reversible gas phase reactions that are involved are listed below:
SiH 4 SiH 2 + H 2
SiH 4 SiH 3 + H
Si 2 H 6 SiH 4 + SiH 2
One can write reactions (3)–(5) as shown below:
reactants ν i k A i k k , b g k k , f g   ν i k A i products ν i k A i
Here, Ai are the gaseous species, k k , f g is the rate constant of the forward reaction k, k k , b g is the rate constant of the reverse reaction, ν i k is the forward stoichiometric coefficient for species i in reaction k, and ν i k is the reverse stoichiometric coefficient for species i in reaction k. The net stoichiometric coefficients are defined as ν i k = ν i k ν i k . One can write the net reaction rate for reaction k as shown below:
R k g = R k , f g R k , b g = k k , f g reactants ( p g f i R T g ) ν i k k k , b g products ( p g f i R T g ) ν i k
k k , f g ( T g ) = A k T g β k exp ( E k R T g )
k k , b g ( T g ) = k k , f g ( T g ) K e q , k g ( T g ) ( R T g P 0 ) i N ν i k
K e q , k g ( T g ) = exp ( Δ H k 0 ( T g ) T g Δ S k 0 ( T g ) R T g )
Δ H k 0 ( T g ) = i = 1 N ν i k H i 0 ( T g )
Δ S k 0 ( T g ) = i = 1 N ν i k S i 0 ( T g )
Here, Ak is the pre-exponential factor of reaction k, βk is the temperature exponent of reaction k, Ek is the activation energy of reaction k, P0 is the reference pressure, H i 0 is the formation enthalpy, and S i 0 is the entropy.

2.3. Computational Method

In this study, we used CFD-ACE+ software [18]. In various previous studies, using CFD-ACE+, discharge cases were successfully simulated [19,20,21]. Since applying accurate gas flow information to discharge simulations is critical, the non-isothermal flow simulation results from CFD-ACE+ were validated through comparison with the simulation results from the in-house spectral element method code [22]. We used the control volume-based method to discretize the governing equations in this study.
The Scharfetter-Gummel exponential scheme was adopted in both the electron and electron energy conservation equations [18]. We calculated both the electron transport coefficients and the electron impact reaction rates for the SiH4/He CCP discharges. In this study, the 0D Boltzmann equation was solved for the electron energy distribution function. Solving the 0D Boltzmann equation acts as a preprocessor step that produces a lookup table. The lookup table was used in the CCP discharges simulations.

2.4. Reactor Geometry and Problem Settings

Figure 1 shows the discharge volume of our reactor. Because of the axisymmetric geometry, it is possible to analyze our CCP reactor on the rz plane, where r is the radial coordinate and z is the axial coordinate. The showerhead (upper electrode) is temperature-controlled and powered by radio frequency (RF; 13.56 MHz). The heater (lower electrode) is also temperature-controlled, but grounded. As the process result is often optimized by heating the lower grounded electrode to a sufficient degree (e.g., Th > 500 K), it is referred to as the heater. The top-powered electrode, which also delivers the source gas, is known as the gas distribution assembly and normally consists of multiple perforated plates. As depicted in Figure 1, the first plate is the blocker plate, and the second is the showerhead. The gas distribution assembly communicates directly with the plasma region and, consequently, uniformly distributes the reactive gases over the heater surface. When the plasma distribution is uniform, the gas distribution must also be uniform to ensure the surface flux on the heater is uniform. Note that based on a previous experimental study, the holes in the showerhead are shaped into a converging-diverging nozzle to enhance the gas distribution uniformity [23]. To understand the fluid dynamics effects related to a showerhead hole, the gas flows passing through showerhead holes were computationally simulated, and distributions of the gas velocity magnitudes were extensively analyzed for Case 1. Details of Case 1 are discussed later.
Note that the gas transport simulation was conducted using three-dimensional complex geometry (i.e., the simulation mimicked the real reactor geometry; see Figure 1), whereas for the CCP simulations, a simplified, more computationally friendly, two-dimensional geometry was used to lower the computational cost. For the CCP discharge simulations, we simply assumed that the SiH4/He mixtures are provided through an inlet boundary of the process volume, which corresponds to the outlet of the gas distribution assembly in a radially uniform manner, instead of passing through a series of showerhead holes. As the showerhead temperature was controlled by the heating module (Ohmic heating), the gas temperature and density were sufficiently radially uniform along the showerhead radius. Despite the inlet gas being accelerated inside the showerhead hole, the non-uniformities of the gas temperature and density were less than 3% with Tsh = 373 K (Tsh = the showerhead temperature) and less than 6% with Tsh = 473 K in the simulation results of the three-dimensional gas flow.
The input conditions in the considered cases are listed in Table 1. As indicated in the table, for all cases, the sidewall temperature (Tsw) and the heater temperature (Th) were commonly set to 423 and 673 K, respectively. To observe the effects of the showerhead temperature (Tsh) on the CCP discharges, in Cases 2, 3, 4 and 5, the showerhead temperatures (Tsh) were set to 373, 423, 473, and 673 K, respectively. The following input conditions were specified for all cases: the SiH4 flow rate was set to 50 sccm, the He flow rate was set to 5000 sccm, the gas pressure was set to 400 Pa, and the input power for the RF discharge was set to 100 W.
Note that the contour in Figure 1 depicts the spatial distribution of the electron power density (Pe) for Case 2. The off-axis maximum of the electron power density (Peo = 1.56 × 10⁵ W m−3) occurs just beside the heater edge.

2.5. Experimental Details

We used an ellipsometer (SFX-200, KLA Tencor, Milpitas, CA, United States) and an X-ray diffractometer (SmartLab, Rigaku corporation, Tokyo, Japan) to measure the properties of the a-Si:H layer experimentally [24]. We measured the film densities of the a-Si:H layer (ρSi) experimentally, and these densities were used to estimate the deposition rates in the simulations. At the heater temperature of 673 K, ρSi was 2.32 g cm−3. The film thicknesses were measured with the ellipsometer. To simulate the surface depositions, the surface fluxes of silicon-containing radicals (SixHy) were used to develop a sticking model, following the approach in previous studies [14,15]. The sticking coefficients of the radicals were adopted from other groups’ experimental data [25,26]. The experimental setup and methodology were described in detail in our previous reports [14,15].

3. Results and Discussion

3.1. Analysis of Gas Flows in a Three-Dimensional Geometry

In this section, we describe the simulation of the SiH4/He CCP. The simulation was designed to analyze the extent to which the heated showerhead contributes to increasing the deposition rate and to lowering the number of particles generated during plasma processes.
First, we simulated gas flows in a three-dimensional complex geometry. For Case 1, Figure 2a shows the flow streamlines, which are the directions in which the gas fluid flows, and Figure 2b shows the distribution of the magnitude of the gas velocity. Note that the highly accelerated gases are fed through a center-positioned narrow gas line (i.e., the gas inlet manifold in Figure 1). The inlet gases flow fast: the Reynolds number (Re = ρUL/μ, where ρ is the density, U is the characteristic velocity, L is the characteristic length, and μ is the dynamic viscosity) is high. The combined use of the blocker plate and the showerhead induces the suppression of a tangled gas flow structure, which is observed when a large amount of gas is supplied via the inlet and forced to rotate owing to both the inertia of motion and an abrupt change in the flow direction.

3.2. Effects of the Heated Showerhead on Source Density Distributions

Kim and Lee stated that the application of the appropriate inlet boundary conditions can be critical to precisely determining the plasma and radical distributions in a CCP deposition reactor [21]. Similarly, Sansonnens et al. attempted to determine how film uniformity can be achieved in a showerhead-type CCP reactor using a simple one-dimensional model [6]. They proposed the following equations:
d d x ( n A v ( x ) ) = D A d 2 n A d x 2 + S ( x ) k d n e n A
d d x ( n B v ( x ) ) = D B d 2 n B d x 2 + k d n e n A k s n B
d d x ( n C v ( x ) ) = D C d 2 n C d x 2 + k d n e n A
where x is the spatial coordinate; kd is the electron impact dissociation rate; ni (i = A, B, or C) is the density of species i; Di is the diffusivity of species i; S(x) represents the spatial source term of ingredient mixture gas (A); v(x) is defined as the gas velocity averaged over the electrode spacing; A is dissociated by the electron impact reaction (with kd) to generate B and C, which are reactive radicals; and B is consumed on the surface by film deposition with ks.
For their analytical study, they concluded that a uniform showerhead gas injection (i.e., S(x) = constant) can achieve uniform reactant transport in an isothermal and isobaric system, assuming spatially uniform electron density and energy. Based on this finding, it is inferred that the modification of S(x) can induce the modification of the product distribution. This means that the inlet boundary conditions should be carefully considered in CCP process simulations: in certain cases, it would be necessary to obtain information about the inlet gas distributions separately, as in the work of Kim and Lee. As the showerhead temperature (Tsh) was controlled by the Ohmic heating module in this study, as stated above, the enforced heat flux ensured that the radial uniformities of the gas temperature and density were sufficient along the showerhead radius in the three-dimensional gas flow simulations. In this study, their non-uniformities were less than 3% with Tsh = 373 K and less than 6% with Tsh = 473 K.
Figure 3 depicts the spatial variations in the gas temperature distributions for Cases 2, 3, 4 and 5. In Figure 3a–c, axial variations in the gas temperature distributions, owing to the temperature conditions of the wall, are clearly observed. These variations are attributed to the depletion of the source gas and thus the changing properties of the mixture such as the changes in ρmix [27]. However, in Figure 3d, because the showerhead temperature and the heater temperature were set to the same value (i.e., Tsh = Th = 673 K), the temperature distribution is vertically symmetric. Figure 4 and Figure 5 depict the spatial variations in the density distributions of SiH4 and Si2H6, respectively. We selected Si2H6 for the analysis because SiH4 is rapidly consumed at gas pressures higher than 100 Pa; thus, Si2H6 is produced via a fast gas phase reaction between SiH4 and SiH2, as shown below.
SiH4 + SiH2 → Si2H6, kr = 2.0 × 10⁻¹⁶ [1 − (1 + 0.0032 pg (Pa))−1] m3 s−1
Here, kr is the reaction rate coefficient. In addition, Si2H6 acts as an important seed on which to grow to the high-order silanes, and finally the particles (such as a killer defect).
Figure 3. Spatial variations in the gas temperature (Tg) distributions (K) for (a) Case 2 (Tsh = 373 K), (b) Case 3 (Tsh = 423 K), (c) Case 4 (Tsh = 473 K), and (d) Case 5 (Tsh = 673 K) for r ≥ 120 mm.
Coatings 11 00999 g003
Figure 4. Effects of the showerhead temperature (Tsh) on the spatial distribution of the reactive gas. Spatial variations in the SiH4 density distributions (m−3) for (a) Case 2 (Tsh = 373 K), (b) Case 3 (Tsh = 423 K), (c) Case 4 (Tsh = 473 K), and (d) Case 5 (Tsh = 673 K) for r ≥ 120 mm. The profiles are radially uniform for r < 120 mm. (e) SiH4 densities are plotted on the vertical line at rh (r = 154.3 mm) for Cases 2, 3, 4, and 5.
Coatings 11 00999 g004
Figure 5. Effects of the showerhead temperature (Tsh) on the spatial distribution of the source gas. Spatial variations in the Si2H6 density distributions (m−3) for (a) Case 2 (Tsh = 373 K), (b) Case 3 (Tsh = 423 K), (c) Case 4 (Tsh = 473 K), and (d) Case 5 (Tsh = 673 K) for r ≥ 120 mm. The profiles are radially uniform for r < 120 mm.
Coatings 11 00999 g005
Notably, in various PECVD examples, neutral species can diffuse to the reactor surface rapidly. This efficient transport is expected by the fact that gas kinetic theory states that the diffusion coefficients of neutral species increase under lower pressure conditions. Howling et al. used an SiH4/H2 mixture to calculate the Peclet number (Pe = /D, where d is the characteristic length, ū is the characteristic velocity, and D is the diffusion coefficient) in their CCP process conditions. Taking the binary diffusion coefficient for SiH4 and H2 at 100 Pa and 473 K to be 0.14 m2 s−1, the Pe was calculated as only 0.03 [8]. As our process conditions are similar to those of Howling et al., we confidently assumed that our gas transport phenomena are also observed under conditions of rapid diffusion. We verified that the diffusion coefficients for silicon compounds are sufficiently high under the given process conditions; for example, the diffusion coefficient of SiH4 is 0.057 m2 s−1 at 673 K. For a characteristic length of d = 0.015 m, a characteristic velocity of ū = 1.35 m s−1, and a diffusion coefficient of D = 0.057 m2 s−1, the spatially averaged value of Pe (Pe = d ū/D) is calculated to be only 0.36. Although our Pe is sufficiently low (i.e., less than one), convection effects are still observed in the density distribution contours of SiH4 and Si2H6.
In Figure 4, for all four cases, in the discharge volume, their SiH4 density distributions have higher values at rrh than at r > rh. These variations have their origins in both the source gas consumption routine (based on gas convection) of our showerhead reactor and the transport mechanism resulting from the fast consumption of SiH4. Here, it should be noted that the transport phenomena of neutral species are mainly determined by gas flow streams, which can be described in terms of streamlines. Owing to the common features of the spatial variations in the gas temperature distributions, the spatial variations in the SiH4 density distributions are similar to each other for Cases 2, 3 and 4. In these three cases, the SiH4 density distributions vary axially in the inter-electrode region, and in addition, radial variations are clearly observed near the electrode edge. The expansion of an ideal gas and the efficient depletion of SiH4 are both responsible for the distribution features. Conversely, in Case 5, the SiH4 density distribution is noticeably changed by the increase in the showerhead temperature. Figure 4e depicts that the axial variations become negligible in Case 5. Therefore, one can state that in Case 5, an increase in the showerhead temperature significantly modifies the SiH4 density distributions.
Figure 5 shows that for all four cases, their Si2H6 densities indicate low values at the inlet (the initial position). However, because of the relatively slow consumption (and fast production) of Si2H6 and the gas convection effect, its density increases in the axial direction until it reaches the midplane of the discharge volume (i.e., the middle point between the showerhead and the heater). In addition, its density increases in the radial direction until it reaches the sidewall: the depletion of Si2H6 is not as fast as that of radicals such as H, SiH, SiH2, and SiH3 in this study. Note that both the lowest density distribution and the thickest boundary layer occur near the showerhead surface for Case 5.

3.3. Effects of the Heated Showerhead on Plasma Density Distributions

Figure 6 depicts the spatial distributions of the ion production rates. To allow for easier comparison, Cases 2 (Tsh = 373 K) and 5 (Tsh = 673 K) were selected and analyzed more carefully. The production of SiH2+ (via direct impact ionization: e + SiH4 → SiH2+ + H + H + e + e) and that of Si+ (via dissociative excitation: He* + SiH4 → Si+ + 2H + H2 + He + e) were chosen because of their significance under our conditions. As depicted in Figure 6a,b, the SiH2+ production rates are enhanced near the heater edge. Although the SiH4 density is lower near the showerhead, the SiH2+ production rate of Case 5 is higher than that of Case 2. In addition, in Case 5, the axial variation in the SiH2+ production rate is bell-shaped, whereas the variation has two maxima in the inter-electrode region in Case 2. The difference in the profiles arises because the higher showerhead temperature lowers the gas density in the immediate surroundings of the showerhead to a sufficient degree, and thus the relative contribution of the mid-plane to the ionization is increased. In Figure 6c,d, the rates at which Si+ is produced are also enhanced near the heater edge in Cases 2 and 5. As similarly observed in Figure 6a,b, the axial profile has two maxima in Case 2, whereas the profile is bell-shaped in Case 5. However, the decrease in the SiH4 density as a result of the higher showerhead temperature lowers the Si+ production rate in Case 5 relative to that in Case 2 near the showerhead surface. Because He dilution is used in this study, the peak value of the Si+ production rate is higher than that of the SiH2+ production rate. The rate coefficient for the Si+ production used in this study was set as [28]:
He* + SiH4 → Si+ + 2H + H2 + He + e, kr = 1.3 × 10⁻¹⁶ m3 s−1.
As depicted in Figure 7a,b, the ion production rates in Figure 6 are responsible for the distributions of the time-averaged electron density reaching a maximum near the heater edge: an off-axis maximum of the electron density, Neo, is detected at locations similar to the peak ion production rates. As a result of the lower SiH4 density, the peak value of Case 5 is lower than that of Case 2: Neo is 5.90 × 10¹⁵ m−3 in Case 2, whereas Neo is 3.93 × 10¹⁵ m−3 in Case 5. As shown in 
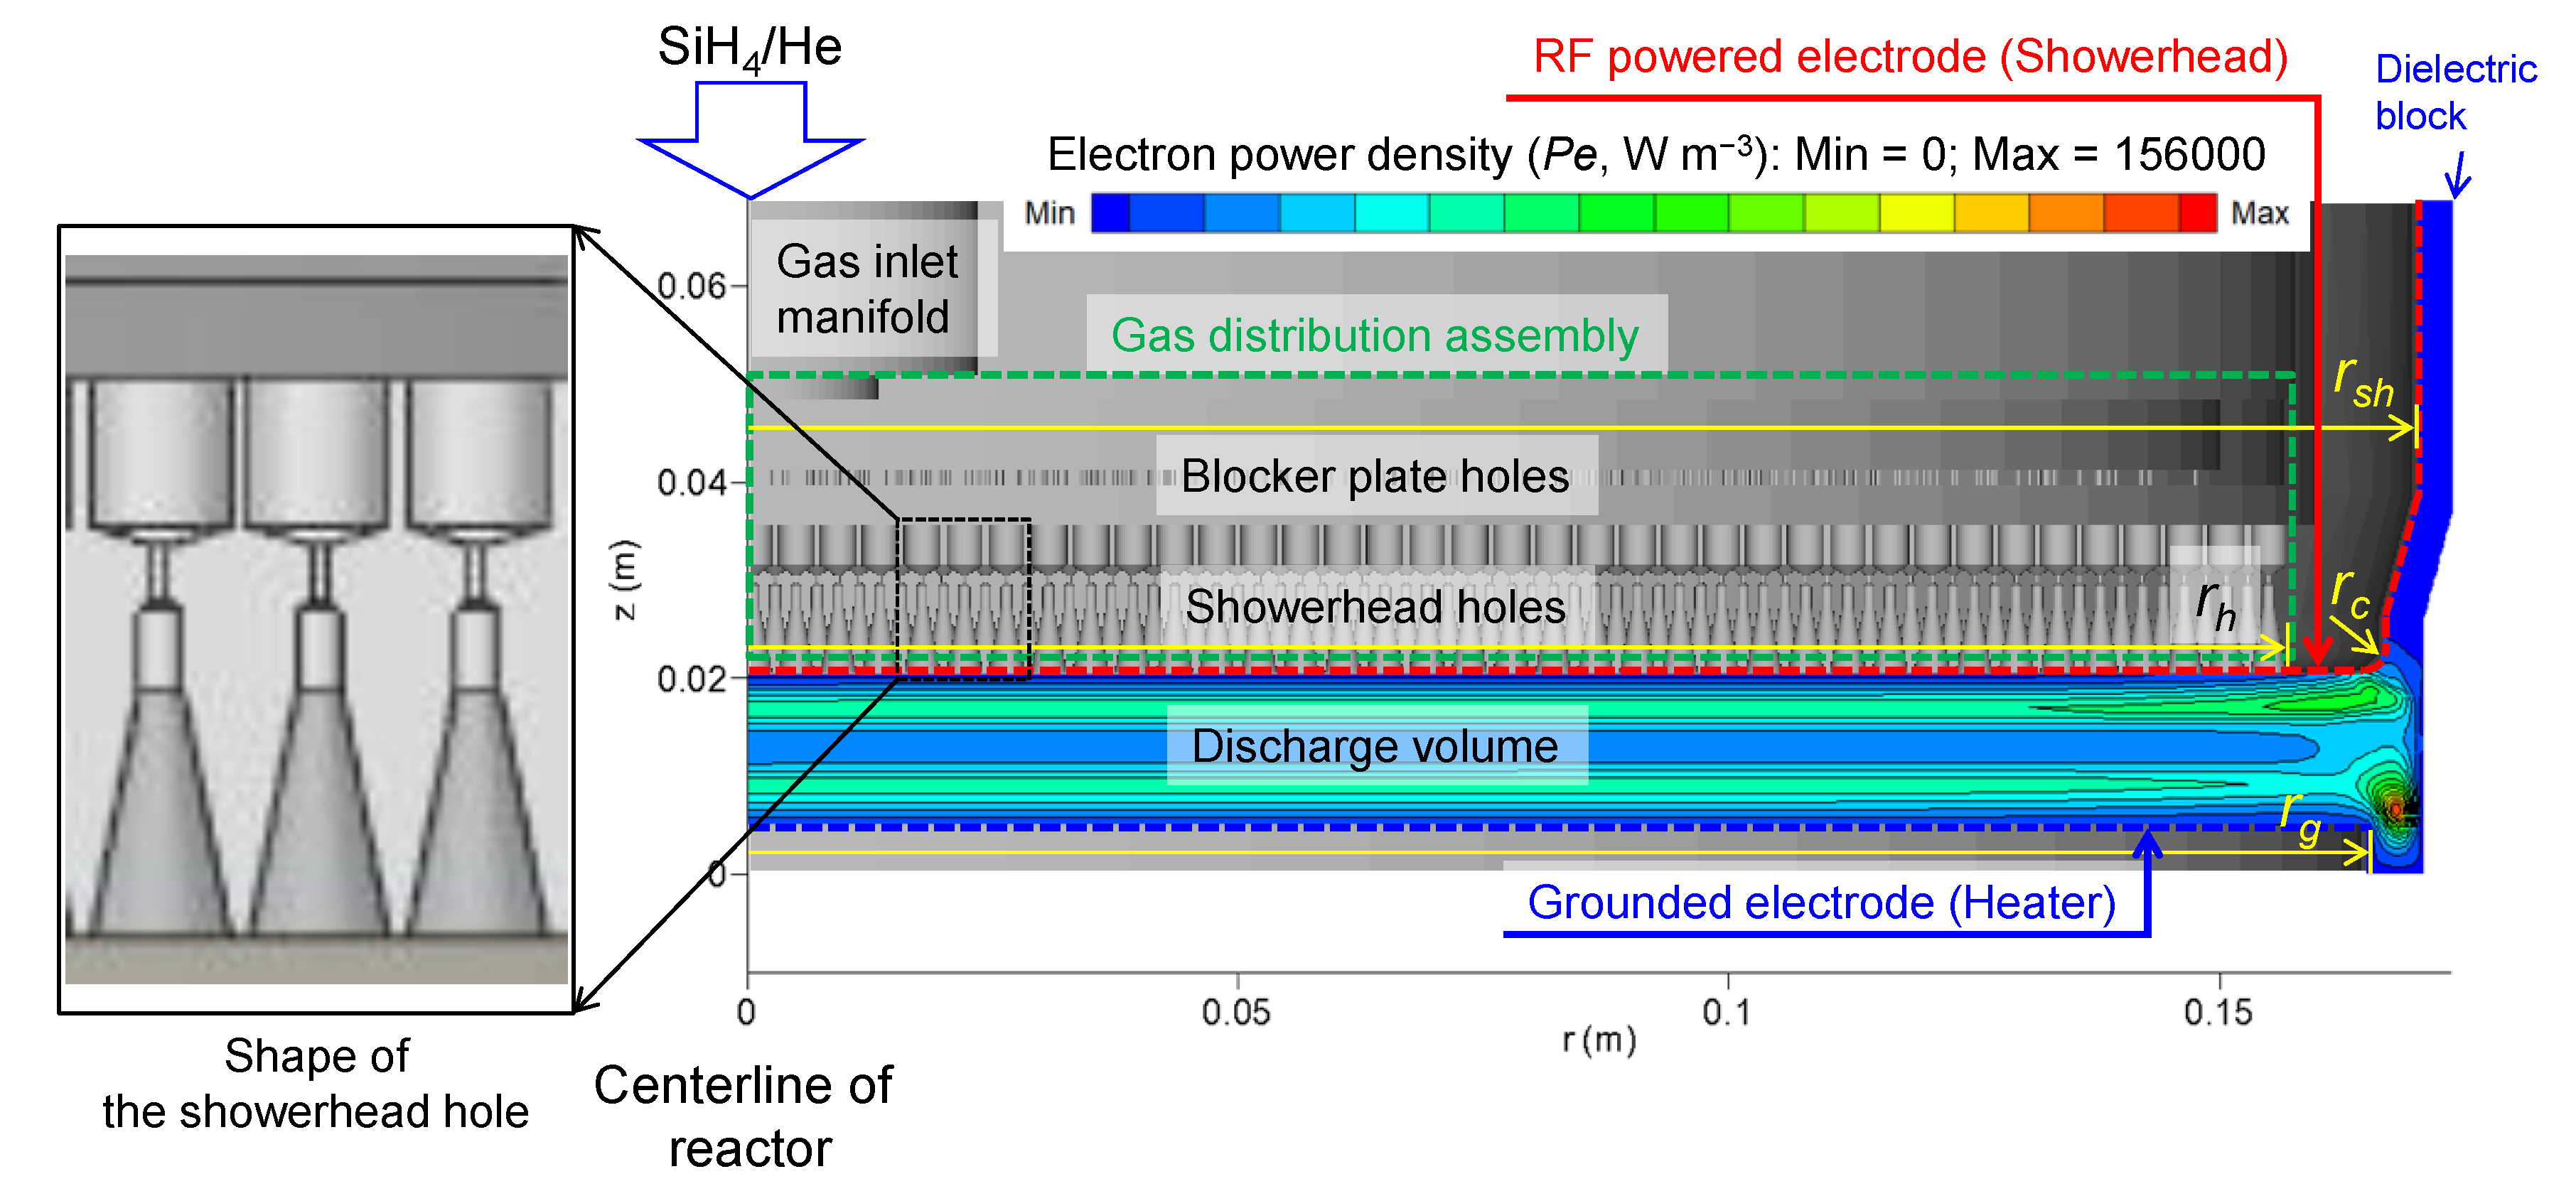
Figure 1, the electron power density (Pe = −e Je·E, W m−3) is also localized near the heater edge. This localization enhances the mean electron energy near the heater edge. Therefore, the locally enhanced production rates mentioned above are strongly correlated with the localization of the electron power density for Cases 2 and 5, as depicted in Figure 7c,d, respectively. The contours in Figure 7c,d also demonstrate that their peak values are affected by the change in the showerhead temperature.

3.4. Effects of the Heated Showerhead on Radical Density Distributions

Figure 8 provides the contours of the spatial variations in the SiH3 densities (m−3) for Cases 2, 3, 4, and 5. SiH3 was selected for analysis from among various other radicals and stable molecules because of its intrinsic importance in the deposition of an a-Si:H film [29]. A common feature between each of the different distributions is that the peak values are detected near the heater edge.
In the meantime, although the SiH3 density distributions exhibit higher maximum values with lower showerhead temperature, the values detected near the heater decrease against the expectation, as shown in Figure 8. This behavior can be understood by the SiH3 being quickly depleted in the bulk by the enhancement of the disproportionation process as a result of the higher SiH3 density:
SiH3 + SiH3 → SiH2 + SiH4, kr = 1.5 × 10⁻¹⁶ m3 s−1
In addition, SiH4 depletion is suppressed with higher showerhead temperature, as observed in Figure 4 and Figure 5: the maximum SiH4 density of Case 2 (7.64 × 10²⁰ m−3) becomes higher than that of Case 5 (7.07 × 10²⁰ m−3), whereas the minimum SiH4 density of Case 2 becomes lower than that of Case 5. As stated above, the same trend was observed for the SiH3 density distribution. The increase in the minimum densities of both SiH4 and SiH3 originates from the higher showerhead temperature suppressing their depletion not only by decreasing the reactant densities in the bulk, but also by decreasing the resistance time. Consequently, the Si2H6 density decreases as a consequence of the suppressed depletion of SiH4 (SiH4 + SiH2 → Si2H6) in Case 5, as shown in Figure 4 and Figure 5. As a result, as depicted in Figure 8, the axial variations in the SiH3 density distributions decrease with the higher showerhead temperature.

3.5. Effects of the Showerhead Temperature on the Deposition Rate Profile

Figure 9 shows that for Cases 2 (Tsh = 373 K), 3 (Tsh = 423 K), 4 (Tsh = 473 K), 5 (Tsh = 673 K), and 6, both their deposition rate profiles and averaged rates are affected by the showerhead temperature. For convenience, we compare the spatial features by normalizing the profiles with their corresponding averaged values.
For Case 6, we averaged the 3D gas simulation results of the case with Tsh = 473 K (i.e., similarly observed in Case 1) over the azimuthal angle and used the resulting 2D inlet density profile as the input (or the inlet boundary condition) to the 2D plasma simulation. In Figure 9a, the deposition rate profiles are plotted for Cases 2, 3, 4, and 5. For Cases 2 and 4, their experimental data are superimposed on the profiles in Figure 9b,c, respectively. The experimental data are denoted with larger circle symbols. The simulated deposition rate profiles are in good correspondence with the corresponding experimental data.
Note that, because of the modified inlet boundary condition, the simulated deposition rate profile of Case 6 more closely agrees with the corresponding experimental data than that of Case 4, as depicted in Figure 9c. Although the uniformities are different, all the profiles are convex. As depicted in Figure 8, the boundary layers of the SiH3 density thicken, approaching r = 150 mm; the thicknesses of the boundary layers tend to decrease slightly, further approaching each other near the heater edge (at r = 165 mm). The lower SiH3 surface fluxes result in the boundary layers of the SiH3 density field becoming thicker; thus, the deposition rates decrease in the vicinity of r = 150 mm. At the heater edge, the origin of the higher SiH3 surface flux can be understood by the electron-impact dissociation being enhanced by the Neo there, and thus excess SiH3 is produced and transported to the heater surface.
In Figure 9d, for Cases 2, 3, 4, and 5, the averaged values of the normalized deposition rates are plotted against the showerhead temperature. The values are normalized with the average value of Case 2 for the clear comparison. Notably, the average rates are largely affected by the showerhead temperature: the average deposition rate of Case 5 is approximately 30% higher than that of Case 2, although the maximum value of the SiH3 density of Case 5 is lower than that of Case 2. The increase in the deposition rate can be understood by observing the increase in the SiH3 density near the heater surface in Figure 8.

3.6. Effects of the Showerhead Temperature on the Particle Deposition

To analyze the effects of increasing the temperature of the showerhead on lowering the number of particles transported onto the heater surface, the number of particles that were deposited was experimentally measured by counting the total number of particles. The input parameters were identical to those of Cases 2, 3, 4, and 5. In Figure 10, the number of particles of which the size is characteristically larger than 45 nm is plotted against the showerhead temperature: in the inset, simulation results of Si2H6 density distributions are depicted for Cases 2 and 5. The higher showerhead temperature decreases the number of deposited particles. Note that the number of particles of which the size exceeds 45 nm is decreased by approximately 93% by increasing the showerhead temperature from 373 to 553 K.
Understanding the tendency of the number of particles to decrease, as depicted in Figure 10, would require us to analyze the effects of the heated showerhead on the spatial distributions of the high-order silanes such as SinH2n+2 (n ≥ 5). Figure 11 and Figure 12 demonstrate that for Cases 2, 3, 4, and 5, Si5H12 and Si12H26 reach the heater surface less easily when the showerhead temperature is higher, respectively. The thickness of the diffusion layer formed near the showerhead inlet becomes slightly larger with higher showerhead temperature, regardless of the value of n in the high-order silane. As a result of the slower growth, the compositions of these species are lowered at the heater surface.
As similarly observed in Figure 5 (Si2H6), in all four cases, the density distribution of Si5H12 is initially low at the showerhead inlet and increases as it approaches the bulk plasma region in Figure 11. Case 5 has the lowest density distribution of Si5H12 near the heater surface. This similar growth trend originates from Si5H12 being grown from Si2H6 by cluster formation as a result of SiH2 insertion, as shown below:
SiH2 + SinH2n+2 → Sin+1H2n+4, kr = 4.2 × 10⁻¹⁶ [1 − (1 + 0.0033 pg (Pa))−1] m3 s−1,
where n is larger than one [9]. As Si12H26 is also generated from the above SiH2 insertion reaction, the difference in the Si12H26 density distribution between Cases 2 and 5 increases, as shown in Figure 12 (note that the observed difference is two orders of magnitude).

4. Conclusions

In this study, we investigated how to enhance the cleanliness and deposition rate by aiming to understand the multiple roles of the showerhead electrode in a CCP reactor. The discharge volume was installed between the showerhead electrode and the heater electrode. We simulated the gas transport in a three-dimensional complex geometry, whereas the SiH4/He CCP discharges were considered in a simplified two-dimensional geometry.
The SiH4/He discharges were investigated by varying the showerhead temperature Tsh as 373, 423, 473, and 673 K. The simulation results were validated through comparison with a practical PECVD experiment. We analyzed the extent to which the heated showerhead was able to contribute to increasing the deposition rate as well as to decreasing the number of particles generated during plasma processes. A comparison between Cases 2 (Tsh = 373 K) and 5 (Tsh = 673 K) showed that the Si+ production rate in Case 5 was lower than that in Case 2 as a result of the decreased SiH4 density near the hotter showerhead.
Although the peak electron density was lower near the electrode edge in Case 5 compared to Case 2, the SiH3 density detected near the heater increased in Case 5. This comparison can be understood by SiH3 being depleted faster in the bulk by the enhancement in the disproportionation process as a result of the higher peak SiH3 density in Case 2. As a result, the average deposition rate of Case 5 was approximately 30% higher than that of Case 2. The effect of increasing the showerhead temperature on decreasing the number of particles transported onto the heater was experimentally measured by counting the number of particles that were deposited. The number of particles larger than 45 nm was decreased by approximately 93% by increasing the showerhead temperature from 373 to 553 K.

Funding

This work was supported by the Gachon University research fund of 2019 (GCU-2019-0814) and the National Research Council of Science & Technology (NST) grant by the Korea government (MSIT) (No. CRC-20-01-NFRI).

Institutional Review Board Statement

Not applicable.

Informed Consent Statement

Not applicable.

Data Availability Statement

Not applicable.

Conflicts of Interest

The authors declare no conflict of interest.

References

  1. Smith, D.L. Thin-Film Deposition: Principles and Practice; McGraw-Hill: New York, NY, USA, 1995. [Google Scholar]
  2. Lieberman, M.A.; Lichtenberg, A.J. Principles of Plasma Discharges and Materials Processing; John Wiley & Sons Inc.: Hoboken, NJ, USA, 2005. [Google Scholar]
  3. Maydan, D. The future of equipment development and semiconductor production. Mater. Sci. Eng. A 2001, 302, 1–5. [Google Scholar] [CrossRef]
  4. Yavas, O.; Richter, E.; Kluthe, C.; Sickmoeller, M. Wafer-edge yield engineering in leading-edge DRAM manufacturing. Semicond. Fabtech 2009, 39, 1–5. [Google Scholar]
  5. Hwang, S.; Kanarik, K. Evolution of Across-Wafer Uniformity Control in Plasma Etch. Available online: https://sst.semiconductor-digest.com/2016/08/evolution-of-across-wafer-uniformity-control-in-plasma-etch/ (accessed on 1 August 2021).
  6. Sansonnens, L.; Howling, A.A.; Hollenstein, C. A gas flow uniformity study in large-area showerhead reactors for RF plasma deposition. Plasma Sources Sci. Technol. 2000, 9, 205–209. [Google Scholar] [CrossRef]
  7. Leroy, O.; Gousset, G.; Alves, L.L.; Perrin, J.; Jolly, J. Two-dimensional modelling of SiH4-H2 radio-frequency discharges for a-Si:H deposition. Plasma Sources Sci. Technol. 1998, 7, 348. [Google Scholar] [CrossRef]
  8. Howling, A.A.; Legradic, B.; Chesaux, M.; Hollenstein, C. Plasma deposition in an ideal showerhead reactor: A two-dimensional analytical solution. Plasma Sources Sci. Technol. 2012, 21, 535–542. [Google Scholar] [CrossRef]
  9. Perrin, J.; Leroy, O.; Bordage, M.C. Cross-sections, rate constants and transport coefficients in silane plasma chemistry. Contrib. Plasma Phys. 1996, 36, 3–49. [Google Scholar] [CrossRef]
  10. Lee, S.; Won, J.; Choi, J.; Jang, S.; Jee, Y.; Lee, H.; Byun, D. Preparation and analysis of amorphous carbon films deposited from (C6H12)/Ar/He chemistry for application as the dry etch hard mask in the semiconductor manufacturing process. Thin Solid Films 2011, 519, 6737–6740. [Google Scholar] [CrossRef]
  11. Lee, S.; Won, J.; Choi, J.; Park, J.; Jee, Y.; Lee, H.; Byun, D. Comparative study on the properties of amorphous carbon layers deposited from 1-hexene and propylene for dry etch hard mask application in semiconductor device manufacturing. Thin Solid Films 2011, 519, 6683–6687. [Google Scholar] [CrossRef]
  12. Lee, S.M.; Won, J.; Yim, S.; Park, S.J.; Choi, J.; Kim, J.; Lee, H.; Byun, D. Effect of deposition temperature and thermal annealing on the dry etch rate of a-C:H films for the dry etch hard process of semiconductor devices. Thin Solid Films 2012, 520, 5284–5288. [Google Scholar] [CrossRef]
  13. Denpoh, K.; Moroz, P.; Kato, T.; Matsukuma, M. Multiscale plasma and feature profile simulations of plasma-enhanced chemical vapor deposition and atomic layer deposition processes for titanium thin film fabrication. Jpn. J. Appl. Phys. 2020, 59, SHHB02. [Google Scholar] [CrossRef]
  14. Kim, H.J.; Lee, H.J. Analysis of intermediate pressure SiH4/He capacitively coupled plasma for deposition of an amorphous hydrogenated silicon film in consideration of thermal diffusion effects. Plasma Sources Sci. Technol. 2017, 26, 085003. [Google Scholar] [CrossRef]
  15. Kim, H.J.; Lee, H.J. Uniformity control of the deposition rate profile of a-Si:H film by gas velocity and temperature distributions in a capacitively coupled plasma reactor. J. Appl. Phys. 2018, 123, 113302. [Google Scholar] [CrossRef]
  16. Kleijn, C.R.; Meer, T.H.v.d.; Hoogendoorn, C.J. A mathematical model for LPCVD in a single wafer reactor. J. Electrochem. Soc. 1989, 136, 3423. [Google Scholar] [CrossRef]
  17. Kleijn, C.R.; Hoogendoorn, C.J.; Hasper, A.; Holleman, J.; Middelhoek, J. Transport phenomena in tungsten LPCVD in a single-wafer reactor. J. Electrochem. Soc. 1991, 138, 509. [Google Scholar] [CrossRef]
  18. CFD, R.C. CFD-ACE Module Manual; ESI US R&D Inc.: Huntsville, AL, USA, 2003. [Google Scholar]
  19. Farouk, T.; Farouk, B.; Staack, D.; Gutsol, A.; Fridman, A. Simulation of dc atmospheric pressure argon micro glow-discharge. Plasma Sources Sci. Technol. 2006, 15, 676–688. [Google Scholar] [CrossRef]
  20. Farouk, T.; Farouk, B.; Gutsol, A.; Fridman, A. Atmospheric pressure methane-hydrogen dc micro-glow discharge for thin film deposition. J. Phys. D Appl. Phys. 2008, 41, 175202. [Google Scholar] [CrossRef]
  21. Kim, H.J.; Lee, H.J. 2D fluid model analysis for the effect of 3D gas flow on a capacitively coupled plasma deposition reactor. Plasma Sources Sci. Technol. 2016, 25, 035006. [Google Scholar] [CrossRef]
  22. Kim, H.J.; Beskok, A. An algebraic factorisation scheme for spectral element solution of incompressible flow and scalar transport. Int. J. Comp. Fluid Dynamics 2010, 24, 95–108. [Google Scholar] [CrossRef]
  23. Lee, A.S.; Rajagopalan, N.; Le, M.; Kim, B.H.; M’Saad, H. Development and characterization of a PECVD silicon nitride for damascene applications. J. Electrochem. Soc. 2004, 151, F7–F9. [Google Scholar] [CrossRef]
  24. Kim, J.-H.; Moon, S.; Kim, J.-W.; Lee, D.; Park, B.C.; Kim, D.-H.; Jeong, Y.; Hand, S.; Osborne, J.; Wolf, P.D.; et al. Advanced measurement and diagnosis of the effect on the underlayer roughness for industrial standard metrology. Sci. Rep. 2019, 9, 1018. [Google Scholar] [CrossRef] [Green Version]
  25. Perrin, J.; Shiratani, M.; Kae-Nune, P.; Videlot, H.; Jolly, J.; Guillon, J. Surface reaction probabilities and kinetics of H, SiH3, Si2H5, CH3, and C2H5 during deposition of a-Si:H and a-C:H from H2, SiH4, and CH4 discharges. J. Vac. Sci. Technol. A. 1998, 16, 278. [Google Scholar] [CrossRef]
  26. Danko, S.; Bluhm, D.; Bolsinger, V.; Dobrygin, W.; Schmidt, O.; Brinkmann, R.P. A global model study of silane/hydrogen discharges. Plasma Sources Sci. Technol. 2013, 22, 055009. [Google Scholar] [CrossRef]
  27. Bird, R.B.; Stewart, W.E.; Lightfoot, E.N. Transport Phenomena; John Wiley & Sons, Inc.: Hoboken, NJ, USA, 2007. [Google Scholar]
  28. Kushner, M.J. Simulation of the gas-phase processes in remote-plasma-activated chemical-vapor deposition of silicon dielectrics using rare gas-silane-ammonia mixtures. J. Appl. Phys. 1992, 9, 4173–4189. [Google Scholar] [CrossRef] [Green Version]
  29. Park, H.; Yoon, E.; Lee, G.-D.; Kim, H.J. Analysis of surface adsorption kinetics of SiH4 and Si2H6 for deposition of a hydrogenated silicon thin film using intermediate pressure SiH4 plasmas. Appl. Surf. Sci. 2019, 496, 143728. [Google Scholar] [CrossRef]
Figure 1. CCP reactor configuration is depicted with the reactor dimensions. The spatial variation in the electron power density (Pe, W m−3) is superimposed. The inset shows the shape of the showerhead hole.
Coatings 11 00999 g001
Figure 2. The 3D gas flow simulation results for Case 1: (a) streamlines and (b) gas velocity magnitude contour plot.
Coatings 11 00999 g002
Figure 6. Effects of the showerhead temperature (Tsh) on the spatial distribution of the plasma parameters. Contour plots for the spatial profiles of the time-averaged SiH2+ production rate for (a) Case 2 (Tsh = 373 K) and (b) Case 5 (Tsh = 673 K) for r ≥ 120 mm. Contour plots for the spatial profiles of the time-averaged Si+ production rate (c) for Case 2 (Tsh = 373 K) and (d) for Case 5 (Tsh = 673 K) for r ≥ 120 mm. The profiles are radially uniform for r < 120 mm.
Coatings 11 00999 g006
Figure 7. Effects of the showerhead temperature (Tsh) on the spatial distribution of the plasma parameters. Contour plots for the spatial profiles of the time-averaged electron density (Ne, m−3) for (a) Case 2 (Tsh = 373 K) and (b) Case 5 (Tsh = 673 K) for r ≥ 120 mm. Contour plots for the spatial profiles of the time-averaged electron power density (Pe, W m−3) for (c) Case 2 (Tsh = 373 K) and (d) Case 5 (Tsh = 673 K) for r ≥ 120 mm. The profiles are radially uniform for r < 120 mm.
Coatings 11 00999 g007
Figure 8. Effects of the showerhead temperature (Tsh) on the spatial distribution of the radical. Spatial variations in the SiH3 density distributions (m−3) for (a) Case 2 (Tsh = 373 K), (b) Case 3 (Tsh = 423 K), (c) Case 4 (Tsh = 473 K), and (d) Case 5 (Tsh = 673 K) for r ≥ 120 mm. The profiles are radially uniform for r < 120 mm.
Coatings 11 00999 g008
Figure 9. Deposition rates are largely affected by the showerhead temperature. (a) The deposition rate profiles are plotted for Cases 2 (Tsh = 373 K), 3 (Tsh = 423 K), 4 (Tsh = 473 K), and 5 (Tsh = 673 K). (b) For Case 2, the experimental data are superimposed. (c) For Cases 4 and 6, the experimental data are superimposed. (d) For Cases 2, 3, 4, and 5, the averaged values of the normalized deposition rates are plotted against the showerhead temperature. The experimental data are denoted with larger circle symbols.
Coatings 11 00999 g009
Figure 10. Effects of the showerhead temperature on the number of particles deposited on the heater surface. The number of deposited particles is plotted against the showerhead temperature.
Coatings 11 00999 g010
Figure 11. Effects of the showerhead temperature (Tsh) on the spatial distribution of high-order silanes. Spatial variations in the Si5H12 density distributions (m−3) for (a) Case 2 (Tsh = 373 K), (b) Case 3 (Tsh = 423 K), (c) Case 4 (Tsh = 473 K), and (d) Case 5 (Tsh = 673 K).
Coatings 11 00999 g011
Figure 12. Effects of the showerhead temperature (Tsh) on the spatial distribution of high-order silanes. Spatial variations in the Si12H26 density distributions (m−3) for (a) Case 2 (Tsh = 373 K), (b) Case 3 (Tsh = 423 K), (c) Case 4 (Tsh = 473 K), and (d) Case 5 (Tsh = 673 K).
Coatings 11 00999 g012
Table 1. List of cases considered in this study. Case 1 was considered in a three-dimensional geometry.
Case No.Considered
Physics
Considered
Geometry
Showerhead Temperature (Tsh, K)
1Gas flows only3D complex geometry473
2Gas flows + Plasma discharges2D simplified geometry373
3Gas flows + Plasma discharges2D simplified geometry423
4Gas flows + Plasma discharges2D simplified geometry473
5Gas flows + Plasma discharges2D simplified geometry673
6Gas flows + Plasma discharges2D simplified geometryModified inlet (3D)
Publisher’s Note: MDPI stays neutral with regard to jurisdictional claims in published maps and institutional affiliations.

