Article

Optical Absorption in Si:H Thin Films: Revisiting the Role of the Refractive Index and the Absorption Coefficient

1
Institute of Aurel Stodola, Faculty of Electrical Engineering and Communication Technologies, University of Žilina, 031 01 Liptovský Mikuláš, Slovakia
2
New Technology Research Center, University of West Bohemia, Univerzitní 8, 306 14 Plzeň, Czech Republic
*
Author to whom correspondence should be addressed.
Coatings 2021, 11(9), 1081; https://doi.org/10.3390/coatings11091081
Submission received: 8 August 2021 / Revised: 31 August 2021 / Accepted: 2 September 2021 / Published: 7 September 2021

Abstract

:
This paper reports on absorption properties of thin films of hydrogenated amorphous and microcrystalline silicon considered for absorption-based applications, such as solar cell, photodetectors, filters, sensors, etc. A series of four amorphous and four microcrystalline samples PECVD deposited under varied hydrogen dilution was under consideration. Various absorption metrics, based separately on the absorption coefficient and the refractive index (single pass absorption, optical path length, classical light trapping limit) or direct absorptance calculated by the Yablonovitch concept based on a mutual role of them were examined and compared. Differences in absorption abilities are related to the evolving thin film microstructure.

1. Introduction

Effective photon management has been still a current challenge in all optical absorption-based applications of thin films. Improvements in efficiency of amorphous (a-Si:H) and microcrystalline hydrogenated silicon (μc-Si:H) thin-film absorbers as photodetectors, solar cells, filters, sensors, photonic integrated circuits etc. have been constantly under an extensive interest depending to a great extent on thin film structure, microstructure of Si-H bonds and the resistance against degradation [1,2,3,4,5]. Light trapping structures with different degrees of order resulting in changing absorption have been frequently published and applied [6,7,8,9]. This concept is based on increased optical path length in comparison with the actual absorber thickness. Main strategies to achieve increased absorption due to light trapping are anti-reflection coatings, incoherent light trapping (random scattering inside the absorber or at interfaces that is usually achieved by special patterning), and coherent light trapping in thin films or thin film stacks [10,11,12,13,14,15]. The role of microstructure, i.e., nanocrystalline features inside the thin films, has been frequently studied as playing an important role in the light absorption, e.g., for photodetection [16,17].
Coherent light trapping in thin films does not require costly nanoscale patterning. In a thin film absorber with parallel smooth interfaces the optical path length is increased by multiple light reflections at opposite parallel thin film interfaces although most light is absorbed in the first pass [18]. It is frequent that only reflectance and transmittance is used to consider absorption in thin film absorbers as an extrinsic effect. But it is crucial to remember that the amount of reflected, transmitted and absorbed light depends on fundamental optical properties of the thin film, i.e., on the refractive index and the absorption coefficient. In case of known fundamental optical characteristics—refractive indices and absorption coefficients—and the way how to influence them by the preparation method, some explicit absorption criterion is necessary to characterize a thin film absorber.
Refractive indices are usually minor target of interest, special attention is mostly concentrated on absorption coefficients. However, mutual implementation of the refractive index and the absorption coefficient offers a quite different picture of absorption properties and light trapping limits.
This paper analyzes various metrics to review optical absorption and consider how it can be changed in thin films with different refractive indices and absorption coefficients. The objective of the analysis is a series of Si:H thin films PECVD deposited under increasing hydrogen to silane gas flows that cause the phase transition from amorphous to microcrystalline structure with crystalline grains of ~9 nm and a certain degree of porosity. Absorption metrics used for the comparison are the absorption coefficient, single pass absorption, optical path length, classical light trapping limit and the Yablonovitch absorptance. The results are compared and correlated with the thin film microstructure.

2. Materials, Microstructure and Optical Characterization

A series of thin undoped Si:H films was deposited from silane (SiH4) and argon (Ar) plasma on clean EAGLE 2000 glass substrates (Corning, Corning, NY, USA) by a 13.56 MHz rf excited parallel plate PECVD PD-220N system (SAMCO, Kyoto, Japan). Additional hydrogen (H2) was added to SiH4+Ar to provide different dilutions of silane plasma flow to hydrogen flow defined as R = (H2)/(SiH4). The dilutions applied to the sample series varied in the wide range from 0 (no additional hydrogen) to 70. To avoid the thickness-dependent deposition of Si:H, the thickness of the films was kept at approximately 400 nm. More details on the deposition conditions are in [19] where also prior studies on samples structure and microstructure were published. XRD, Raman scattering analysis and FTIR spectroscopy show that at dilutions R ≤ 30 the thin films consist of amorphous a-Si:H. At depositions with dilutions R > 30 material transforms to microcrystalline μc-Si:H. Volume fraction ratios of crystalline to amorphous phase pc/pa determined from XRD analysis are in Table 1.
FTIR spectra show hydrogen bonding in two stretching vibrational modes corresponding to monohydrides in small volumes of vacancies (~2000 cm−1) and dihydrides at internal surfaces of voids or at the boundaries between the crystalline grains (~2100 cm−1). The ratio of hydrogen bonded in dihydrides to the total bonded hydrogen is the microstructural factor. High values of this factor indicate the porosity of the samples [19] that was determined by the method described in [20].
The concentration c H of bonded hydrogen was determined from the stretching vibrations by the procedure described in [20]. The values of c H in atomic % in Table 1 show that after increasing the crystalline phase volume fraction at R = 40 and higher, μc-Si:H samples suddenly receive less hydrogen than a-Si:H. This result confirms the dominating role of hydrogen in a-Si:H in compensating the defects, relaxing the strained a-Si network, improving medium-range order and assisting crystallization. Overall low values of hydrogen concentration can be caused by the presence of Ar ions at the deposition that reconstruct Si network [21].
The decomposition of baseline corrected Raman scattering spectra in the region of 450–520 cm−1 revealed peaks at ~450 and 480 cm−1 corresponding to amorphous phase in a-Si:H and additional peaks at 510 and 520 cm−1 corresponding to grain boundaries and crystalline components in μc-Si:H [22]. The crystalline grain size can be calculated from the shift of the peak at 520 cm−1 according to the formula L R = 88.43 | ν ¯ 520.7 | [23] where ν ¯   is the position of the transverse optical mode with respect to the crystalline Si peak position of 520.7 cm−1. The values of LR ~9 nm are similar for all μc-Si:H samples that then differ only by the individual phase volume fractions.
Optical transmittance spectra in the wavelength range of (430 ÷ 1100) nm at nearly normal incidence were recorded by a Specord 210 spectrophotometer (Analytic Jena, Jena, Germany) and processed by optimization procedure based on genetic algorithm described in [19] to obtain the wavelength-dependent complex refractive index n ^ = n + i k , where the refractive index n and the extinction coefficient k are the real and imaginary parts of n ^ . In the used optimization model the thin film was considered homogeneous with parallel smooth interfaces. The absorption coefficients α are related to k as α = 4 π k / λ where λ is the wavelength. The results of n, α are in Figure 1 and Figure 2. The thickness d of the samples was determined from optimization of spectral transmittance, too (Table 1).
The refractive index apparently decreases with increasing dilution (Figure 1). Its extrapolation to the non-absorbing region provides the so-called refractive index in the long-wavelength limit n related to the atomic structure and the mass density of the sample. The values of n decrease with increasing dilution according to Table 1 what indicates the decreasing density of the samples.
Absorption coefficients in Figure 2 are clearly divided into two groups according to the structure. The transition from a-Si:H to μc-Si:H shown clearly in microstructural characteristics is responsible for this division indicating the threshold of forming crystalline grains and thus material with prevailing crystalline phase under increasing amount of hydrogen at deposition. Due to the crystalline grains in μc-Si:H thin films, internal scattering effect may contribute to the absorption coefficients [24,25].
As it can be expected absorption edges of μc-Si:H are obviously shifted to lower photon energies (i.e., higher wavelengths) in comparison to a-Si:H, so μc-Si:H absorbs red and near IR light better. Optical band gaps of these mixed-phase thin films based on several approaches were also reported [19,26].
The comparison of the areas under the curves of absorption coefficients depicted in Figure 2 shows that a-Si:H thin films under study are better absorbers per cm−1 than μc-Si:H thin films over the visible and near IR region.

3. Results and Discussion

The absorption coefficient α ( λ ) is a material property related to the penetration of light of a specific wavelength λ into a material. However, generally said, as the thickness of individual thin films and reflections at interfaces may differ, deeper comprehension may be helpful. Several metrics are usually available for considering light absorption abilities.

3.1. Single Pass Absorption and Optical Path Length

A metric to express how much light is absorbed before reaching the bottom interface of a thin film of the thickness d is the single pass absorption Asinglepass = 1 − exp(− α ( λ ) d) ~ α ( λ ) d while normal light incidence and homogeneous material are supposed. The normalized results are shown in Figure 3 where different Asinglepass of four a-Si:H and four μc-Si:H thin films can be distinguished.
Optical path length OPL = n d is an optical metric considering the differences of light travelling through samples of varied density expressed by the refractive index. The values of OPL calculated as n d are in Table 1 in which positive increase of OPL in μc-Si:H thin films with increasing dilution can be seen. Differences between a-Si:H and μc-Si:H are obvious. Nevertheless, there are several constraints on the usage of OPL as a figure of absorption merit, namely overlooking reflections at the interfaces and additional optical losses and interference effects.

3.2. Refractive Indices and Absorption Coefficients in Light Trapping Limits

Overall lower absorption in μc-Si:H compared to a-Si:H evokes the need to use thicker microcrystalline thin films as optical absorbers, e.g., solar cells and/or to use light trapping texturization to achieve higher absorption efficiency.
Light trapping schemes are characterized by limits based on fundamental optical properties of material. Importance of the refractive index for light trapping schemes such as nanostructures or texturization is known and manifested in the so-called classical Yablonovitch light trapping limit. This limit in planar optical absorbers surrounded by isotropic medium is 4n2. The 4n2 metric is acknowledged as a maximum increase of OPL concluding a factor enhancing the single pass absorption α ( λ ) d [27,28,29,30,31]. In thin-film solar cells classical upper light trapping limit 4n2 is the key factor to consider achieving high power conversion efficiencies. It is widely accepted as an appropriate reference point to compare light trapping concepts, although being generally valid for a specific geometry.
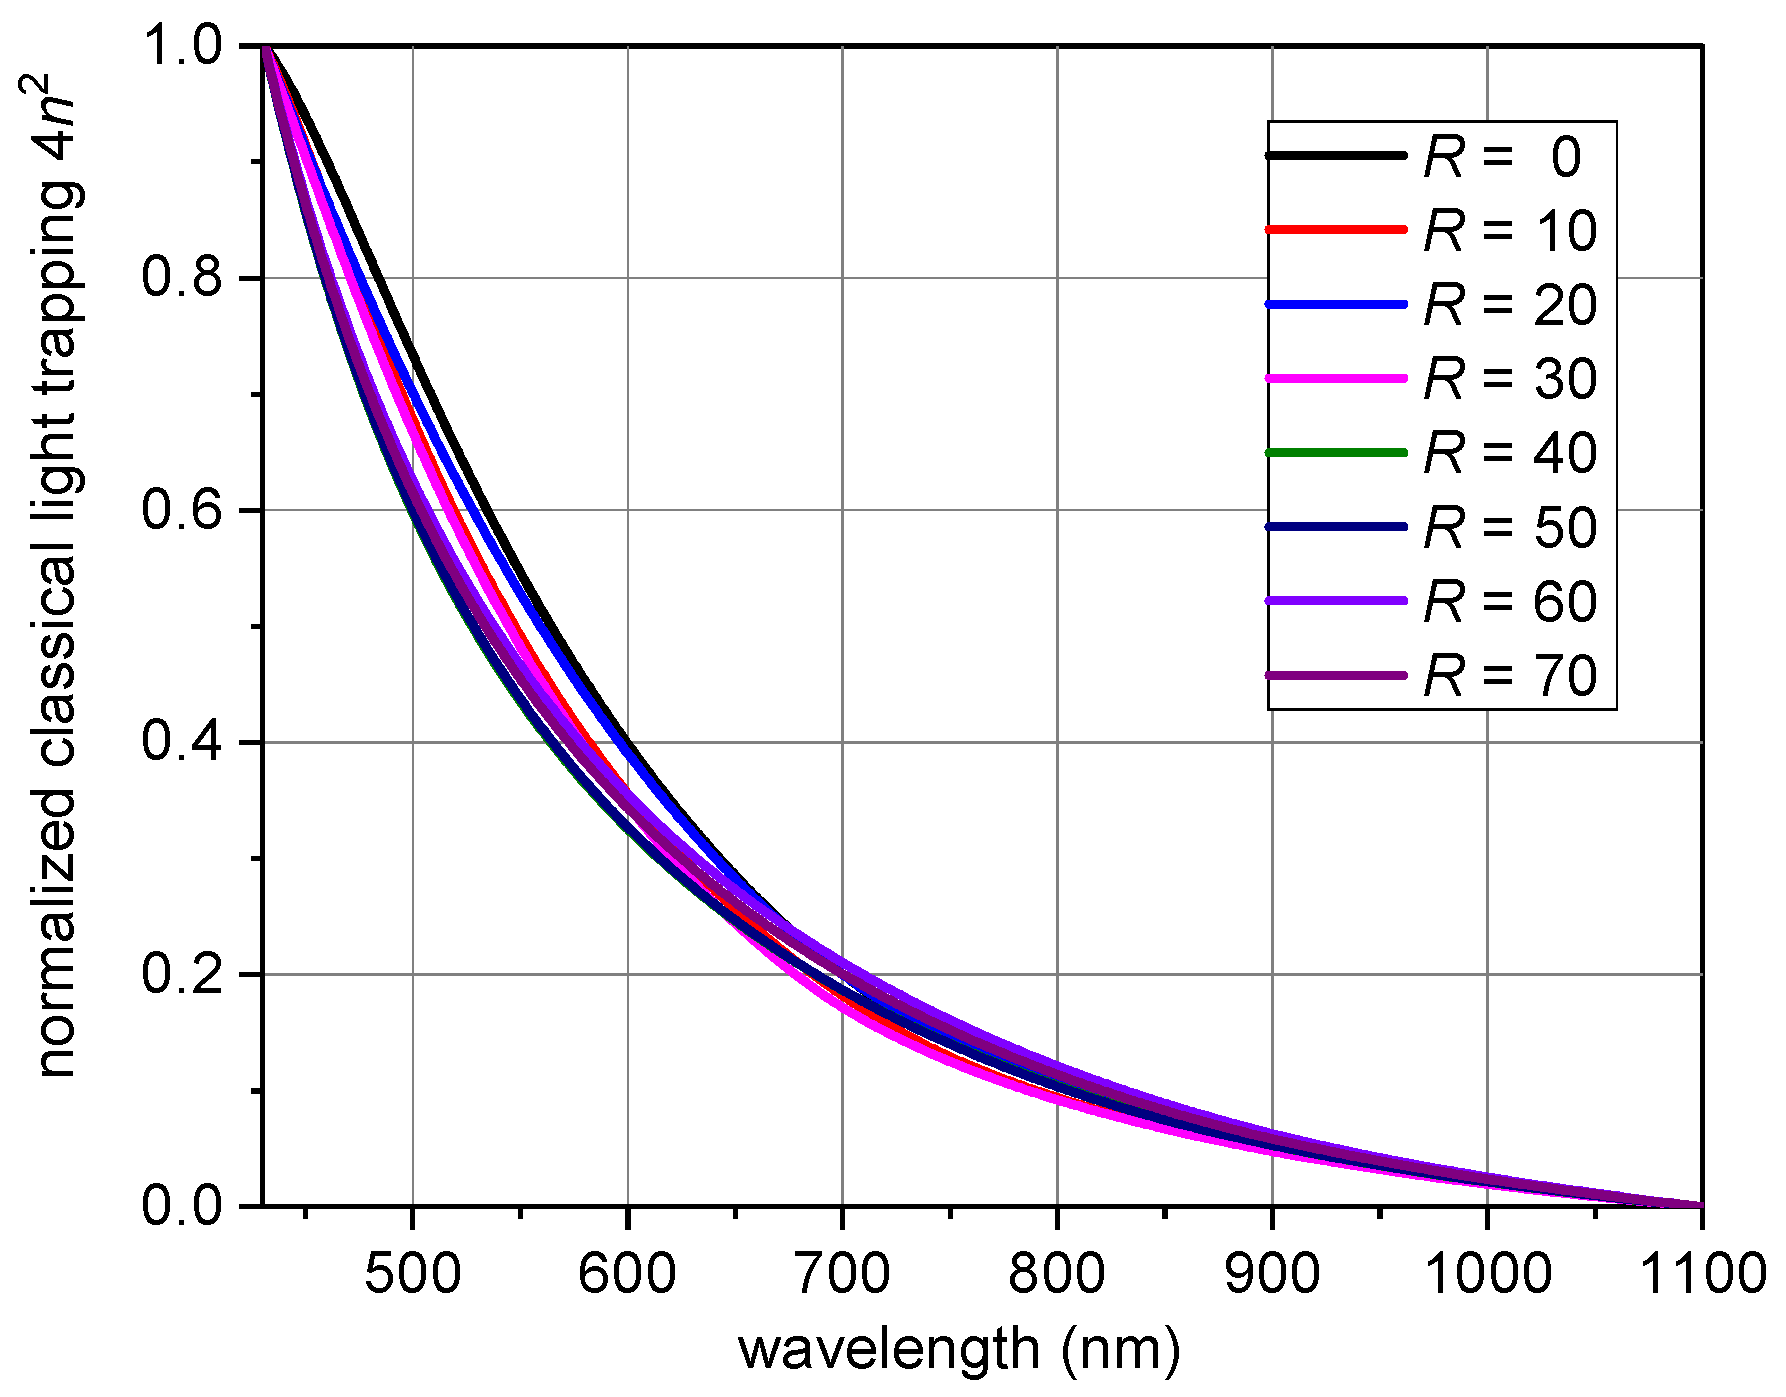
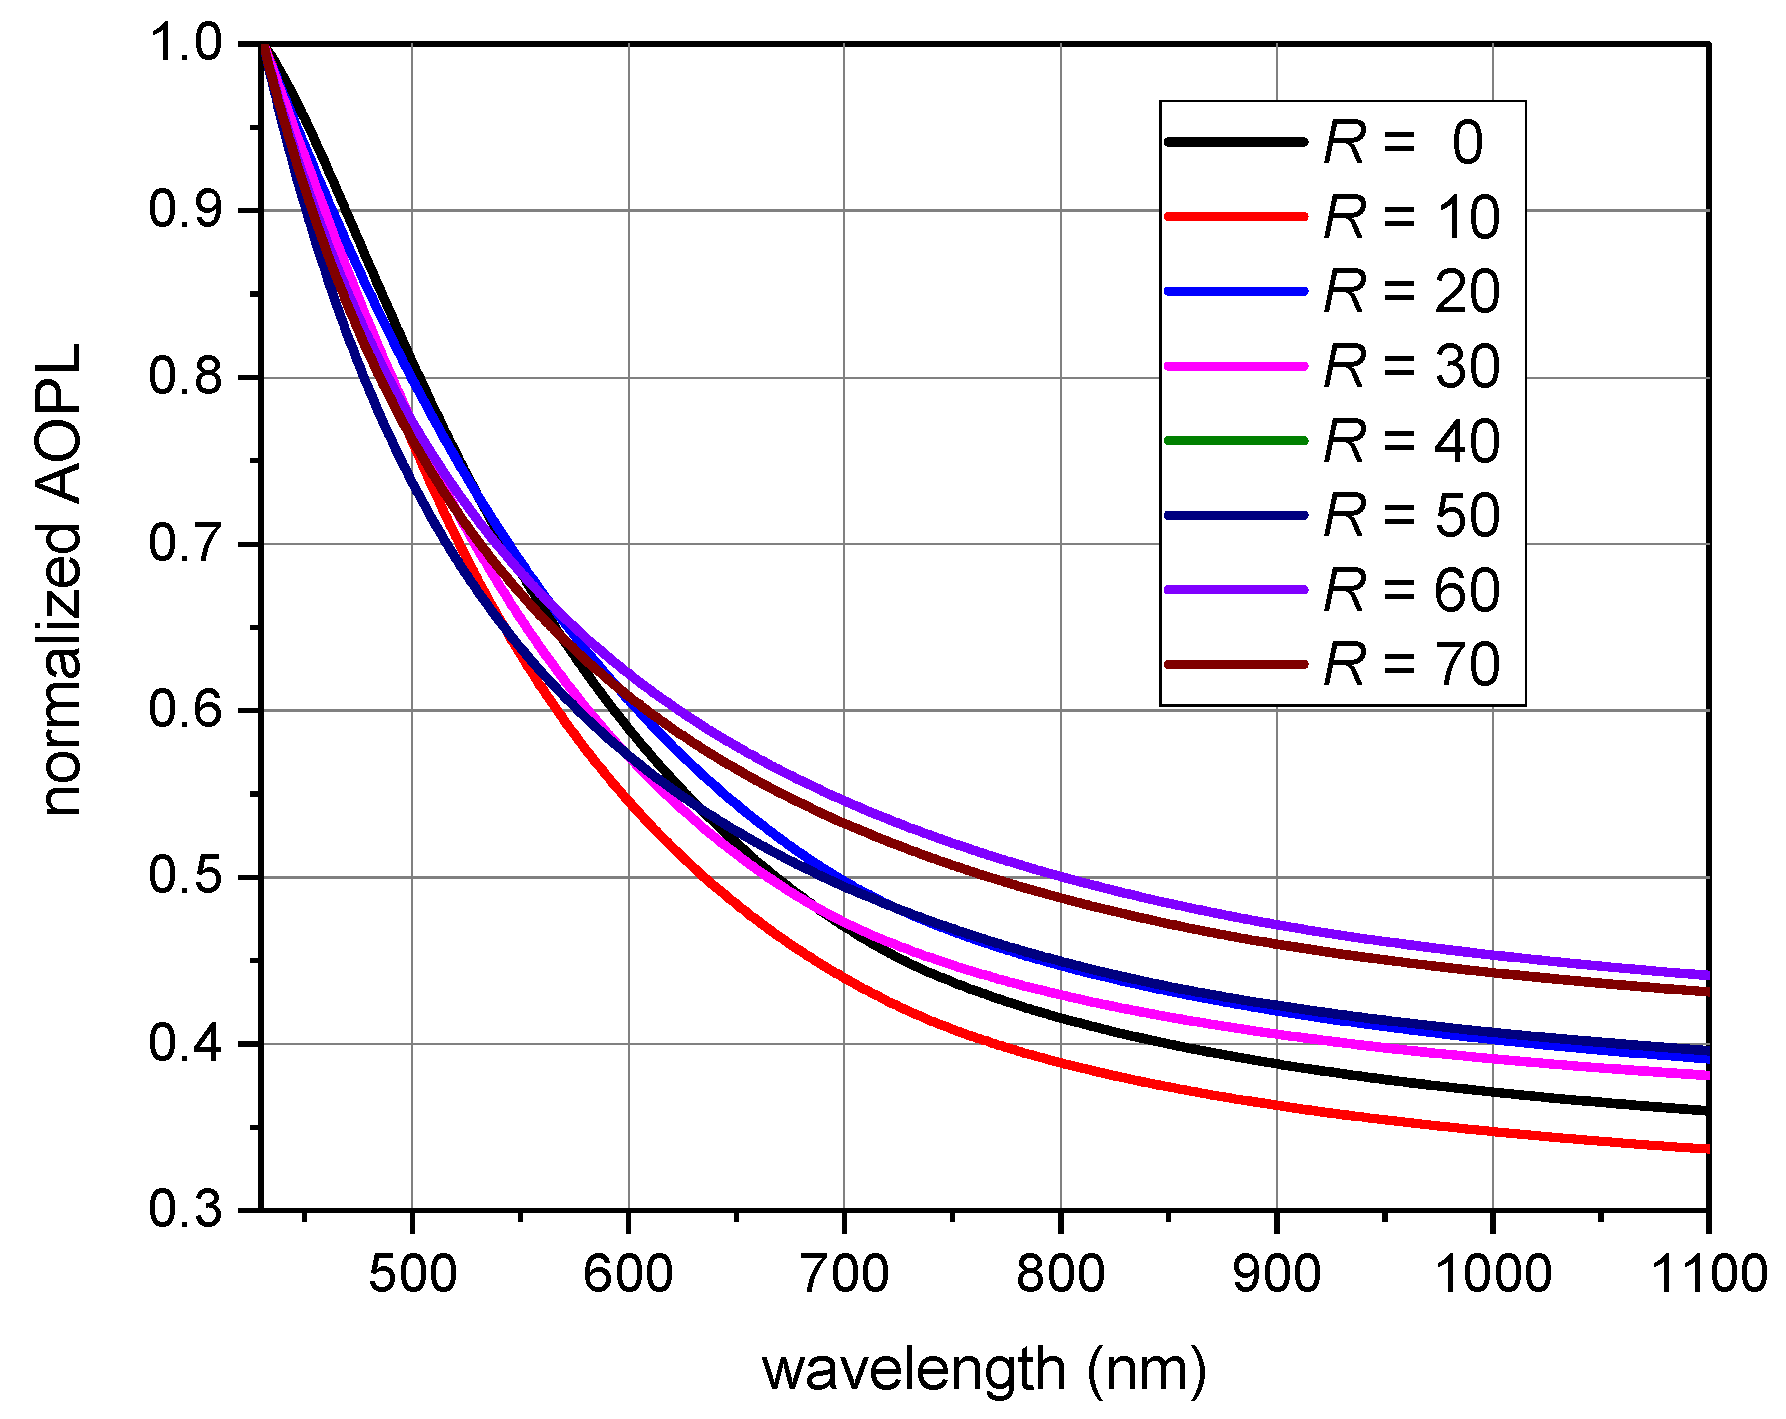
Figure 4 shows that there are not significant differences in normalized 4n2 of all investigated samples regardless of their structure and therefore this does not seem to be an appropriate tool to select properly the most efficient absorber. In [31] the so-called apparent OPL (AOPL) was introduced to include trapping limit into OPL defined as AOPL = 4n2 (nd).
In Figure 5 we can see the normalized AOPL. The differences between the samples are better distinguished and favouring μc-Si:H in comparison with a-Si:H. In comparison with single pass absorption (Figure 3), AOPLs including light trapping limit are well shifted to higher wavelengths.
As the refractive index is wavelength-dependent, 4n2 in Figure 5 is also wavelength-dependent. To acquire one numerical value to estimate the trapping limit, n can be applied. Table 1 shows 4 n 2 , i.e., the classical Yablonovitch limit calculated with n . This metric also obviously favours a-Si-H deposited at lower dilutions R = 10 or 20 over μc-Si:H.
The major limitation of 4n2 and AOPL metrics is that they apply only in weakly absorbing region and therefore can be confusing. A practical extension of this approach accommodating also higher absorption regions is the direct absorptance according to the Yablonovitch concept defined as [32]:
A ( λ ) = α ( λ ) α ( λ ) + 1 4 n 2 ( λ ) d  
where A ( λ )   assumes perfect antireflections and perfect Lambertian light trapping with the 4 n 2 limit of the OPL enhancement [27,28]. It can be used to consider the light trapping limit, e.g., in sensing, photodetecting or photovoltaics [33,34,35,36].
Figure 6 shows that A ( λ ) better distinguishes between the members of the series and apparently organizes them in two separate groups of a-Si:H and μc-Si:H again. On the other hand, μc-Si:H Yablonovitch absorptance (R > 30) is desirably shifted to higher wavelengths similarly than optical band gaps. Then we can conclude that μc-Si:H members of the series have better prospects for light trapping. Although in this metric also the thickness d enters the calculation, similar thicknesses of 8 members of the series cannot be responsible for the apparent separation of a-Si:H and μc-Si:H thin films in Figure 6. Therefore, in spite of the fact that a-Si:H thin films are in general better in absorption coefficients, the Yablonovitch absorptance limits of μc-Si:H are higher and better light trapping can be expected in μc-Si:H thin films deposited under dilutions R > 30.
A ( λ ) from Figure 6 integrated over the wavelength range of (430 ÷ 1100) nm denoted as the integrated direct Yablonovitch absorptance AYint is listed in Table 1 as a figure of merit of the overall Yablonovitch absorptance. Although direct absorptances A ( λ ) of a-Si:H (R ≤ 30) thin films are closer to a perfect step function, the amount of absorbed photons proportional to the integrated area under the curves can be obviously higher for μc-Si:H.
The benchmark wavelength λb introduced in [29] is another criterion of light trapping scheme. It is defined as a wavelength at which the direct Yablonovitch absorptance A ( λ b ) = 0.5 , what according to Equation (1) means 4 n 2 ( λ b ) d = 1 . At wavelengths < λ b the absorption is relatively high and light trapping is not very essential. For wavelengths > λ b the direct absorptance decreases and light trapping is of practical importance. From Table 1 an opposite influence of increasing dilution for a-Si:H and μc-Si:H on λ b implies that λ b may be connected mainly with the microstructure.
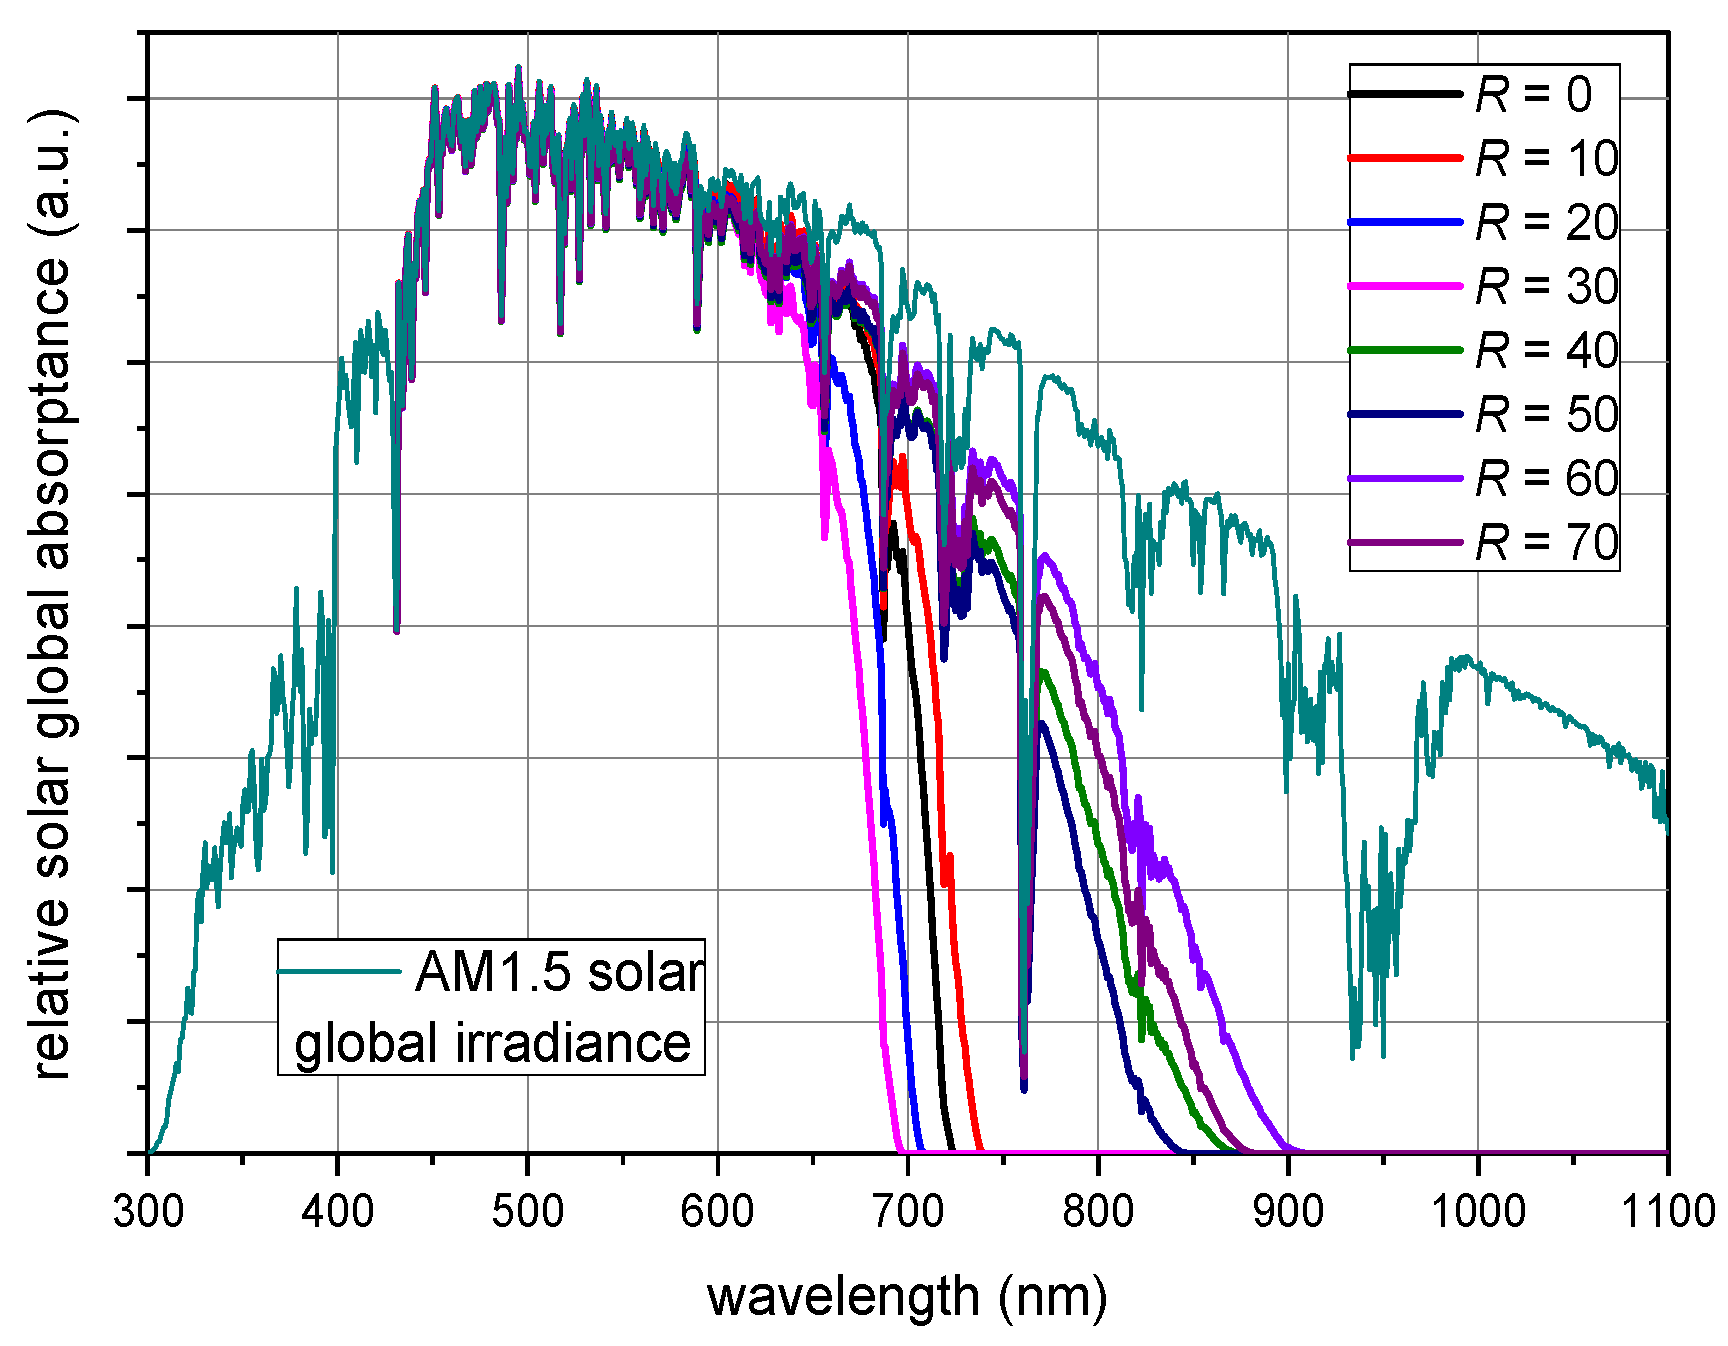
The importance of the direct Yablonovitch absorptance is clearly seen in considering the absorption of solar light in solar cells or sensors based on solar light absorption, e.g., motion sensors. A merit of the suitability of a thin film absorber of solar light is the spectrum of A(λ)   S AM 1.5 g ( λ ) . S A M 1.5 g ( λ ) is the AM1.5 reference solar global spectral irradiance according to ASTM G173-03 [37]. In solar cells A(λ)   S A M 1.5 g is directly proportional to the photo-generated current density and correlating with solar cell efficiency.
The spectrum of A(λ)   S AM 1.5 g ( λ ) is related to the spectral solar global irradiance absorbed by the sample. Better performance of μc-Si:H is obvious from Figure 7 where relative values of A(λ)   S A M 1.5 g ( λ ) versus the wavelength are presented.

3.3. Absorption Characteristics versus Thin Film Structure and Microstructure

For the thin films under study, it is reasonable to correlate the results on absorption with changes in structure and microstructure under increasing additional hydrogen at the deposition. Thin films of a-Si:H, μc-Si:H as well as nanocrystalline Si:H under hydrogen incorporation are often reported as mixed-phase silicon [38,39] whereas the exact phase structure apparently influences the optical properties. The samples under study were also found to be mixed-phase materials containing microvoids inducing sample porosity [19].
According to our previous study we expect the microvoids of subnanometer range [20]. In μc-Si:H samples the crystalline grain size of ~9 nm derived from Raman scattering spectra is approximately the same, but the crystalline volume fraction and porosity differ. The transition from a-Si:H to μc-Si:H is accompanied by sharp change of crystalline volume fraction and hydrogen content decrease and therefore also absorption coefficients (Figure 2), Yablonovitch absorptances (Figure 6) and relative absorptances of solar global spectral irradiance (Figure 7) manifest an abrupt change.
Porosity of the samples defined as the void volume fraction ratio was calculated applying refractive indices and crystalline/amorphous phase volume fraction ratio pc/pa from XRD studies upon Bruggeman effective medium theory (Table 1) [19].
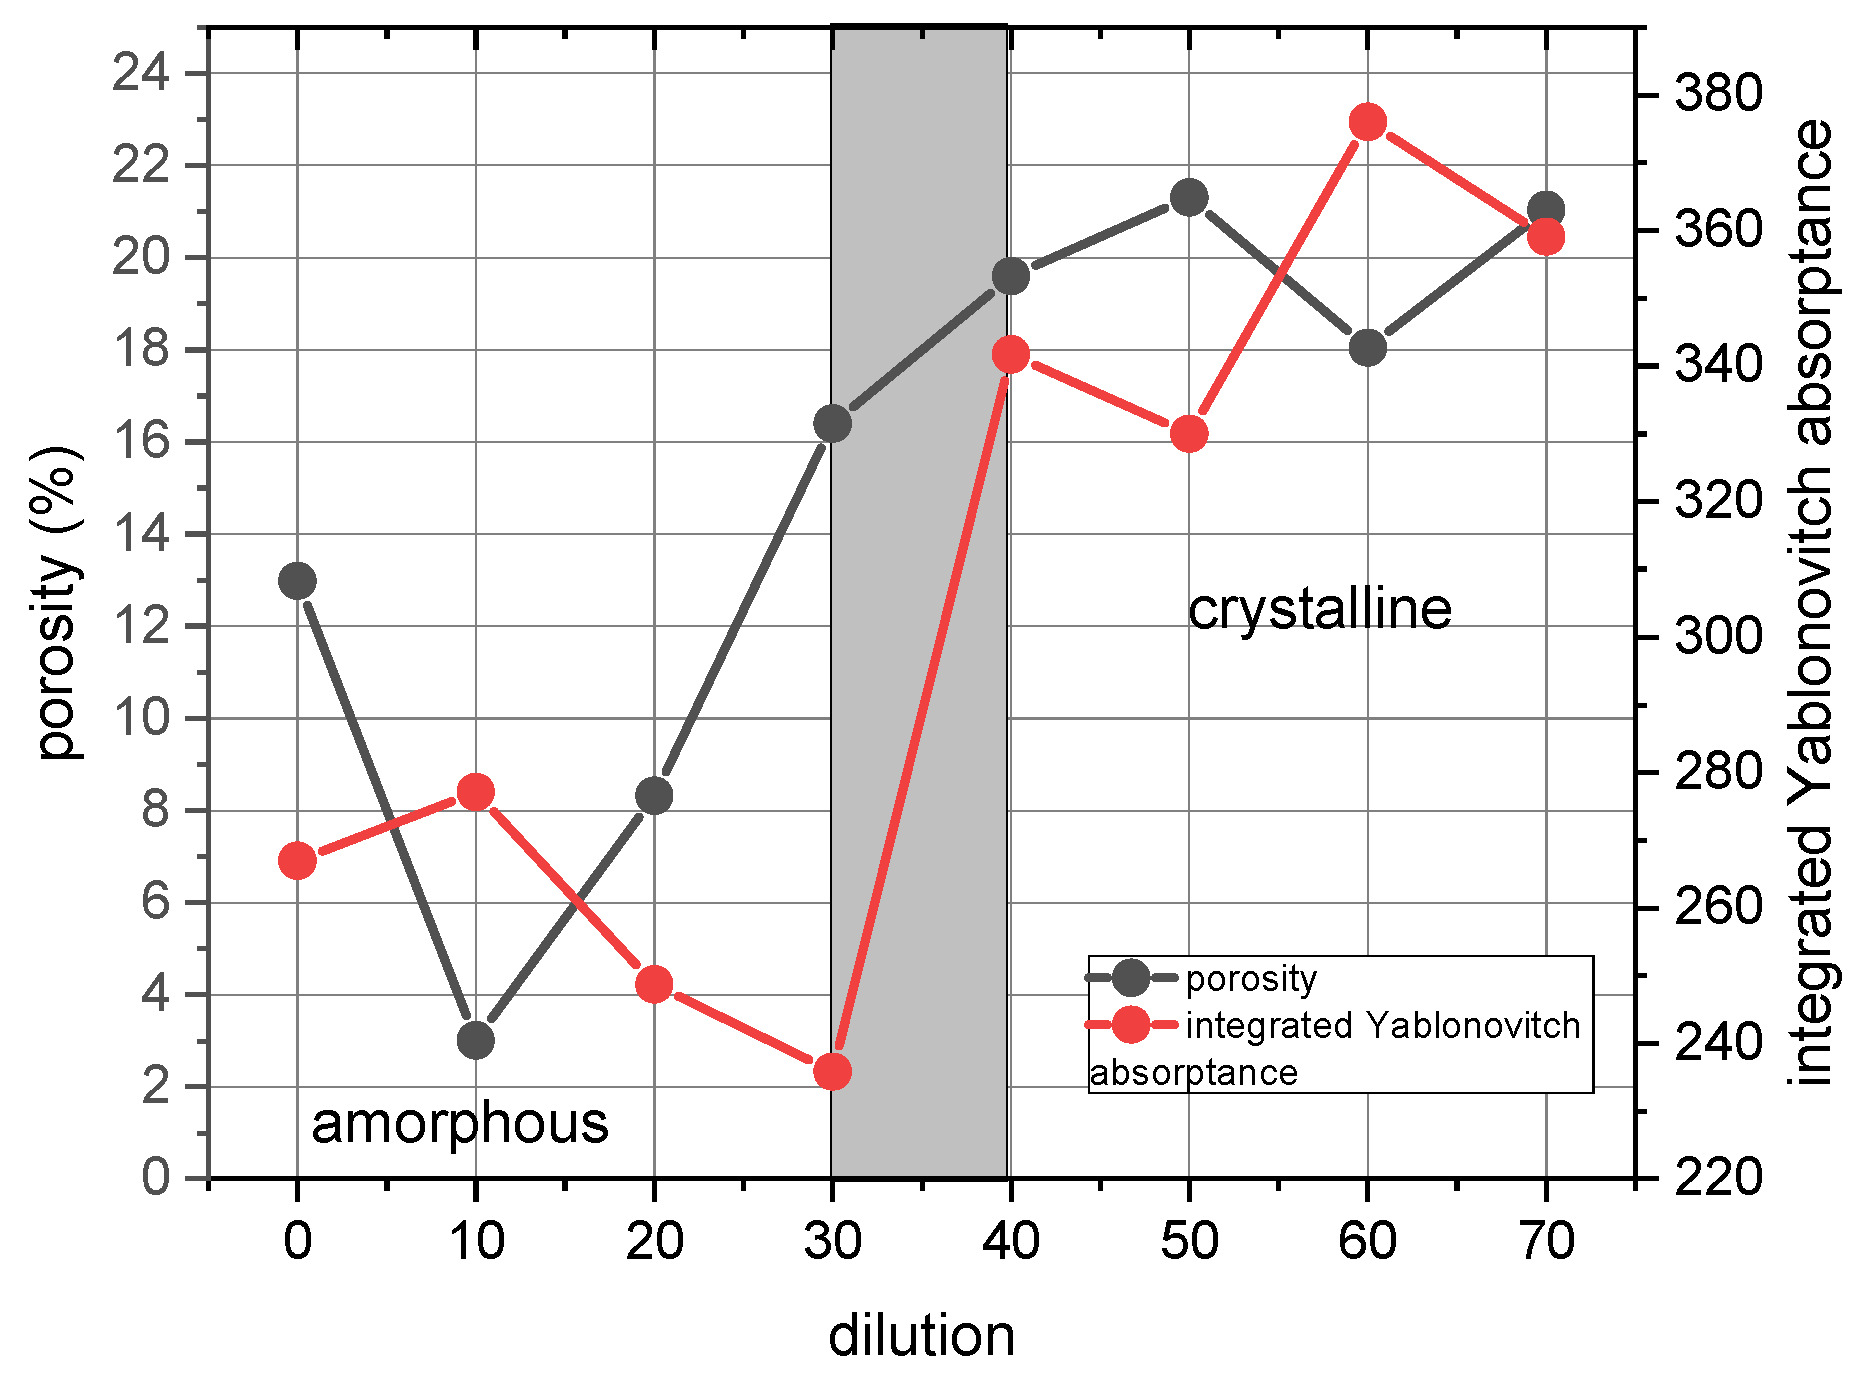
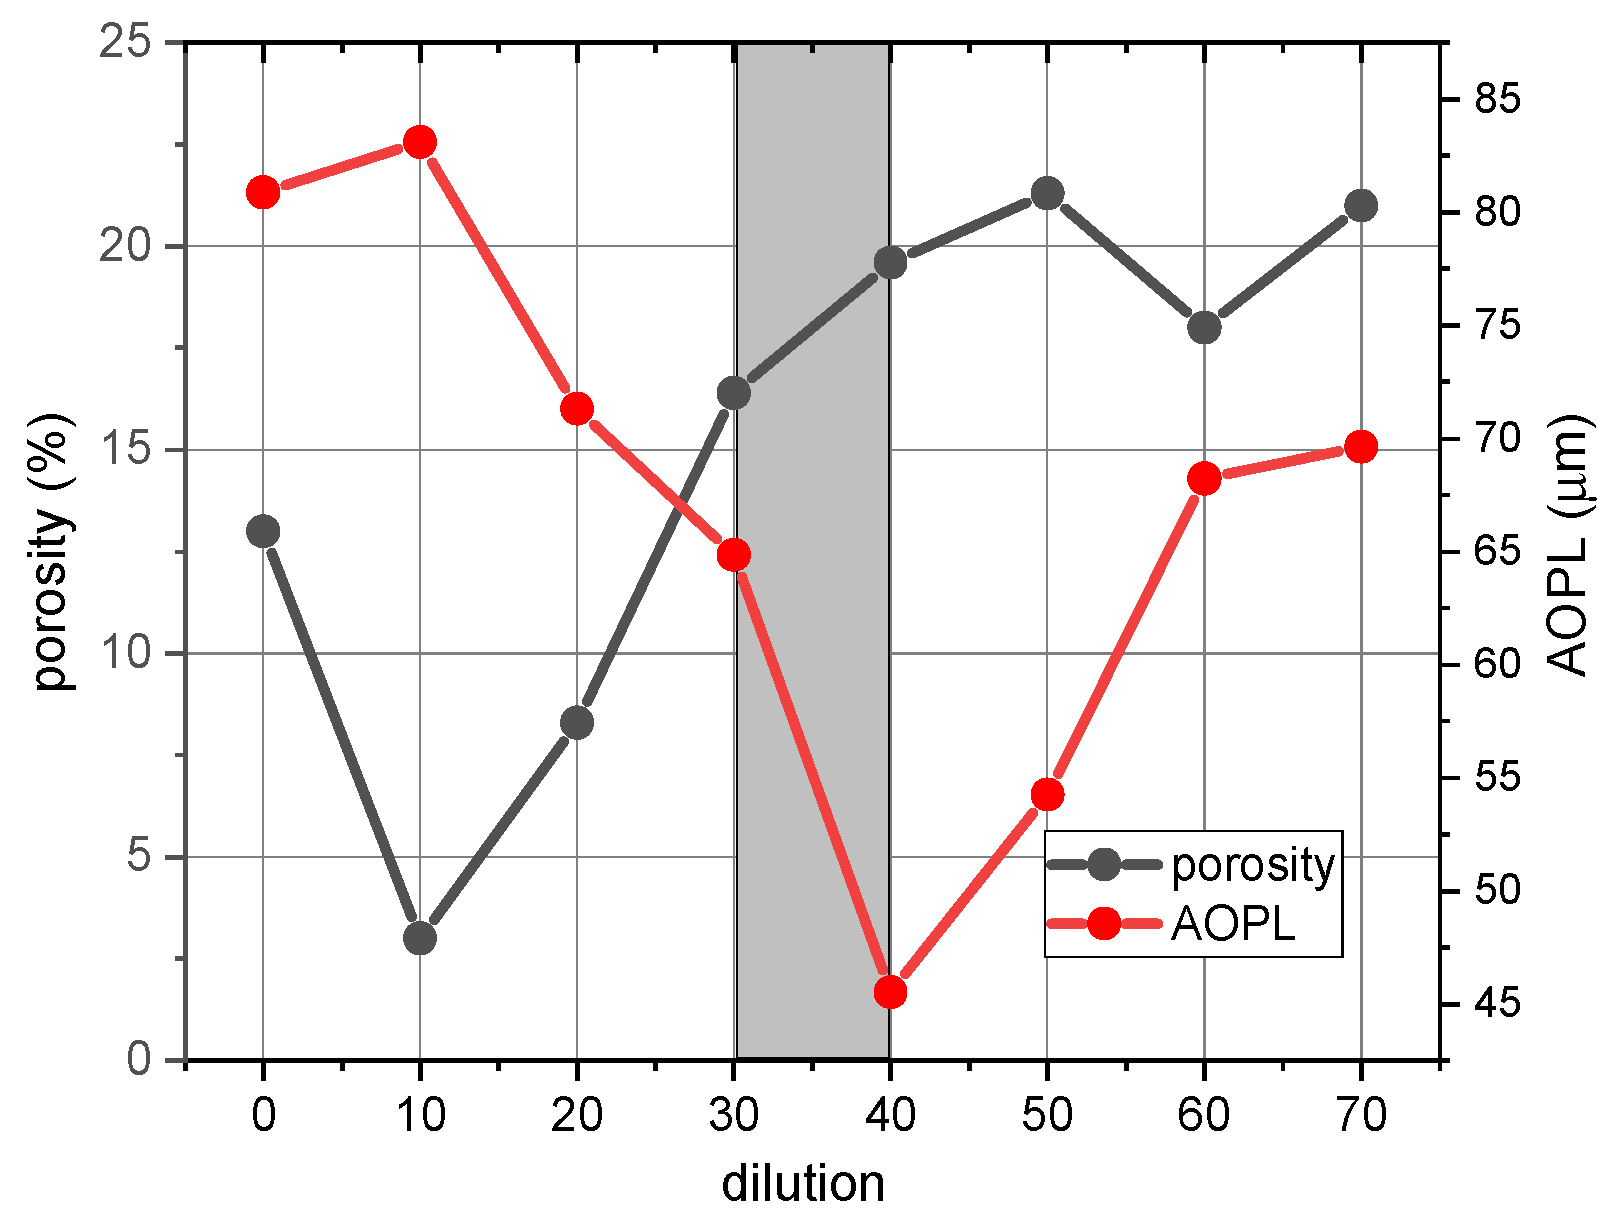
The correlation of the porosity and absorption shows that increased porosity causes the increase of the integrated direct Yablonovitch absorptance AYint after the transition from a-Si:H to μc-Si:H occurs (Figure 8). On the contrary, AOPL shows opposite behavior in and below the transition region of the dilutions R = (30 ÷ 40) (Table 1). AOPL based on the refractive index follows the decreasing refractive index with increasing dilution that is accompanied with increasing porosity (Figure 9). It is the direct evidence that selected absorption metrics must be interpreted in terms of involved fundamental optical properties—refractive indices and/or absorption coefficients.

4. Conclusions

This paper presents the absorption analysis of Si:H thin film PECVD deposited from silane under varied dilution of hydrogen. The investigation is based on the fact that single thin films absorbers can serve as light trapping tools due to coherent reflections at interfaces of an absorbing material with appropriate absorption coefficients and refractive indices. Moreover, thin films offer a simplified design and the absorption response can be engineered by deposition conditions.
The results demonstrate clearly that investigated a-Si:H and μc-Si:H thin films of different optical properties and thickness absorb light in a distinct way. Several absorption metrics were adopted to consider the differences and the correlation with the microstructure. It was found out that the absorption metrics based only on the refractive index such as optical path length are not informative enough and therefore not recommended as decision-makers for absorption-based applications such as photodiodes, sensors, solar cells, etc. According to the results the direct Yablonovitch absorptance should be advised to distinguish between thin film optical absorbers. The classical light trapping limit and the Yablonovitch absorptance show that in μc-Si:H better light trapping can be expected.

Author Contributions

Conceptualization, J.M. and P.Š.; methodology, J.M.; validation, J.M. and M.H.; formal analysis, P.Š. and M.H.; investigation, J.M. and P.Š.; resources, P.Š.; writing—original draft preparation, J.M., P.Š. and M.H.; writing—review and editing, J.M. All authors have read and agreed to the published version of the manuscript.

Funding

This research was funded by the Slovak Research and Development Agency under the project APVV-17-0631.

Conflicts of Interest

The authors declare no conflict of interest.

References

  1. Ra’di, Y.; Simovski, C.R.; Tretyakov, S.A. Thin Perfect Absorbers for Electromagnetic Waves: Theory, Design, and Realizations. Phys. Rev. Appl. 2015, 3, 037001. [Google Scholar] [CrossRef]
  2. Dushaq, G.; Nayfeh, A.; Rasras, M. Tuning the optical properties of RF-PECVD grown μc-Si:H thin films using different hydrogen flow rate. Superlattices Microst. 2017, 107, 172–177. [Google Scholar] [CrossRef] [Green Version]
  3. Li, K.; Haque, S.; Martins, A.; Fortunato, E.; Martins, R.; Mendes, M.J.; Schuster, C.S. Light trapping in solar cells: Simple design rules to maximize absorption. Optica 2020, 7, 1377–1384. [Google Scholar] [CrossRef]
  4. Mohammed, M.A.; Melskens, J.; Stabile, R.; Pagliano, F.; Li, C.; Kessels, W.M.M.; Raz, O. Metastable Refractive Index Manipulation in Hydrogenated Amorphous Silicon for Reconfigurable Photonics. Adv. Opt. Mater. 2020, 8, 1901680. [Google Scholar] [CrossRef]
  5. Khan, A.D.; Rehman, Q.; Khan, A.D.; Subhan, F.E.; Noman, M.; Ahmed, S.; Khan, H.A. Broadband Solar Energy Absorption in Plasmonic Thin-Film Amorphous Silicon Solar Cell. Coatings 2019, 9, 638. [Google Scholar] [CrossRef] [Green Version]
  6. Fonash, S.J. Introduction to Light Trapping in Solar Cell and Photodetector Devices; Elsevier: Amsterdam, The Netherlands, 2015. [Google Scholar]
  7. Abdellatif, S.; Kirah, K.; Ghannam, R.; Khalil, A.S.G.; Anis, W. Enhancing the absorption capabilities of thin-film solar cells using sandwiched light trapping structures. Appl. Opt. 2015, 54, 5534–5541. [Google Scholar] [CrossRef] [PubMed]
  8. Burresi, M.; Pratesi, F.; Riboli, F.; Wiersma, D.S. Complex photonic structures for light harvesting. Adv. Opt. Mater. 2015, 3, 722–743. [Google Scholar] [CrossRef] [PubMed] [Green Version]
  9. Zeman, M.; Isabella, O.; Jäger, K.; Santbergen, R.; Solntsev, S.; Topic, M.; Krc, J. advanced light management approaches for thin-film silicon solar cells. Energy Procedia 2012, 15, 189–199. [Google Scholar] [CrossRef]
  10. Mallick, S.B.; Sergeant, N.P.; Agrawal, M.; Lee, J.-Y.; Peumans, P. Coherent light trapping in thin-film photovoltaics. MRS Bull. 2011, 36, 453–460. [Google Scholar] [CrossRef]
  11. Agrawal, M.; Peumans, P. Broadband optical absorption enhancement through coherent light trapping in thin-film photovoltaic cells. Opt. Express 2008, 16, 5385–5396. [Google Scholar] [CrossRef]
  12. Durmaz, Z.; Husein, S.; Saive, R. Thin silicon interference solar cells for targeted or broadband wavelength absorption enhancement. Opt. Express 2021, 29, 4324–4337. [Google Scholar] [CrossRef] [PubMed]
  13. Müllerová, J.; Šutta, P.; Calta, P.; Netrvalová, M.; Medlín, R. Modifications of effective optical properties of a-Si:H/a-SiNx:H multilayers by means of multilayer design and sublayer thickness. OSA Contin. 2020, 3, 1385–1397. [Google Scholar] [CrossRef]
  14. Mupparapu, R.; Vynck, K.; Svensson, T.; Burresi, M.; Viersma, D.S. Path length enhancement in disordered media for increased absorption. Opt. Express 2015, 23, A1472–A1484. [Google Scholar] [CrossRef] [PubMed] [Green Version]
  15. Kats, M.A.; Capasso, F. Optical absorbers based on strong interference in ultra-thin films. Laser Photonics Rev. 2016, 10, 735–749. [Google Scholar] [CrossRef]
  16. Ajmal, H.M.S.; Khan, F.; Nam, K.; Kim, H.Y.; Kim, S.D. Ultraviolet photodetection based on high-performance Co-plus-Ni doped ZnO nanorods grown by hydrothermal method on transparent plastic substrate. Nanomaterials 2020, 10, 1225. [Google Scholar] [CrossRef] [PubMed]
  17. Ajmal, H.M.S.; Khan, F.; Huda, N.U.; Lee, S.; Nam, K.; Kim, H.Y.; Eom, T.-H.; Kim, S.D. High-performance flexible ultraviolet photodetectors with Ni/Cu-codoped ZnO nanorods grown on PET substrates. Nanomaterials 2019, 9, 1067. [Google Scholar] [CrossRef] [Green Version]
  18. Massiot, I.; Cattoni, A.; Collin, S. Progress and prospects for ultrathin solar cells. Nat. Energy 2020, 5, 959–972. [Google Scholar] [CrossRef]
  19. Müllerová, J.; Šutta, P.; Prušáková, L.; Netrvalová, M. Dispersive and BEMA investigation on optical properties of photovoltaic thin films. SPIE Proc. 2014, 9441, 94411J. [Google Scholar]
  20. Müllerová, J.; Šutta, P.; van Elzakker, G.; Zeman, M.; Mikula, M. Microstructure of hydrogenated silicon thin films prepared from silane diluted with hydrogen. Appl. Surf. Sci. 2008, 254, 3690–3695. [Google Scholar] [CrossRef]
  21. Gope, J.; Kumar, S.; Parashar, A.; Dayal, S.; Rauthan, C.M.S.; Srivastava, P.C. Effect of hydrogen content and bonding environment on mechanical properties of hydrogenated silicon films deposited by high-frequency PECVD process. ISRN Nanomater. 2012, 2012, 429348. [Google Scholar] [CrossRef] [Green Version]
  22. Schmidt, K.J.; Lin, Y.; Beaudoin, M.; Xia, G.; O’Leary, S.K.; Yue, G.; Yan, B. The mean crystallite size within a hydrogenated nanocrystalline silicon based photovoltaic solar cell and its role in determining the corresponding crystalline volume fraction. Can. J. Phys. 2014, 92, 857–861. [Google Scholar] [CrossRef]
  23. Park, Y.-B.; Rhee, Y.-B. Microstructure and initial growth characteristics of the low temperature microcrystalline silicon films on silicon nitride surface. J. Appl. Phys. 2001, 90, 217–221. [Google Scholar] [CrossRef] [Green Version]
  24. Chen, S.-H.; Wang, H.-W.; Chang, T.-W. Absorption coefficient modeling of microcrystalline silicon thin film using Maxwell-Garnett effective medium theory. Opt. Express 2012, 20, A197–A2004. [Google Scholar] [CrossRef] [PubMed]
  25. Poruba, A.; Fejfar, A.; Remes, Z.; Springer, J.; Vanecek, M.; Kocka, J.; Meier, J.; Torres, P.; Shah, A. Optical absorption and light scattering in microcrystalline silicon thin films and solar cells. J. Appl. Phys. 2000, 88, 148–160. [Google Scholar] [CrossRef]
  26. Müllerová, J.; Šutta, P. On some ambiguities of the absorption edge and optical band gaps of amorphous and polycrystalline semiconductors. Commun. Sci. Lett. Univer. Zilina 2018, 19, 9–15. [Google Scholar]
  27. Yablonovitch, E.; Cody, G.D. Intensity enhancement in textured optical sheets for solar cells. IEEE Trans. Electron. Dev. 1982, 29, 300–305. [Google Scholar] [CrossRef]
  28. Andreani, L.C.; Bozzola, A.; Kowalczewski, P.; Liscidini, M.; Redorici, L. Silicon solar cells: Toward the efficiency limits. Adv. Phys. X 2019, 4, 1548305. [Google Scholar] [CrossRef] [Green Version]
  29. Zhao, H.; Schiff, E.A. A Light-trapping metric for solar cells with application to cadmium telluride and silicon. IEEE J. Photovolt. 2015, 5, 487–497. [Google Scholar] [CrossRef] [Green Version]
  30. Saive, R. Light trapping in thin silicon solar cells: A review on fundamentals and technologies. Prog. Photovolt. Res. Appl. 2021, 1–13. [Google Scholar]
  31. Cho, C.; Jeong, S.; Lee, J.-Y. Optical study of thin-film photovoltaic cells with apparent optical path length. J. Opt. 2016, 18, 094001. [Google Scholar] [CrossRef]
  32. Tiedje, T.; Yablonovitch, E.; Cody, G.D.; Brooks, B. Limiting Efficiency of Silicon Solar Cells. IEEE Trans. Electron. Dev. 1984, ED-31, 711–716. [Google Scholar] [CrossRef]
  33. Green, M.A. Lambertian light trapping in textured solar cells and light-emitting diodes: Analytical Solutions. Prog. Photovolt. Res. Appl. 2002, 10, 235–241. [Google Scholar] [CrossRef]
  34. Wang, K.X.; Yu, Z.; Liu, V.; Cui, Y.; Fan, S. Absorption enhancement in ultrathin crystalline silicon solar cells with antireflection and light-trapping nanocone gratings. Nano Lett. 2012, 12, 1616–1619. [Google Scholar] [CrossRef] [PubMed] [Green Version]
  35. Ingenito, A.; Isabella, O.; Zeman, M. Experimental demonstration of 4n2 classical absorption limit in nanotextured ultrathin solar cells with dielectric omnidirectional back reflector. ACS Photonics 2014, 1, 270–278. [Google Scholar] [CrossRef]
  36. Weinstein, L.A.; Hsu, W.-C.; Yerci, S.; Boriskina, S.V.; Chen, G. Enhanced absorption of thin-film photovoltaic cells using optical cavity. J. Opt. 2015, 17, 055901. [Google Scholar] [CrossRef]
  37. ASTM. Standard Tables for Reference Solar Spectral Irradiances, Standard G173-03; American Society for Testing and Materials: Philadelphia, PA, USA, 2012. [Google Scholar]
  38. Müllerová, J.; Prušáková, L.; Netrvalová, M.; Vavruňková, V.; Šutta, P. A study of optical absorption in amorphous hydrogenated silicon thin films of varied thickness. Appl. Surf. Sci. 2010, 256, 5567–5671. [Google Scholar] [CrossRef]
  39. Mazzarella, L.; Morales-Vilches, A.B.; Korte, L.; Schlatmann, R.; Stannowski, B. Versatility of nanocrystalline silicon films: From thin-film to perovskite/c-si tandem solar cell applications. Coatings 2021, 10, 759. [Google Scholar] [CrossRef]
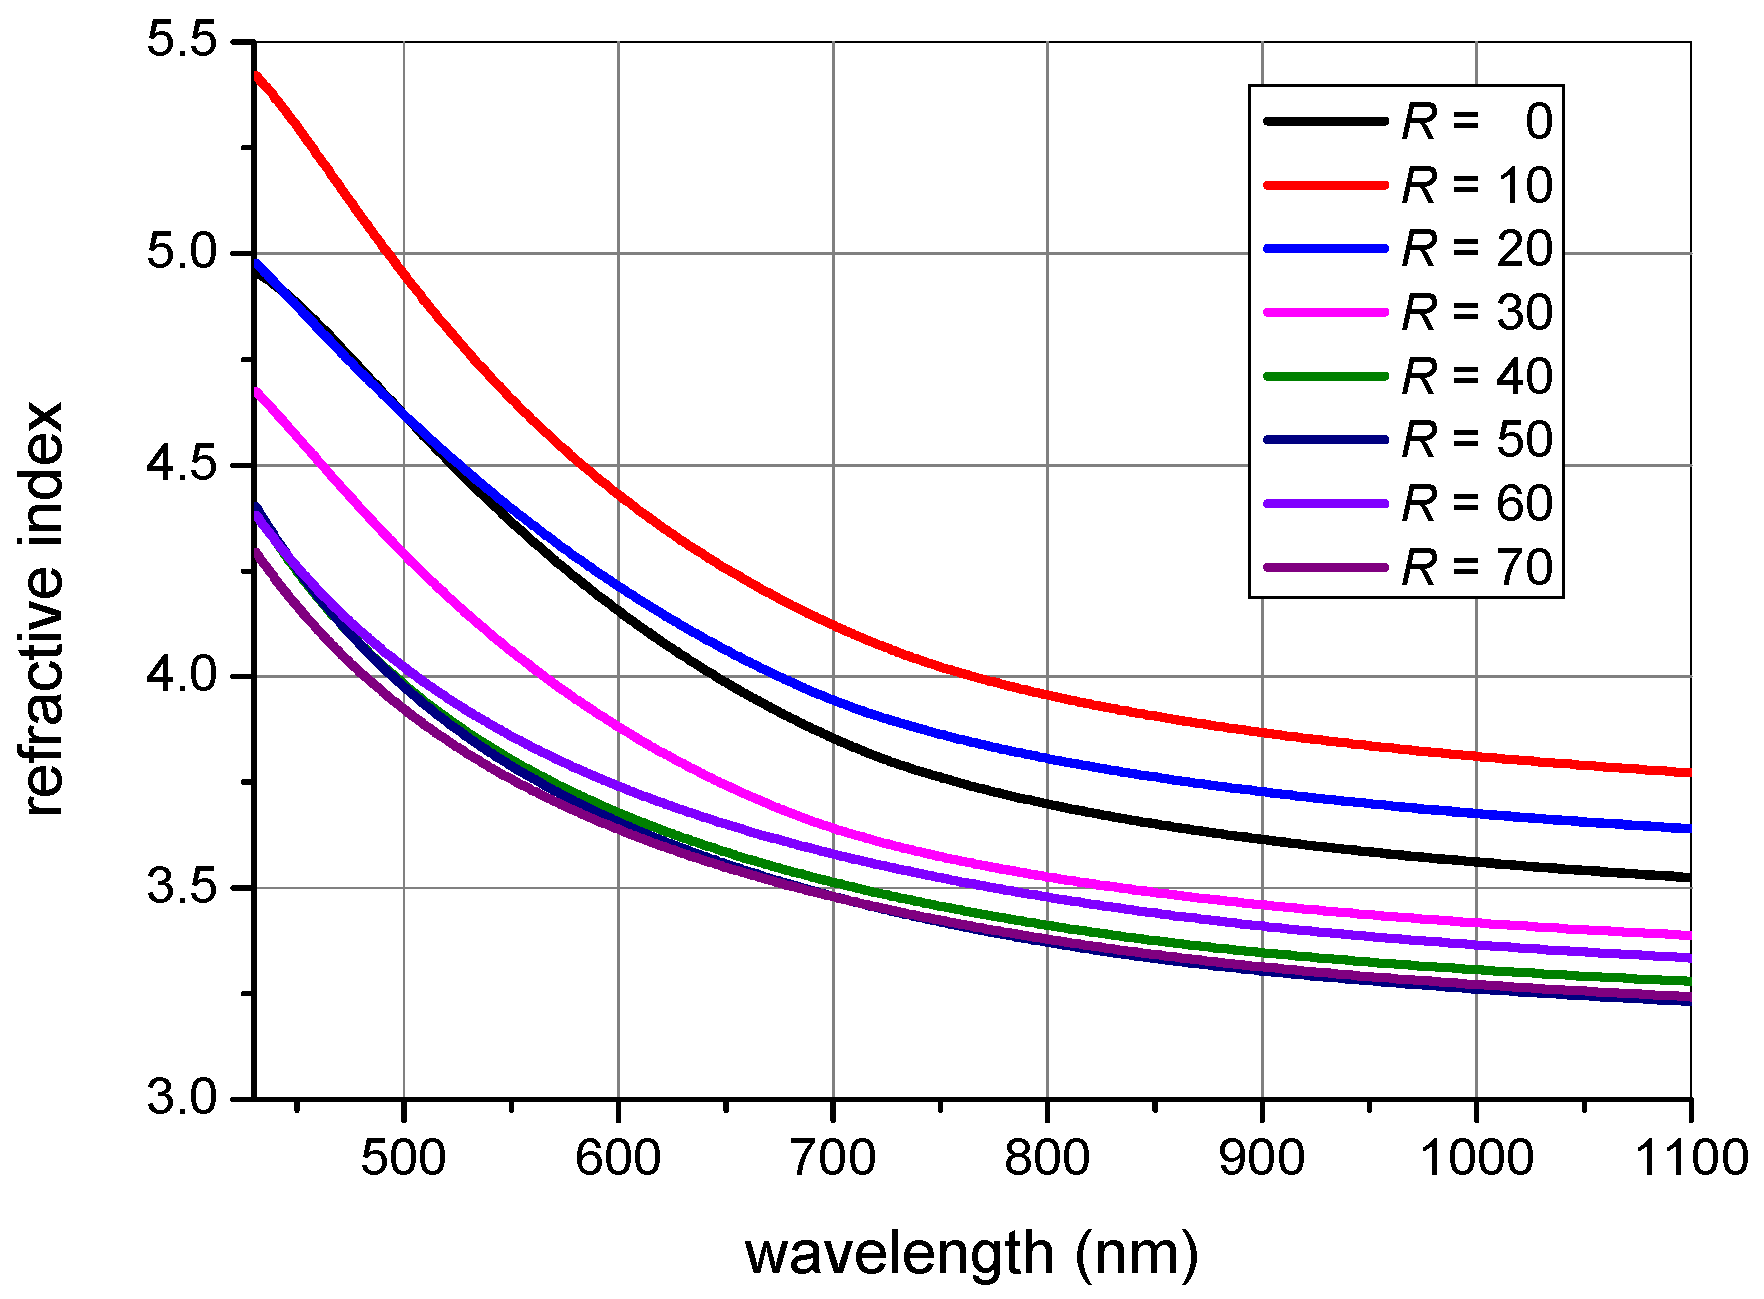
Figure 1. Refractive indices n [19].
Coatings 11 01081 g001
Figure 2. Absorption coefficients α [19].
Coatings 11 01081 g002
Figure 3. Normalized single pass absorption.
Coatings 11 01081 g003
Figure 4. Normalized classical light trapping limit.
Coatings 11 01081 g004
Figure 5. Spectral dependence of normalized apparent OPL (AOPL).
Coatings 11 01081 g005
Figure 6. Direct absorptance according to the Yablonovitch concept (Equation (1)). The line at A ( λ ) = 0.5 indicates the benchmark wavelength.
Coatings 11 01081 g006
Figure 7. Relative absorptance of solar global spectral irradiance AM1.5 (dark cyan).
Coatings 11 01081 g007
Figure 8. Correlated porosity and the integrated direct Yablonovitch absorptance at the dilutions corresponding to the transition a-Si:H –> μc-Si:H (grey rectangle).
Coatings 11 01081 g008
Figure 9. Reverse correlation of porosity and AOPL at the dilutions corresponding to the transition a-Si:H –> μc-Si:H (grey rectangle) and below this region.
Coatings 11 01081 g009
Table 1. Sample characterization: d thickness by UV Vis, pc pa crystalline/amorphous phase volume fraction ratio, p porosity, n refractive index in the long-wavelength limit, all from [19], cH hydrogen concentration according to FTIR, LR crystallite size according to Raman scattering, λb benchmark wavelength, AYint integrated direct Yablonovitch absorptance.
Rd (nm)pc/pa
(%)
p (%) n cH
(at.%)
LR (nm) 4 n 2 n d   ( nm ) λb (nm)AYin (a.u.)
0488013.03.4610.5-47.891689705267
1040003.03.7312.6-55.651492717277
2038508.33.5910.2-51.551382688249
30427016.43.367.8-45.161435675236
403265419.63.272.59.2442.771066791342
504066321.33.222.39.2541.471307778330
604667518.03.321.49.2244.091547827376
705177721.03.232.29.2741.731670809359
Publisher’s Note: MDPI stays neutral with regard to jurisdictional claims in published maps and institutional affiliations.