Article

Nanoengineered Graphene-Reinforced Coating for Leading Edge Protection of Wind Turbine Blades

by
Nicolai Frost-Jensen Johansen
1,
Leon Mishnaevsky, Jr.
1,*,
Arash Dashtkar
2,
Neil A. Williams
2,
Søren Fæster
1,
Alessio Silvello
3,
Irene Garcia Cano
3 and
Homayoun Hadavinia
2
1
Department of Wind Energy, Technical University of Denmark, Risø Campus, 4000 Roskilde, Denmark
2
Department of Mechanical Engineering, Kingston University, London SW15 3DW, UK
3
Thermal Spray Center (CPT), Universitat de Barcelona, Marti i Franques 1, 08028 Barcelona, Spain
*
Author to whom correspondence should be addressed.
Coatings 2021, 11(9), 1104; https://doi.org/10.3390/coatings11091104
Submission received: 10 August 2021 / Revised: 6 September 2021 / Accepted: 8 September 2021 / Published: 13 September 2021
(This article belongs to the Special Issue Wind Turbine Blade Coatings: New Advances, Application and Challenges)

Abstract

:
Possibilities of the development of new anti-erosion coatings for wind turbine blade surface protection on the basis of nanoengineered polymers are explored. Coatings with graphene and hybrid nanoreinforcements are tested for their anti-erosion performance, using the single point impact fatigue testing (SPIFT) methodology. It is demonstrated that graphene and hybrid (graphene/silica) reinforced polymer coatings can provide better erosion protection with lifetimes up to 13 times longer than non-reinforced polyurethanes. Thermal effects and energy dissipation during the repeated soft impacts on the blade surface are discussed.

1. Introduction

Global wind energy generation has expanded greatly in the last few years. An even larger expansion in wind energy production, particularly offshore, is expected in the next ten years.
Offshore wind turbines are subject to higher wind and environmental loads than onshore turbines; this includes exposure to salt-water aerosols. According to Dao et al. [1], the failure rate per wind turbine per year is four times higher for blades and hubs of offshore wind turbines than for the onshore equivalents. In addition, the costs of the maintenance and repair of offshore wind turbines are much higher than for onshore turbines.
Leading Edge Erosion (LEE) in wind turbine blades primarily is caused by rain, hail, and air born particles causing major performance deterioration such as loss of power generation and additional maintenance costs [2]. According to Mishnaevsky and Thomsen [3], the overall cost of repairing minor failures (largely due to LEE) is greater than that for major defects such as structure failure. LEE is a major problem for large and extra-large wind turbines with tip speeds of over 80 m/s. To protect wind turbine blades from erosion, new highly protective coatings are required. A promising area in the development of protective coatings is the creation of internal structures within the coating material, which can reflect or scatter the stress waves arising from raindrop impact.
In this paper, the potential of developing new anti-erosion coatings with nanoparticle reinforcement for wind turbine blade surface protection is demonstrated. The new types of coatings are based on polyurethanes reinforced with graphene or hybrid nanoscale particles. The results of erosion testing of the new coatings using a single point impact fatigue testing (SPIFT) approach [4] are presented. Thermal effects during blade erosion are discussed.

2. Possibilities of Structural Modifications of Anti-Erosion Coatings: State of the Art Review

The erosion of coatings is caused by multiple random impacts (by rain droplet, hail, or other particles), which cause deformation and stress wave propagation in the coatings, which in turn leads to damage [2,5]. To prevent or delay the erosion of wind turbine blades, the development of highly erosion resistant coatings is desirable. As suggested by Mishnaevsky [5], there are several approaches to the design and development of coatings, such as: increasing the damping properties of the coating materials, using multilayered coatings and developing reinforced coatings with internal structures.
Different physical mechanisms can be used to prevent degradation of blade protective coatings, for example, by waves dissipation, and by scattering on inclusions, especially at high frequencies. The multiple scattering of waves on particles embedded in the coatings can lead to the attenuation of coherent waves. The energy of the coherent waves is converted into divergent waves through reflection and refraction on the inclusions. Several computational models have been developed to simulate the wave scattering on the particles. These have used scattered field expressions, quasi-crystalline approximation, causal differentiation, and Kramers-Kronig expressions [5,6,7,8]. It is shown that nanoscale particles in polymers (like carbon nanotubes or graphene) form percolating networks [9,10,11], which affect their interaction with stress waves.

Nanoscale Reinforcements in Anti-Erosion Coatings: State of the Art

Particle (microscale and nanoscale) reinforcements in polymer coatings have been studied widely. Valaker et al. [12] developed sprayed coatings with FunzioNano® (commercially developed) and SiC particle reinforcement. SiC-reinforced coatings exhibited six to ten times less material loss than industrial coatings. Erosion resistance clearly increases with increasing nanoparticle content for both FunzioNano and SiC reinforcements. Armada et al. [13] studied epoxy coatings modified with commercial silica nanoparticles functionalized with a polysiloxane, and with FunzioNano particles. The latter showed the better erosion resistance. Gou et al. [14] developed carbon nanofiber paper-based coatings with embedded nickel nanostrands, which showed a 40–100% increase in erosion resistance. Fei et al. [15] developed multifunctional carbon nanofiber (CNF) paper-based nanocomposite coatings with grafted Polyhedral Oligomeric Silsesquioxanes (POSS). The damping ratio of the nanocomposite increased by 300% compared to the baseline composite, highlighting a significant improvement in the vibration damping properties. Diblíková, et al. [16] developed epoxy coatings with Multi-Walled Carbon NanoTube (MWCNT) particles, and observed that the abrasion resistance of coatings increased with increasing carbon nanotube content. Grundwürmer et al. [17] synthesized organic-inorganic hybrid coatings using sol-gel technology with the addition of ZrO2 nanoparticles. They observed that sol-gel coatings ensured the same protection as commercial protective coatings with films that were 23 times thinner. Hintze-Bruening and Leroux [18] developed textured composite coatings with platelets (LDH—layered double hydroxides) aligned parallel to the substrate surface. These demonstrated both high toughness and high strength. Peng et al. [19], based on the Ph.D. work of Limmack [20], tested coatings made from nanodiamond-reinforced polyurethane with a sand blaster which showed less material loss, particularly with oblique impacts. Their work showed the nanodiamond-modified PU has potential for protecting against hard-particle erosion. Malaki et al. [21] observed a 29% improvement in the erosion resistance of polyurethane coatings with the addition of nano-silica. It has been demonstrated [22] that disc-shaped and snake fiber-shaped reinforcements in anti-erosion coatings improve the damping properties of coatings. In summary, it can be seen that particle or platelet reinforced polymers exhibit greater resistance to erosion.
As with other applications of nanoengineering, the effect of nanomodification strongly depends on: the manufacture and distribution of the nanoparticles as well as their functionalization or surface modification [23,24,25,26]. Gohardani et al. [27] noted no improvement in erosion resistance of resins reinforced with CNT when tested with multiple liquid impacts. Wojdyla et al. [28] discussed in their review the potential of new nanostructured coatings, with anti-fouling properties, and noted that functionalized banostructured silica based coatings have a great potential. According to Barkoula and Karger-Kocsis [29], pure thermoplastic matrices show better erosion resistance compared to those reinforced with brittle fibers, especially at higher impingement angles. They also found that brittle inclusions reduce the erosion resistance of ductile thermoplastic polymers. The use of sol-gel technology for manufacturing organic-inorganic hybrid coatings with nanoparticle reinforcements has been reported [25]. These sol-gel coatings are very thin (up to 10μm) and exhibit the same protection as coatings 20 times thicker [17,26]. The potential of graphene reinforcement of polymer coatings for improving resistance to erosion has been reported [30].
An interesting aspect of nanoengineering of materials is the potential of hybrid nano-reinforcements for improving material properties [31,32]. In several studies, it was observed that hybrid nano-reinforcements ensured a more homogeneous spatial distribution of particles by preventing nanoparticle clustering. Prasad et al. [33] studied a combination of nanodiamond particles with Carbon NanoTubes (CNT) and graphene. Enhancement in hardness and elastic modulus of up to 25% were observed. Li et al. [34] studied polymers with Graphene NanoParticles (GNP) + CNTs, and observed an increase in the tensile modulus, which was attributed to better dispersion. Yue et al. [35] studied epoxy composites with various proportions of CNT/GNP reinforcements. They reported increases in the flexural modulus and strength. This was attributed to better dispersion of the fillers and particles forming networks. Chatterjee et al. [36] observed an interconnected 3D network of nanofiller in CNT/GNP hybrid composites.
In summary, microscale and nanoscale particle reinforcements have the potential to improve the erosion resistance of polymer coatings. Combining several types of nano-reinforcements can lead to better dispersion of particles, and in some cases to the formation of nanoparticle networks.
Therefore, the hypothesis of this work is that nanoparticles (graphene) distributed in anti-erosion polymer coatings may increase erosion resistance. Further, it is proposed that hybrid nanoparticle reinforcement of polymer coatings will give additional erosion resistance. Figure 1 shows a schema of stress wave reflection and scattering in the coating reinforced by graphene and hybrid particles.

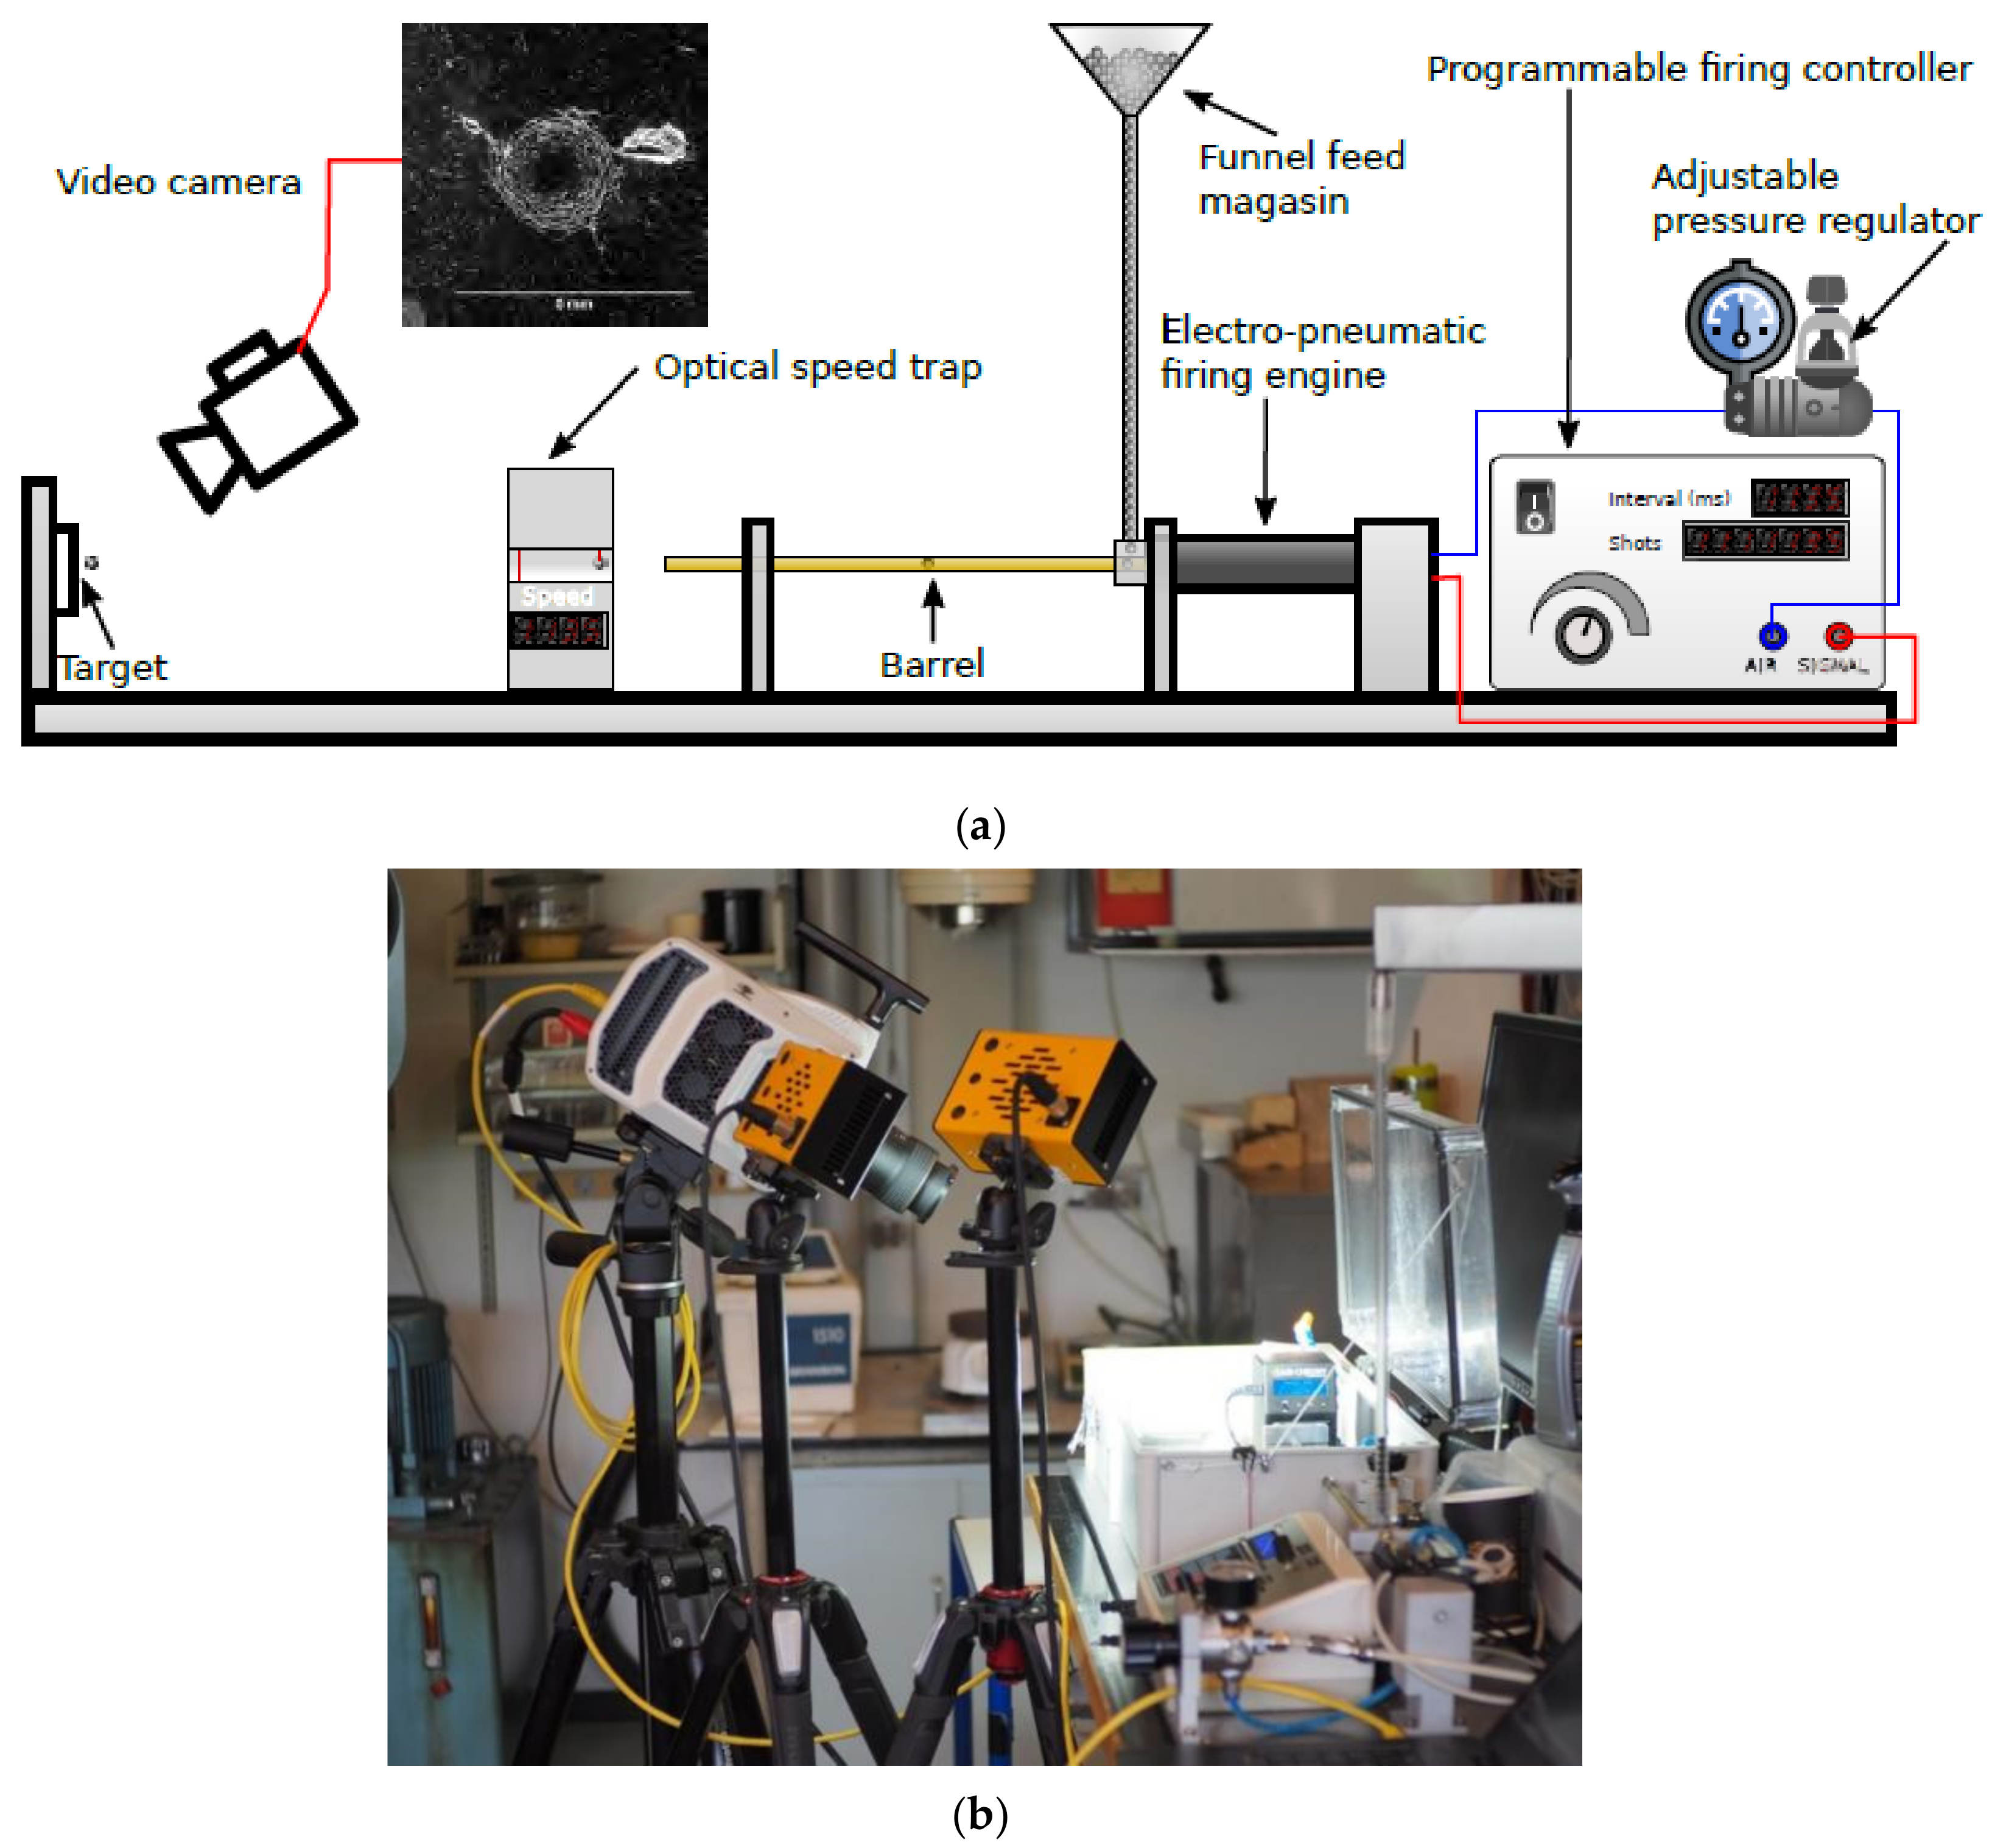
3. Desktop Erosion Testing Technology: Single Point Impact Fatigue Tester (SPIFT)

3.1. Erosion Testing by Single Point Impact Fatigue Tester (SPIFT)

Mechanisms of erosion of wind turbine blades have been investigated in several studies [37,38], see also reviews in [5,39]. It was demonstrated in these studies, that the erosion of wind turbine blades is caused by fatigue, and is initiated near voids or other small defects.
There are several approaches of testing wind turbine blade erosion, including impacting continuous water jets, water jet provoked impacting droplets, impacting water jet slugs, and moving samples impacting falling water droplets (see detailed review in [40]).
The performance of anti-erosion coatings is commonly tested using a whirling arm Rain Erosion Tester (RET), among whirling arm testers is the R&D A/S styled tester, which is covered in [41,42]. Depending on coating performance, relative impacts speed can be increased up to 173 m/s. Typical tip speeds for testing is about 125 m/s, but accelerated testing at 150 m/s is also not uncommon for current generation coatings [38], and better coatings might require the full 173 m/s in order to provoke failure in a reasonable testing time frame.
Although whirling arm RET probably is the best practical analogue to actual rain, it does pose a number of challenges in regards to coating development, and understanding fatigue failure. In order to better understand the mechanisms of coating erosion, the Single Point Impact Fatigue Testing (SPIFT) approach has been proposed [4].
The inspiration for the initial design of the SPIFT came from the work of Prayogo [43], who cited the paper by Adler [44] on hyper-sonic rain erosion. Adler noted that nylon polymer pellets provided better results compared to systems using water jets [45]. In the SPIFT, the hard nylon ball was substituted with nitrile rubber balls: diameter: 6 mm, shore A hardness: 60, mass: 1.43 × 10⁻⁴ kg SD: 7.59 × 10⁻⁷ kg, density: 1263 kg/m3, as the rubber provides a more compliant impact. The goal is to provide a loading closer to that of a water droplet, when compared to a hard nylon ball.
The aim of the SPIFT is to investigate high strain rate and high strain fatigue properties. It is the prevailing assumption that fatigue resulting from droplet impacts is the driving mechanism behind erosion [46,47,48].
Conducting this type of fatigue testing on conventional cyclical fatigue setup is not feasible for soft viscoelastic materials like PU, as discussed by William D. Weigel’s report [49] where an aperture similar to the SPIFT was proposed, in order to be able to test the fatigue properties of viscoelastic materials under loadings similar to droplet impacts. The controlled impacts rate of discreet impacts can be used to account for the viscoelastic heating effect, which was shown to dramatically reduce fatigue life.
The SPIFT also differs from most conventional RET’s in that the impacts are not distributed over the surface, but repeated on a single point. This means that damage growth can be evaluated, as the loading history is known [50].
Figure 2a shows a diagram of a SPIFT testing setup. In the SPIFT test, the rubber balls enter the chamber and are then loaded into the barrel. The release of compressed air accelerates the rubber ball through the barrel. The rubber ball’s exit velocity is recorded by an optical speed trap placed 200 mm in front of the testing sample before it hits the target. The applied air pressure controls the ball velocity. The SPIFT device can shoot up to five rubber balls per second with velocities up to 170 m/s. The time interval between shots and the number of shots in a series are controlled by a programmable microprocessor. The output from the microprocessor triggers the VALKEN V12 built-in control electronics, which in turn controls the electro-pneumatic valves. This approach retains the built-in safety features, which are released once the lid of the test chamber is closed.
As the primary means of damage detection, high-resolution digital video images were captured at a 3.1 Megapixel (2048 × 1534 @10 Hz) with an AM7915MZTL long working distance USB microscope from Dino-lite (Fino-Lite, Vodskov, Denmark). Using a working distance of 120 mm, a 18 × 13 mm2 field of view is obtained, resulting in 13.5 pixels mm−2 [51].
High speed imaging was performed using a Phantom v2512 fast (AMETEK Inc., Berwyn, PA, USA)., operating at 380,000 fps, and a tele macro lens resulting in a resolution of 0.1 mm/pixel.

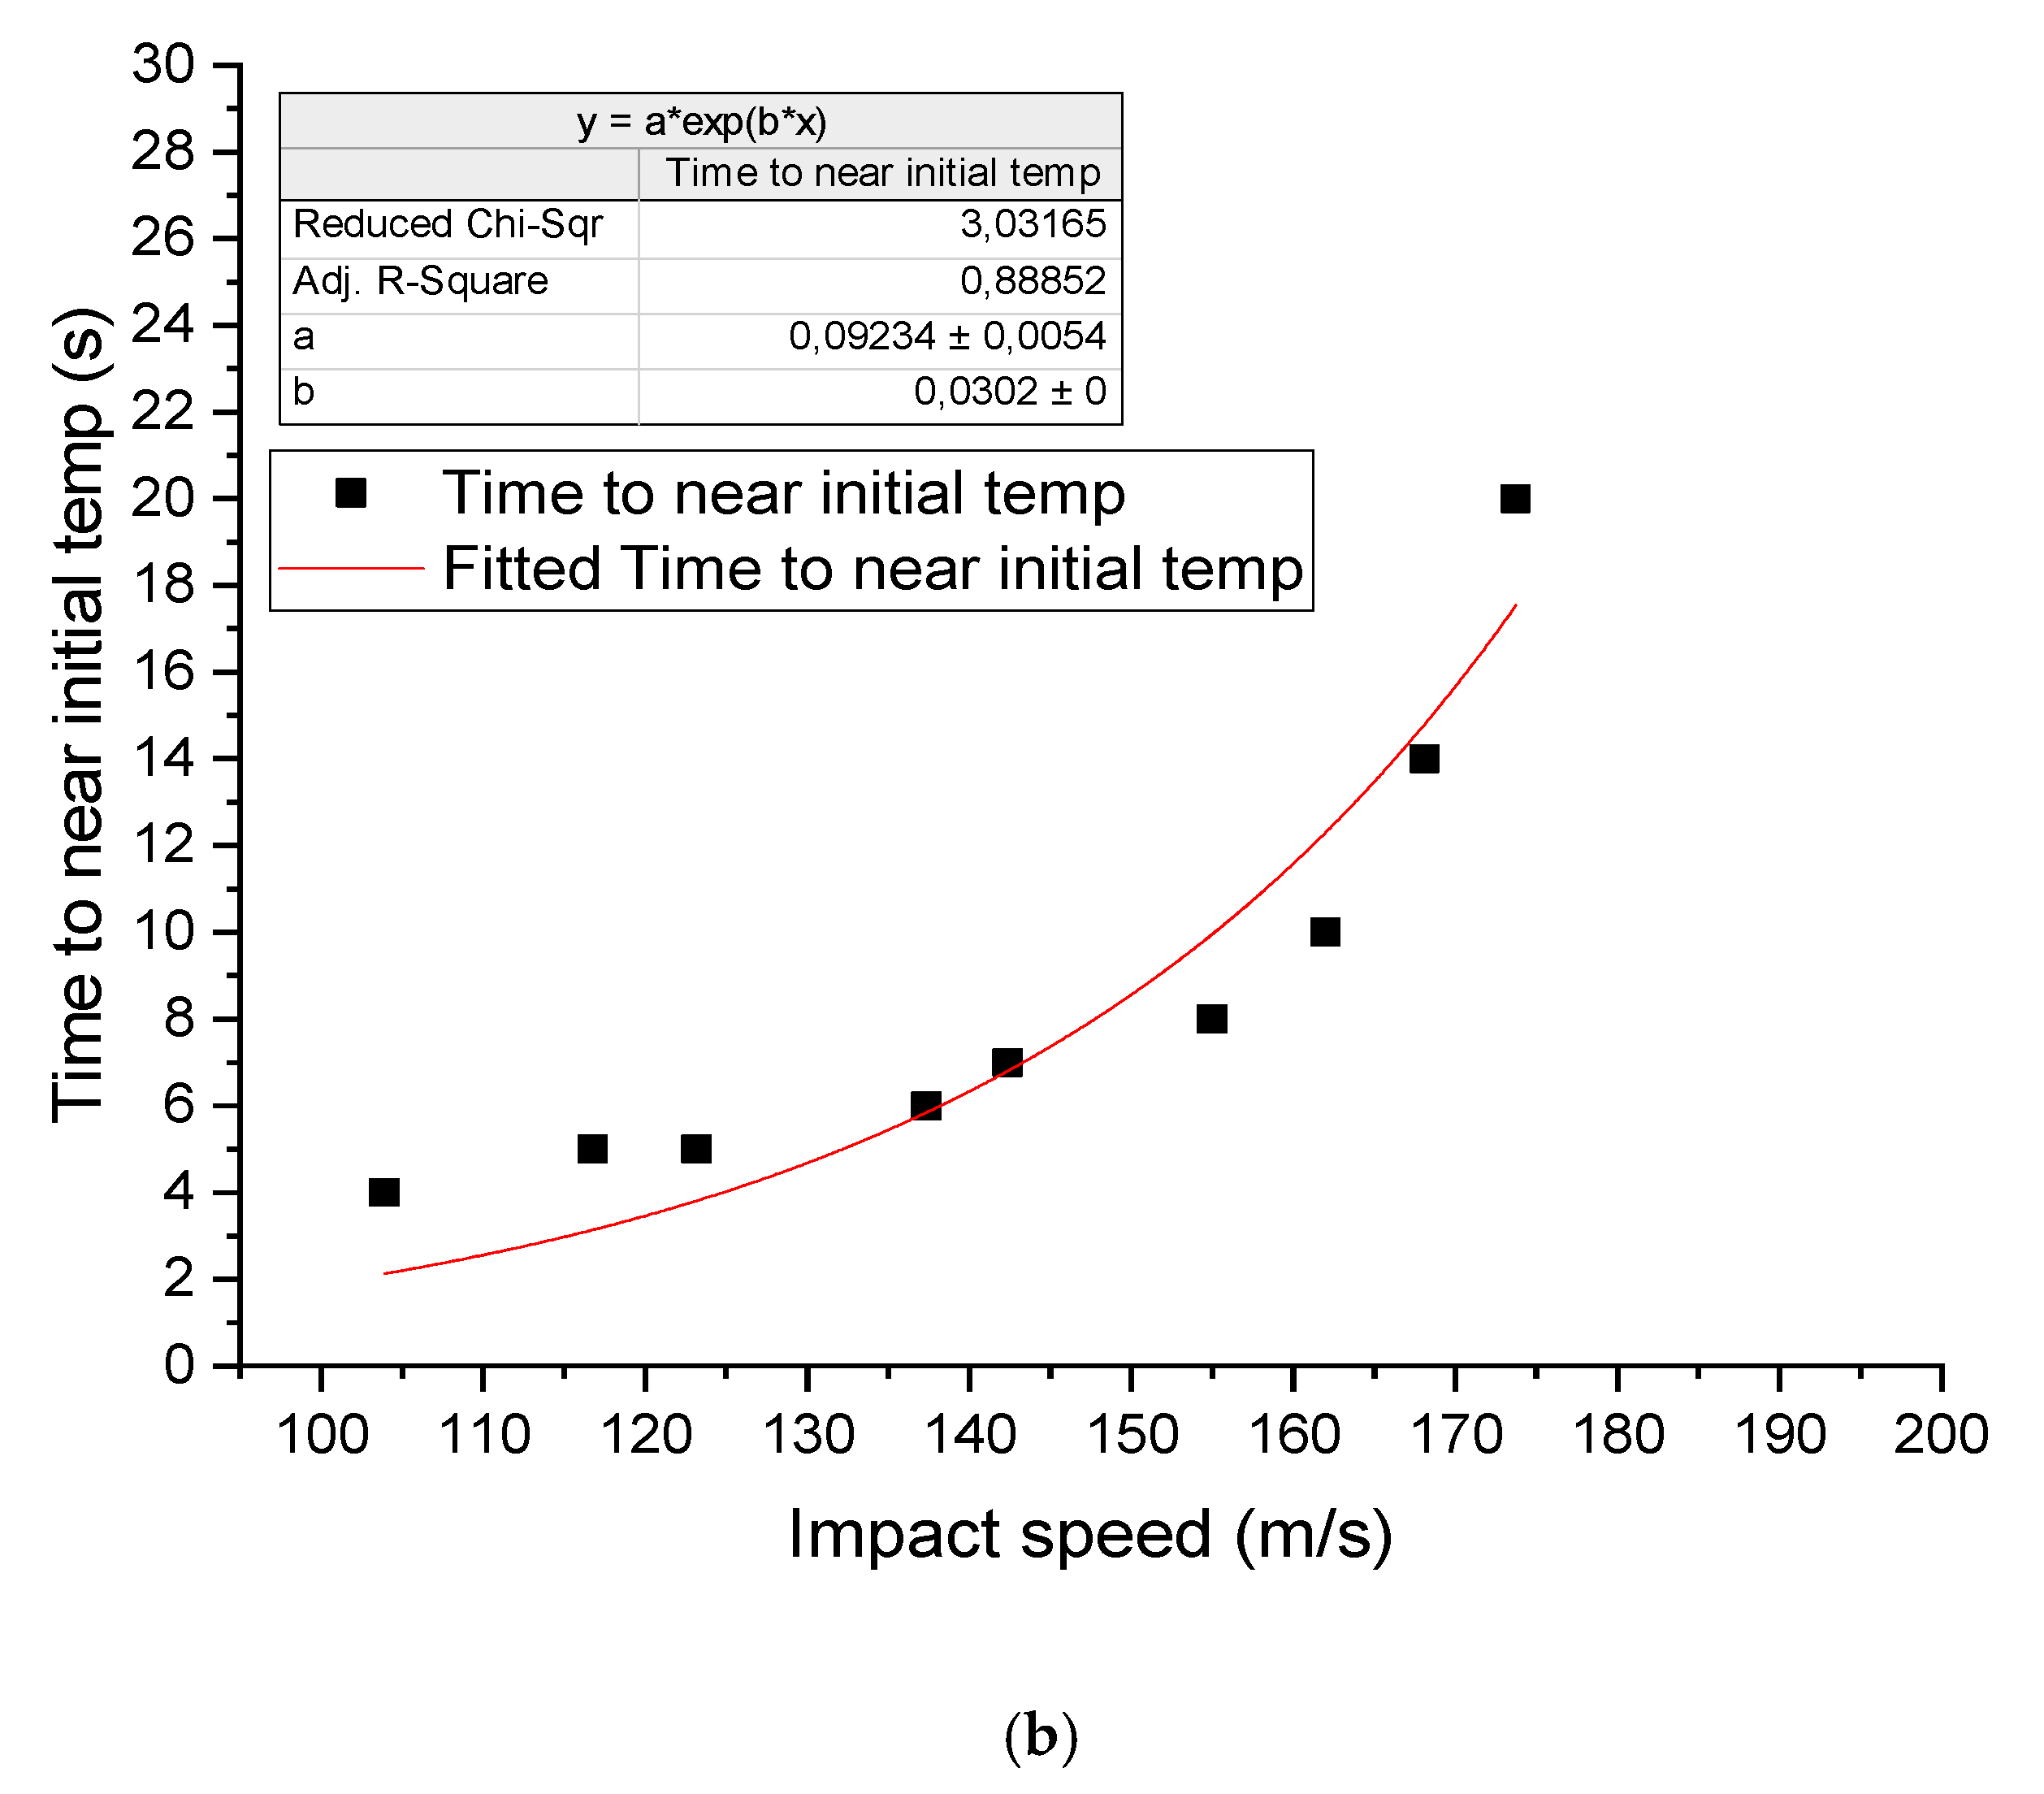
3.2. Investigation of Thermal Effects in Erosion

The protective properties of coatings depend on the damping properties of the polymer [5,52], and the degree of energy dissipation in the polymer coating after the impact of rain droplets. The dissipated energy is distributed as thermal energy and deformation of the polymer chains. To investigate these effects, thermographic analysis was carried out during SPIFT testing. Figure 3 shows the arrangement of the IR thermography camera in the test setup. The horizontal dimension of the image is calibrated and adjusted for parallax error. The camera (Optris Pi 640) records at 120 Hz with a 0.1 °C temperature resolution.
IR thermography imaging allows the measurement of the time taken for the sample to cool down between impacts as a function of impact speed. It also allows the measurement of changes in temperature as a function of the impact speed. This can help identify differences in dampening between the coatings.
Further, the thermograph is used to analyze how the absorbed mechanical energy is distributed in the coating.
A central feature of SPIFT is the ability to control the impact heating phenomenon [50], enabling the determination of a minimum cool downtime to help continuous operation without heat buildup.
The time–temperature plot in Figure 4a shows the average temperature of the measurement area as a function of time for an unmodified polyurethane (PU) coating. This was used to measure the time needed for the sample to be within 0.2–0.5 °C of the initial, before impact, temperature, as this represents dissipation of more than 90% of the thermal energy. There will be some temperature increase in the impacts zone during testing, but with this approach, it is kept bellow 1 °C.
Based on these data, a control curve was constructed by fitting a power function to the cool-down times as seen in Figure 4b.
t v = 0.09234   e 0.0302 v
where t is the cool-down time and v is the impact velocity. Using this, the testing time can be minimized, while avoiding the problem of heat accumulation in the sample.

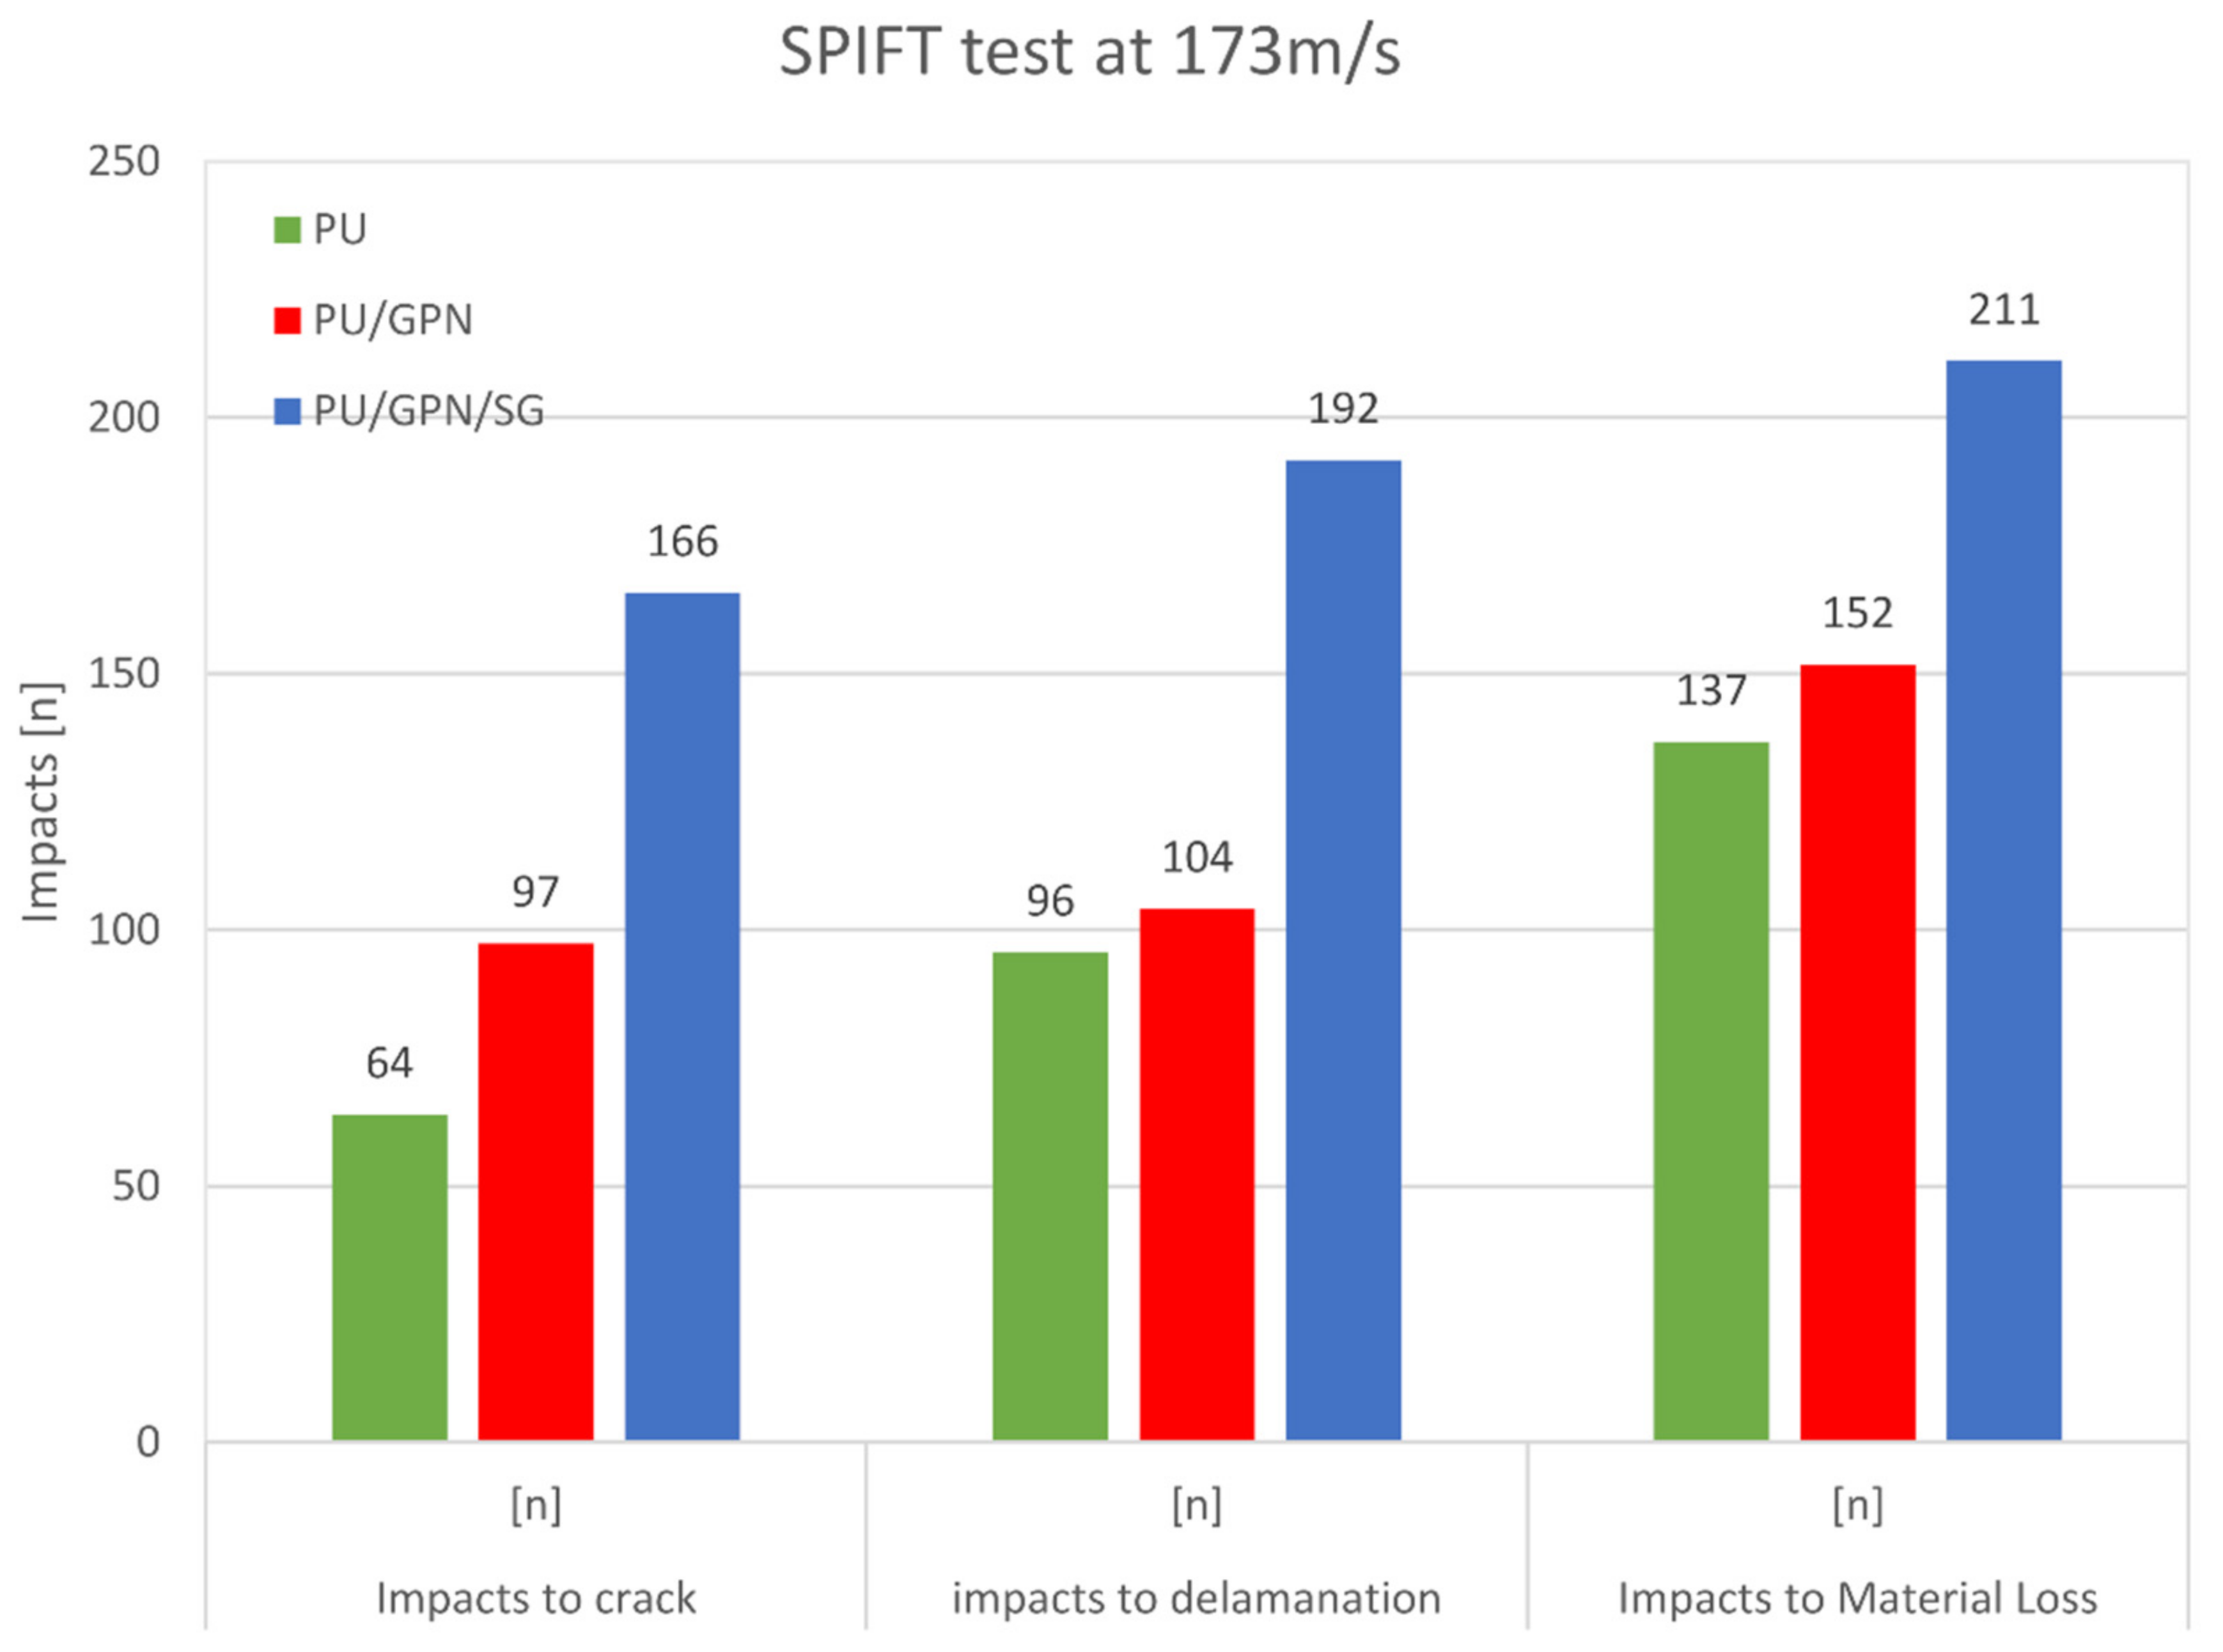
4. Performance of Nanoengineered Coatings: SPIFT Testing

In order to explore the effect of graphene and hybrid nanoparticles on erosion resistance of coatings, a series of SPIFT tests were carried out.

4.1. Preparation of Nanoengineered Polyurethane Coatings for Blades

Three polyurethane-based coatings were investigated as Leading Edge (LE) protective coatings: pure polyurethane (PU), graphene modified polyurethane (PU + GNP), and Graphene + Sol gel-modified polyurethane (PU + GNP + SG). A square glass fiber reinforced laminate with dimensions 40 mm × 40 mm × 5 mm was used as a substrate. An aluminum mold was machined for casting with a 1 mm thick layer of the above coatings (see Figure 5). The film was bonded to the GFRP substrate with 1 mm thick Epoxy DP 110 sublayer. The thickness of the adhesive sublayer is controlled by placing 1 mm diameter wires under the top coating. During curing, a 5 kg weight was placed on the top of an aluminum plate on the samples, to make sure that the adhesive is distributed homogeneously all over the GFRP substrate.
The two-component polyurethane system BAYTEC® 9005 60A MF Polyol with viscosity of 800–1600 mPa.s and specific gravity of 1.01–1.04 and the DESMODUR® B9 M10 polyisocyanate crosslinkers with viscosity of 120–200 mPa s and specific gravity of 1.21–1.23 were supplied by Covestro. The mixing ratio by weight of polyol to polyisocyanates was 100:37. Curing was done at room temperature.
The as-received functionalized graphene nanoplatelets HDPlas™ f-GNP having carboxyl groups at their surfaces created by a “split plasma” treatment in oxygen were supplied by Haydale Ltd., Wales, UK. The plasma functionalization is a low temperature, low energy, dry process, with no effluent disposal, and is benign to the structure of the raw material. The functional groups are only attached to the edges, dislocation sites, and defects. The lateral dimension of GNP is between 0.3–5 μm, with typical individual f-GNP (hereafter it is called GNP for brevity) thickness of about 0.34–0.5 nm, bulk density of 215 kg/m3 and specific surface area of ~25 m2/g. The graphene sheets have an aspect ratio of ~85.
Hydrophobic silica-based sol-gel P029™ was supplied by Sol-Gel Materials & Applications Ltd. (SGAM, Gillingham, UK), it contains 15 wt % silicon.
Polyurethane/graphene composites were prepared via in-situ polymerization methods. The in-situ polymerization of PU/GNPs was carried out by directly mixing f-GNP (0.5 wt %) with polyol (100 g) at room temperature (25 °C) using a homogenizer at 8000 rpm for 18 min. Subsequently, DESMODUR® B9 M10 polyisocyanates (37 g) were added to the mixture and stirred for 1 min to give a mixture ready for molding into a top coating. The functionalized graphenes act as chemical crosslinkers in the synthesis of the polyurethane composite.
The in-situ polymerization of PU/GNP + SG was carried out by directly mixing hydrophobic silica-based solution SG (1 wt %) with DESMODUR® B9 M10 polyisocyanates (44 g). This mixture was then added to a mixture of polyol + GNP (same preparation method as above) and stirred for 1 min using a homogenizer at 8000 rpm.
Further details about the mechanical properties of the nanoengineered polymer coatings have been published elsewhere [53].

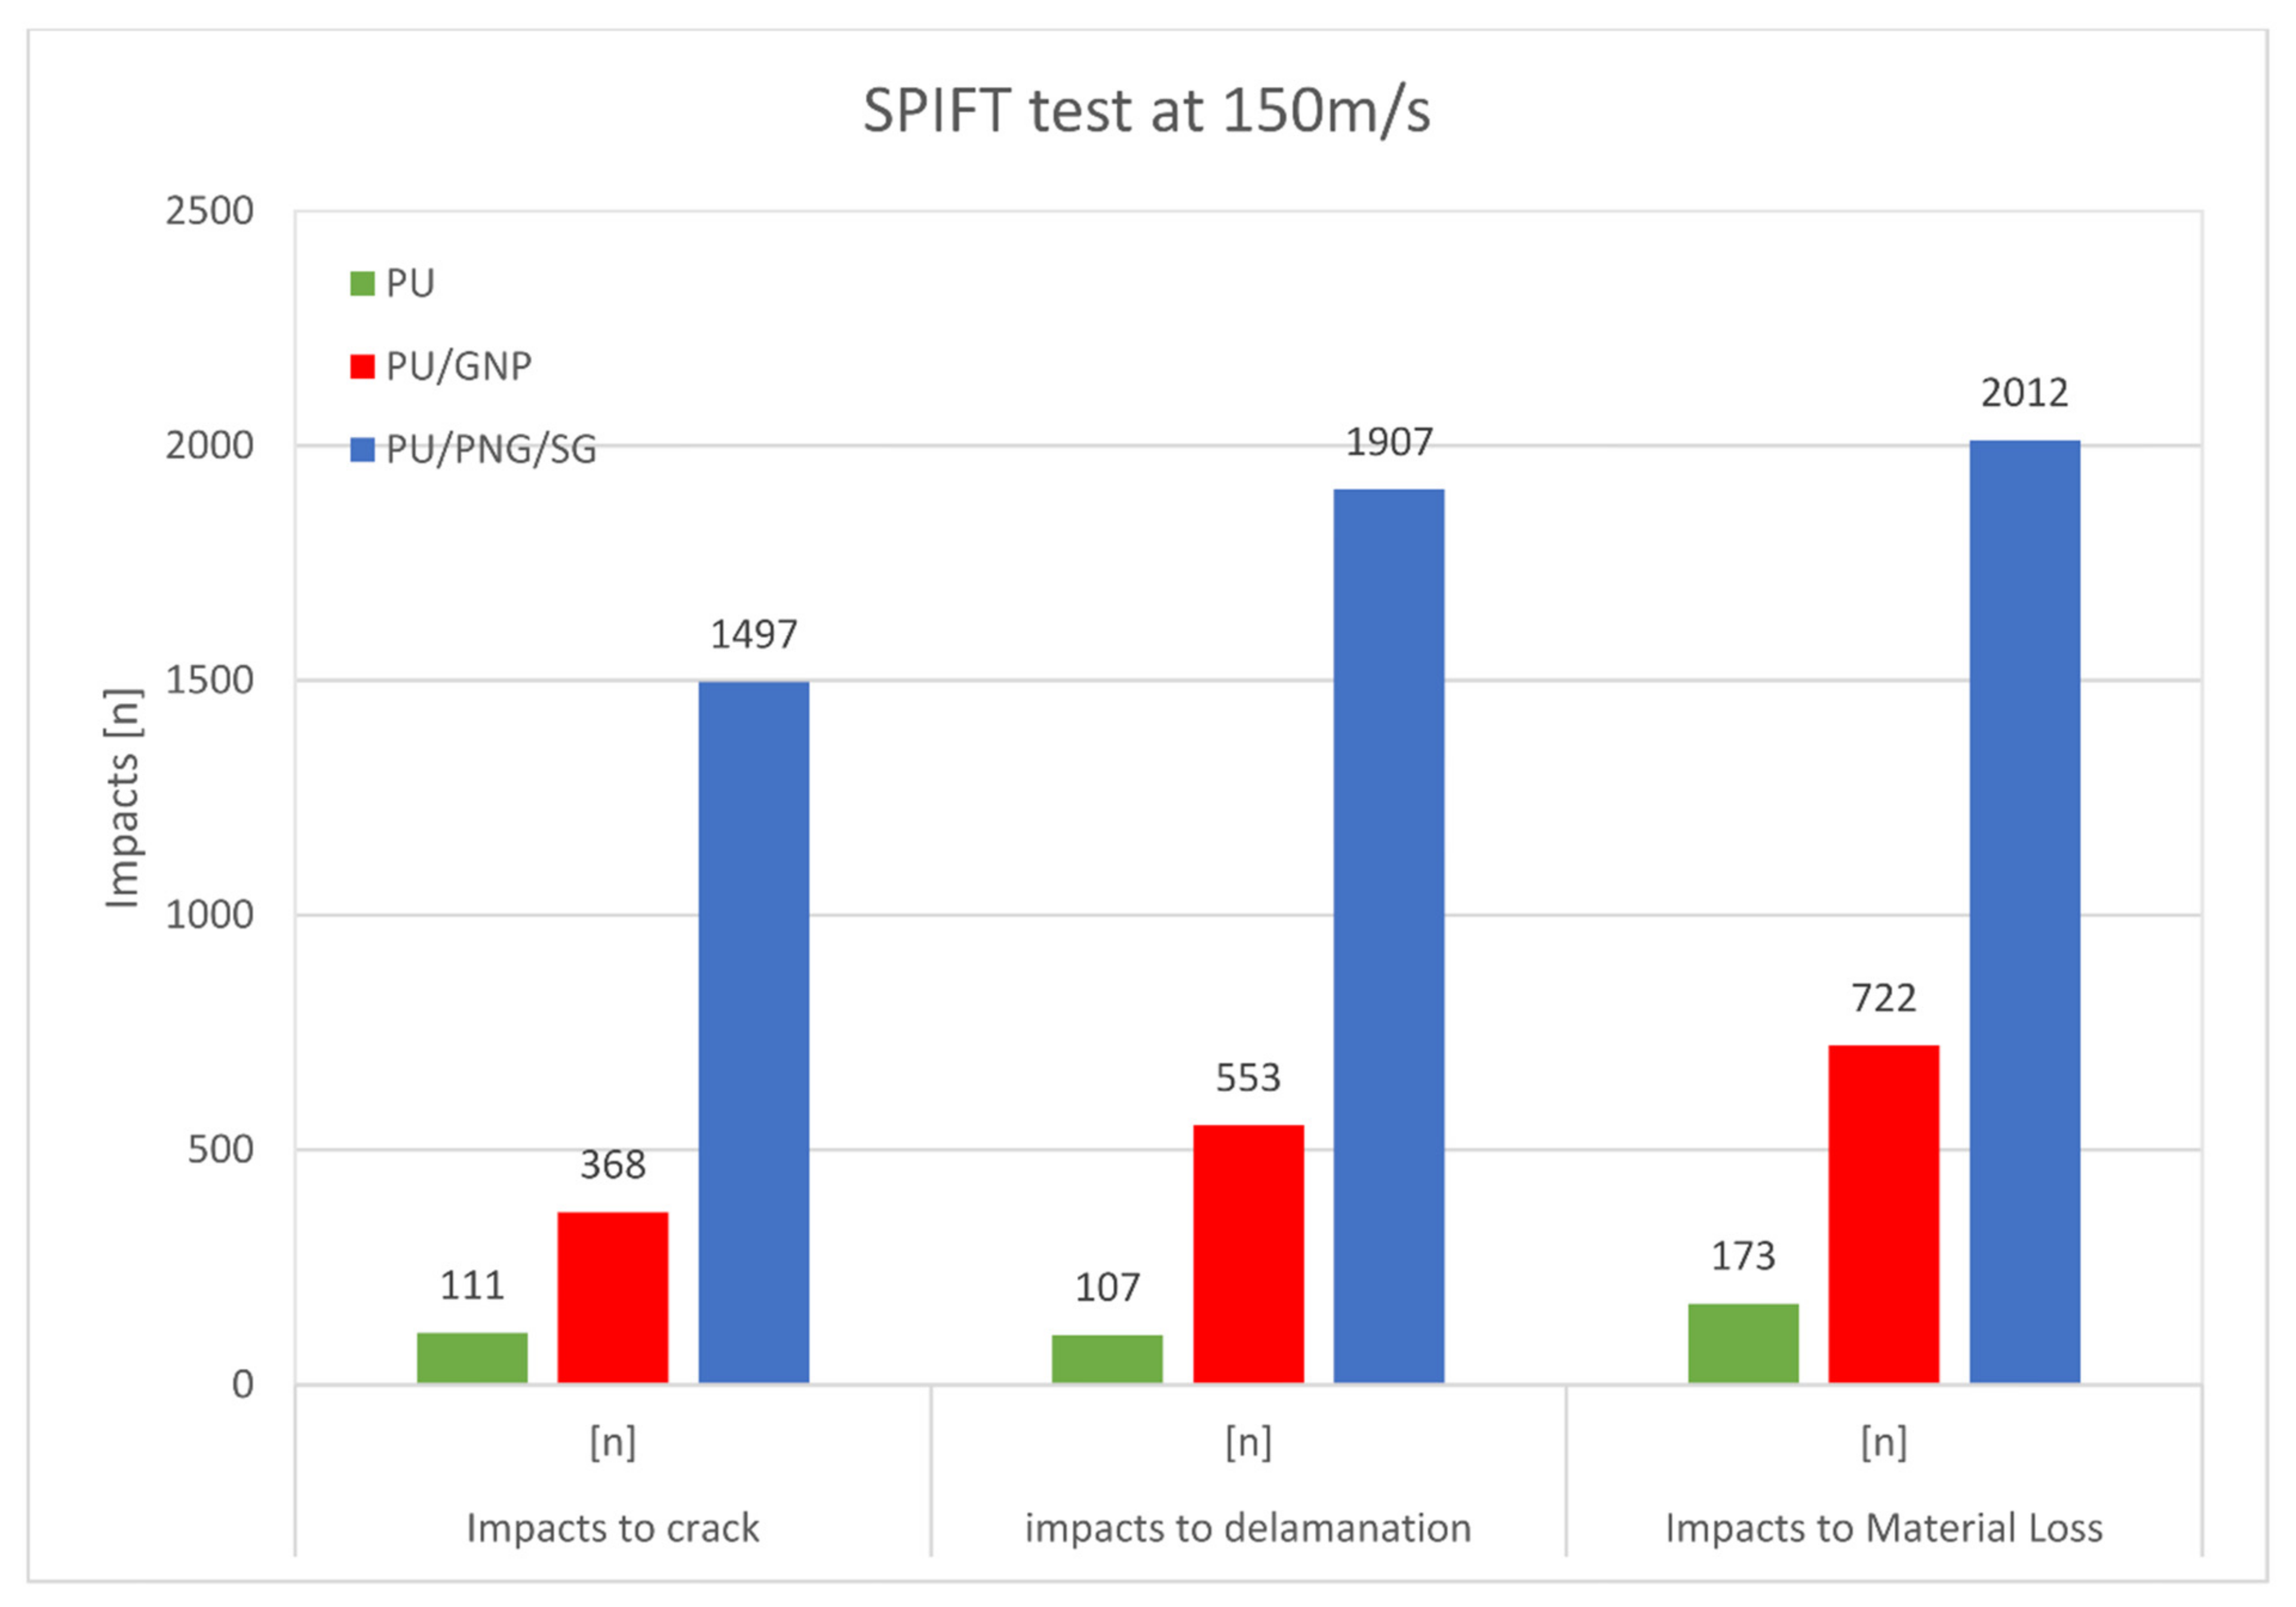
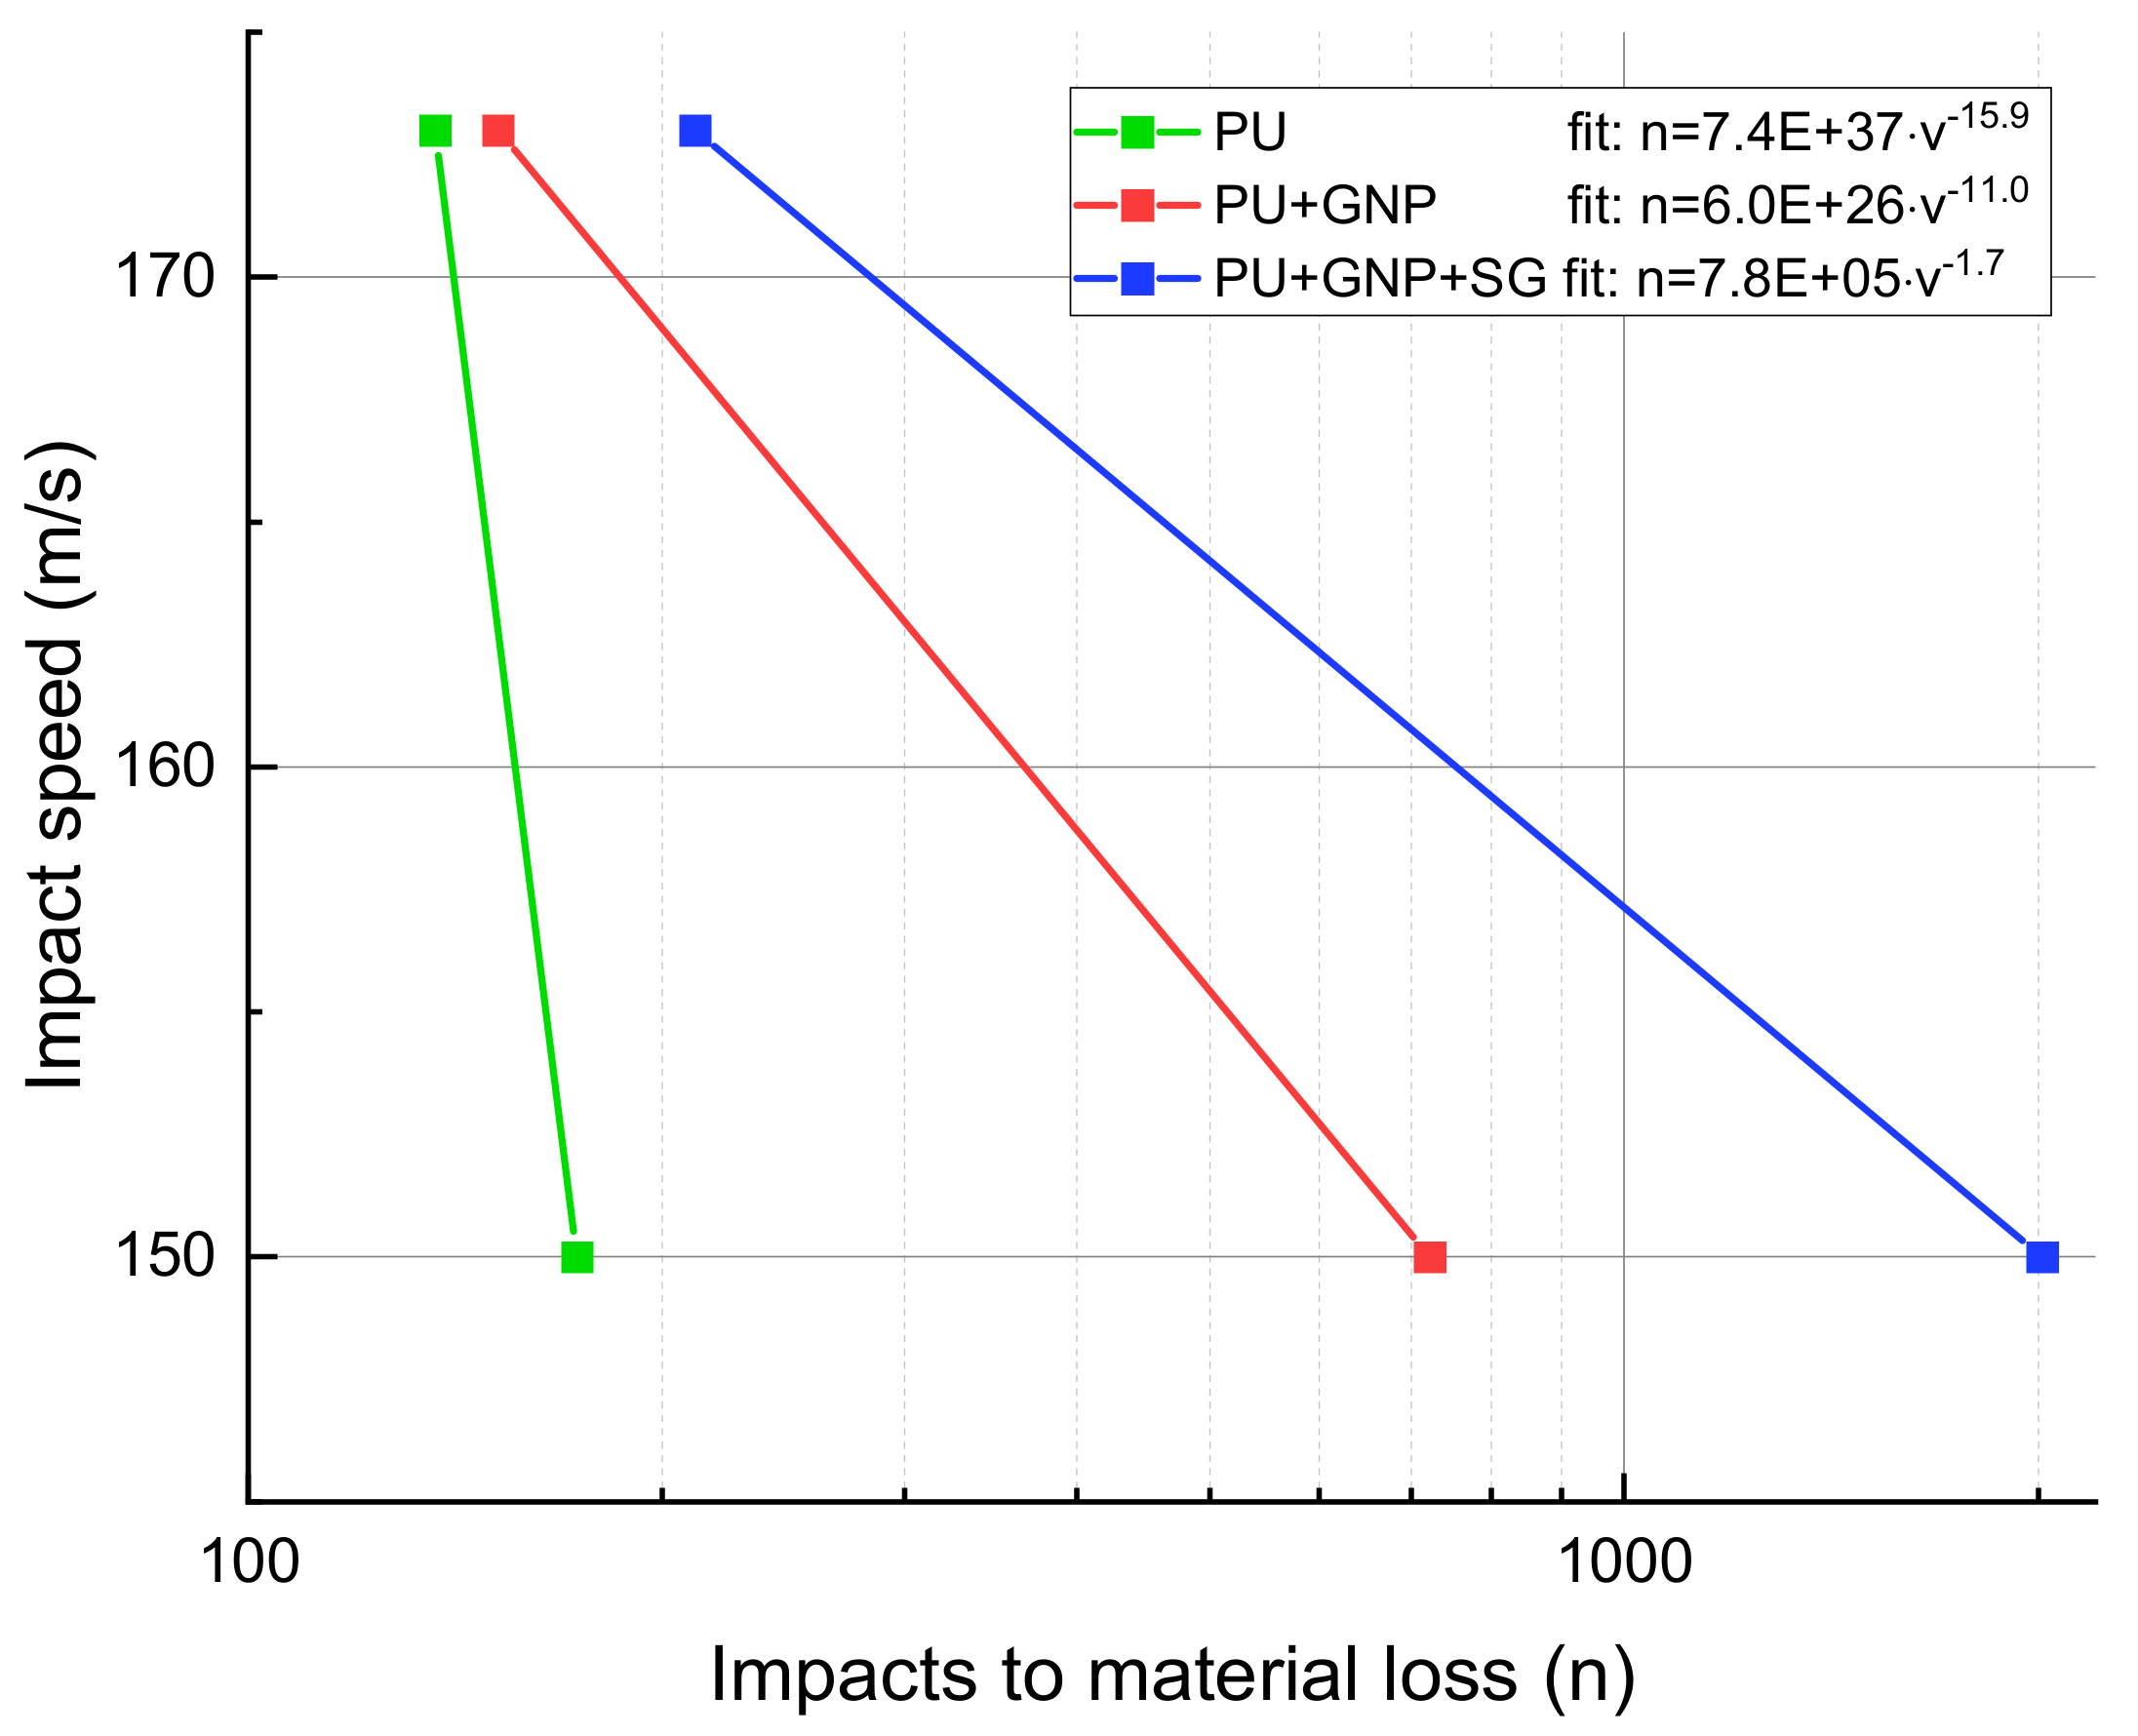
4.2. Erosion Testing of Nanoengineered Coatings

The SPIFT testing was done at two different speeds 150 and 173 m/s. The specimens were impacted to failure. Three parameters were determined from a study of videos of the testing: (i) the number of impacts to initiate the crack, (ii) the number of impacts to start delamination, and (iii) the number of impacts before loss of the coating material starts.
Nitrile rubber balls projectiles used had the following properties: diameter of 6 mm, Shore A hardness of 60, mass of 1.43 × 10⁻⁴ kg with SD of 7.59 × 10⁻⁷ kg, and density of 1263 kg/m3. Nitrile rubber is known to have a good impact resistance and in our testing, this was found to be true with no discernible damage after repeated use.
By using a high-speed camera (Phantom v2512 fast, Vision Research, Ltd., Thurmaston, Leicester, UK), the deformation, incoming and rebound speeds were measured. Assuming the steel target to be perfectly rigid, a significant amount of the impact energy is dissipated in viscous losses in the ball. A phantom V2512 high-speed camera with a speed of 380,000 fps was used to measure the incoming and rebound speeds of the nitrile rubber balls, Figure 2a.
Figure 6 summarizes the SPIFT results for the testing of three specimens, one of each coating variant, with an impact velocity of 173 m/s. The results show that PU + GNP + SG has the best erosion performance. In terms of the number of hits to initiate a crack, the PU + GNP + SG coating is 159% better than neat PU and 70% better than PU + GNP. In terms of number of ball impacts before the start of delamination, the PU + GNP + SG coating is 100% better than neat PU and PU + GNP. Finally in terms of number of ball impacts before the loss of coating material, the PU + GNP + SG coating is 54% better than neat PU and 39% better than the PU + GNP coating.
Figure 7 shows images of the extent of damage to the three coatings at various stages of the impact testing. It is clear that the number of impacts to material loss to occur is much longer for the PU + GNP + SG coating than the others.
The SPIFT test results at 150 m/s are shown in Figure 8. Again, the results show that at this ball impact velocity, PU + GNP + SG has the best erosion performance. In terms of the number of hits to initiate a crack, the PU + GNP + SG coating is 1248% better than neat PU and 306% better than PU + GNP. In terms of number of ball impacts before the start of delamination the PU + GNP + SG coating is 1682% better than neat PU and 244% better than PU + GNP. Finally, in terms of number of ball impacts before the loss of coating material, the PU + GNP + SG coating is 1063% better than neat PU and 178% better than the PU + GNP coating.
Figure 9 shows the impact velocity versus number of impacts before material loss (VN) curves for the speeds of 173 and 150 m/s.
As it is generally accepted that most materials under a fatigue tend to follow a power law [49], the choice was made to fit a power law curve to data points. This is intended to roughly illustrate the relation between impact speed and coating lifetime. Many more tests would be needed in order to construct a true VN curve.
When fitting a power curve of the form n v = c × v m to the three coating materials, the following functions were obtained:
n P U + G N P + S G v = 7.35 × 10 37   v 15.9 n P U + G N P v = 6 × 10 26   v 11.0 n P U v = 7.85 × 10 5   v 1.7
It can be seen that PU + GNP + SG has a large negative m coefficient, which is a strong indication of good fatigue performance. It is of interest that the angle of the curves is highest for hybrid nanoreinforced coatings, thus, their performance is more sensitive to impact velocity.
The experimental studies presented in this section confirm the hypothesis that nanoparticle reinforcement (in particular, graphene) of polyurethane coatings improves the coating anti-erosion performance. Hybrid reinforcement with graphene silica results in a 13 times longer lifetime. This has important implications for the development of future anti-erosion coatings.
Combining the Equations (1) and (2), we can make a rough estimate for the testing time at 95 m/s (the rated speed for a 15 MW turbine [54]). The testing time could be in the order of 3 × 10⁶ impacts; hence about 1500 h of continuous testing is required. This illustrates the need for accelerated testing at much higher speeds.

5. Energy Dissipation Mechanisms and Thermal Heating: Effect of the Coating Properties

5.1. Distribution of the Temperature and Relation to Impact Models

In order to analyze the thermal component of energy dissipation during impact testing of the new materials, thermography analysis was carried out. Figure 10 shows thermographs of PU (a), PU + GNP (b) and PU + GNP + SG (c) impacted at similar speeds of approximately 170 m/s, right after impact. As can be seen on the peak, temperatures are distributed in a doughnut shape around the impact center. Thus, the hottest and also the most deformed regions are within the contour line of the contact area of the impacting ball. This is in line with many models and observations reported elsewhere [4,50,55,56].
It should be noted that there might be changes in thermal emissivity between the different materials due to the different filler material. Therefore, comparisons of absolute values between the samples might be totally accurate.
For lower impact speeds and therefore temperatures, the general doughnut shape is preserved, but with a lower temperature, and the peak temperatures can be found in Figure 4a. As was also seen in the time–temperature plot in Figure 4a, the registered heat increase is near instantaneous to within the temporal resolution of the IR camera, as such the heating process is assumed to be adiabatic and thermal conductivity/diffusion is not considered.

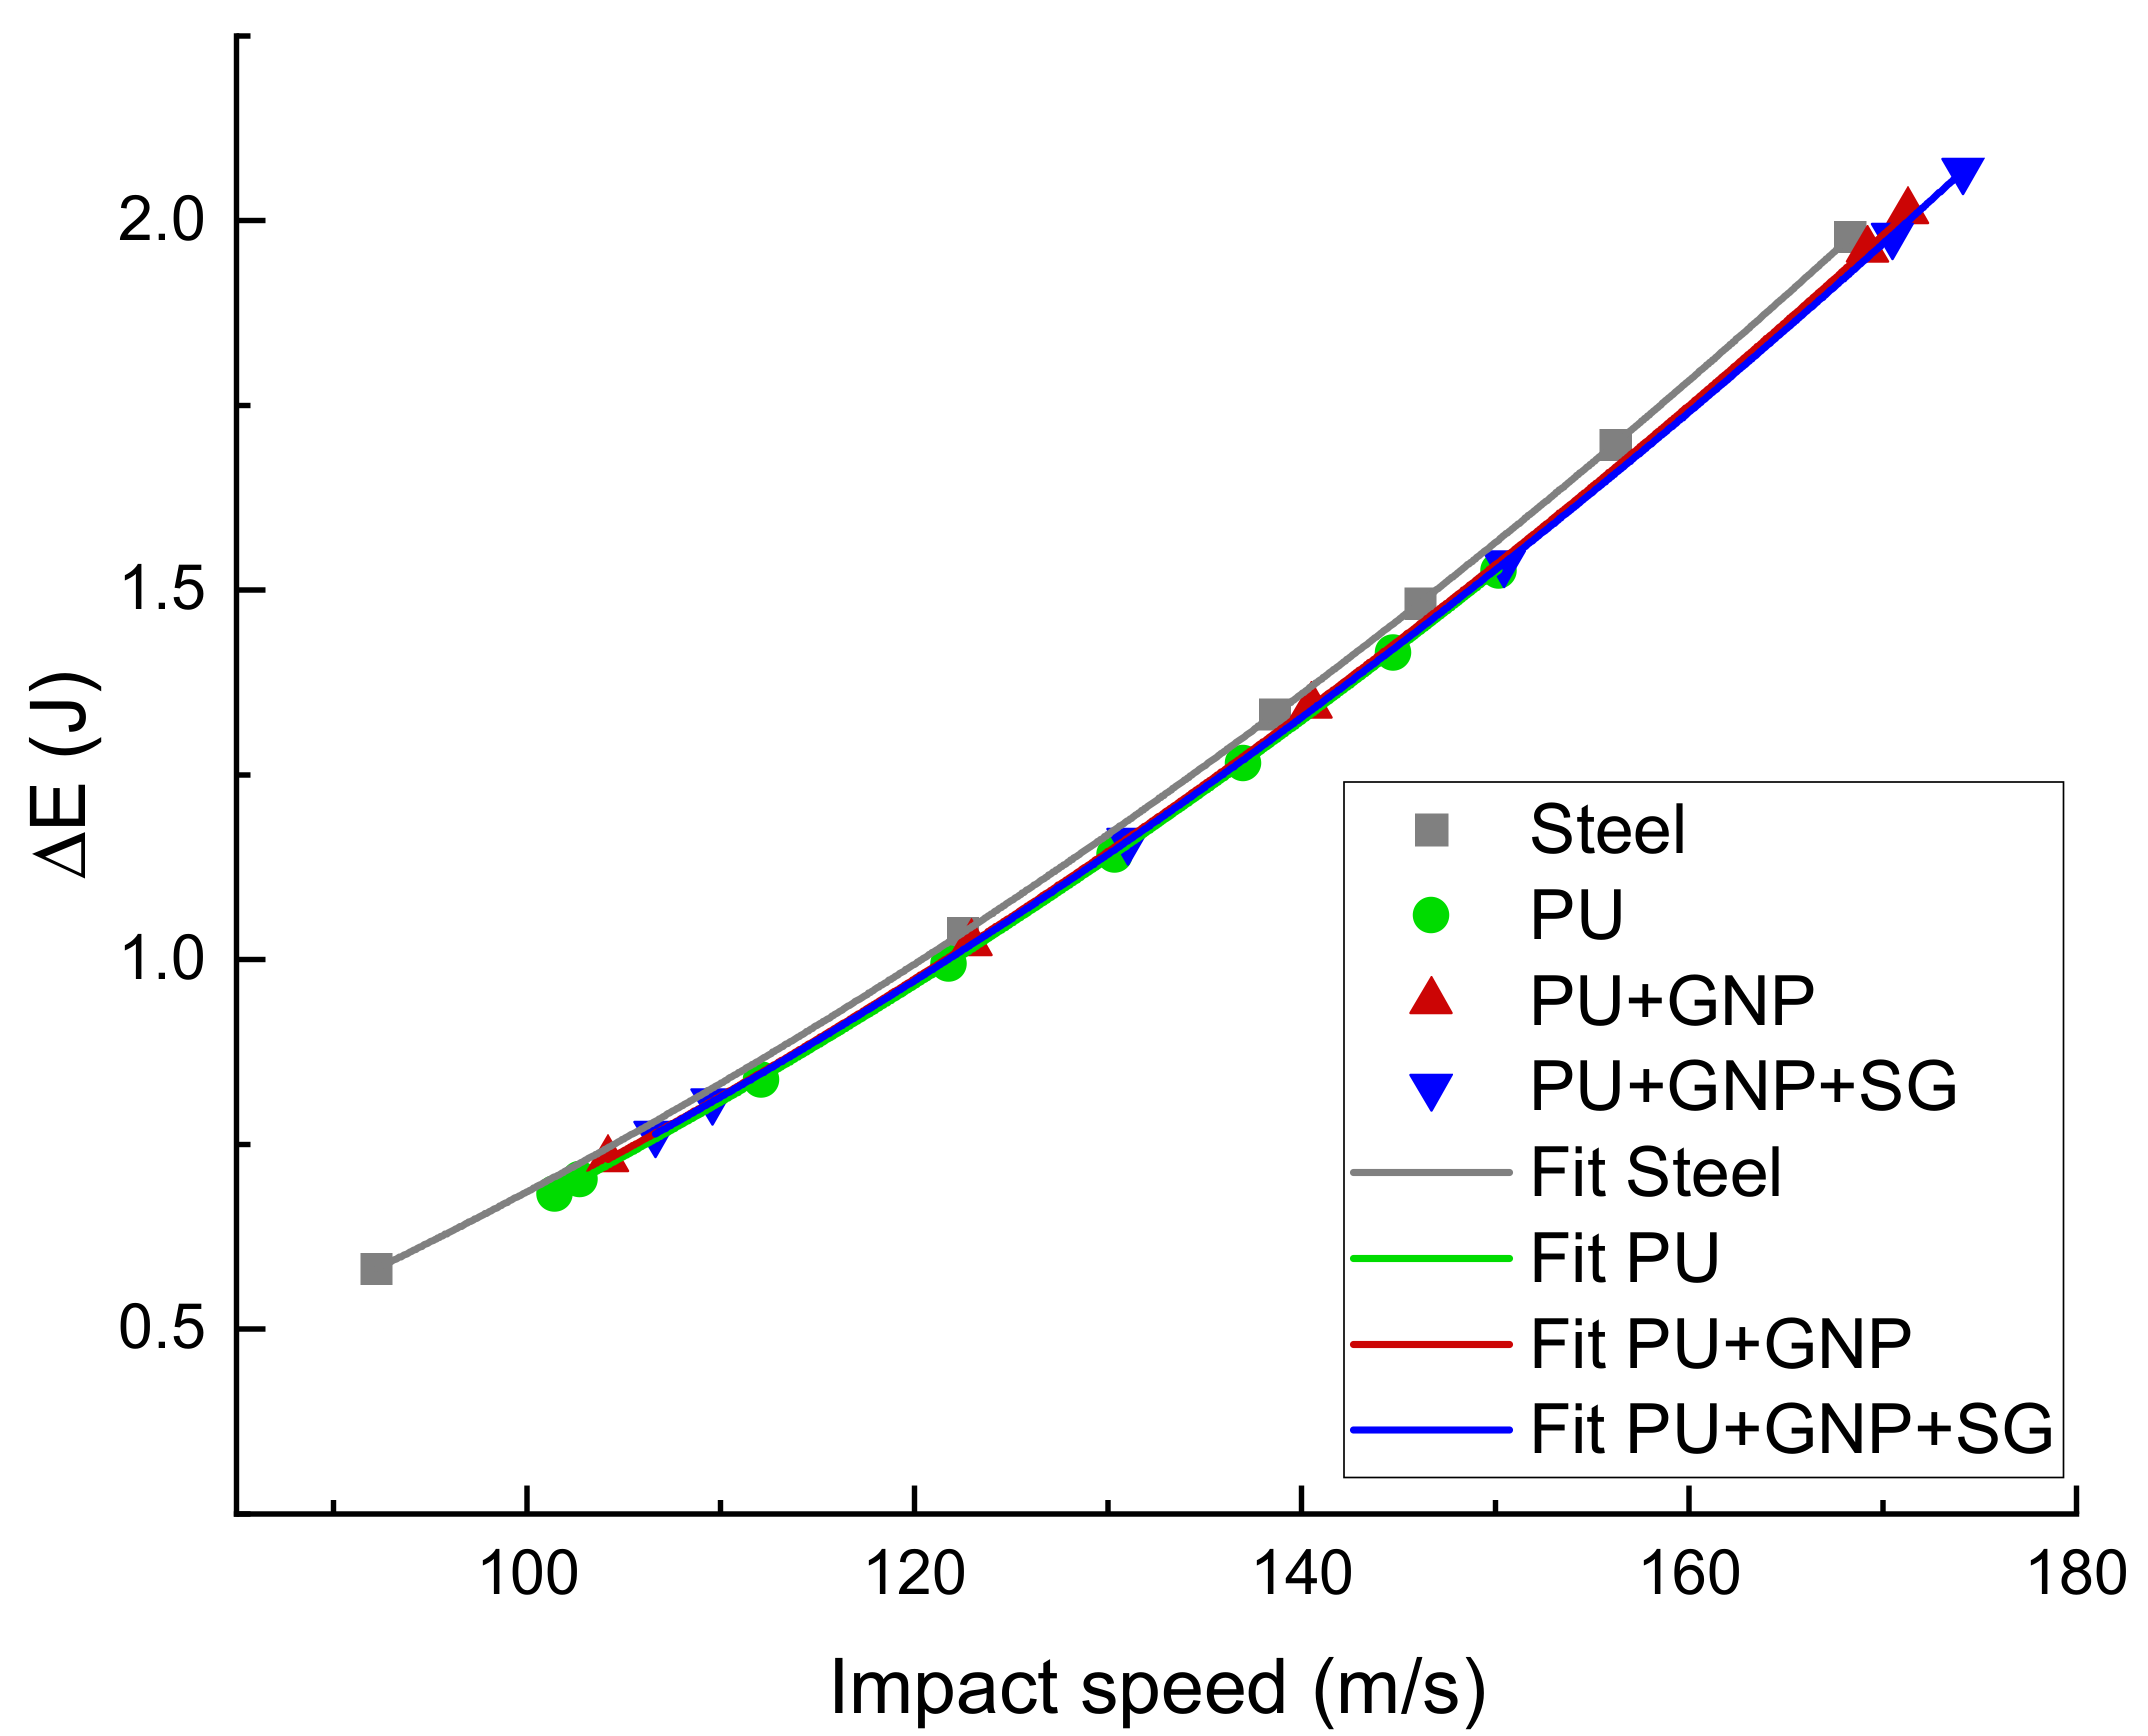
5.2. Effect of Nanoreinforcement on the Change in Kinetic Energy

Using the recorded high speed video, the impact velocity v i and rebound velocity v r of the balls were measured. This allowed estimation of the changes in the kinetic energy of the ball as follows
Δ E v = 1 2 m v i 2 v r 2
Variation of conserved kinetic energy of the ball Δ E v versus impact velocity for each coating material is plotted in Figure 11. The change in Δ E v for all three coatings can be fit with a single power curve,
Δ E v = 5 × 10 5 v 2.0421
No differences in Δ E values between the coatings were observed, as seen in the fit in Figure 12. In general, it was observed that all three coatings result in a lower Δ E value compared to impacting a steel target. This is due to the soft PU coating deforming on impact, which in turn results in less deformation of the nitrile rubber projectile. As nitrile rubber has a very high dampening factor, there is less deformation of the projectile and more Δ E is conserved during impact. Thus, the nanoreinforcement of soft polyurethane coatings does not lead to drastic changes in damping properties. One can assume that the positive effect of nanoreinforcement is in its influence on the fatigue properties of polymers.

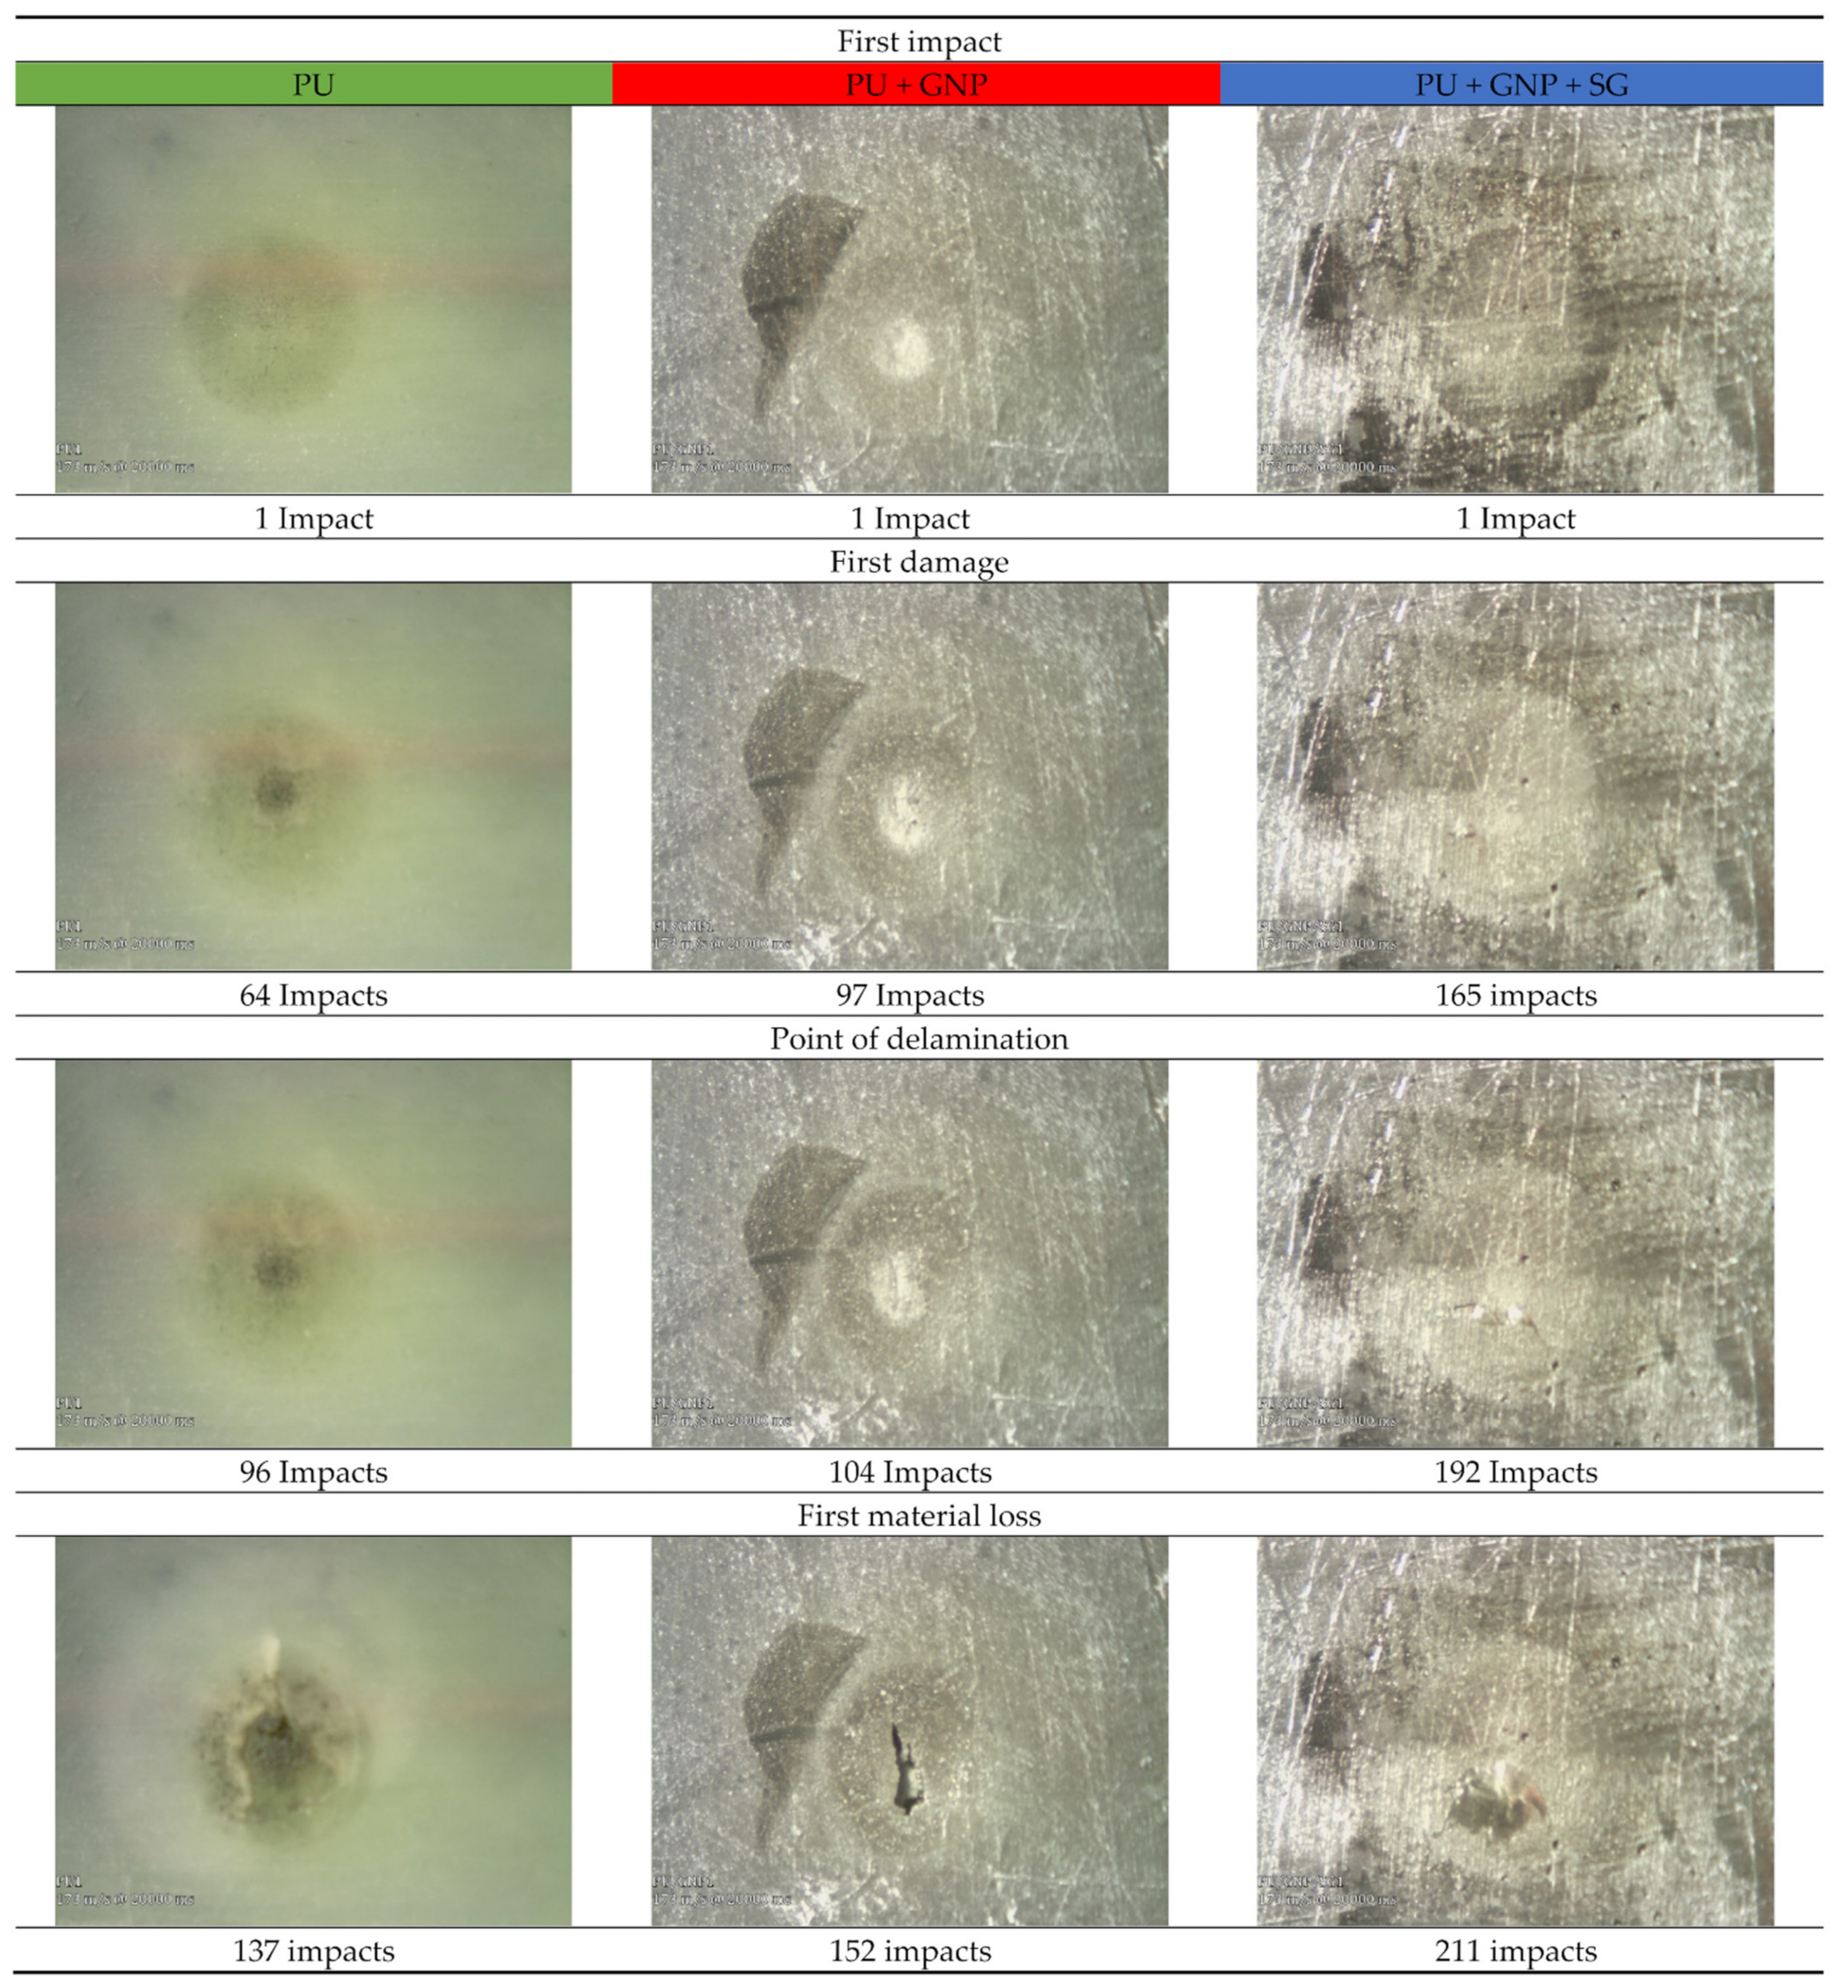
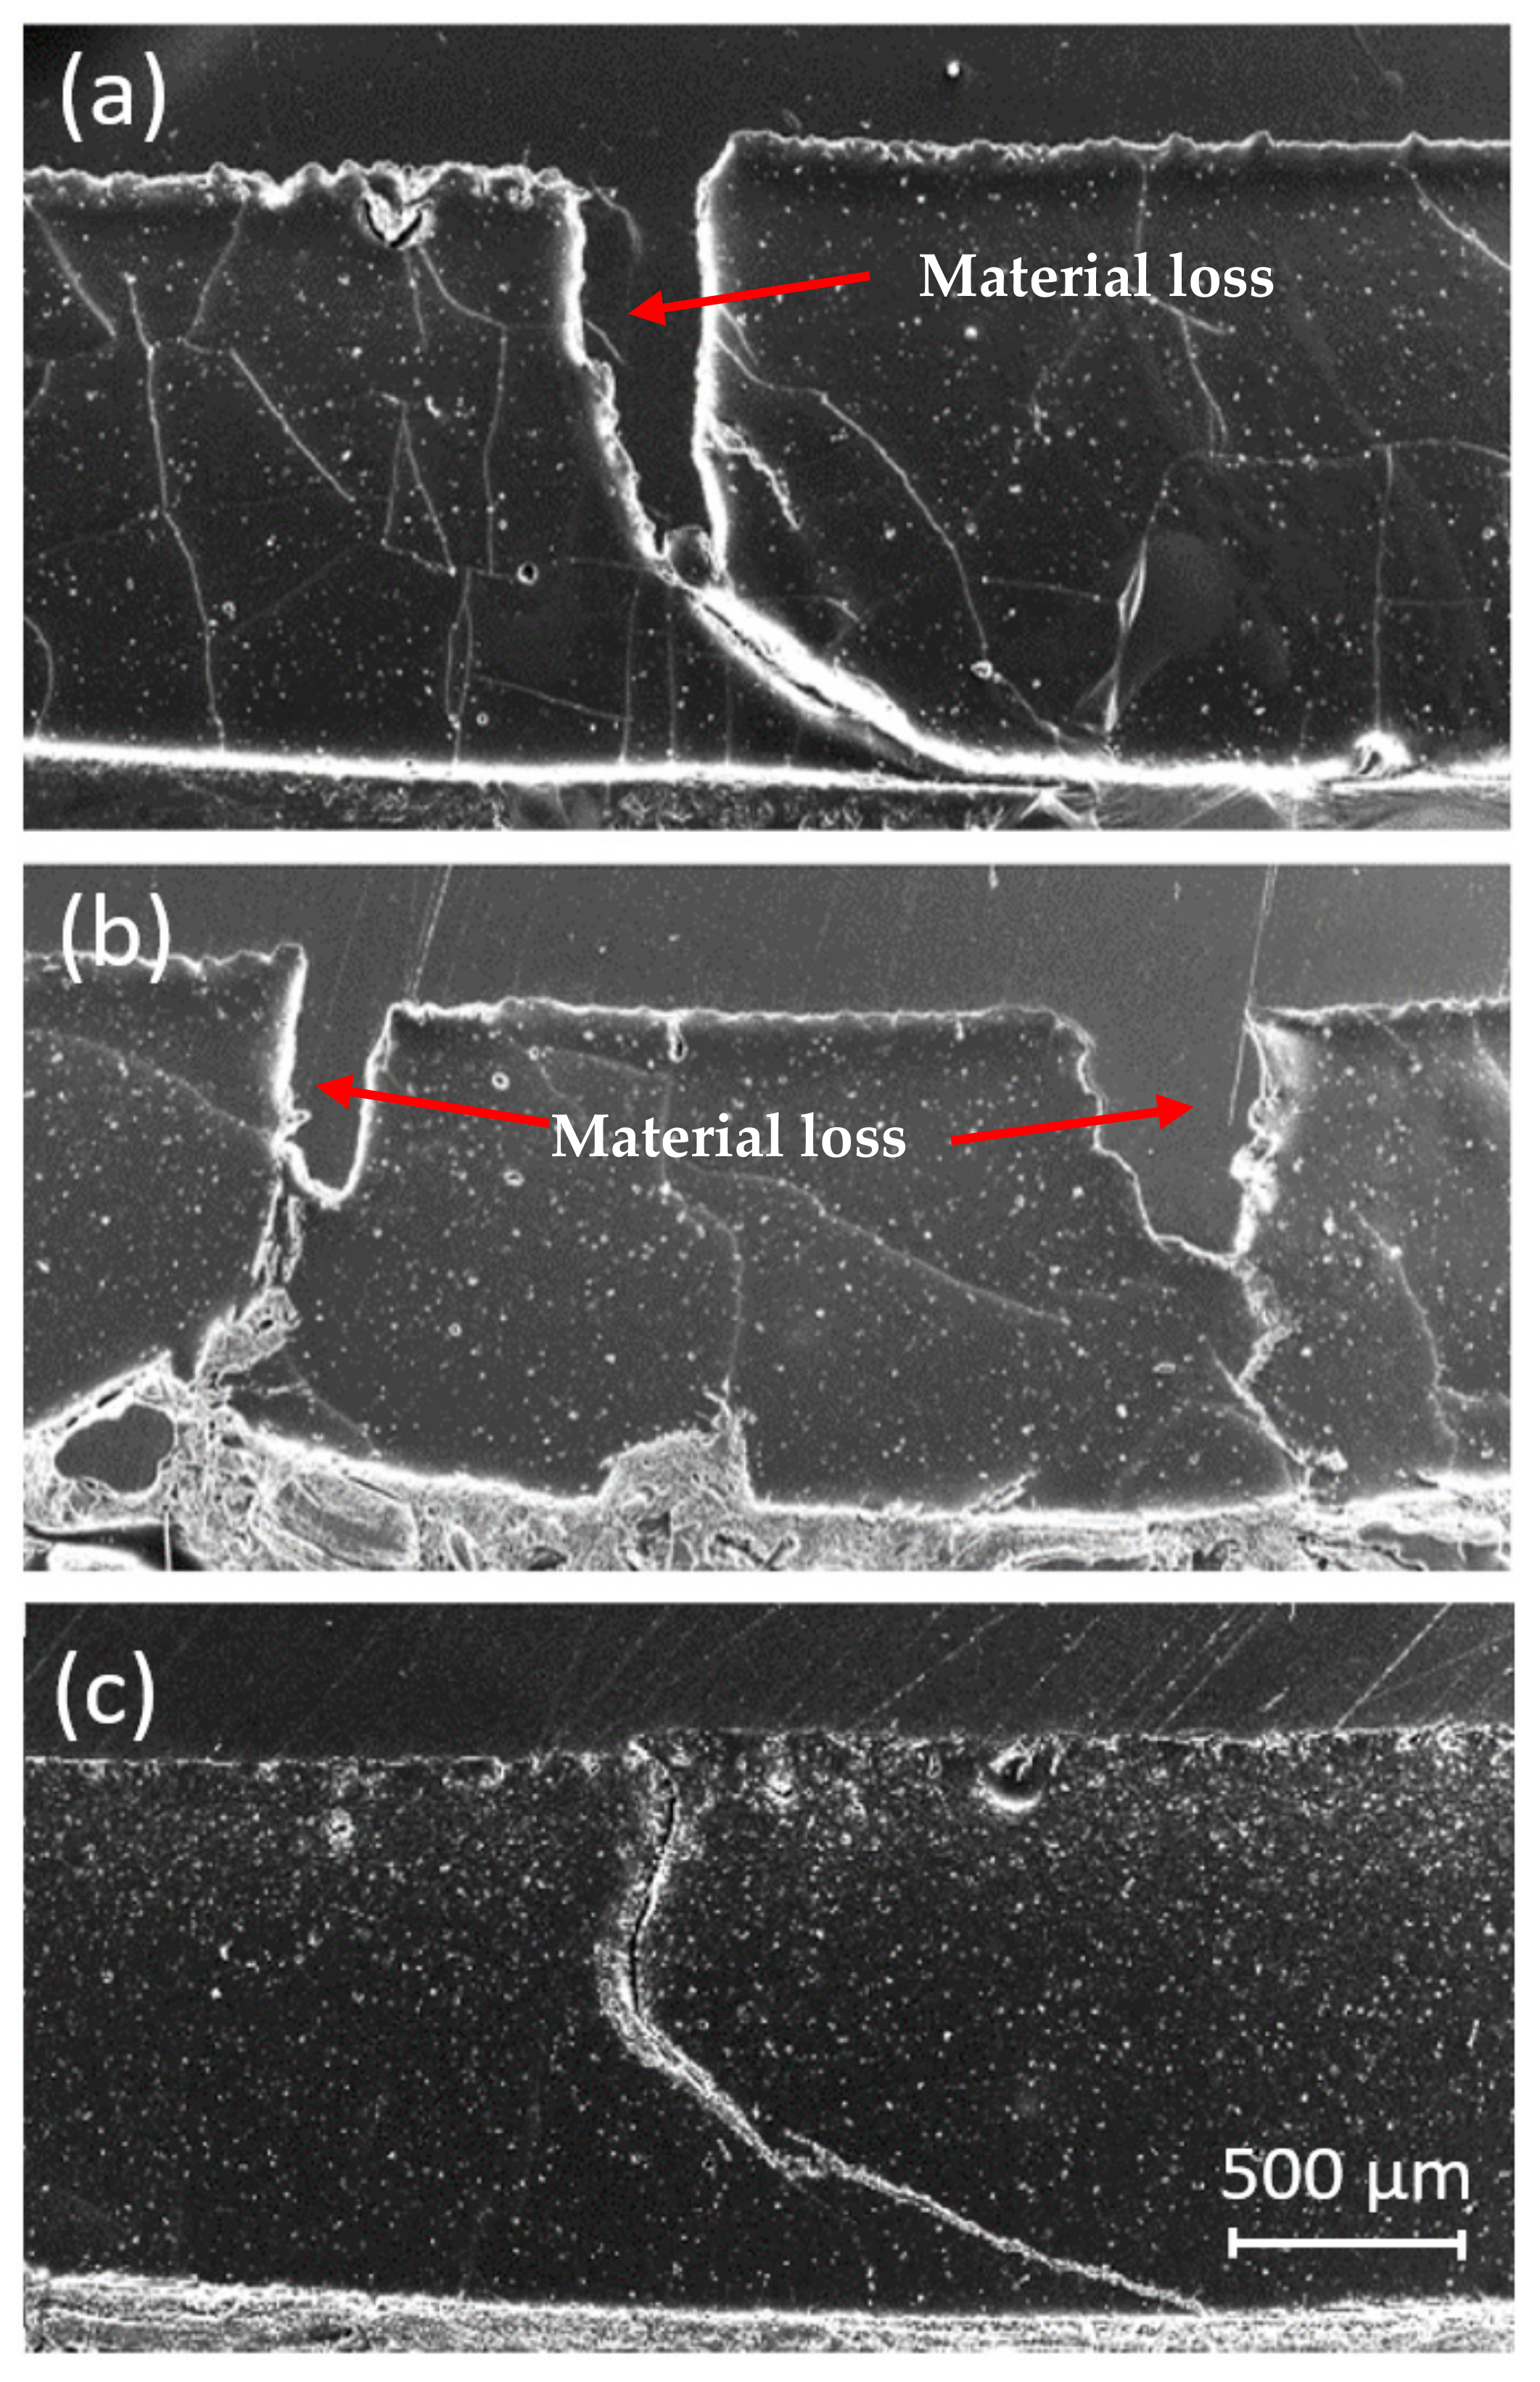
5.3. Microscopic Analysis of the Influence of Coating Modifications on the Damage Mechanisms
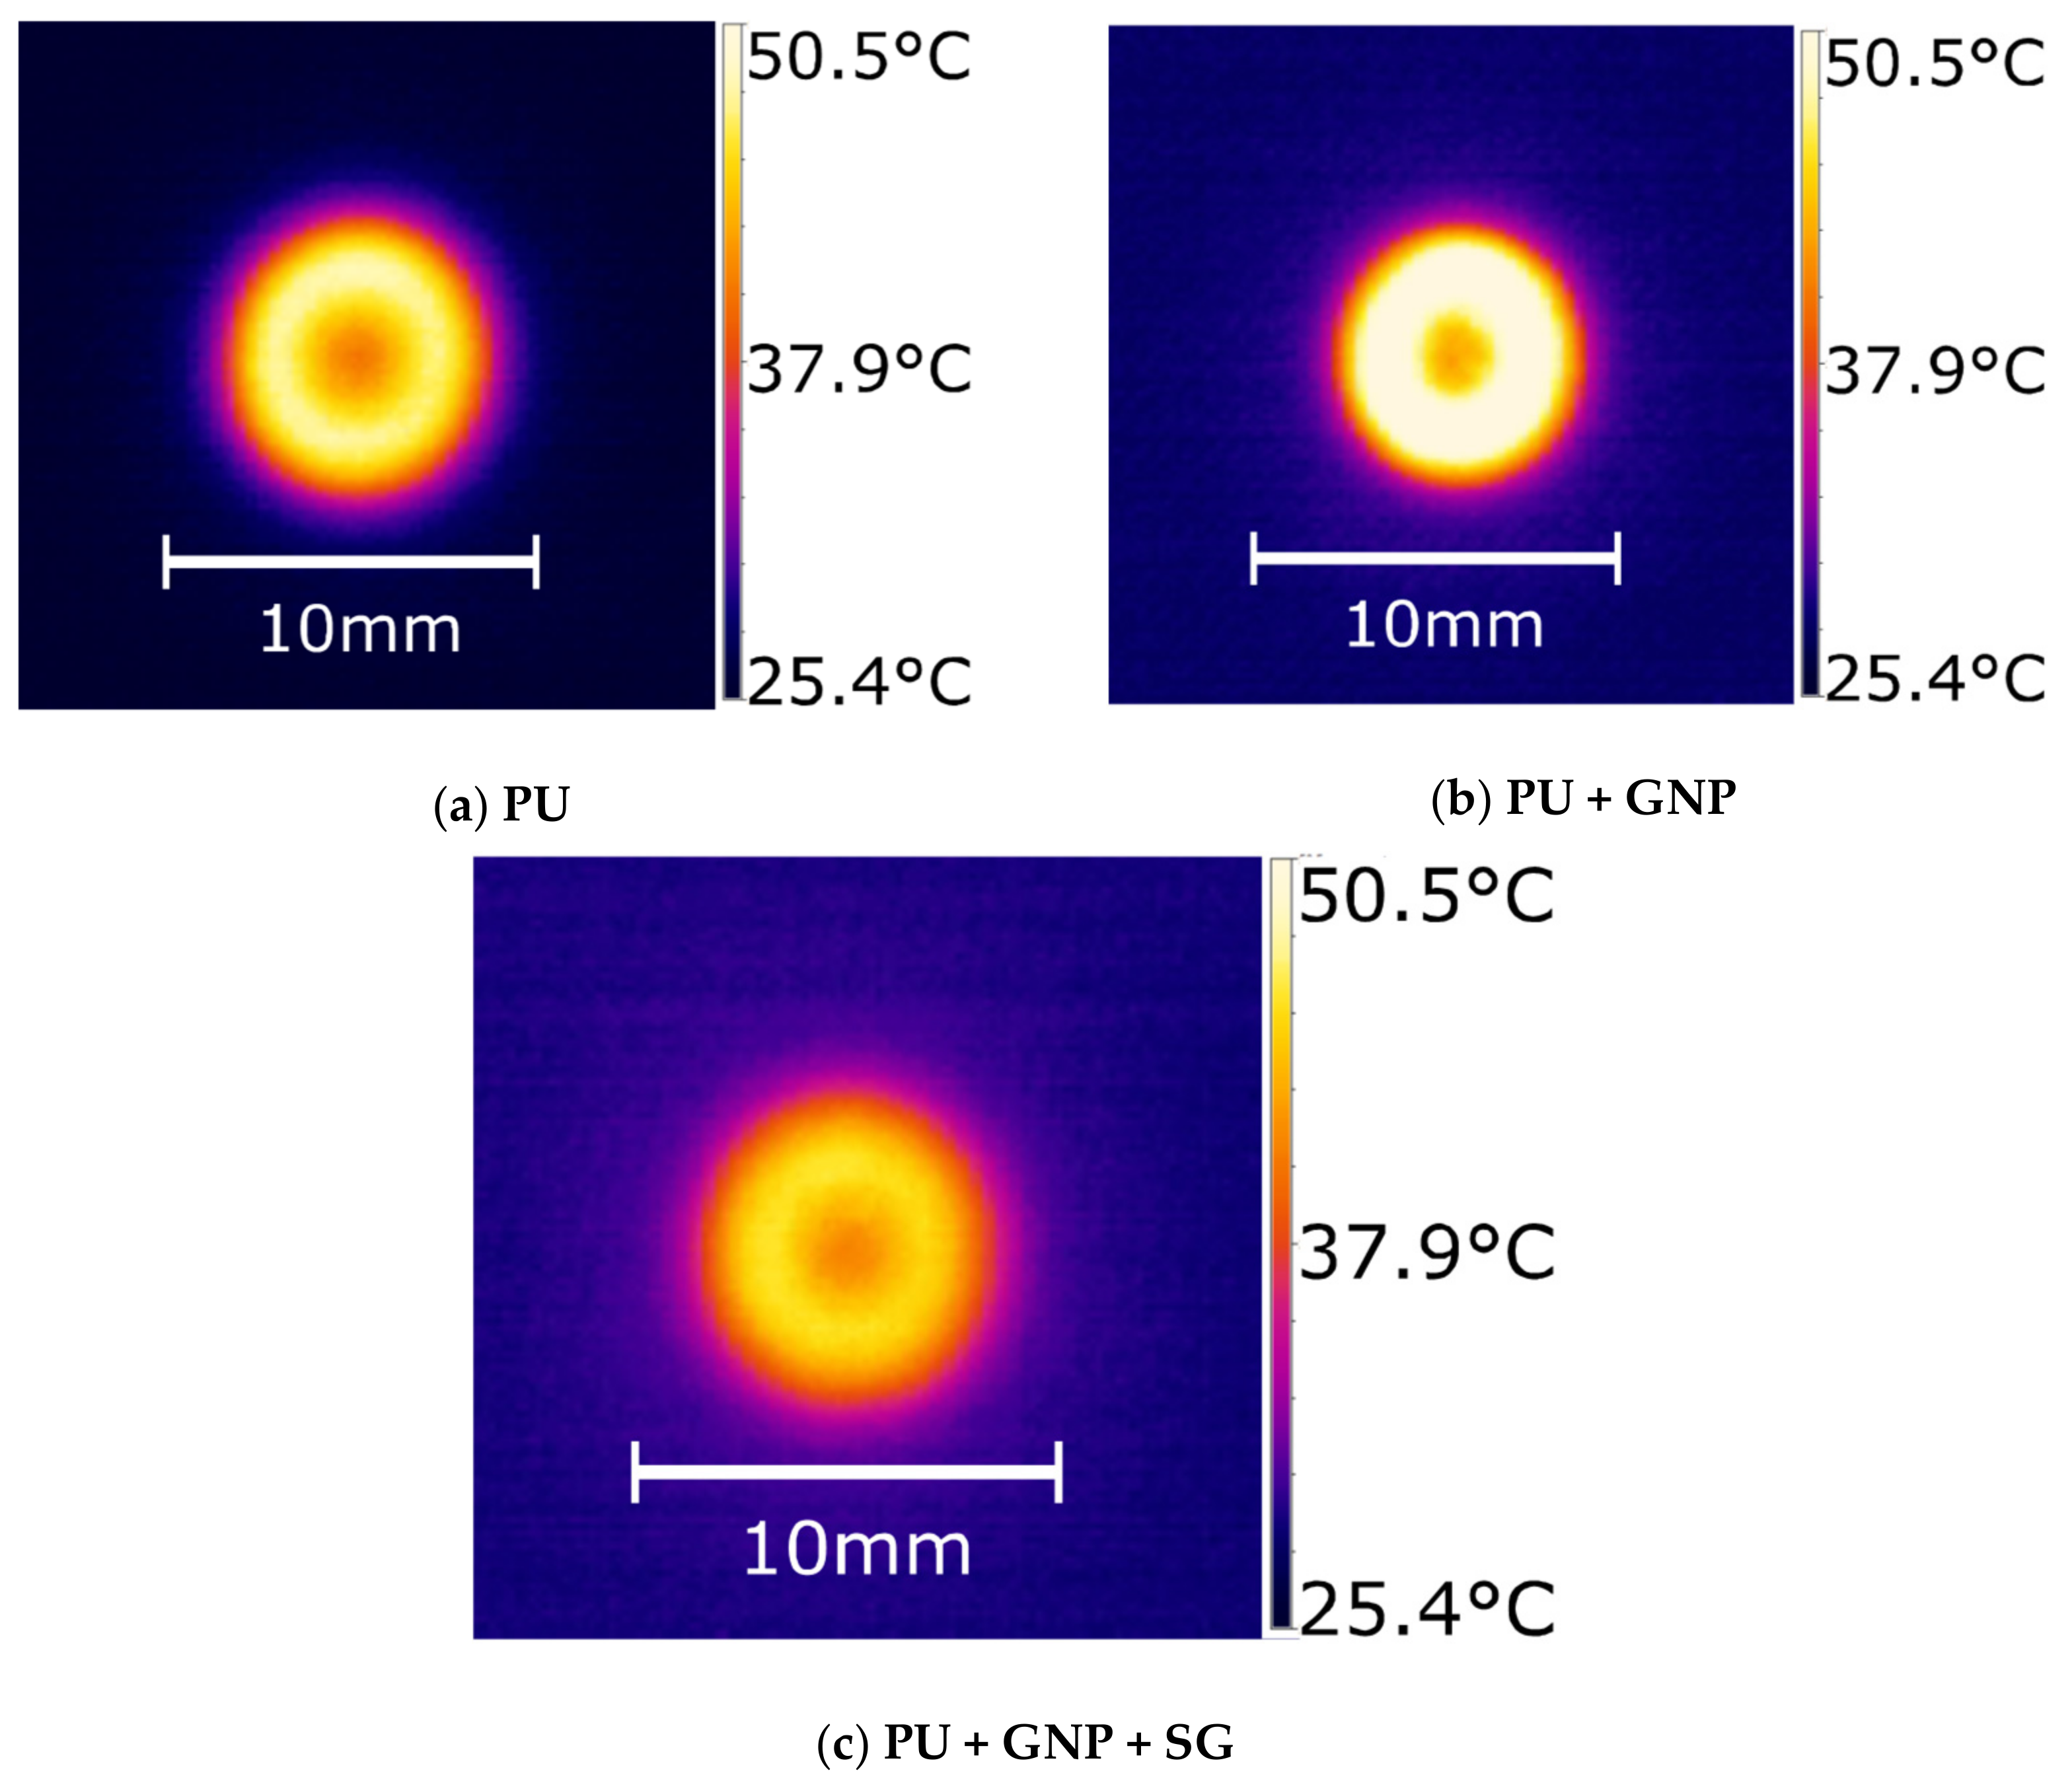
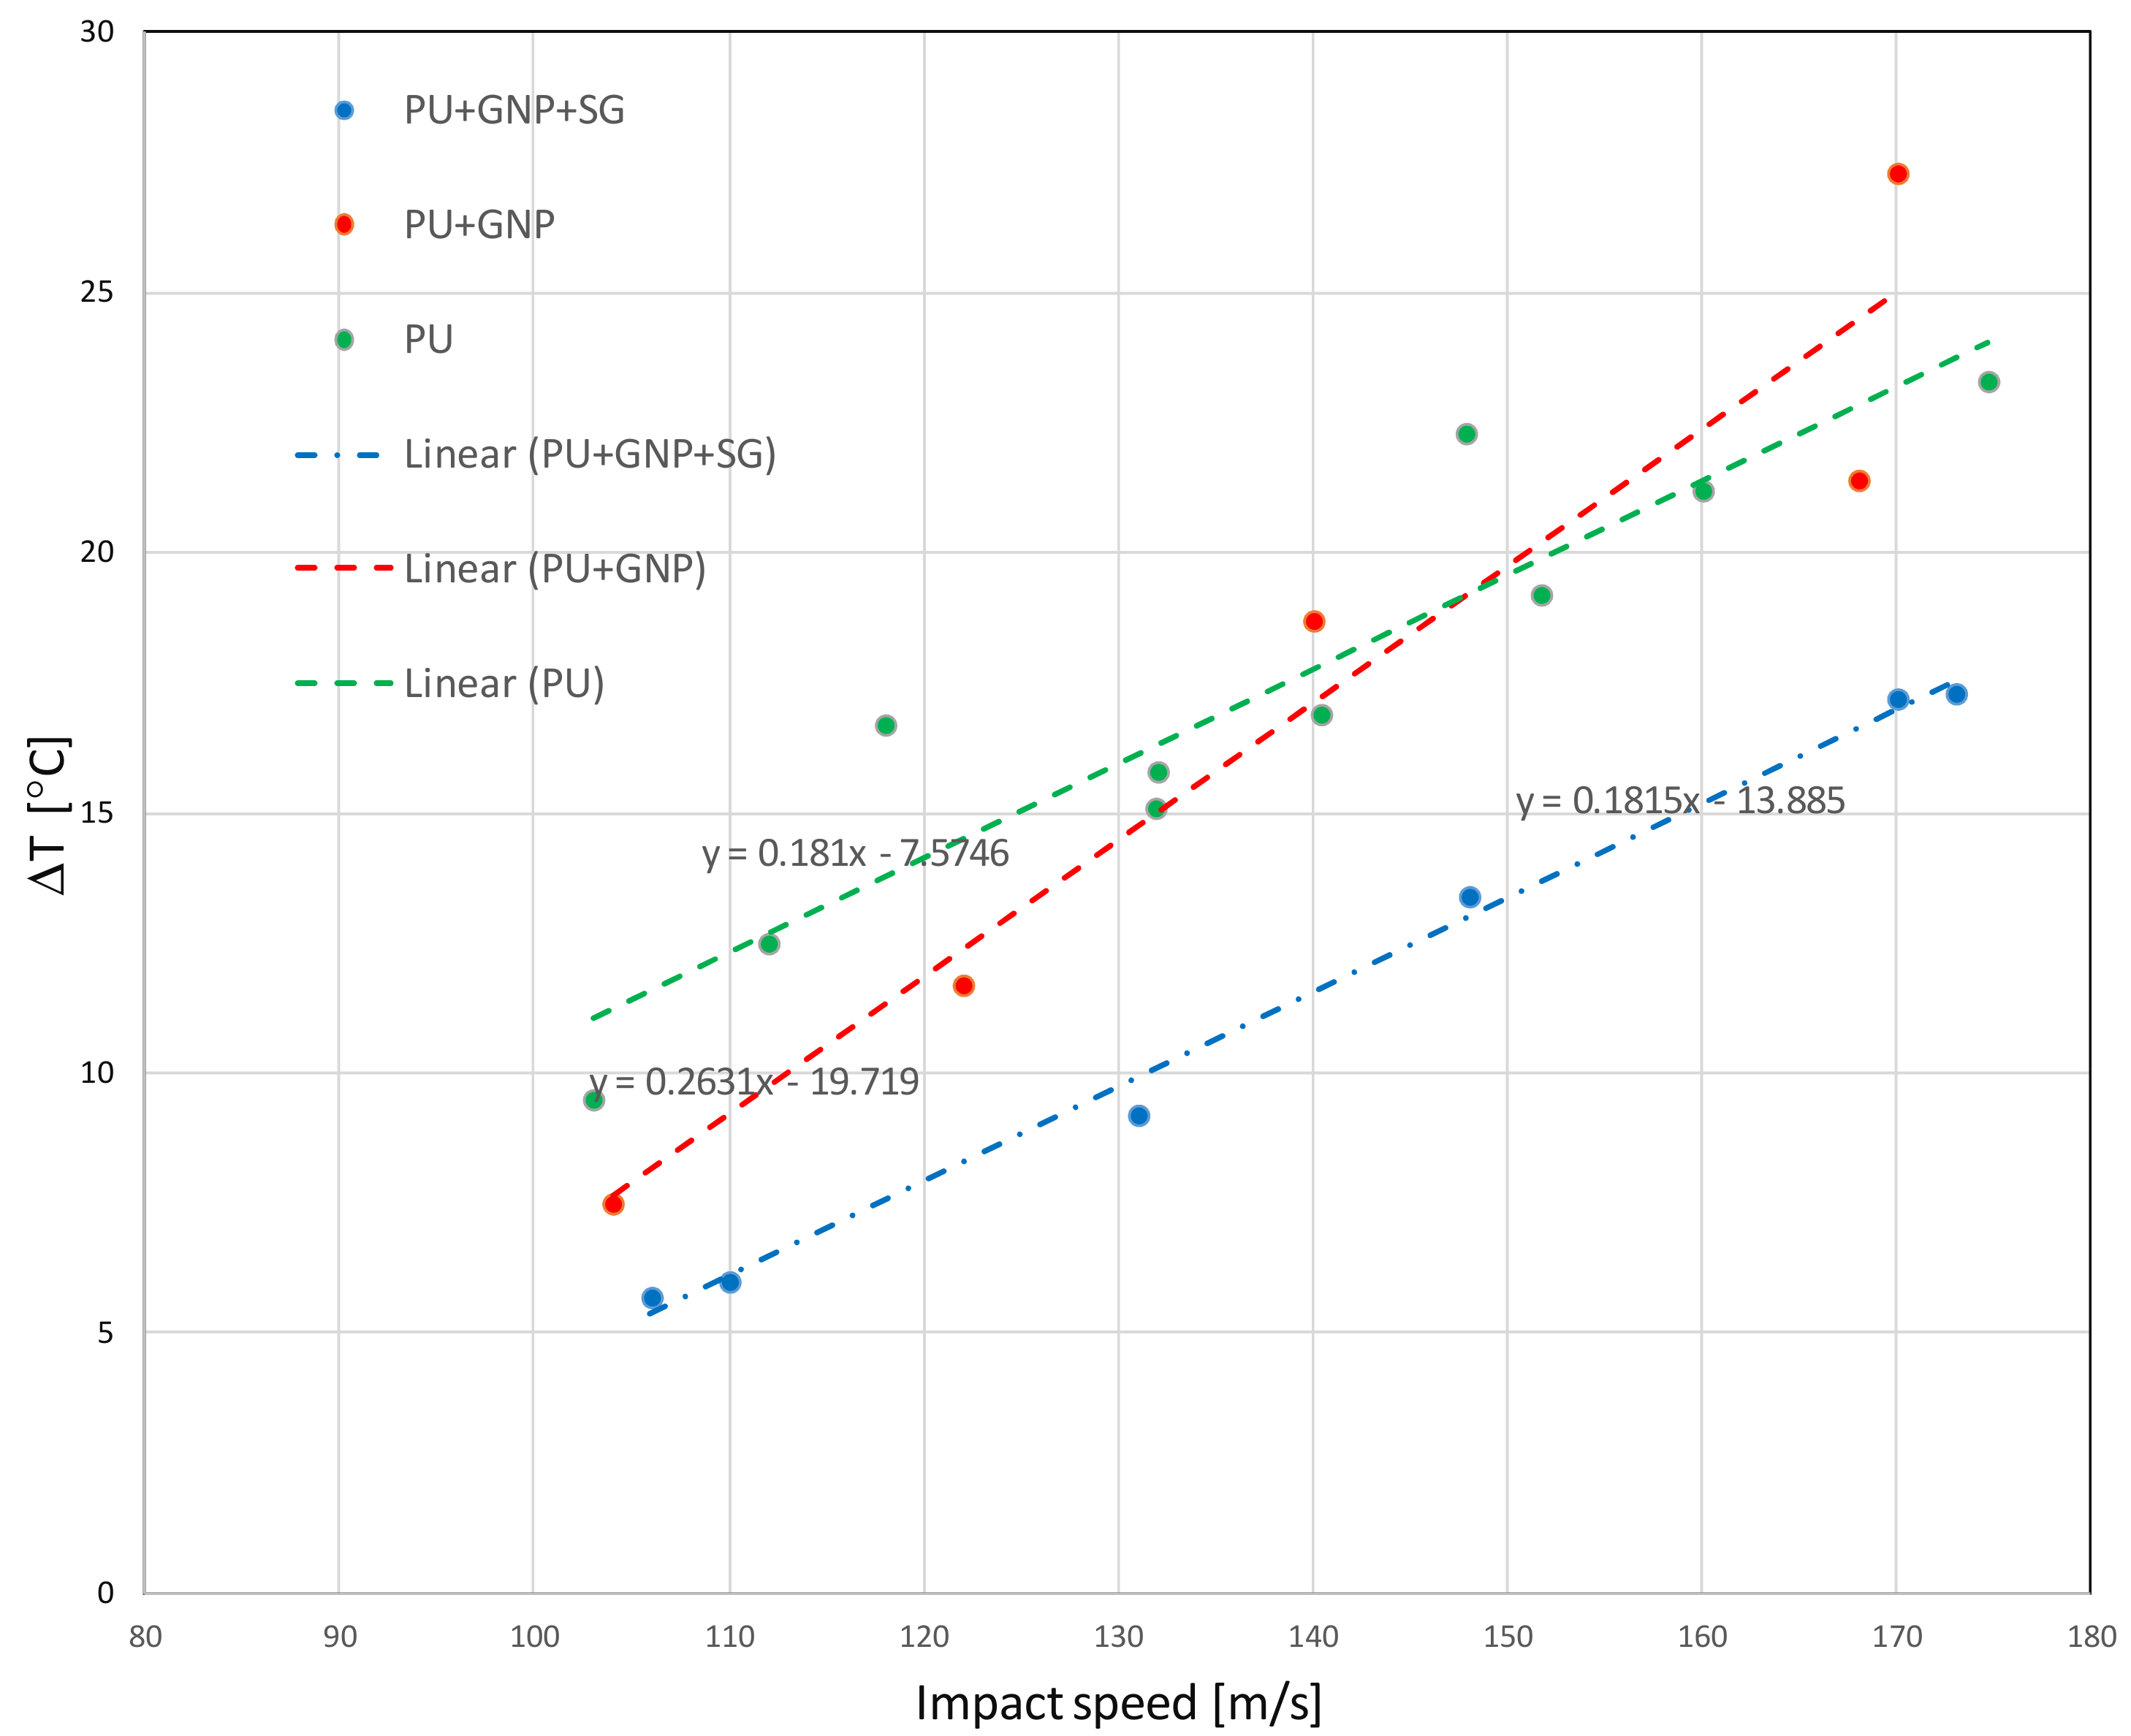
Three samples were selected after SPIFT testing to the stage of material loss for scanning electron microscopy (SEM). The samples were sectioned through the center of the impact position using a Struers Secotom-50 (Struers Inc., Cleveland, OH, USA) and embedded in epoxy. The cross sections were polished using a Struers RotoPol-22 (Struers Inc., Cleveland, OH, USA) and a RotoForce-4 (Struers Inc., Cleveland, OH, USA) with a 5 N force on each sample and using diamond paste down to 1µm. The polished samples were covered with an approximately 10 nm thick carbon layer using a Bal-Tec SCD 005 sputter coater and afterwards investigated in a Tescan Vega 3 SEM (TESCAN, Brno, Czech Republic))microscope, where an image of the central crack, with a magnification of 21 times were acquired with a secondary electron detector, see Figure 12.
The thin white lines in image Figure 12a,b are cracks in the carbon surface coating that were sputtered on the surface to make the SEM sample electrical conductive. In image (c), there are no thin carbon cracks. The softer material, the more likely it is that the carbon layer will form cracks. The number of thin cracks in the carbon layer indicates that the PU is softer than PU + GNP, which again is softer than PU + GNP + SG.
Figure 12a shows material loss due to the ball impact and formation of a large crack from the root of the formed cavity to the glue, bonding the PU coating to the GFRP substrate is visible. The crack bent softly to the right.
In Figure 12b, similar material loss was observed except it happened in two places instead of one. Two large cracks were formed at the sharp ends of the cavities that go into the coating material with abrupt changes of direction, see Figure 12b. Approximately the same amount of material loss can be seen on both images; however, the number of balls impact on these two specimens as explained before are different and for PU + GNP is higher. At the end of SPIFT tests, the damage resistance of the PU and PU + GNP coatings is more or less the same, but the abrupt changes of crack direction indicate PU + GNP coating is more brittle than the PU coating.
In Figure 12c, no cavity is formed by material loss and a crack propagates in the same manner as the crack in Figure 12a. The number of ball impacts on the PU + GNP + SG specimen is substantially higher than the PU specimen and this indicates that adding SG makes the material more damage tolerant. The failure mechanism is by propagation of a macroscopic crack from top surface to the adhesive bond with GFRP substrate and it follows the same path as the crack in PU coating shown in Figure 12a.

5.4. Impact Heating

Figure 13 shows the peak temperature change as a function of impact speed for PU, PU + GNP, and PU + GNP + SG. The samples were impacted at speeds between 100–175 m/s and the peak change in temperature Δ T was recorded.
As seen from Figure 13, the PU coating exhibits the largest Δ T values across most of the impact speed range. Therefore, PU control curve is assumed safe to use on PU + GNP and PU + GNP + SG coatings.
In Figure 13, a linear relationship between the peak impact heating and the impact speed can be seen. Comparing Figure 13 with Figure 8 and Figure 9, one can see that the coatings with a higher number of impacts before failure correspond to lower peak temperature changes.
In this section, the energy dissipation mechanisms during erosion were investigated. Comparing kinetic energy of the impacted balls before and after the impact, it was observed that the change in the kinetic energy was approximately the same for all three coatings. This is as expected, since the coatings are developed for millions of impact cycles, not for single impact projectile protection, and these damping effects should be small. At the same time, the dependence of temperature change on impact velocity is very different for the three coatings. This suggests that nanoparticle reinforcement can influence not only local stress wave scattering, but also mechanisms of thermal relaxation of polymers.

6. Conclusions

An evaluation of novel nanoreinforced polyurethane based coatings for improved leading edge protection of wind turbine blades is presented in this paper. Using nanoparticles embedded in the coating to scatter and reflect stress waves arising from rain droplet impacts is proposed. Polyurethane coating samples with graphene and hybrid (graphene/silica) reinforcement have been tested using a Single Point Impact Fatigue Tester (SPIFT) to evaluate their potential erosion resistance. Scanning electron microscopy has been used for analysis of damage after SPIFT testing. The SEM images revealed the PU + GNP + SG is less prone to damage caused by repeated ball impact. It has been demonstrated that the nanoreinforced coatings have significantly greater resistance to erosion. Polyurethane with hybrid GNP + SG nanoparticle reinforced coatings exhibited lifetimes up to 13 time greater than pure polyurethane coatings.

Author Contributions

Conceptualization, L.M.J. and H.H.; methodology, N.F.-J.J.; formal analysis, N.F.-J.J.; investigation, A.D., N.F.-J.J. and S.F.; resources, H.H., A.D., N.A.W., A.S. and I.G.C.; data curation, N.F.-J.J.; writing—original draft preparation, L.M.J.; writing—review and editing, L.M.J. and H.H.; visualization, N.F.-J.J.; supervision, L.M.J. and H.H.; project administration, L.M.J. and H.H.; funding acquisition, L.M.J. All authors have read and agreed to the published version of the manuscript.

Funding

The authors L.M.J. and N.F.-J.J. gratefully acknowledge the financial support of the Innovation Foundation of Denmark in the framework of the Grand Solutions project DURALEDGE, Durable leading edges for high tip speed wind turbine blades, Grant No.: 8055-00012A.

Institutional Review Board Statement

Not applicable.

Informed Consent Statement

Not applicable.

Data Availability Statement

The data presented in this study are available on request from the corresponding author.

Acknowledgments

The authors H.H. and A.D. are grateful to Fanya Ismail from SGMA (Sol-Gel Materials & Applications Ltd.) Company, UK, for in-kind supply of sol-gel material and assistance from mechanical testing technician Dean Wells at Kingston University.

Conflicts of Interest

The authors declare no conflict of interest.

References

  1. Dao, C.; Kazemtabrizi, B.; Crabtree, C. Wind turbine reliability data review and impacts on levelised cost of energy. Wind Energy 2019, 22, 1848–1871. [Google Scholar] [CrossRef] [Green Version]
  2. Mishnaevsky, L., Jr.; Hasager, C.; Bak, C.; Tilg, A.M.; Bech, J.I.; Rad, S.D.; Fæster, S. Leading edge erosion of wind turbine blades: Understanding, prevention and protection. Renew. Energy 2021, 169, 953e969. [Google Scholar] [CrossRef]
  3. Mishnaevsky, L., Jr.; Thomsen, K. Costs of repair of wind turbine blades: Influence of technology aspects. Wind Energy 2020, 23, 2247–2255. [Google Scholar] [CrossRef]
  4. Fraisse, A.; Bech, J.; Borum, K.; Fedorov, V.; Frost-Jensen, N.; McGugan, M.; Mishnaevsky, L., Jr.; Kusano, Y. Impact fatigue damage of coated glass fibre reinforced polymer laminate. Renew. Energy 2018, 126, 1102–1112. [Google Scholar] [CrossRef] [Green Version]
  5. Mishnaevsky, L., Jr. Toolbox for optimizing anti-erosion protective coatings of wind turbine blades: Overview of mechanisms and technical solutions. Wind Energy 2019, 22, 1636–1653. [Google Scholar] [CrossRef]
  6. Beltzer, A.I.; Brauner, N. The dynamic response of random composites by a causal differential method. Mech. Mater. 1987, 6, 337–345. [Google Scholar] [CrossRef]
  7. Waterman, P.C.; Truell, R.I. Multiple scattering of waves. J. Math. Phys. 1961, 24, 512–537. [Google Scholar] [CrossRef]
  8. Rahimzadeh, M. Elastic wave propagation in nano-composites with random distribution of spherical inclusions. Lat. Am. J. Solids Struct. 2013, 10, 813–831. [Google Scholar] [CrossRef] [Green Version]
  9. Hu, B.; Hu, N.; Li, Y.; Akagi, K.; Yuan, W.; Watanabe, T.; Cai, Y. Multi-scale numerical simulations on piezoresistivity of CNT/polymer nanocomposites. Nanoscale Res. Lett. 2012, 7, 402. [Google Scholar] [CrossRef] [Green Version]
  10. Dai, G.M.; Mishnaevsky, L., Jr. Carbone nanotube reinforced hybrid composites: Computational modelling of environmental fatigue and usability for wind blades. Compos. Part B 2015, 78, 349–360. [Google Scholar] [CrossRef] [Green Version]
  11. Kang, I.; Schulz, M.J.; Kim, J.H.; Shanov, V.; Shi, D. A carbon nanotube strain sensor for structural health monitoring. Smart Mater. Struct. 2006, 15, 737. [Google Scholar] [CrossRef]
  12. Valaker, E.A.; Armada, S.; Wilson, S. Droplet erosion protection coatings for offshore wind turbine blades. Energy Procedia 2015, 80, 263–275. [Google Scholar] [CrossRef] [Green Version]
  13. Armada, S.; Bjørgum, A.; Knudsen, O.Ø.; Simon, C.; Pilz, M. Organic Coatings Reinforced with Ceramic Particles: An Erosion Study. 2010. NOWITECH. Available online: https://www.sintef.no/projectweb/nowitech/ (accessed on 10 September 2021).
  14. Gou, J.; Tang, Y.; Liang, F.; Zhao, Z.; Firsich, D.; Fielding, J. Carbon nanofiber paper for lightning strike protection of composite materials. Compos. Part B Eng. 2010, 41, 192–198. [Google Scholar] [CrossRef]
  15. Liang, F.; Gou, J.; Kapat, J.; Gu, H.; Song, G. Multifunctional nanocomposite coating for wind turbine blades. Int. J. Smart Nano Mater. 2011, 2, 120–133. [Google Scholar] [CrossRef]
  16. Diblíková, L.; Koukalová, A.; Kudláček, J.; Zoubek, M.; Herrmann, F. Properties of functional epoxy coatings modified by carbon nanoparticles. Solid State Phenom. 2014, 227, 127–130. [Google Scholar] [CrossRef]
  17. Grundwürmer, M.; Nuyken, O.; Meyer, M.; Wehr, J.; Schupp, N. Sol-gel derived erosion protection coatings against damage caused by liquid impact. Wear 2007, 263, 318–329. [Google Scholar] [CrossRef]
  18. Hintze-Bruening, H.; Leroux, F. Nanocomposite based multifunctional coatings. In New Advances in Vehicular Technology and Automotive Engineering; Carmo, J., Ed.; IntechOpen: London, UK, 2012. [Google Scholar] [CrossRef] [Green Version]
  19. Peng, H.-X. Polyurethane nanocomposite coatings for aeronautical applications. In Multifunctional Polymer Nanocomposites; Taylor and Francis: Abingdon, UK, 2010; pp. 337–387. [Google Scholar]
  20. Limmack, A.P. Development of Polyurethane Based Nanocomposite Coatings for Composite Structures in Harsh Environments. Ph.D. Thesis, University of Bristol, Bristol, UK, 2011. [Google Scholar]
  21. Malaki, M.; Hashemzadeh, Y.; Karevan, M. Effect of nano-silica on the mechanical properties of acrylic polyurethane coatings. Prog. Org. Coat. 2016, 101, 477–485. [Google Scholar] [CrossRef]
  22. Jespersen, K.M.; Monastyreckis, G.; Mishnaevsky, L., Jr. On the potential of particle engineered anti-erosion coatings for leading edge protection of wind turbine blades: Computational studies. In IOP Conference Series: Materials Science and Engineering, Proceedings of the 41st Risø Symposium, Roskiled, Denmark, 7–10 September 2020; IOP Publishing: Bristol, UK, 2020; Volume 942, p. 012027. [Google Scholar]
  23. Abenojar, J.; Tutor, J.; Ballesteros, Y.; del Real-Romero, J.C.; Martínez, M.A. Wear and cavitation effect in an epoxy filled with boron and silicon nanocarbides. In International Journal of Fracture Fatigue and Wear, Proceedings of the 4th International Conference on Fracture Fatigue and Wear (FFW 2015), Ghent, Belgium, 27–28 August 2015; Wahab, M.A., Ed.; Laboratory Soete—Ghent University: Zwijnaarde, Belgium, 2015; Volume 3, pp. 167–173. [Google Scholar]
  24. Abenojar, J.; Tutor, J.; Ballesteros, Y.; del Real, J.C.; Martínez, M.A. Friction wear behaviour of carbon based epoxy nanocomposites. In International Journal of Fracture Fatigue and Wear, Proceedings of the 3rd International Conference on Fracture Fatigue and Wear (FFW 2014), Kitakyushu, Japan, 1–3 September 2014; Wahab, M.A., Ed.; Laboratory Soete—Ghent University: Zwijnaarde, Belgium, 2014; Volume 2, pp. 281–287. [Google Scholar]
  25. Syamsundar, C.; Chatterjee, D.; Kamaraj, M.; Maiti, A.K. Erosion characteristics of nanoparticle-reinforced polyurethane coatings on stainless steel substrate. J. Mater. Eng. Perform. 2015, 24, 1391–1405. [Google Scholar] [CrossRef]
  26. Dashtkar, A.; Hadavinia, H.; Sahinkaya, M.; Williams, S.; Ismail, F.; Turner, M. Rain erosion-resistant coatings for wind turbine blades: A review. Polym. Polym. Compos. 2019, 27, 443–475. [Google Scholar] [CrossRef]
  27. Gohardani, O.; Williamson, D.M.; Hammond, D.W. Multiple liquid impacts on polymeric matrix composites reinforced with carbon nanotubes. Wear 2012, 294, 336–346. [Google Scholar] [CrossRef]
  28. Wojdyla, A.M.; Durand, G.; Taylor, A.; Boyd, I.W. Advanced low-energy durable coatings. Int. J. Energy Res. 2015, 39, 165–171. [Google Scholar] [CrossRef]
  29. Barkoula, N.-M.; Karger-Kocsis, J. Effects of fiber content and relative fiber-orientation on the solid particle erosion of GF/PP composites. Wear 2002, 252, 80–87. [Google Scholar] [CrossRef]
  30. Dai, G.M.; Mishnaevsky, L., Jr. Graphene monolayer nanocomposites: 3D simulation of damage and fracture. Comput. Mater. Sci. 2014, 95, 684–692. [Google Scholar] [CrossRef] [Green Version]
  31. Pontenfisso, A.; Mishnaevsky, L., Jr. Nanomorphology of graphene and CNT reinforced polymer and its effect on damage: Micromechanical numerical study. Compos. Part B Eng. 2016, 96, 338–349. [Google Scholar] [CrossRef]
  32. Kilikevicius, S.; Kvietkaite, S.; Mishnaevsky, L., Jr.; Omastová, M.; Aniskevich, A.; Zeleniakiene, D. Novel hybrid polymer composites with graphene and Mxene nano-reinforcements: Computational analysis. Polymers 2021, 13, 1013. [Google Scholar] [CrossRef]
  33. Prasad, K.E.; Das, B.; Maitra, U.; Ramamurty, U.; Rao, C.N.R. Extraordinary synergy in the mechanical properties of polymer matrix composites reinforced with 2 nanocarbons. Proc. Natl. Acad. Sci. USA 2009, 106, 13186–13189. [Google Scholar] [CrossRef] [Green Version]
  34. Li, W.; Dichiara, A.; Bai, J. Carbon nanotube–graphene nanoplatelet hybrids as high-performance multifunctional reinforcements in epoxy composites. Compos. Sci. Technol. 2013, 74, 221–227. [Google Scholar] [CrossRef]
  35. Yue, L.; Pircheraghi, G.; Monemian, S.A.; Manas-Zloczower, I. Epoxy composites with carbon nanotubes and graphene nanoplatelets—Dispersion and synergy effects. Carbon 2014, 78, 268–278. [Google Scholar] [CrossRef]
  36. Chatterjee, S.; Nafezarefi, F.; Tai, N.H.; Schlagenhauf, L.; Nüesch, F.A.; Chu, B.T.T. Size and synergy effects of nanofiller hybrids including graphene nanoplatelets and carbon nanotubes in mechanical properties of epoxy composites. Carbon 2012, 50, 5380–5386. [Google Scholar] [CrossRef]
  37. Mishnaevsky, L., Jr.; Fæster, S.; Mikkelsen, L.P.; Kusano, Y.; Bech, J.I. Micromechanisms of leading edge erosion of wind turbine blades: X-ray tomography analysis and computational studies. Wind Energy 2019, 23, 547–562. [Google Scholar] [CrossRef]
  38. Fæster, S.; Johansen, N.F.J.; Mishnaevsky, L., Jr.; Kusano, Y.; Bech, J.I.; Madsen, M.B. Rain erosion of wind turbine blades and the effect of air bubbles in the coatings. Wind Energy 2021. [Google Scholar] [CrossRef]
  39. Mishnaevsky, L., Jr. Repair of wind turbine blades: Review of methods and related computational mechanics problems. Renew. Energy 2019, 140, 828–839. [Google Scholar] [CrossRef]
  40. Zhang, S.; Dam-Johansen, K.; Nørkjær, S.; Bernad, P.L.; Kiil, S. Erosion of wind turbine blade coatings—Design and analysis of jet-based laboratory equipment for performance evaluation. Prog. Org. Coat. 2015, 78, 103–115. [Google Scholar] [CrossRef]
  41. DNV-GL. Recommended Practice—DNVGL-RP-0171; DNV-GL: Oslo, Norway, 2018. [Google Scholar]
  42. DNVGL-RP-0573: Evaluation of Erosion and Delamination for Leading Edge Protection Systems of Rotor Blades. December 2020. Available online: https://standards.globalspec.com/std/14351426/DNVGL-RP-0573 (accessed on 10 September 2021).
  43. Prayogo, G.; Homma, H.; Soemardi, T.P.; Danardono, A.S. Impact fatigue damage of GFRP materials due to repeated raindrop collisions. Trans. Indian Inst. Met. 2011, 64, 501–506. [Google Scholar] [CrossRef]
  44. Adler, W.F. Rain impact retrospective and vision for the future. Wear 1999, 233–235, 25–38. [Google Scholar] [CrossRef]
  45. Graham, M.E.; Carlyle, J.D.; Menna, T.L. Facility for high-speed particle impact testing. Rev. Sci. Instrum. 1975, 46, 1221–1225. [Google Scholar] [CrossRef]
  46. Elhadi Ibrahim, M.; Medraj, M. Water droplet erosion of wind turbine blades: Mechanics, testing, modeling and future perspectives. Materials 2019, 13, 157. [Google Scholar] [CrossRef] [PubMed] [Green Version]
  47. Springer, G.S. Erosion by Liquid Impact; Scripta Publishing Co—A Division of Scripta Technica, Inc.: Dallas, TX, USA, 1976. [Google Scholar]
  48. Gohardani, O. Impact of erosion testing aspects on current and future flight conditions. Prog. Aerosp. Sci. 2011, 47, 280–303. [Google Scholar] [CrossRef]
  49. Weigel, W.D. Advanced Rotor Blade Erosion Protection System; Defense Technical Information Center: Fort Belvoir, VA, USA, 1996. [Google Scholar]
  50. Rad, S.D.; Mishnaevsky, L., Jr. Leading edge erosion of wind turbine blades: Computational modelling of multiaxial fatigue. Wind Energy 2020, 23, 1752–1766. [Google Scholar]
  51. Johansen, N.F.-J. Test Methods for Evaluating Rain Erosion Performance of Wind Turbine Blade Leading Edge Protection Systems; DCAMM Special Report No. S276; Technical University of Denmark: Lyngby, Denmark, 2020. [Google Scholar]
  52. Mishnaevsky, L., Jr.; Sütterlin, J. Micromechanical model of surface erosion of polyurethane coatings on wind turbine blades. Polym. Degrad. Stab. 2019, 166, 283–289. [Google Scholar] [CrossRef]
  53. Dashtkar, A.; Hadavinia, H.; Barros-Rodriguez, J.; Williams, N.A.; Turner, M.; Vahid, S. Quantifying damping coefficient and attenuation at different frequencies for graphene modified polyurethane by drop ball test. Polym. Test. 2021, 100, 107267. [Google Scholar] [CrossRef]
  54. Gaertner, E.; Rinker, J.; Sethuraman, L.; Zahle, F.; Anderson, B.; Barter, G.E.; Abbas, N.J.; Meng, F.; Bortolotti, P.; Skrzypinski, W.; et al. Definition of the IEA 15-Megawatt Offshore Reference Wind Turbine; Technical Report NREL/TP-5000-75698; National Renewable Energy Lab. (NREL): Golden, CO, USA, 2020; pp. 1–44. [Google Scholar] [CrossRef]
  55. Adler, W.F. Liquid drop collisions on deformable media. J. Mater. Sci. 1977, 12, 1253–1271. [Google Scholar] [CrossRef]
  56. ASTM. Standard practice for statistical analysis of linear or linearized stress-life (S-N). In Annual Book of ASTM Standards i(Reapproved); American Society for Testing Materials: West Conshohocken, PA, USA, 2012; pp. 1–7. [Google Scholar] [CrossRef]
Figure 1. Schema of stress waves reflection and scattering in the coating reinforced by graphene particles (left) and hybrid particles (right) (with anticipated better dispersion and particle network).
Coatings 11 01104 g001
Figure 2. (a) The Single Point Impacts Fatigue Tester (SPIFT) erosion testing setup. (b) High speed camera (Phantom v2512 fast) for filming the ball impacts at 380,000 fps.
Coatings 11 01104 g002
Figure 3. The arrangement of the IR camera in test setup.
Coatings 11 01104 g003
Figure 4. (a) Time-temperature variation of the PU coating, the temperature is the average temperature within the impact area shown in blue, and on the second y axis, the corresponding impact speed shown in red dots can be seen. (b) The measured time to thermal equilibrium as a function of the impact speed data fitted with an exponential curve to construct an empirical function for cool-down time as a function of impact speed.
Coatings 11 01104 g004aCoatings 11 01104 g004b
Figure 5. (a) Aluminum mold for casting thin coating film; (b) A finished rain erosion specimen with PU + GNP top coat.
Coatings 11 01104 g005
Figure 6. SPIFT tests results for PU, PU + GNP, and PU + GNP + SG at 173 m/s, each color represents a single test.
Coatings 11 01104 g006
Figure 7. The extent of damage to the three coatings at various stages of the ball impact testing, from the 3 different coatings PU, PU + GNP, and PU + GNP + SG. Images are extracted stills during testing, from the DinoLite microscope.
Coatings 11 01104 g007
Figure 8. Impacts to failure at 150 m/s for PU, PU + GNP, PU + GNP + SG. Each color represents a single test.
Coatings 11 01104 g008
Figure 9. VN curves of PU, PU + GNP, and PU + GNP + SG tested at 173 and 150 m/s and fitted by a power curve. Damage was evaluated at the point of material loss. The lines correspond to the following cases: green line (left): PU, red line (middle): PU + GNP; blue line (right): PU + GNP + SG.
Coatings 11 01104 g009
Figure 10. Thermographs of (a) PU impacted at 170.9 m/s, (b) PU + GNP impacted at 169.2 m/s, (c) PU + GNP + SG impacted at 170.5 m/s. These data where chosen as they closely match the same impact speed, and the high impact speed gives good thermal contrast.
Coatings 11 01104 g010
Figure 11. Change in kinetic energy resulting from the impact with the stationary target.
Coatings 11 01104 g011
Figure 12. SEM micrographs of (a) PU, (b) PU + GNP, and (c) PU + GNP + SG.
Coatings 11 01104 g012
Figure 13. Peak ∆T Impact heating as a function of impact speed for the three different coatings.
Coatings 11 01104 g013
Publisher’s Note: MDPI stays neutral with regard to jurisdictional claims in published maps and institutional affiliations.

