
Improvement of Mechanical and Corrosion Properties of Commercially Pure Titanium Using Alumina PEO Coatings

 ,
,  ,
, 
Abstract
:1. Introduction
2. Materials and Methods
2.1. Coating Production
2.2. Coating Characterization
3. Results
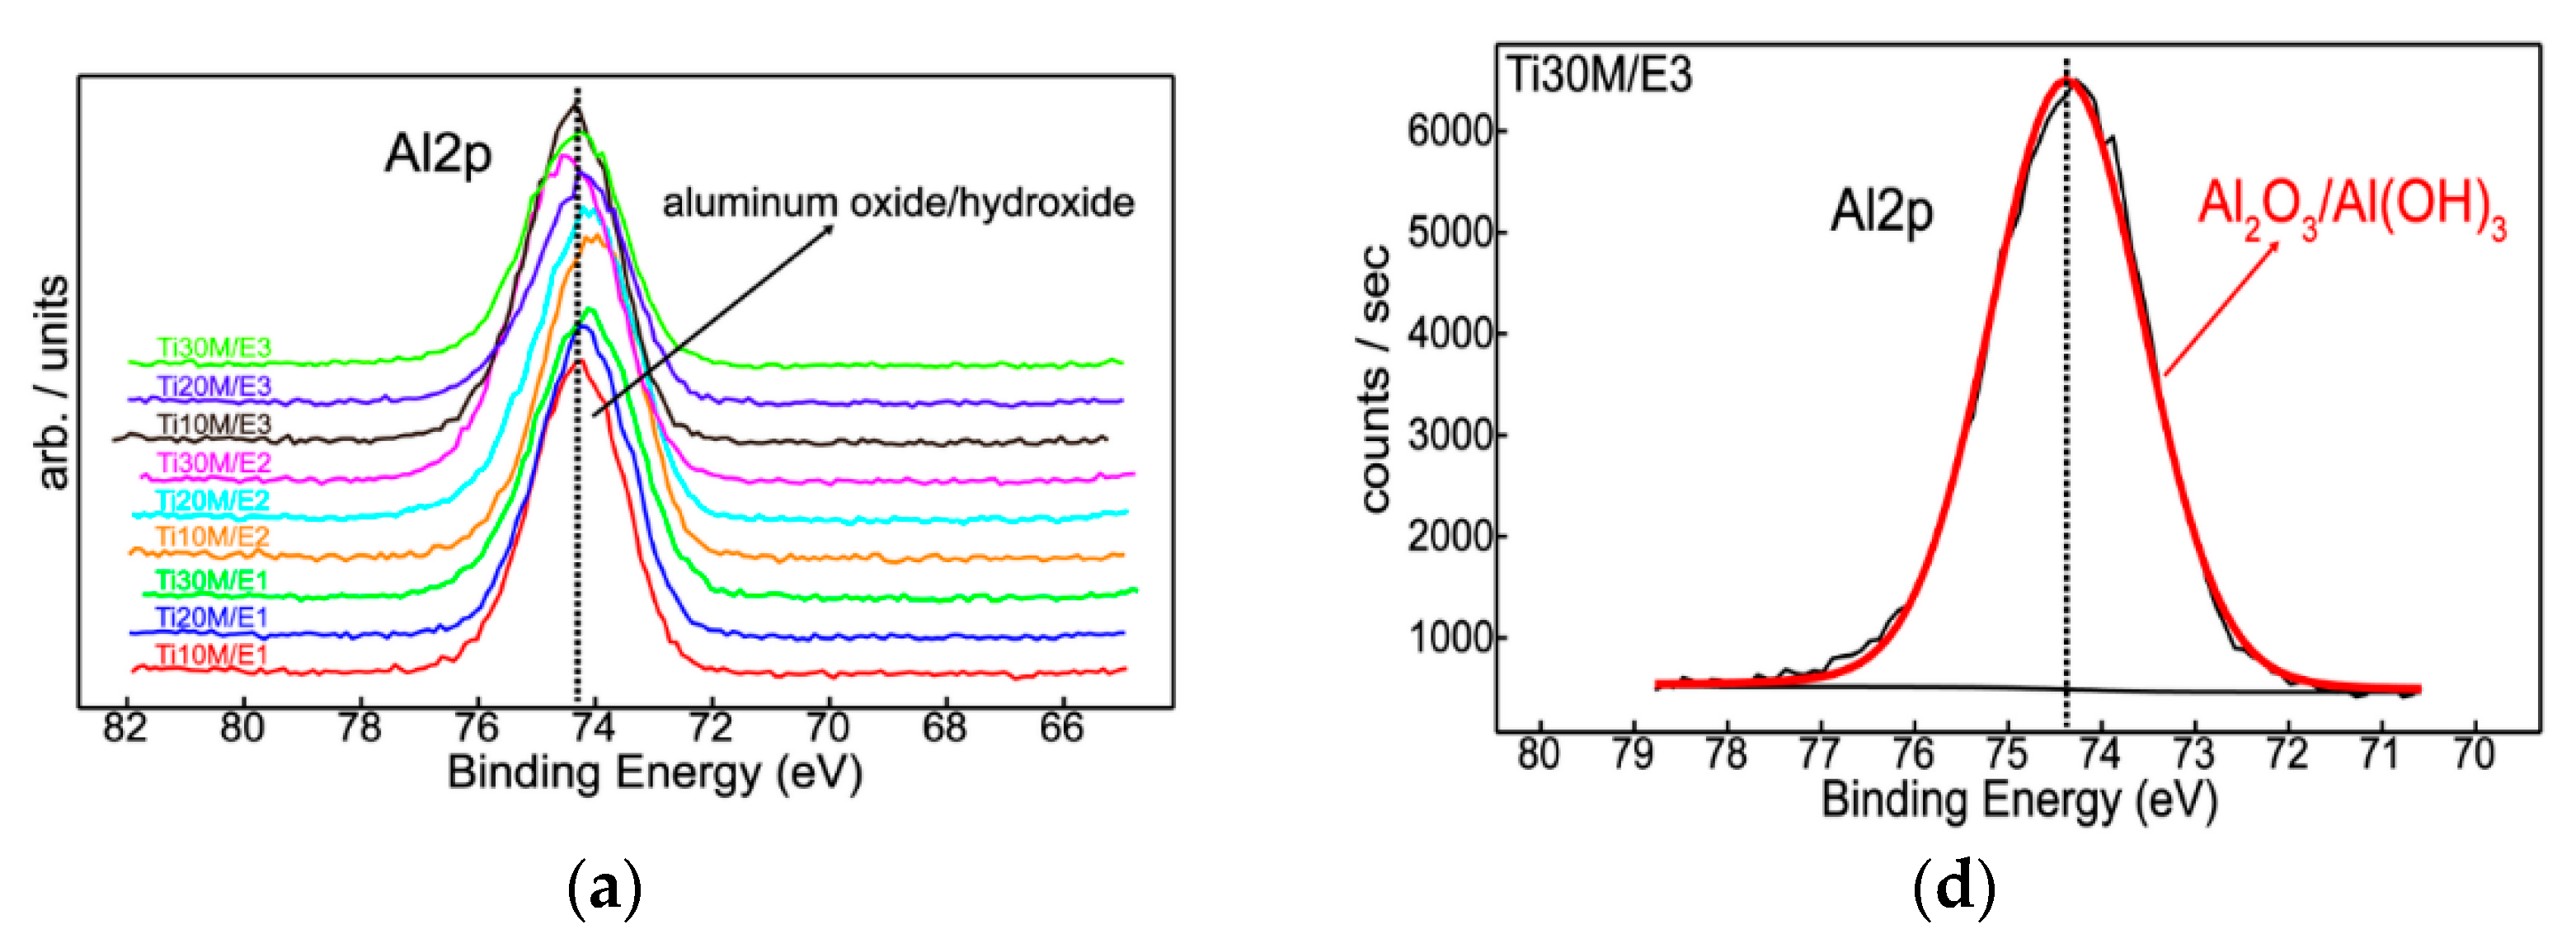
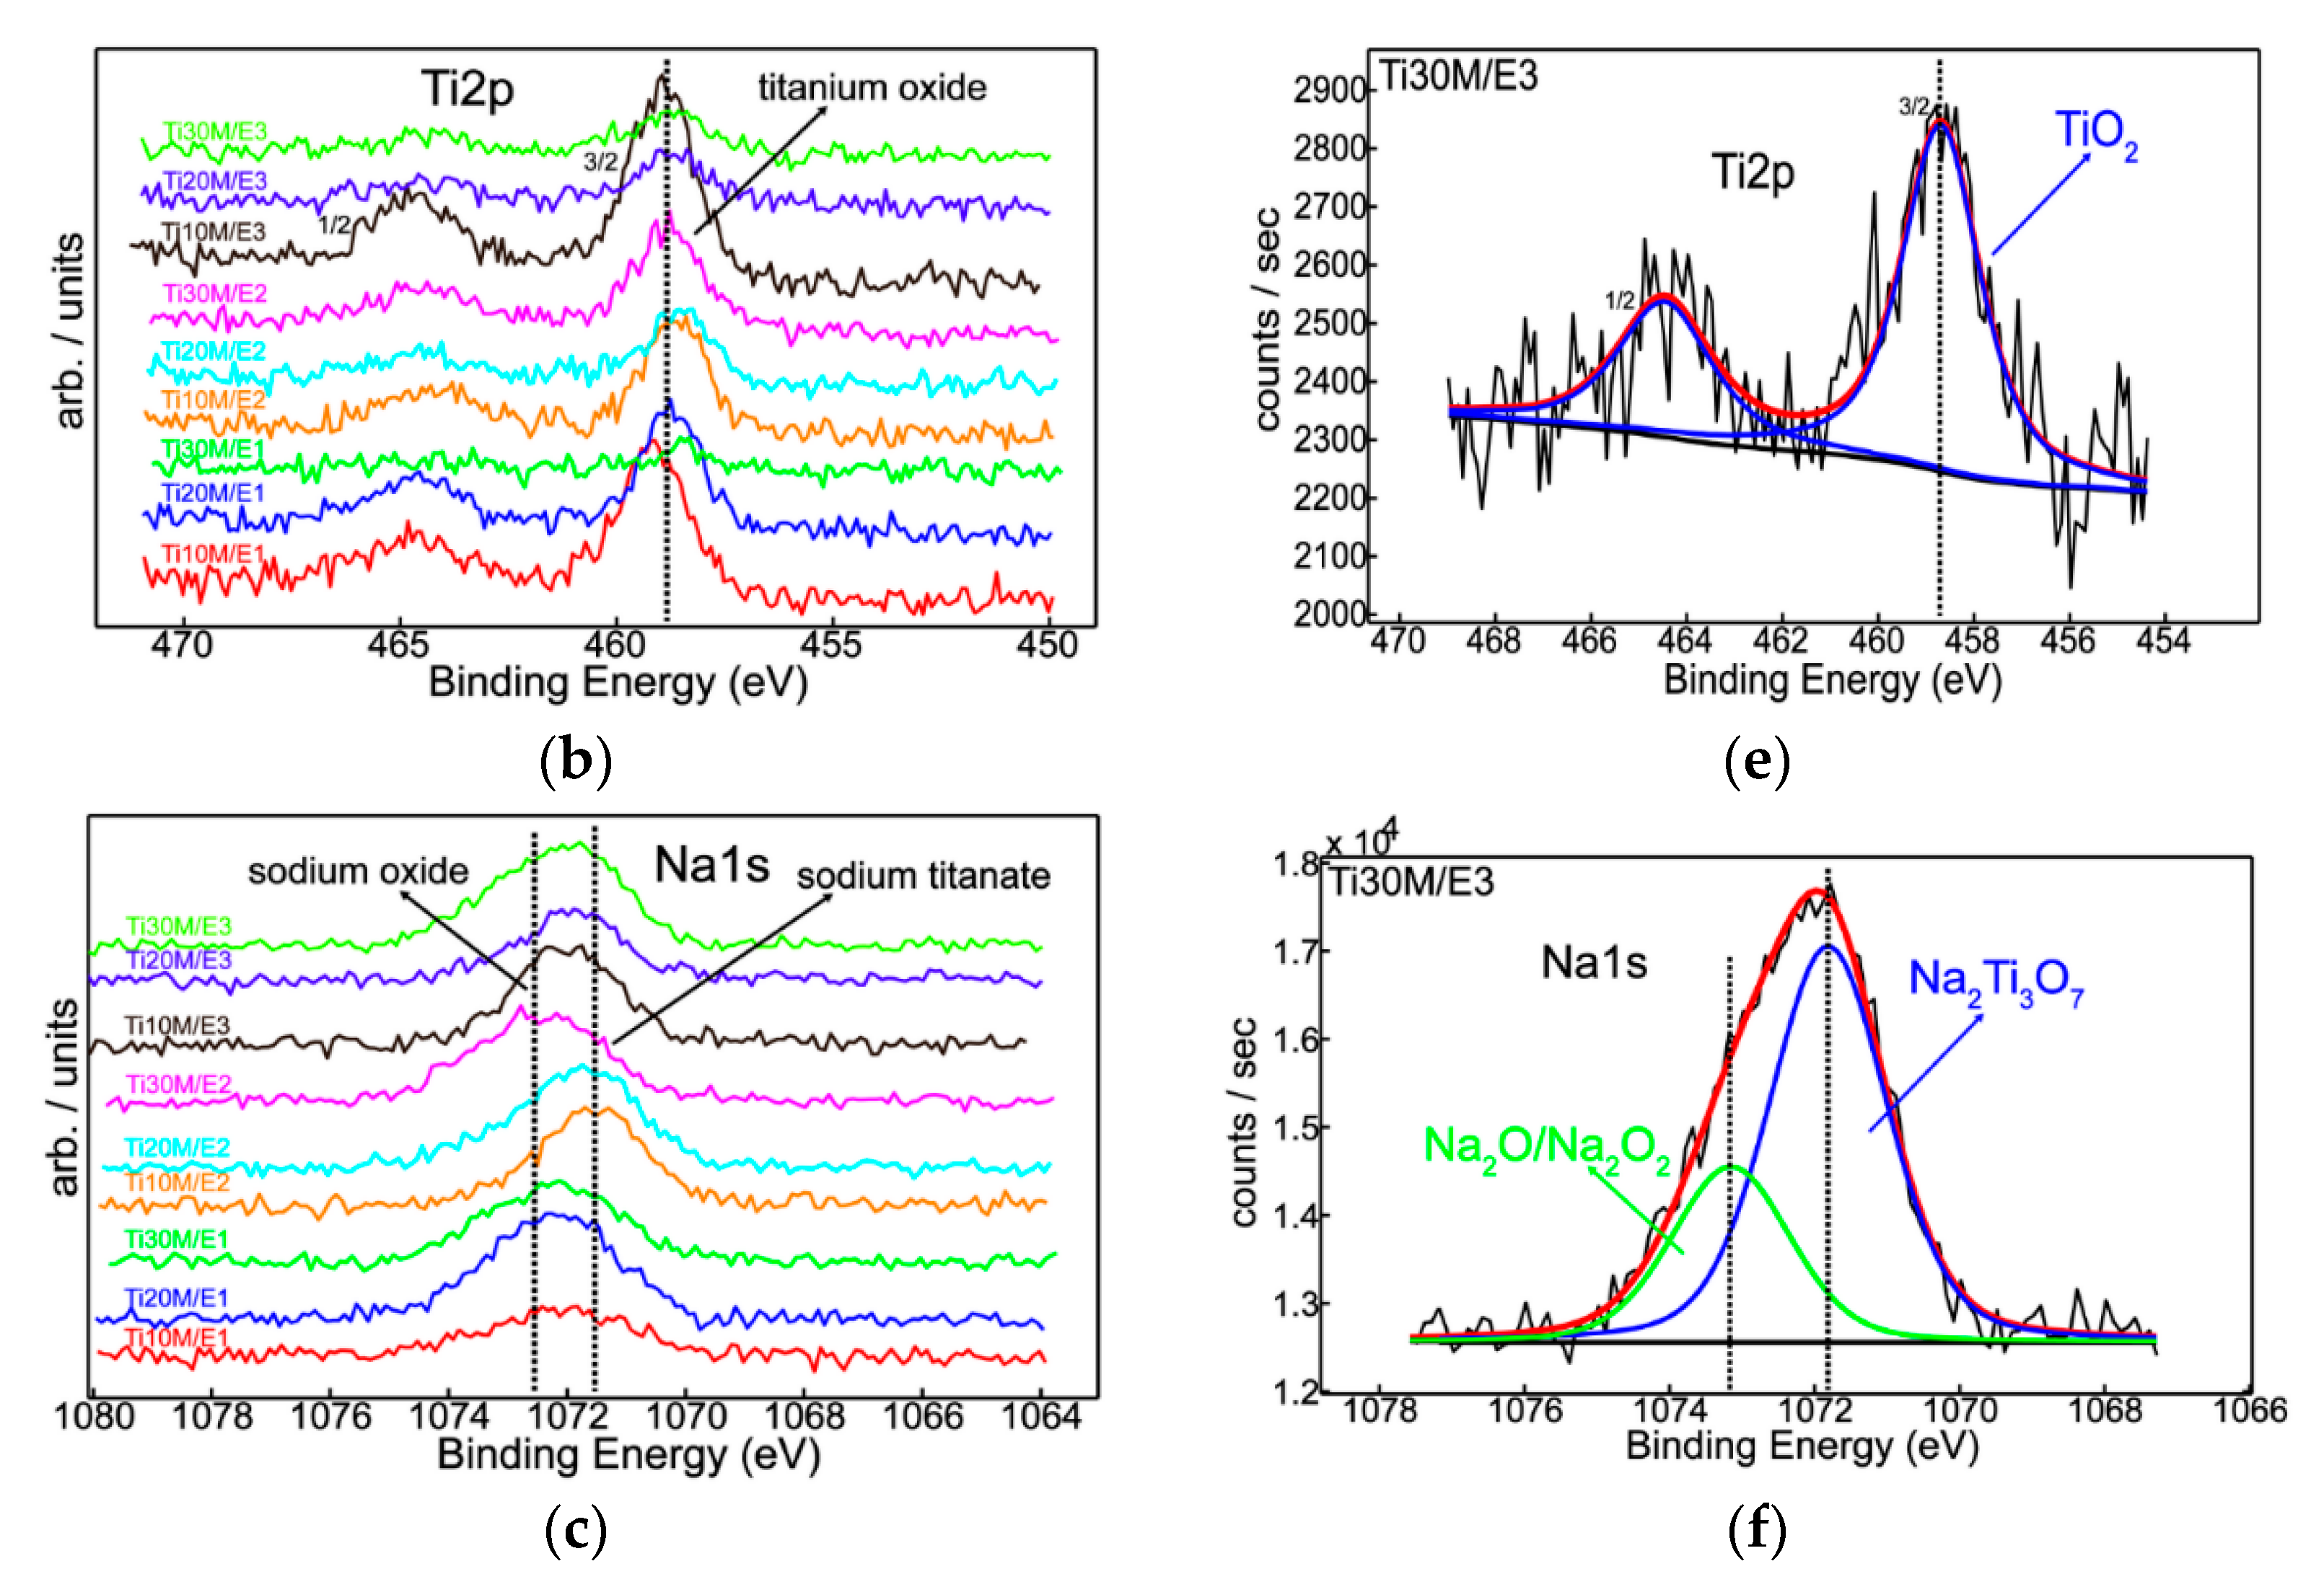
3.1. XPS
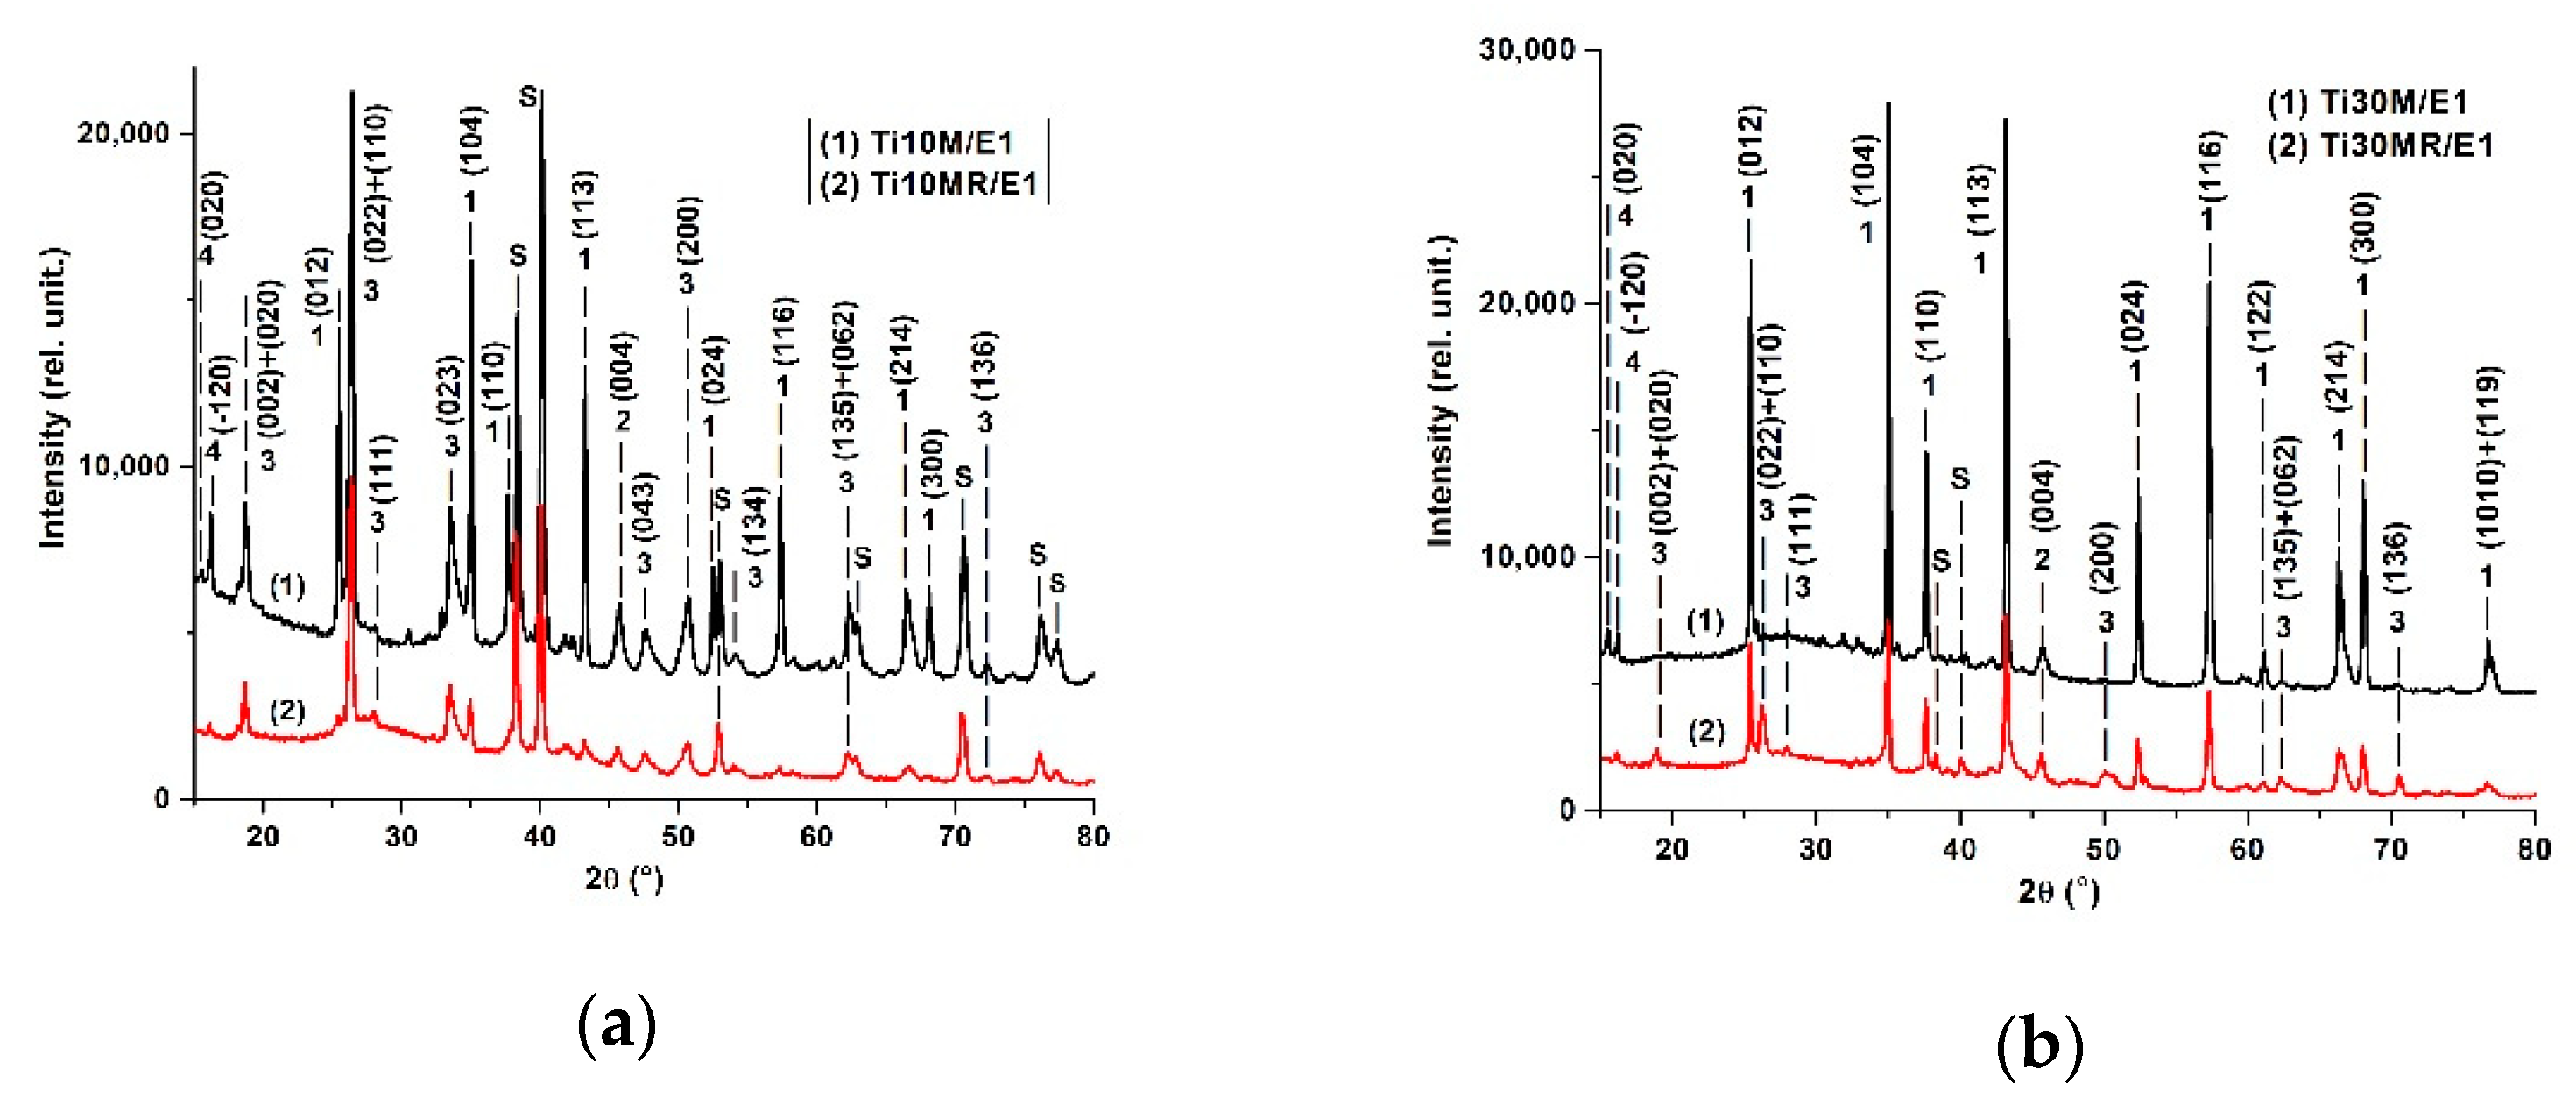
3.2. XRD Analysis
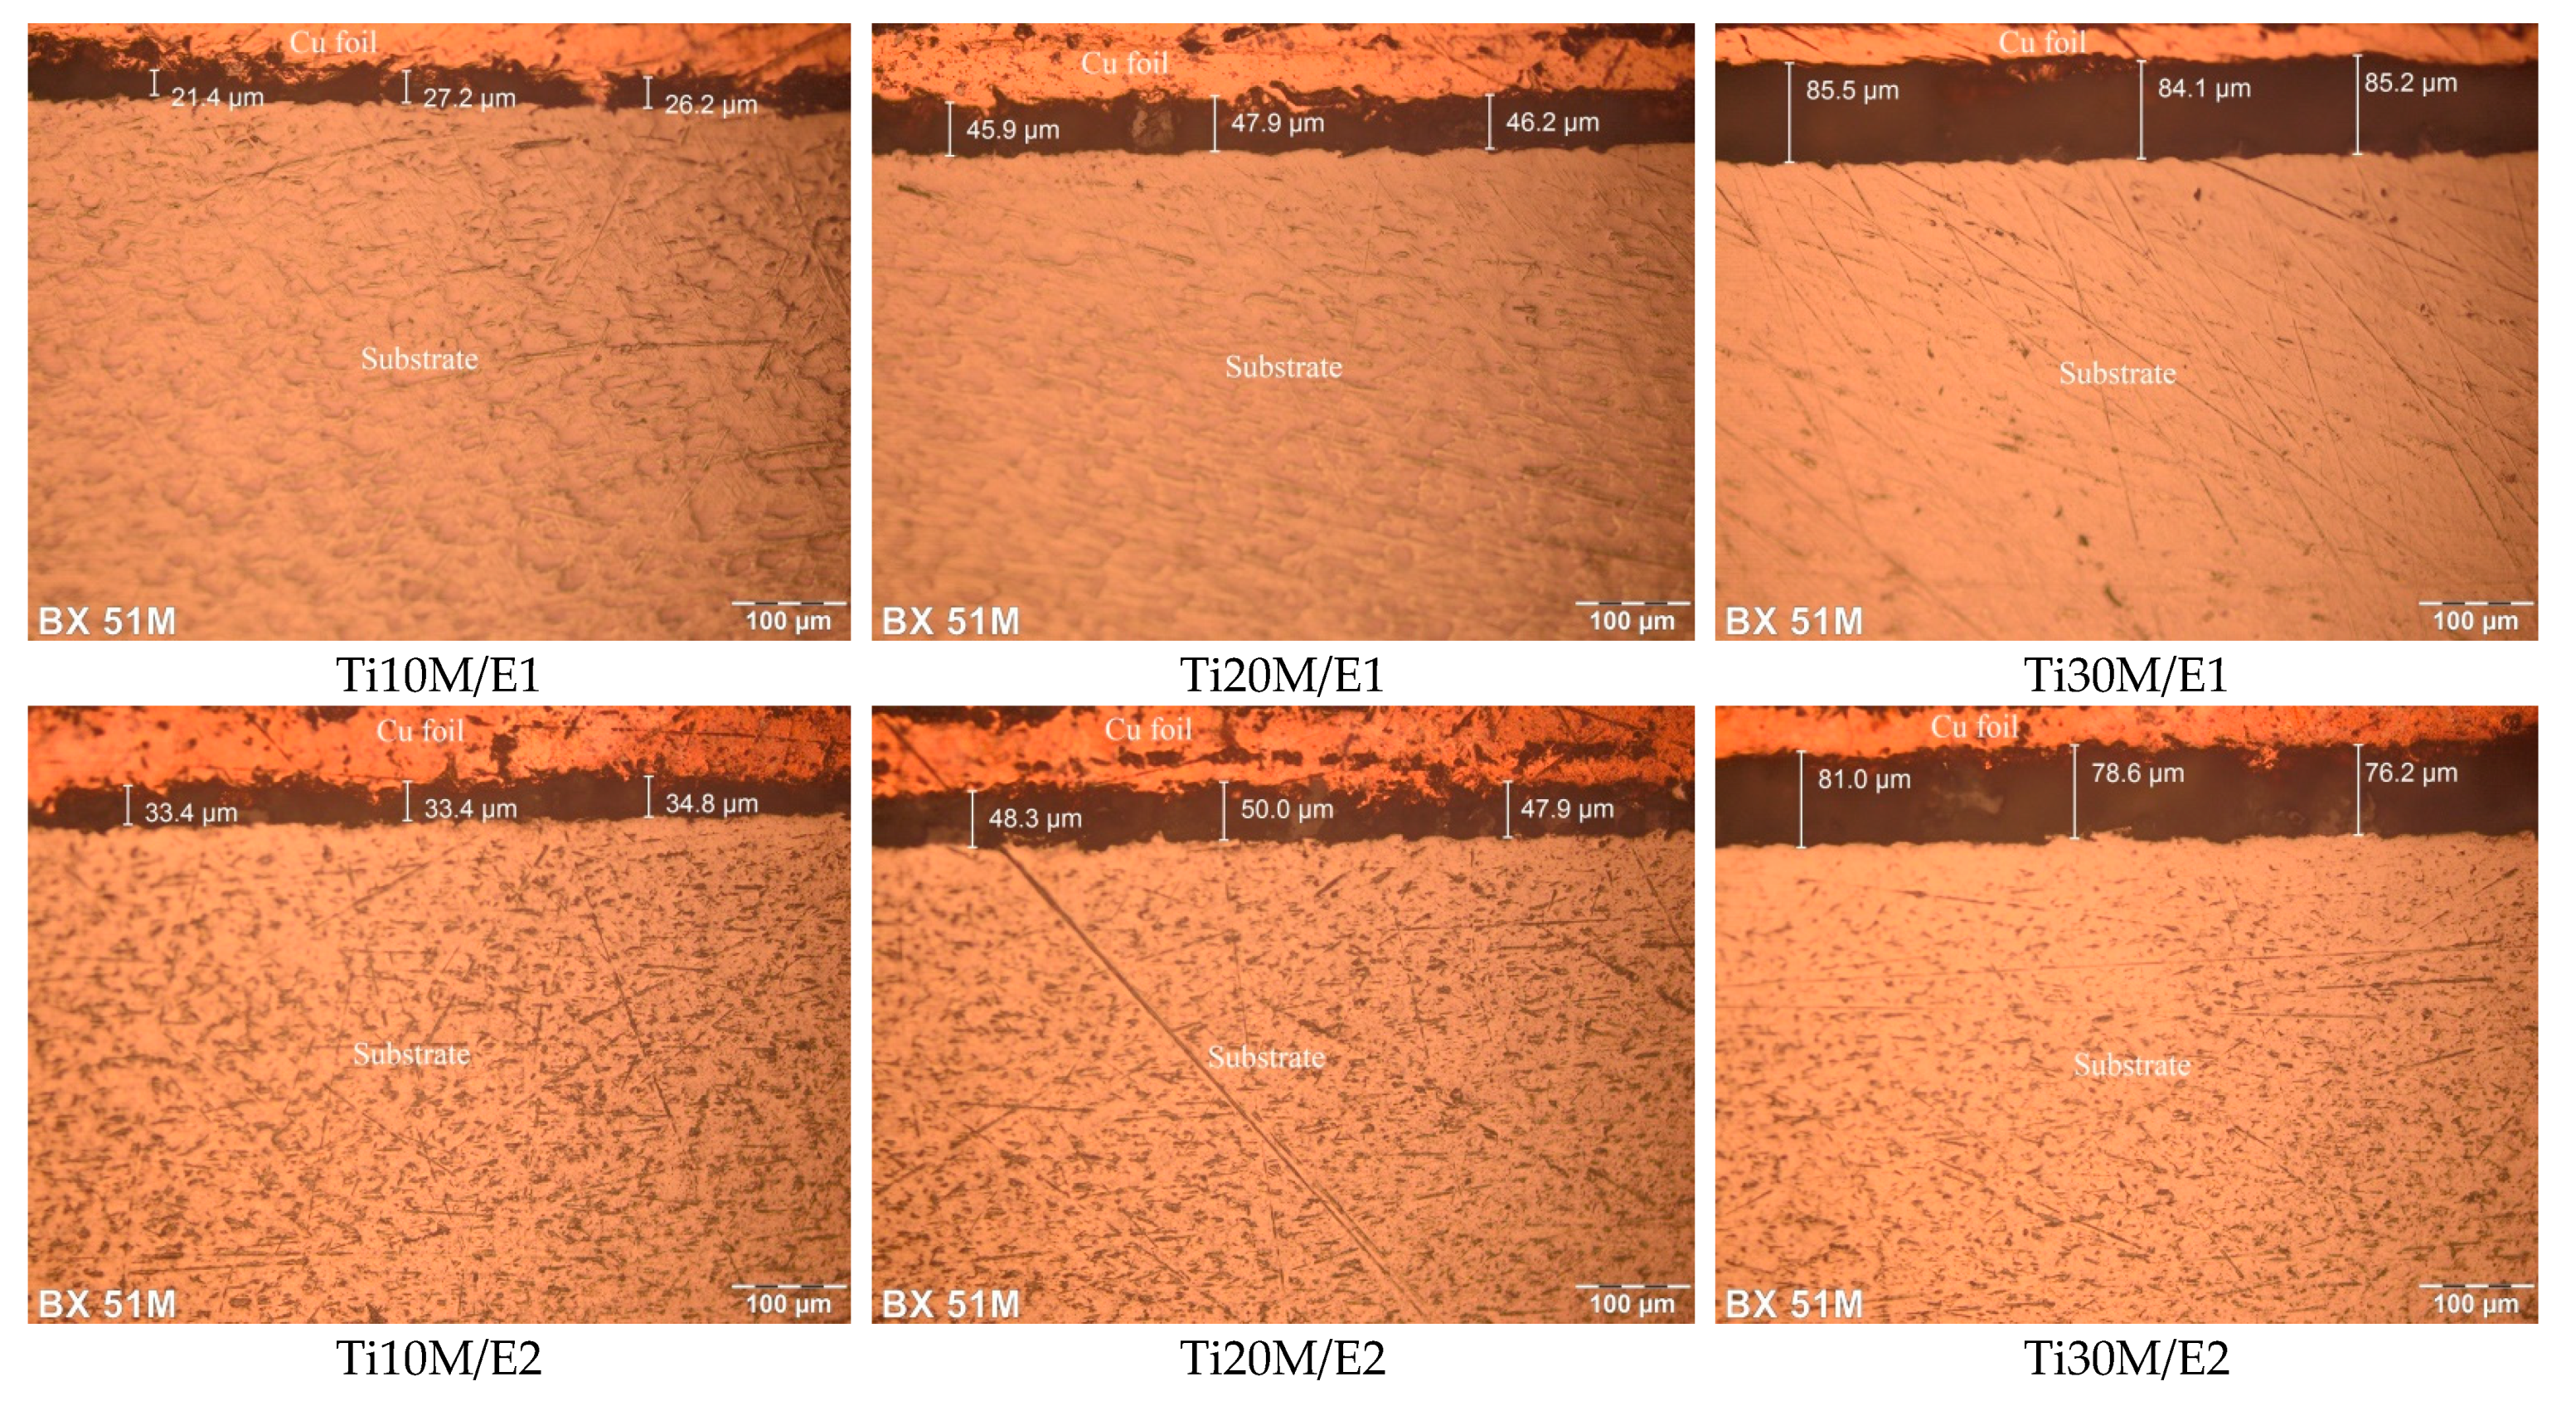
3.3. Layer Thickness
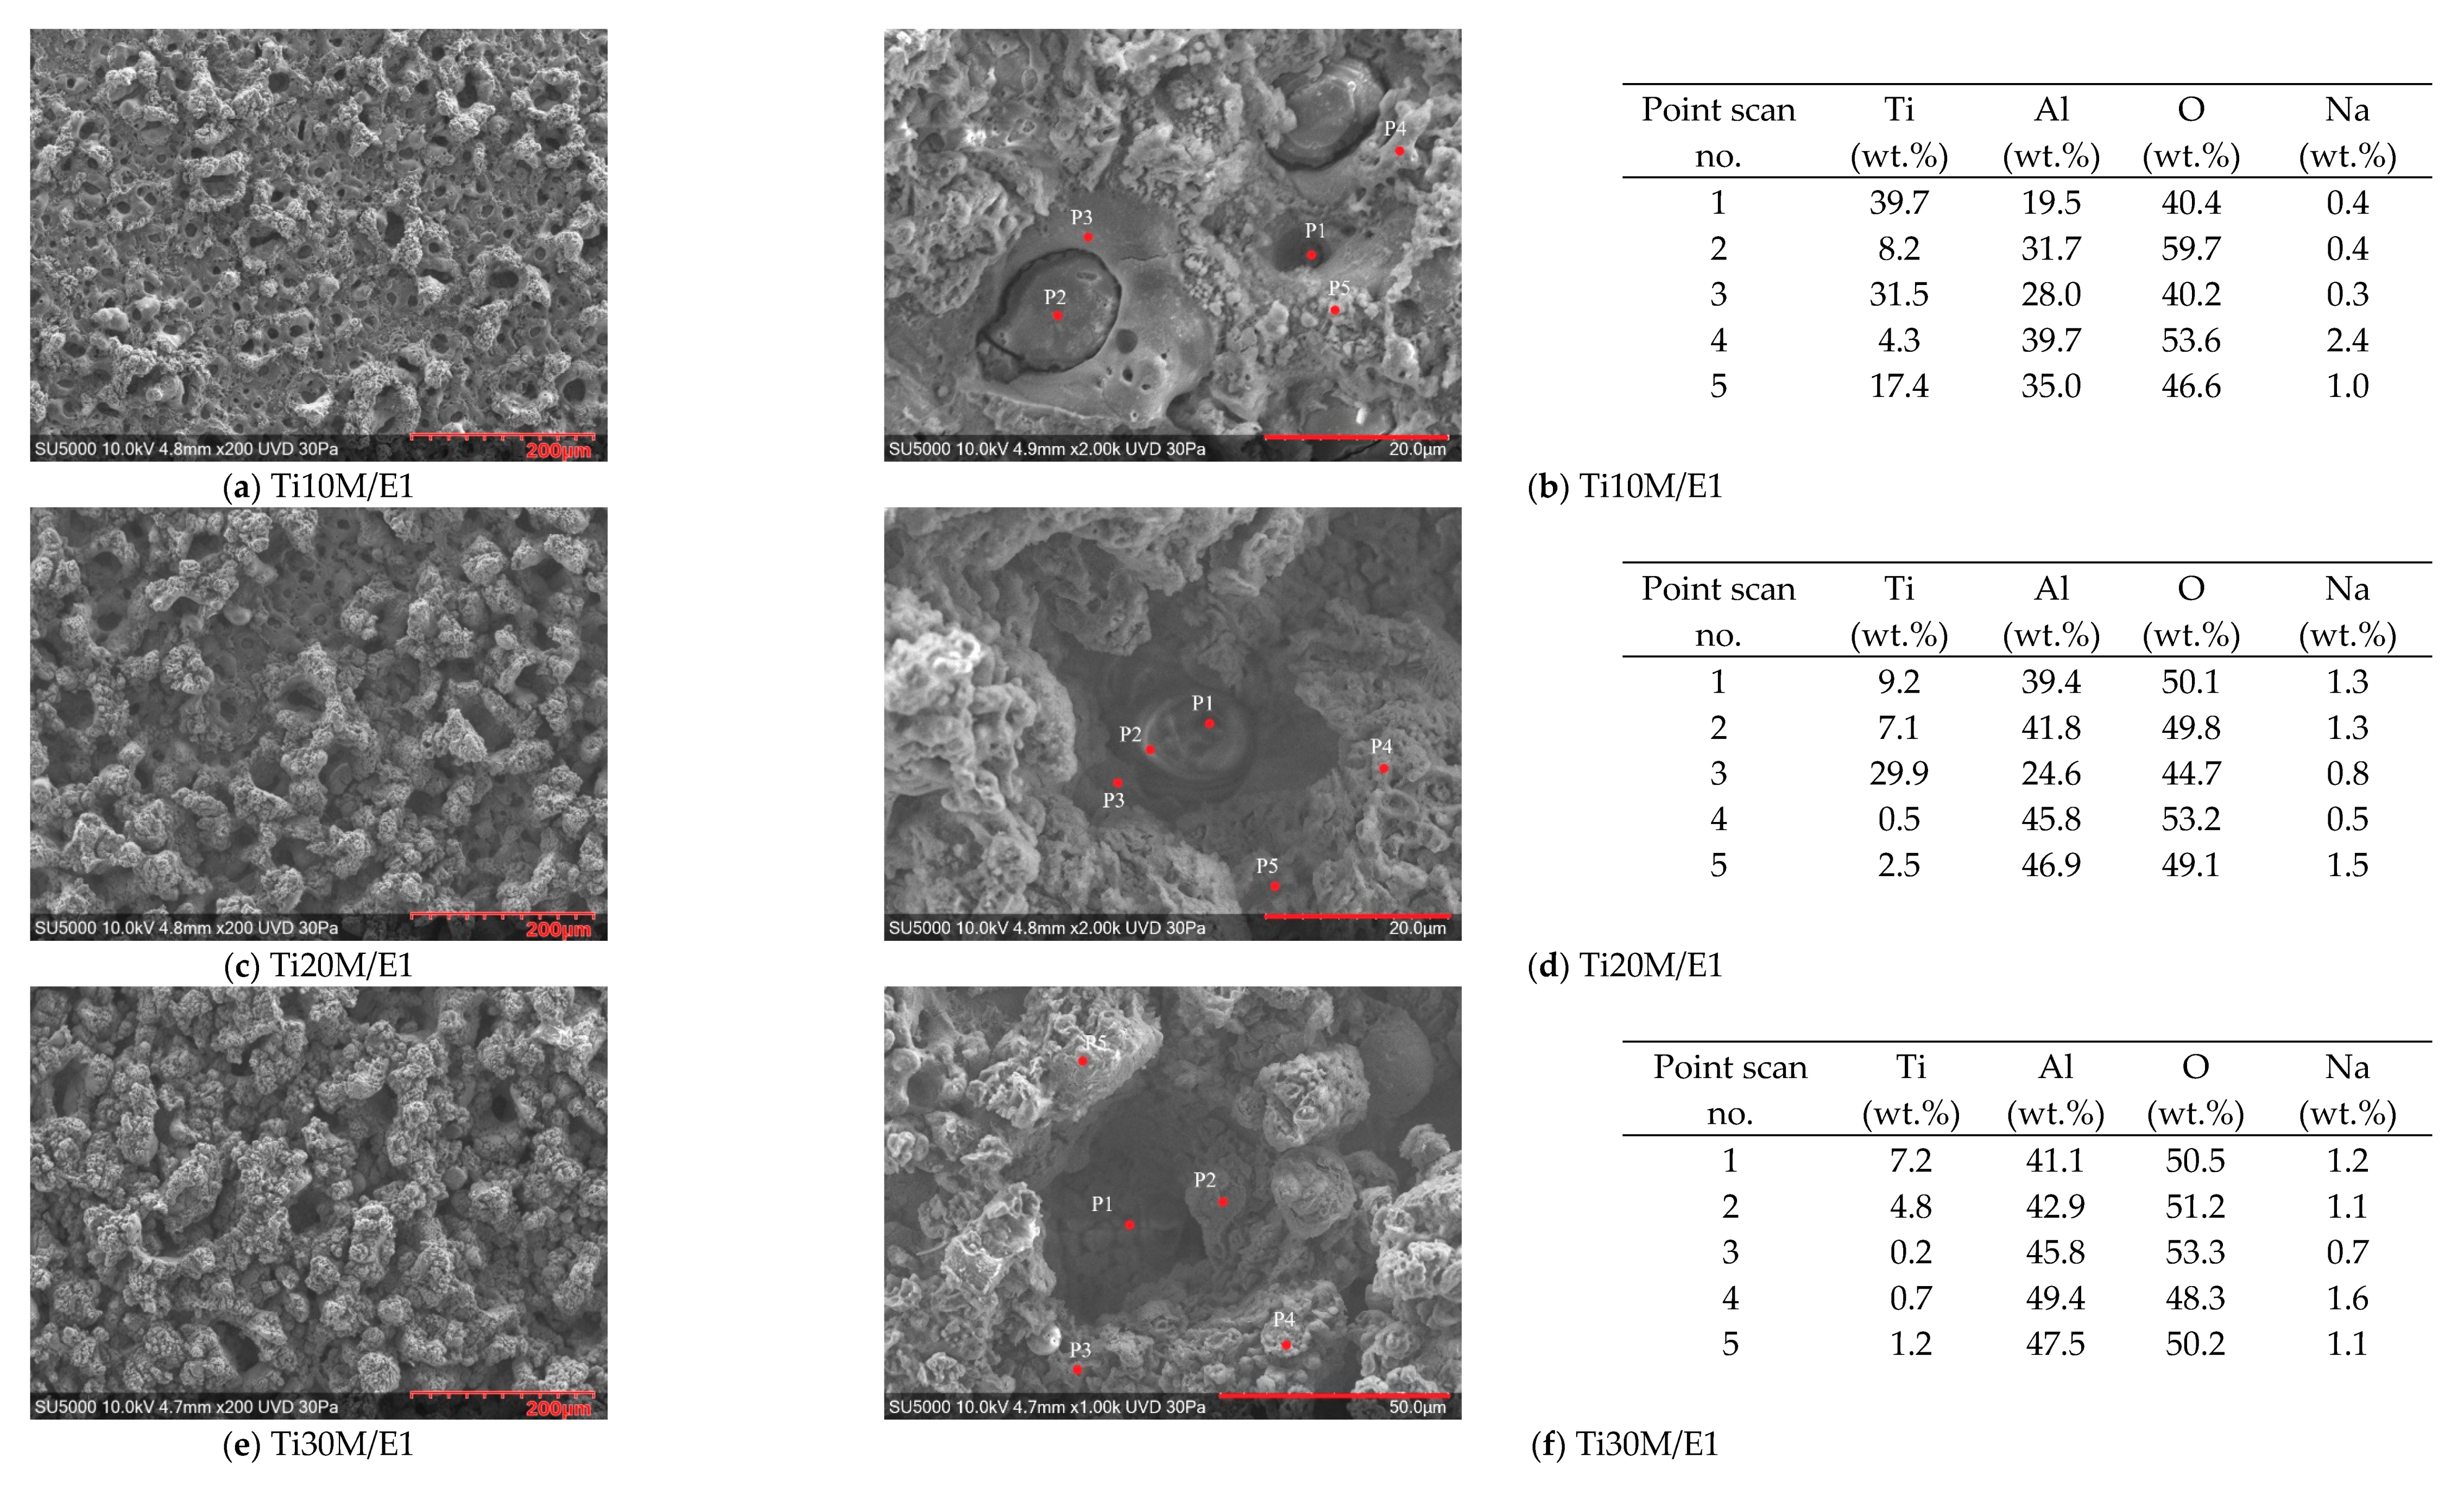
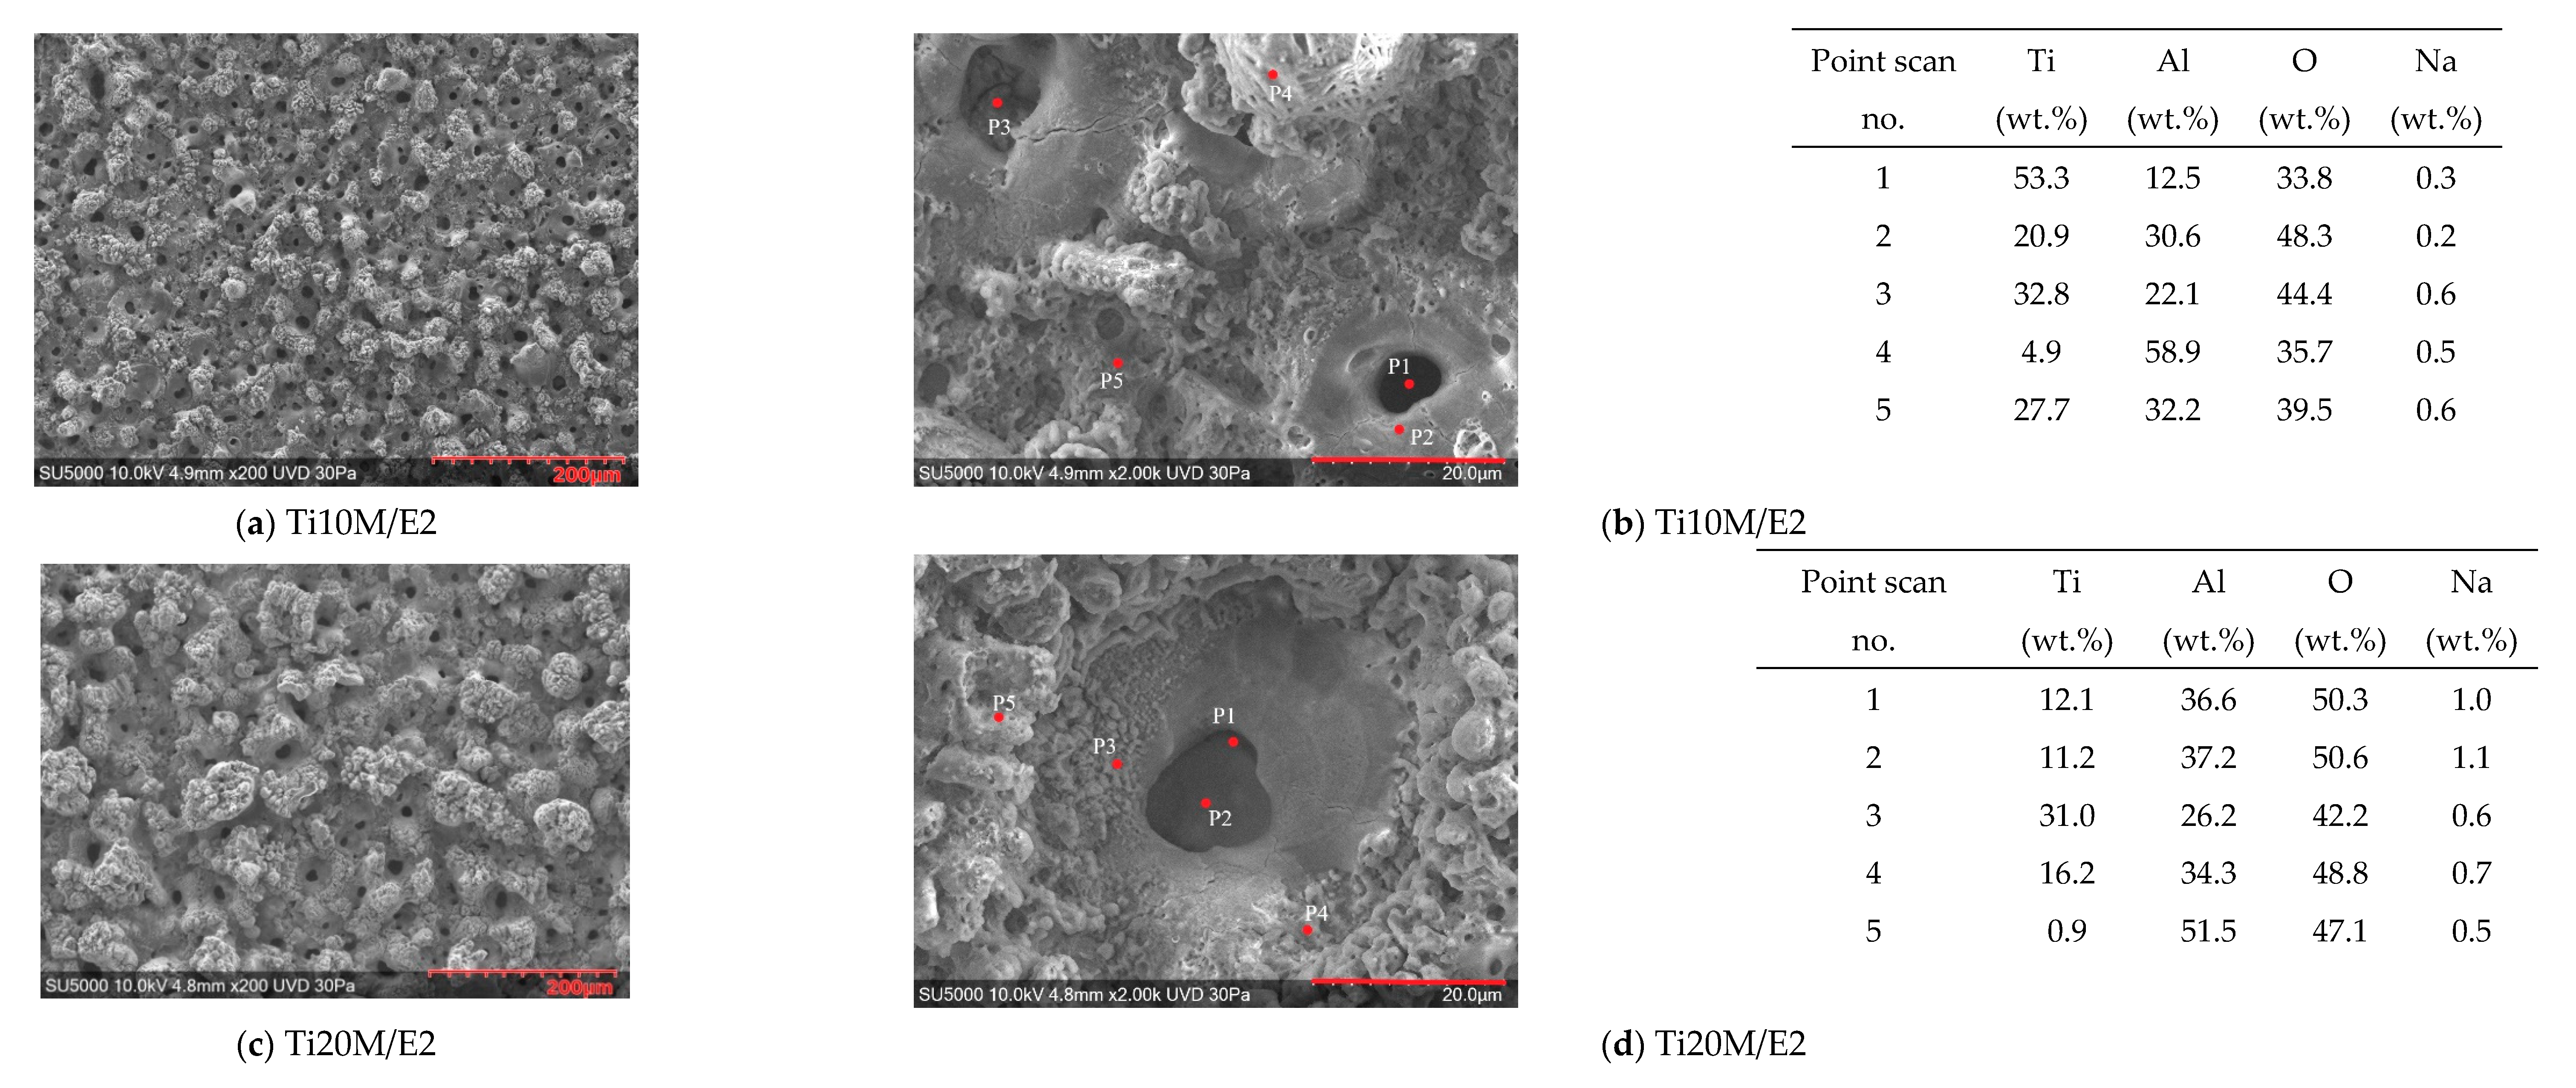
3.4. SEM/EDS Surface Morphology of the PEO Coatings
3.5. Cross-Sectional SEM/EDS Analysis of the Layers
3.6. Microhardness
3.7. Adhesion Strength
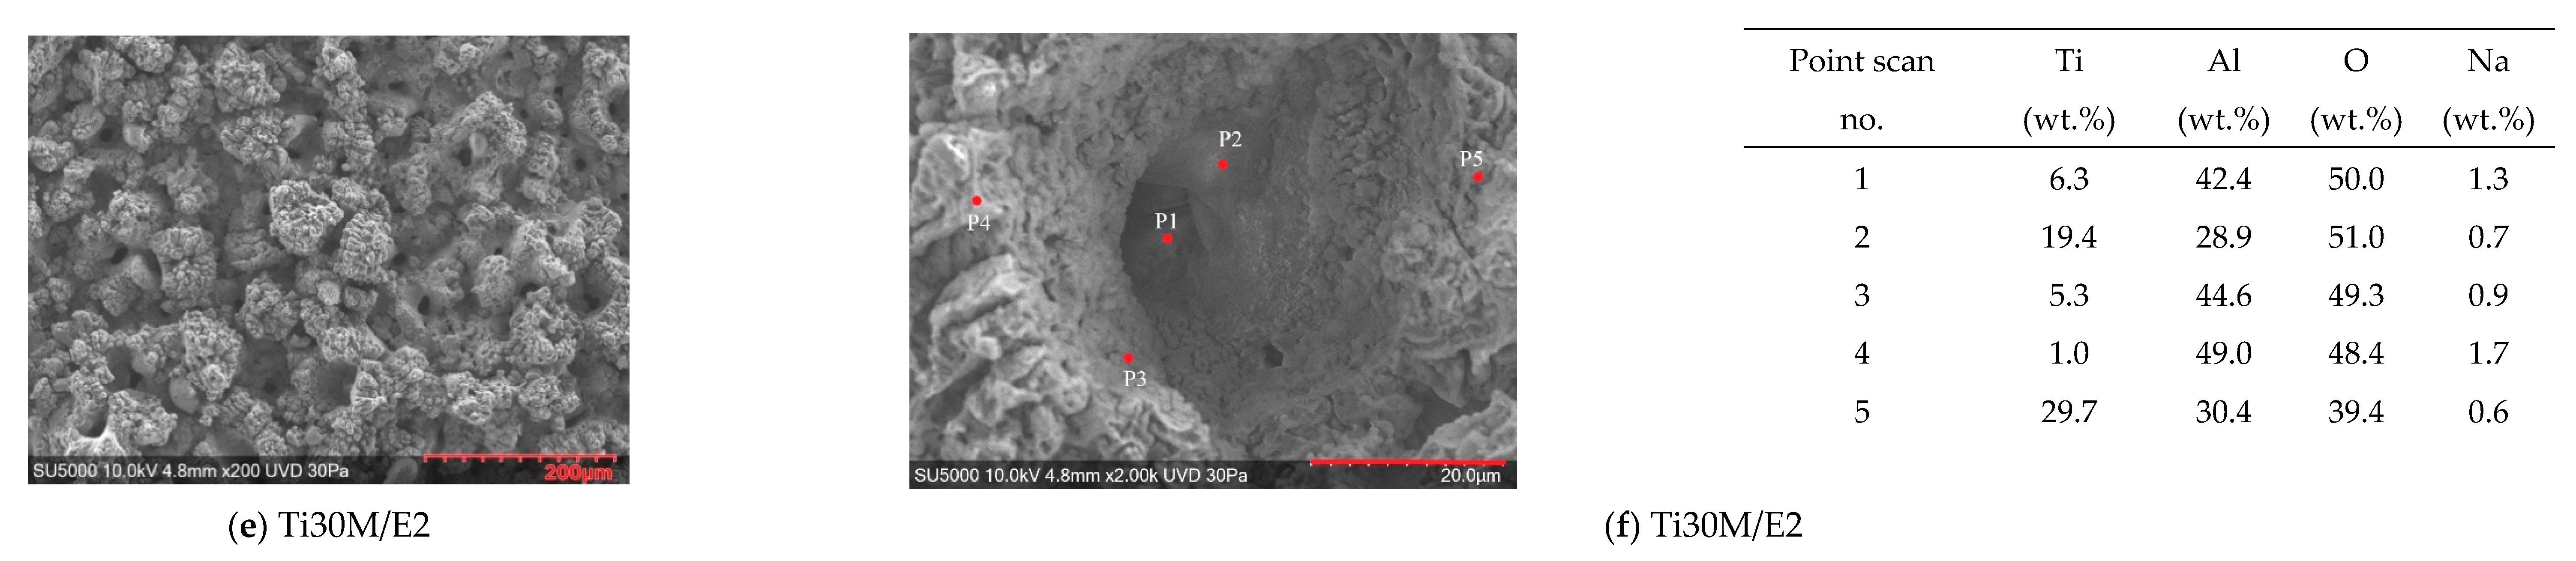
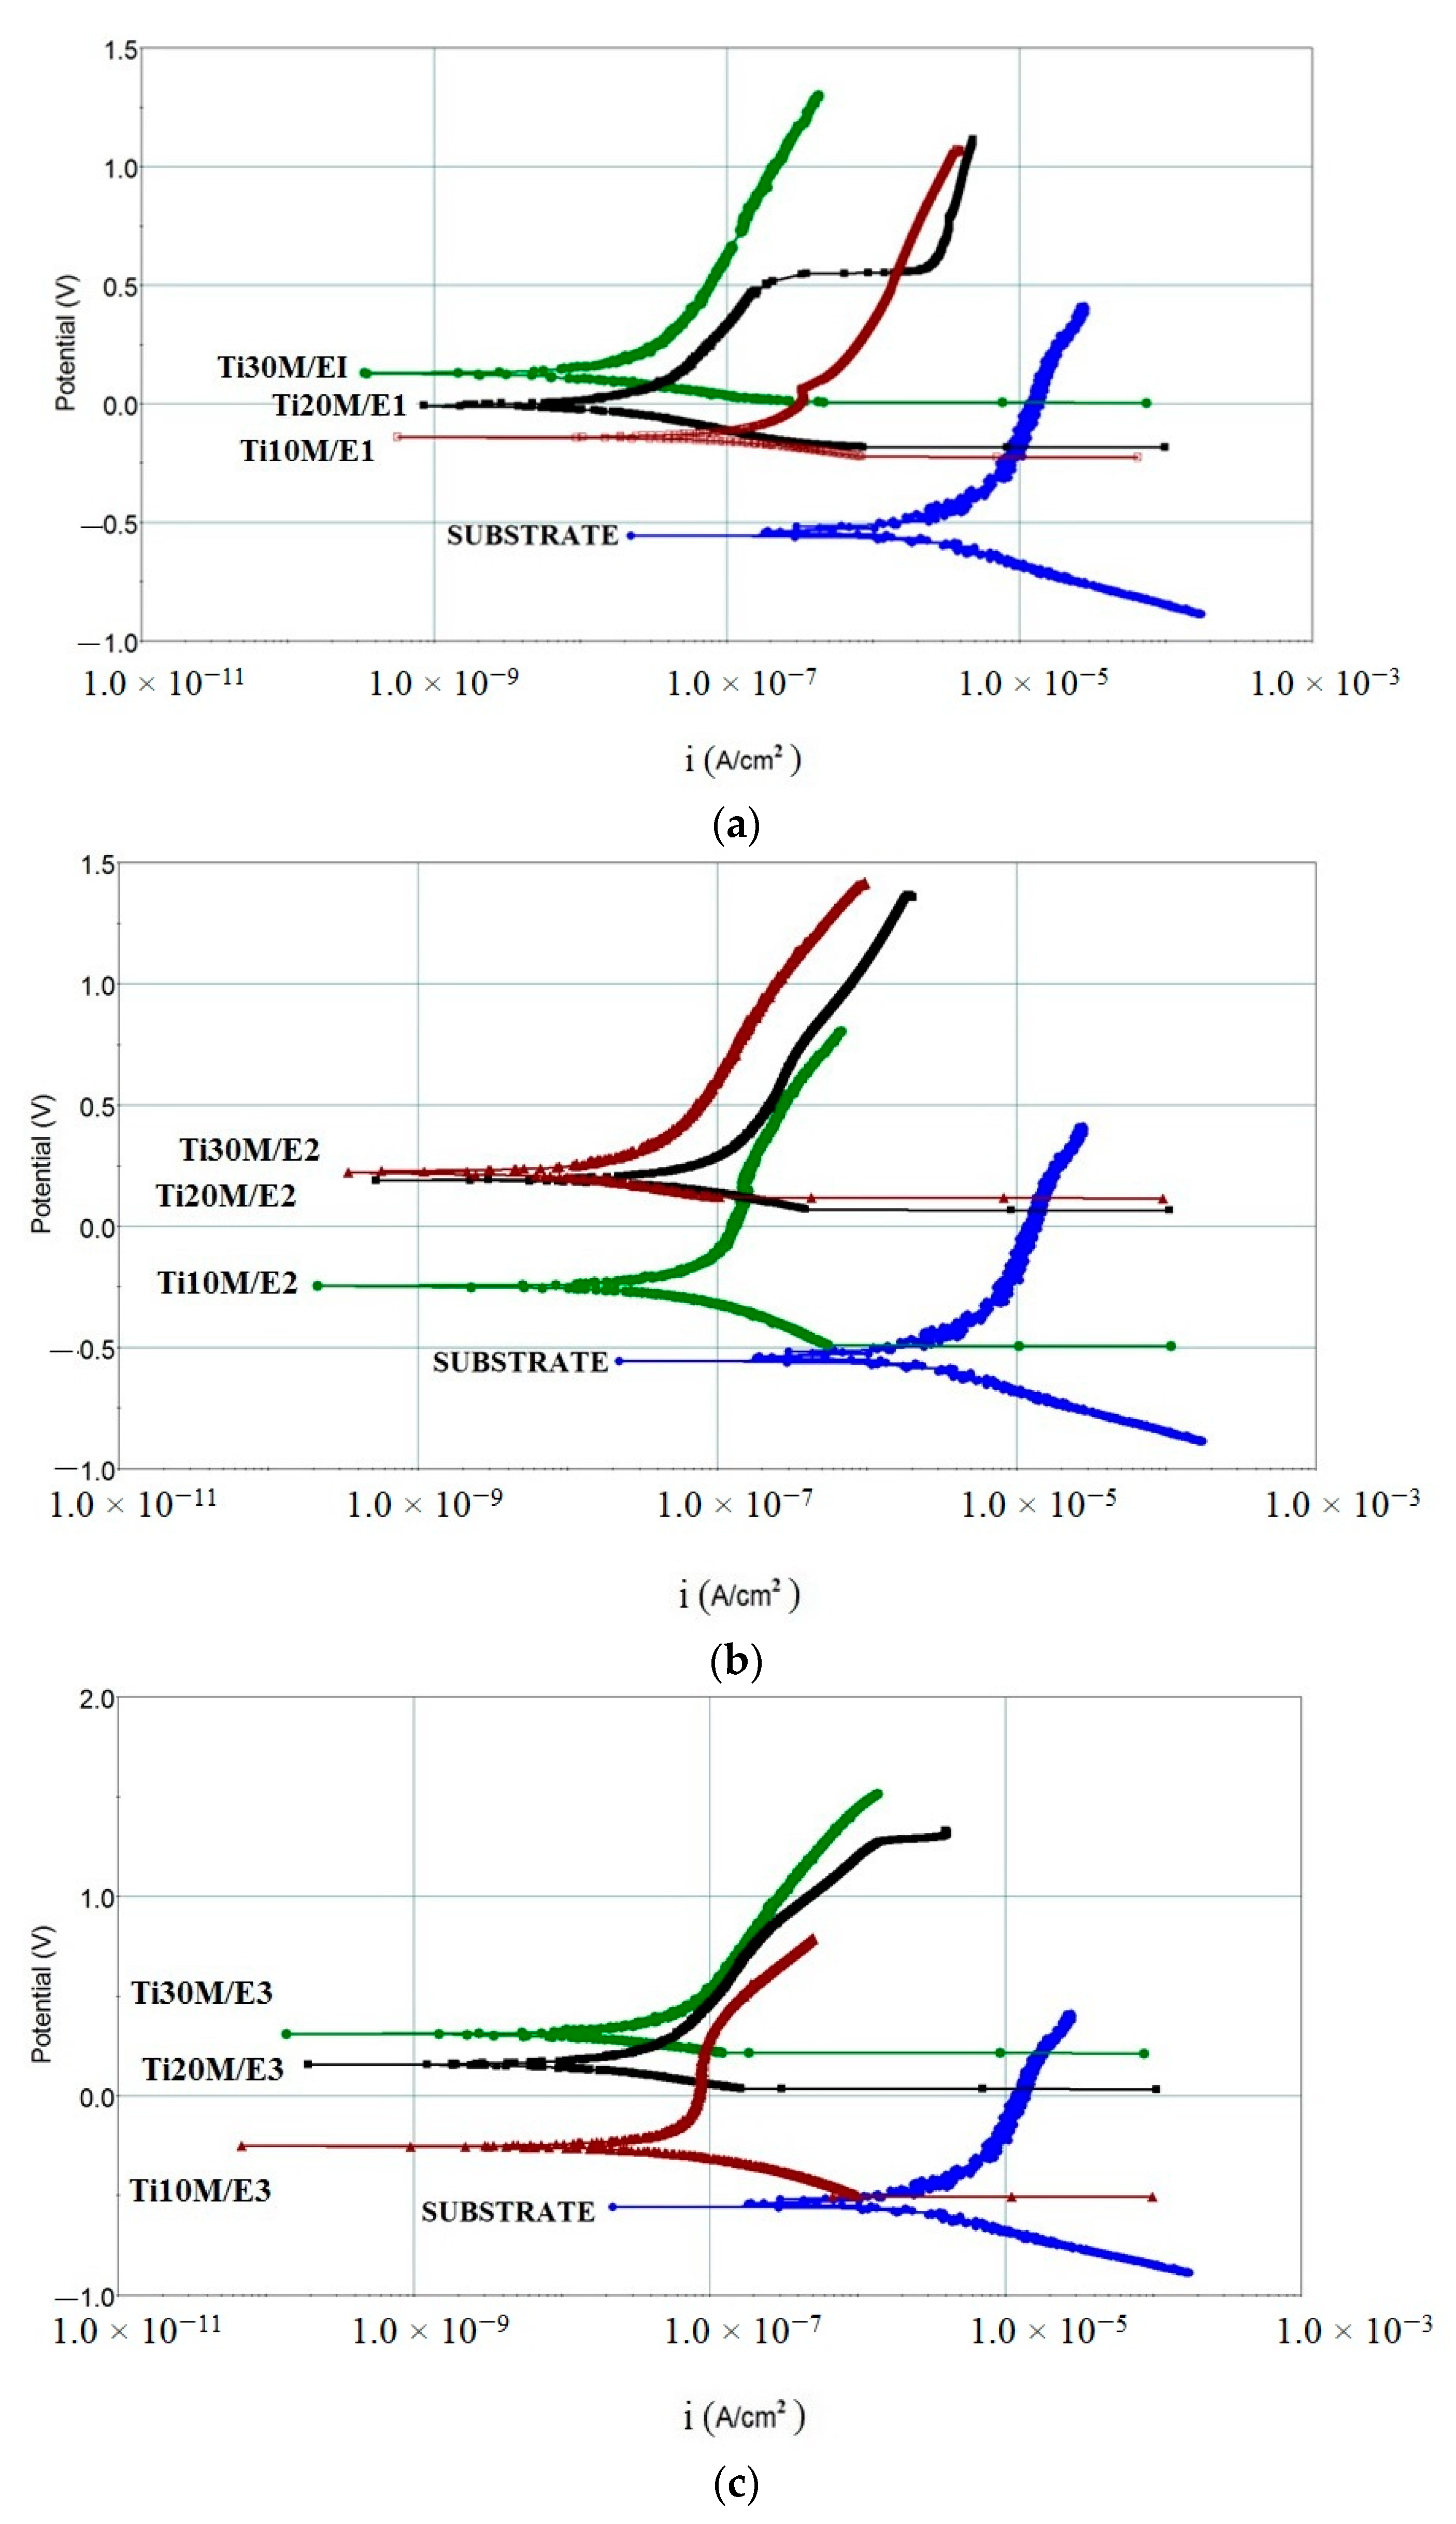
3.8. Potentiodynamic Polarization Tests
4. Conclusions
Author Contributions
Funding
Institutional Review Board Statement
Informed Consent Statement
Data Availability Statement
Conflicts of Interest
References
- Yang, X.; Liu, C.R. Machining titanium and its alloys. Mach. Sci. Technol. 1999, 3, 107–139. [Google Scholar] [CrossRef]
- Poondla, N.; Srivatsan, T.; Patnaik, A.; Petraroli, M. A study of the microstructure and hardness of two titanium alloys: Commercially pure and Ti–6Al–4V. J. Alloys Compd. 2009, 486, 162–167. [Google Scholar] [CrossRef]
- Boyer, R.R. Attributes, characteristics, and applications of titanium and its alloys. JOM 2010, 62, 21–24. [Google Scholar] [CrossRef]
- Wilson, A.D.; Leyland, A.; Matthews, A. A comparative study of the influence of plasma treatments, PVD coatings and ion implantation on the tribological performance of Ti–6Al–4V. Surf. Coat. Technol. 1999, 114, 70–80. [Google Scholar] [CrossRef]
- Proudhon, H.; Savková, J.; Basseville, S.; Guipont, V.; Jeandin, M.; Cailletaud, G. Experimental and numerical wear studies of porous Reactive Plasma Sprayed Ti–6Al–4V/TiN composite coating. Wear 2014, 311, 159–166. [Google Scholar] [CrossRef]
- Askari, S.J.; Akhtar, F.; Chen, G.C.; He, Q.; Wang, F.Y.; Meng, X.M.; Lu, F.X. Synthesis and characterization of nano-crystalline CVD diamond film on pure titanium using Ar/CH4/H2 gas mixture. Mater. Lett. 2007, 61, 2139–2142. [Google Scholar] [CrossRef]
- Selamat, M.S.; Baker, T.; Watson, L. Study of the surface layer formed by the laser processing of Ti–6Al–4V alloy in a dilute nitrogen environment. J. Mater. Process. Technol. 2001, 113, 509–515. [Google Scholar] [CrossRef]
- Langlade, C.; Vannes, A.; Krafft, J.; Martin, J. Surface modification and tribological behaviour of titanium and titanium alloys after YAG-laser treatments. Surf. Coat. Technol. 1998, 100, 383–387. [Google Scholar] [CrossRef]
- Zhao, Y.; Lu, M.; Fan, Z.; Huang, S.; Huang, H. Laser deposition of wear-resistant titanium oxynitride/titanium composite coatings on Ti-6Al-4V alloy. Appl. Surf. Sci. 2020, 531, 147212. [Google Scholar] [CrossRef]
- Zhao, X.; Liu, H.; Li, S.; Wang, X.; Sheng, Y.; Zhang, P.; Li, W. Combined effect of TiN coating and surface texture on corrosion-wear behavior of selective laser melted CP-titanium in simulated body fluid. J. Alloys Compd. 2019, 816, 152667. [Google Scholar] [CrossRef]
- Spajić, I.; Rodič, P.; Šekularac, G.; Lekka, M.; Fedrizzi, L.; Milošev, I. The effect of surface preparation on the protective properties of Al2O3 and HfO2 thin films deposited on cp-titanium by atomic layer deposition. Electrochim. Acta 2020, 366, 137431. [Google Scholar] [CrossRef]
- Molaei, M.; Nouri, M.; Babaei, K.; Fattah-Alhosseini, A. Improving surface features of PEO coatings on titanium and titanium alloys with zirconia particles: A review. Surf. Interfaces 2020, 22, 100888. [Google Scholar] [CrossRef]
- Fattah-Alhosseini, A.; Molaei, M.; Nouri, M.; Babaei, K. Review of the role of graphene and its derivatives in enhancing the performance of plasma electrolytic oxidation coatings on titanium and its alloys. Appl. Surf. Sci. Adv. 2021, 6, 100140. [Google Scholar] [CrossRef]
- Walsh, F.C.; Low, C.T.J.; Wood, R.; Stevens, K.T.; Archer, J.; Poeton, A.R.; Ryder, A. Plasma electrolytic oxidation (PEO) for production of anodised coatings on lightweight metal (Al, Mg, Ti) alloys. Trans. IMF 2009, 87, 122–135. [Google Scholar] [CrossRef]
- Malinovschi, V.; Marin, A.; Ducu, C.; Andrei, V.; Coaca, E.; Craciun, V.; Lungu, M. Influence of sodium aluminate concentration and process duration on microstructure, mechanical and electrochemical behavior of PEO coatings formed on CP-Ti. Surf. Coat. Technol. 2021, 418, 127240. [Google Scholar] [CrossRef]
- Aliasghari, S.; Němcová, A.; Čížek, J.; Gholinia, A.; Skeldon, P.; Thompson, G.E. Effects of reagent purity on plasma electrolytic oxidation of titanium in an aluminate–phosphate electrolyte. Trans. Inst. Met. Finish. 2016, 94, 32–42. [Google Scholar] [CrossRef]
- Ghafaripoor, M.; Raeissi, K.; Santamaria, M.; Hakimizad, A. The corrosion and tribocorrosion resistance of PEO composite coatings containing α-Al2O3 particles on 7075 Al alloy. Surf. Coat. Technol. 2018, 349, 470–479. [Google Scholar] [CrossRef]
- Tao, Y.; Xiong, T.; Sun, C.; Jin, H.; Du, H.; Li, T. Effect of α-Al2O3 on the properties of cold sprayed Al/α-Al2O3 composite coatings on AZ91D magnesium alloy. Appl. Surf. Sci. 2009, 256, 261–266. [Google Scholar] [CrossRef]
- Zhao, Z.; Chen, M.; You, C.; Li, W.; Tie, D.; Liu, H. Effect of α-Al2O3 additive on the microstructure and properties of MAO coatings prepared on low carbon steel. J. Mater. Res. Technol. 2020, 9, 3875–3884. [Google Scholar] [CrossRef]
- Li, Y.; Chen, M.; Li, W.; Wang, Q.; Wang, Y.; You, C. Preparation, characteristics and corrosion properties of α-Al2O3 coatings on 10B21 carbon steel by micro-arc oxidation. Surf. Coat. Technol. 2018, 358, 637–645. [Google Scholar] [CrossRef]
- Moulder, F.; Stickle, W.F.; Sobol, P.E.; Bomben, K.D. Handbook of X-ray Photoelectron Spectroscopy; ULVAC-PHI Inc.: Chigasaki, Japan, 1995. [Google Scholar]
- Naumkin, A.V.; Kraut-Vass, A.; Gaarenstroom, S.W.; Powell, C.J. NIST X-ray Photoelectron Spectroscopy Database, NIST Standard Reference Database 20, Version 4.1, 2012. Available online: https://srdata.nist.gov/xps/ (accessed on 19 November 2021).
- Krupa, D.; Baszkiewicz, J.; Kozubowski, J.A.; Barcz, A.; Sobczak, J.W.; Biliński, A.; Lewandowska-Szumieł, M.; Rajchel, B. Effect of phosphorus-ion implantation on the corrosion resistance and biocompatibility of titanium. Biomaterials 2002, 23, 3329–3340. [Google Scholar] [CrossRef]
- Kong, D.; Wang, Y.; Huang, S.; Von Lim, Y.; Zhang, J.; Sun, L.; Liu, B.; Chen, T.; Valdivia Alvarado, P.; Yang, H.Y. Surface modification of Na2Ti3O7 nanofibre arrays using N-doped graphene quantum dots as advanced anodes for sodium-ion batteries with ultra-stable and high-rate capability. J. Mater. Chem. A 2019, 7, 12751–12762. [Google Scholar] [CrossRef]
- Takanabe, K.; Khan, A.M.; Tang, Y.; Nguyen, L.; Ziani, A.; Jacobs, B.W.; Elbaz, A.M.; Sarathy, S.M.; Tao, F. Integrated in situ characterization of a molten salt catalyst surface: Evidence of sodium peroxide and hydroxyl radical formation. Angew. Chem. 2017, 129, 10539–10543. [Google Scholar] [CrossRef]
- Pawley, G.S. Unit-cell refinement from powder diffraction scans. J. Appl. Crystallogr. 1981, 14, 357–361. [Google Scholar] [CrossRef]
- Xue, W.; Deng, Z.; Lai, Y.; Chen, R. Analysis of phase distribution for ceramic coatings formed by microarc oxidation on aluminum alloy. J. Am. Ceram. Soc. 2005, 81, 1365–1368. [Google Scholar] [CrossRef]
- Yerokhin, A.; Leyland, A.; Matthews, A. Kinetic aspects of aluminium titanate layer formation on titanium alloys by plasma electrolytic oxidation. Appl. Surf. Sci. 2002, 200, 172–184. [Google Scholar] [CrossRef]


| Sample | O1s | Na1s | Al2p | Ti2p |
|---|---|---|---|---|
| Ti10M/E1 | 74.1 | 2.3 | 22.3 | 1.3 |
| Ti20M/E1 | 71.5 | 5.1 | 22.4 | 1.0 |
| Ti30M/E1 | 71.5 | 4.1 | 24.1 | 0.3 |
| Ti10M/E2 | 73.5 | 3.8 | 21.9 | 0.8 |
| Ti20M/E2 | 71.4 | 4.3 | 23.7 | 0.6 |
| Ti30M/E2 | 69.0 | 3.9 | 26.2 | 0.9 |
| Ti10M/E3 | 72.3 | 3.2 | 23.2 | 1.3 |
| Ti20M/E3 | 75.0 | 3.5 | 21.0 | 0.5 |
| Ti30M/E3 | 71.5 | 5.4 | 22.5 | 0.6 |
| Sample | Thickness of the Layers (μm) | HV1000 (GPa) | Lc2 (N) |
|---|---|---|---|
| Cp-Ti | – | 180, (1.8) | – |
| Ti10M/E1 | 21.4–27.2 | 1600, (15.7) | 15 |
| Ti20M/E1 | 45.9–47.9 | 2700, (26.5) | 38 |
| Ti30M/E1 | 84.1–85.5 | 4000, (39.2) | 42 |
| Ti10M/E2 | 33.4–34.8 | 2500, (24.5) | 22 |
| Ti20M/E2 | 47.9–50.0 | 3500, (34.3) | 35 |
| Ti30M/E2 | 76.2–81.0 | 5000, (49.0) | 38 |
| Ti10M/E3 | 51.7–57.2 | 1500, (14.7) | 11 |
| Ti20M/E3 | 66.9–76.9 | 2000, (19.6) | 38 |
| Ti30M/E3 | 91.4–95.5 | 3800, (37.3) | 50 |
| Sample | Ecorr (mV) | icorr (A/cm2) | Vcorr (mmpy) |
|---|---|---|---|
| Cp-Ti | −518 | 0.8 × 10⁻⁶ | 102.4 × 10⁻⁴ |
| Ti10M/E1 | −142 | 4.5 × 10⁻⁸ | 10.0 × 10⁻⁴ |
| Ti20M/E1 | −8.5 | 1.0 × 10⁻⁸ | 4.5 × 10⁻⁴ |
| Ti30M/E1 | 134 | 0.3 × 10⁻⁸ | 1.8 × 10⁻⁴ |
| Ti10M/E2 | −247 | 3.0 × 10⁻⁸ | 8.8 × 10⁻⁴ |
| Ti20M/E2 | 193 | 1.0 × 10⁻⁸ | 3.5 × 10⁻⁴ |
| Ti30M/E2 | 225 | 0.2 × 10⁻⁸ | 1.0 × 10⁻⁴ |
| Ti10M/E3 | −253 | 2.0 × 10⁻⁸ | 5.9 × 10⁻⁴ |
| Ti20M/E3 | 155 | 0.8 × 10⁻⁸ | 2.6 × 10⁻⁴ |
| Ti30M/E3 | 314 | 0.1 × 10⁻⁸ | 0.6 × 10⁻⁴ |
Publisher’s Note: MDPI stays neutral with regard to jurisdictional claims in published maps and institutional affiliations. |
© 2021 by the authors. Licensee MDPI, Basel, Switzerland. This article is an open access article distributed under the terms and conditions of the Creative Commons Attribution (CC BY) license (https://creativecommons.org/licenses/by/4.0/).
Share and Cite
Malinovschi, V.; Marin, A.H.; Ducu, C.; Moga, S.; Andrei, V.; Coaca, E.; Craciun, V.; Lungu, M.; Lungu, C.P. Improvement of Mechanical and Corrosion Properties of Commercially Pure Titanium Using Alumina PEO Coatings. Coatings 2022, 12, 29. https://doi.org/10.3390/coatings12010029
Malinovschi V, Marin AH, Ducu C, Moga S, Andrei V, Coaca E, Craciun V, Lungu M, Lungu CP. Improvement of Mechanical and Corrosion Properties of Commercially Pure Titanium Using Alumina PEO Coatings. Coatings. 2022; 12(1):29. https://doi.org/10.3390/coatings12010029
Chicago/Turabian StyleMalinovschi, Viorel, Alexandru Horia Marin, Catalin Ducu, Sorin Moga, Victor Andrei, Elisabeta Coaca, Valentin Craciun, Mihail Lungu, and Cristian P. Lungu. 2022. "Improvement of Mechanical and Corrosion Properties of Commercially Pure Titanium Using Alumina PEO Coatings" Coatings 12, no. 1: 29. https://doi.org/10.3390/coatings12010029
APA StyleMalinovschi, V., Marin, A. H., Ducu, C., Moga, S., Andrei, V., Coaca, E., Craciun, V., Lungu, M., & Lungu, C. P. (2022). Improvement of Mechanical and Corrosion Properties of Commercially Pure Titanium Using Alumina PEO Coatings. Coatings, 12(1), 29. https://doi.org/10.3390/coatings12010029