Ultra-Narrow Gap Fiber Laser Conduction Welding Technology for 304 Stainless Steel Thick Plates and the Mechanical Properties of Welding Joints
Abstract
1. Introduction
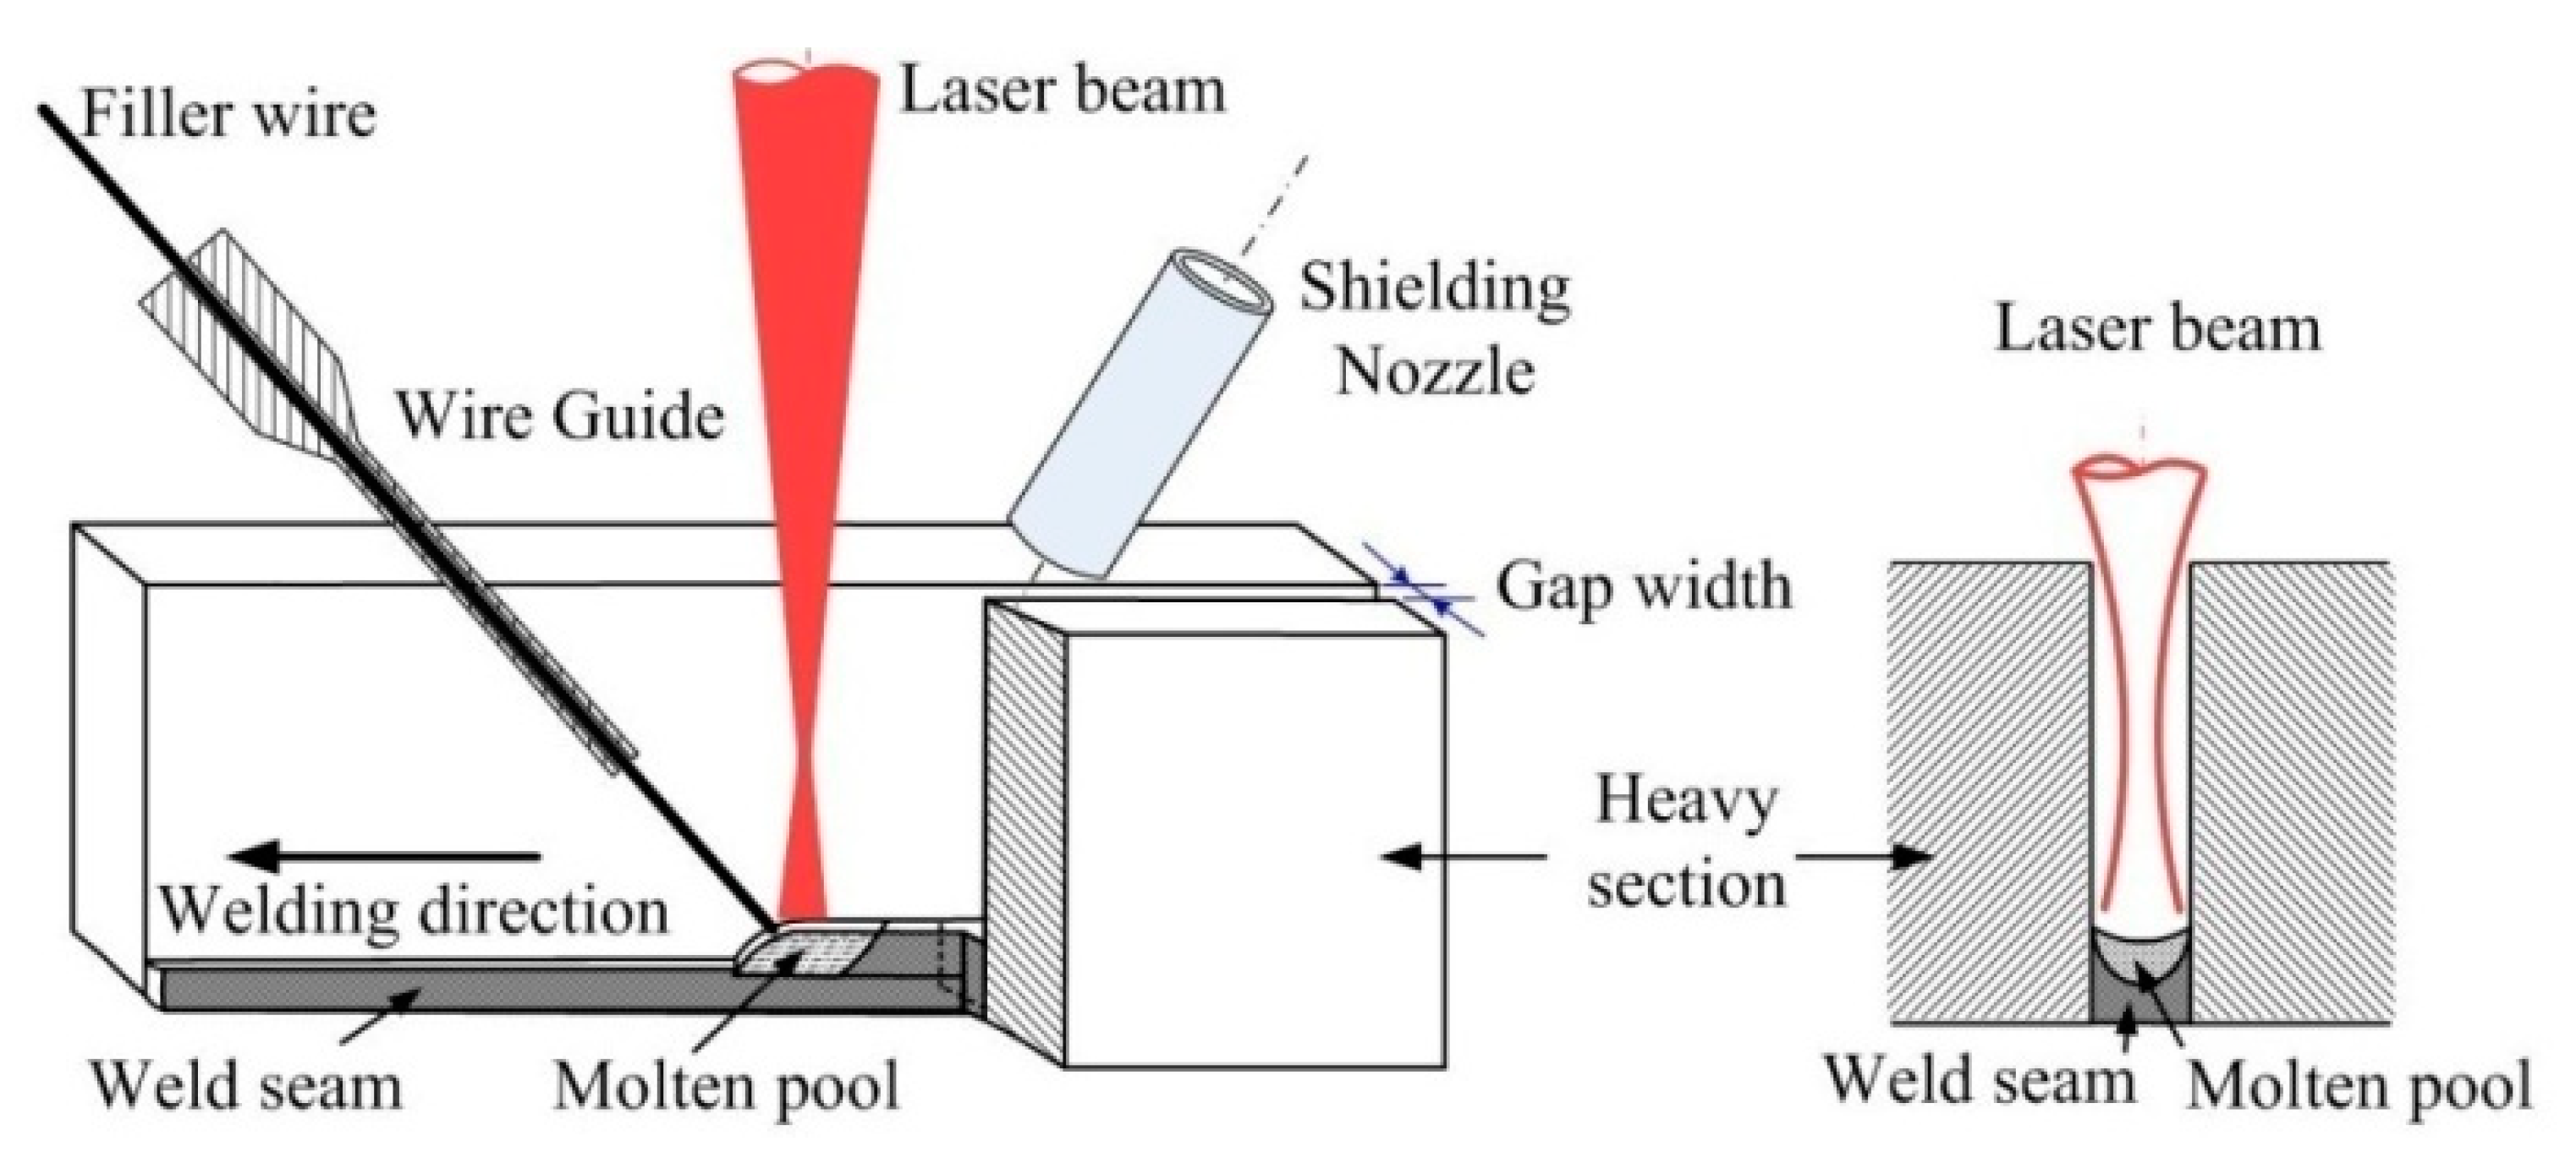
2. Experimental Method and Set-Up
3. Experimental Results and Analysis
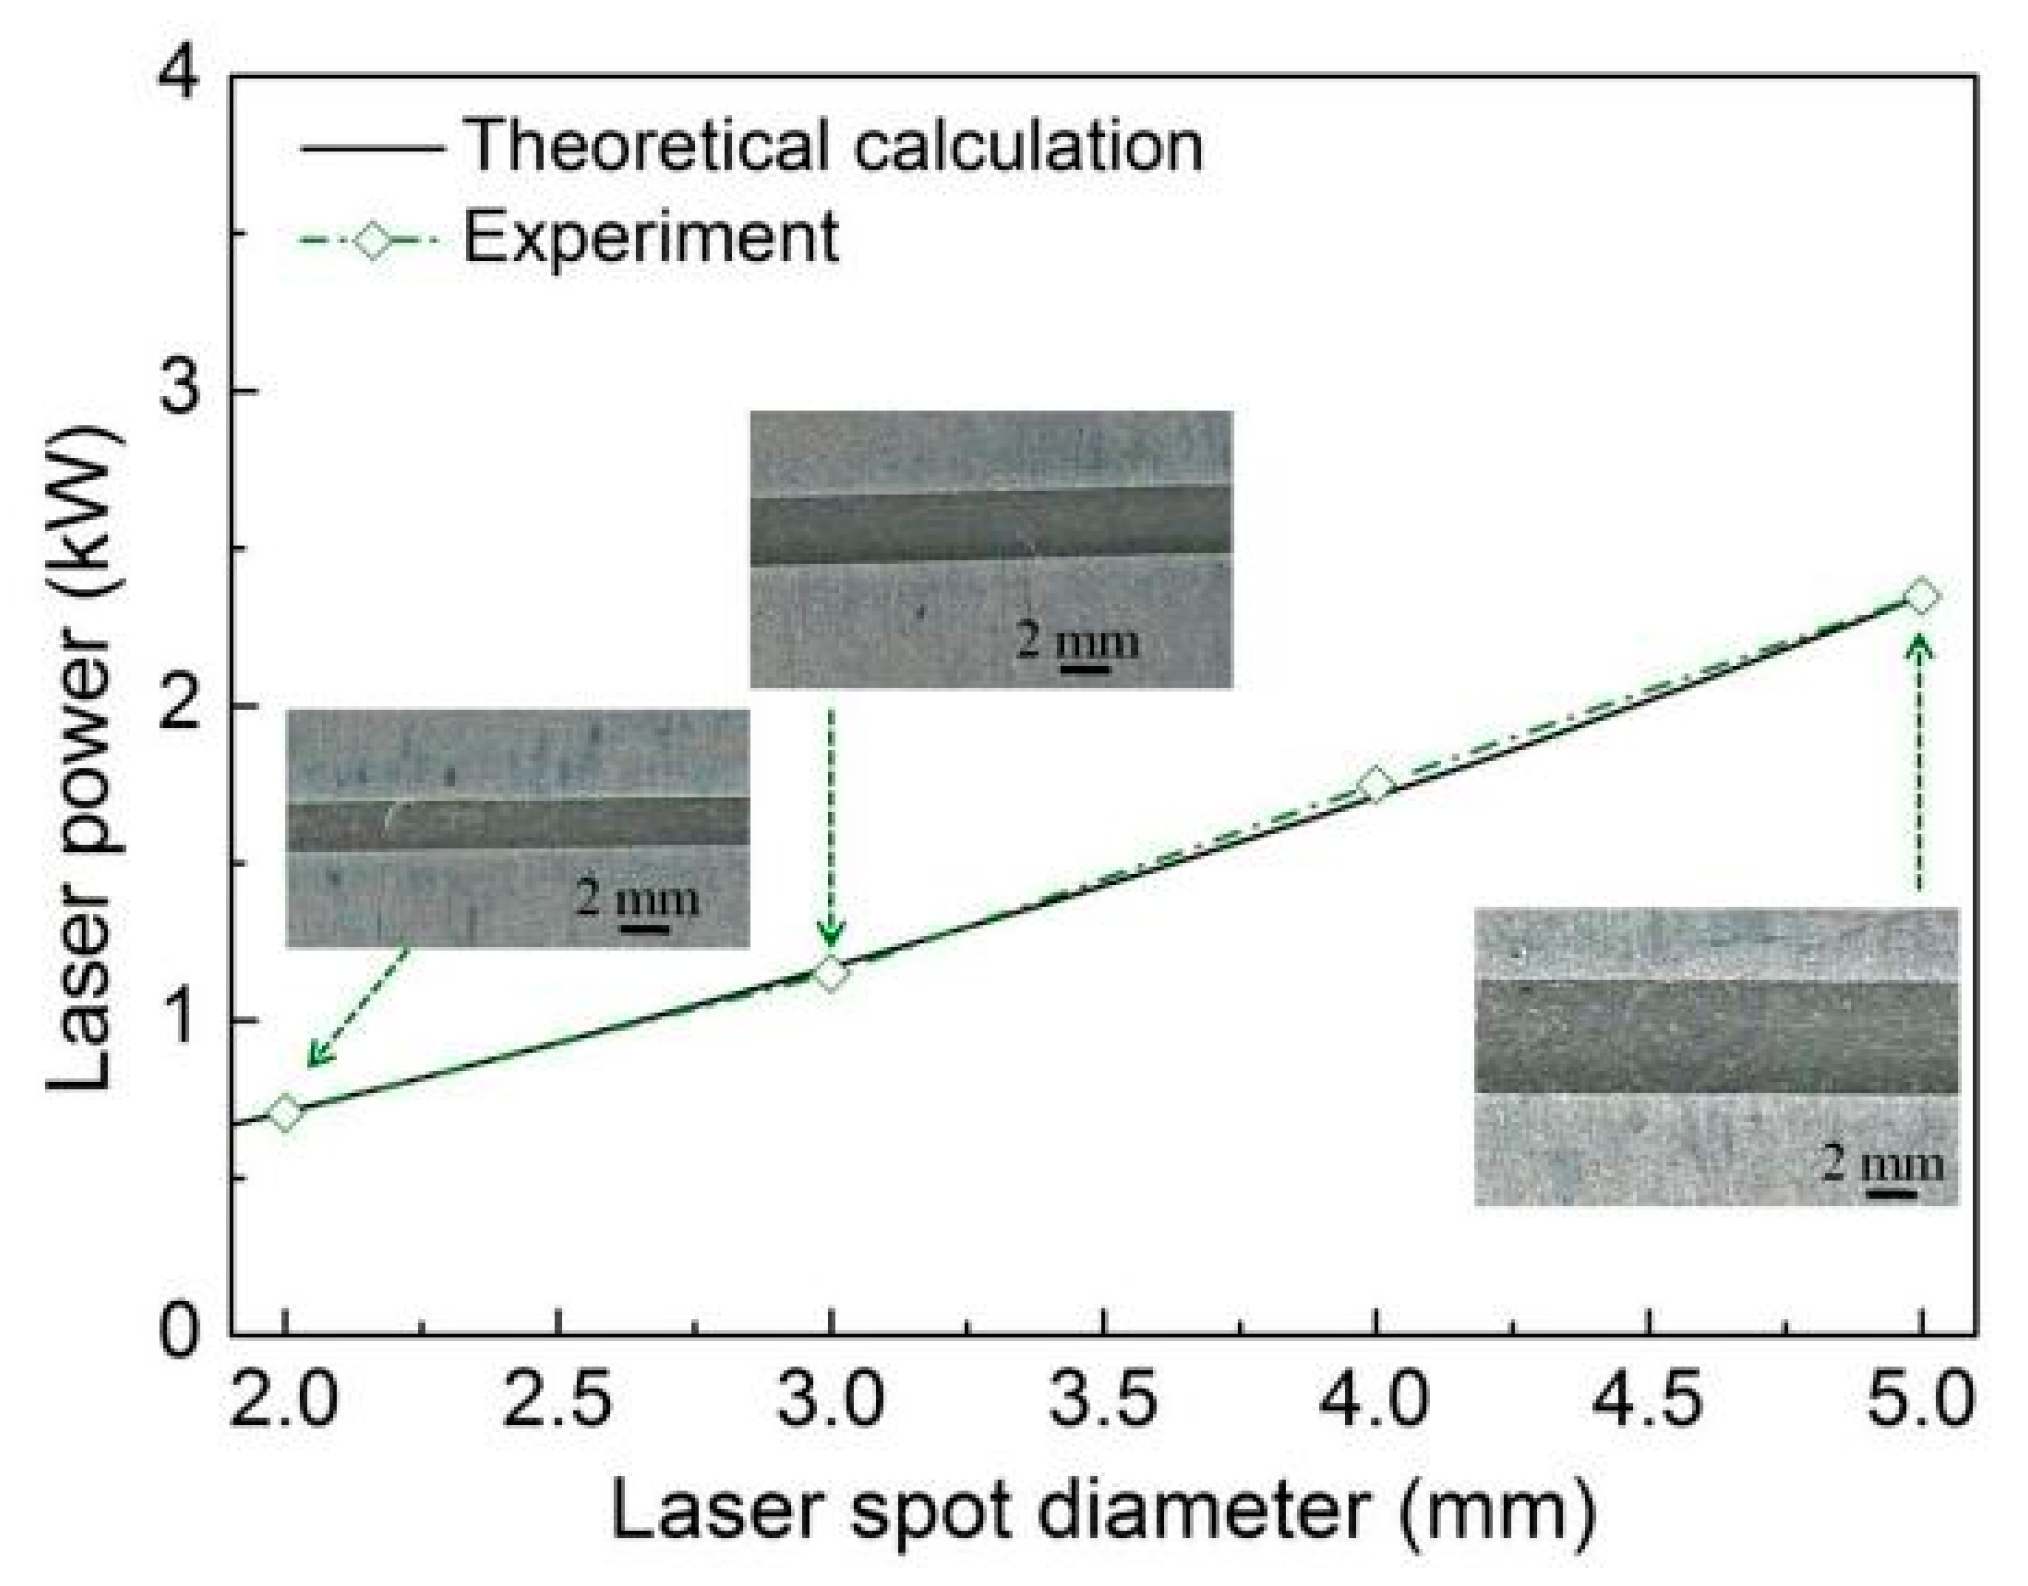
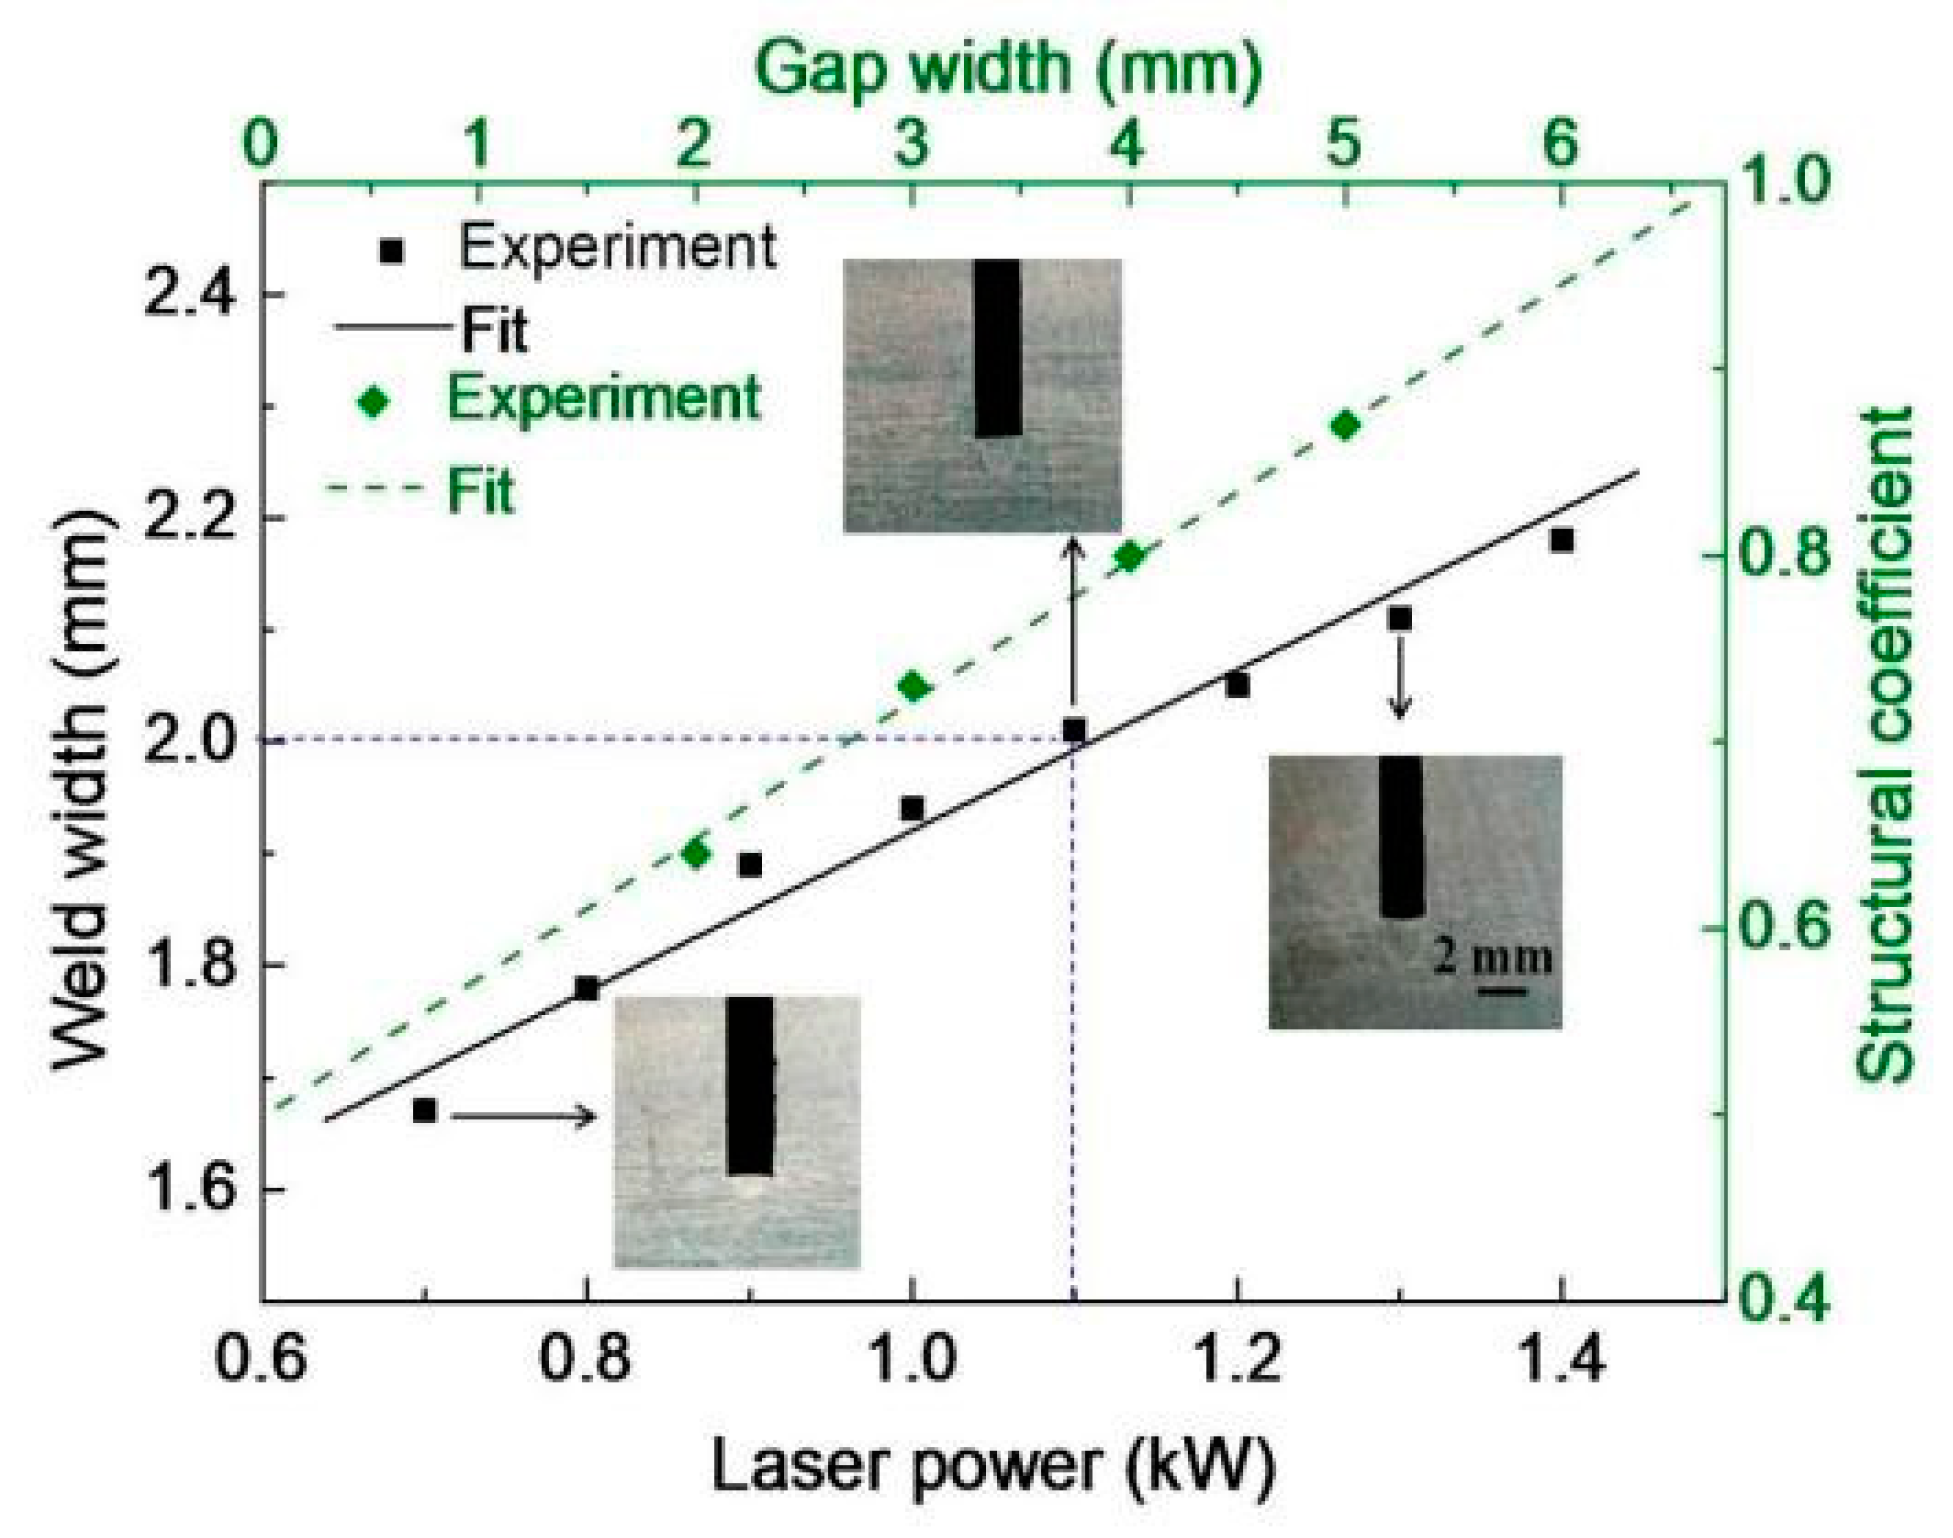
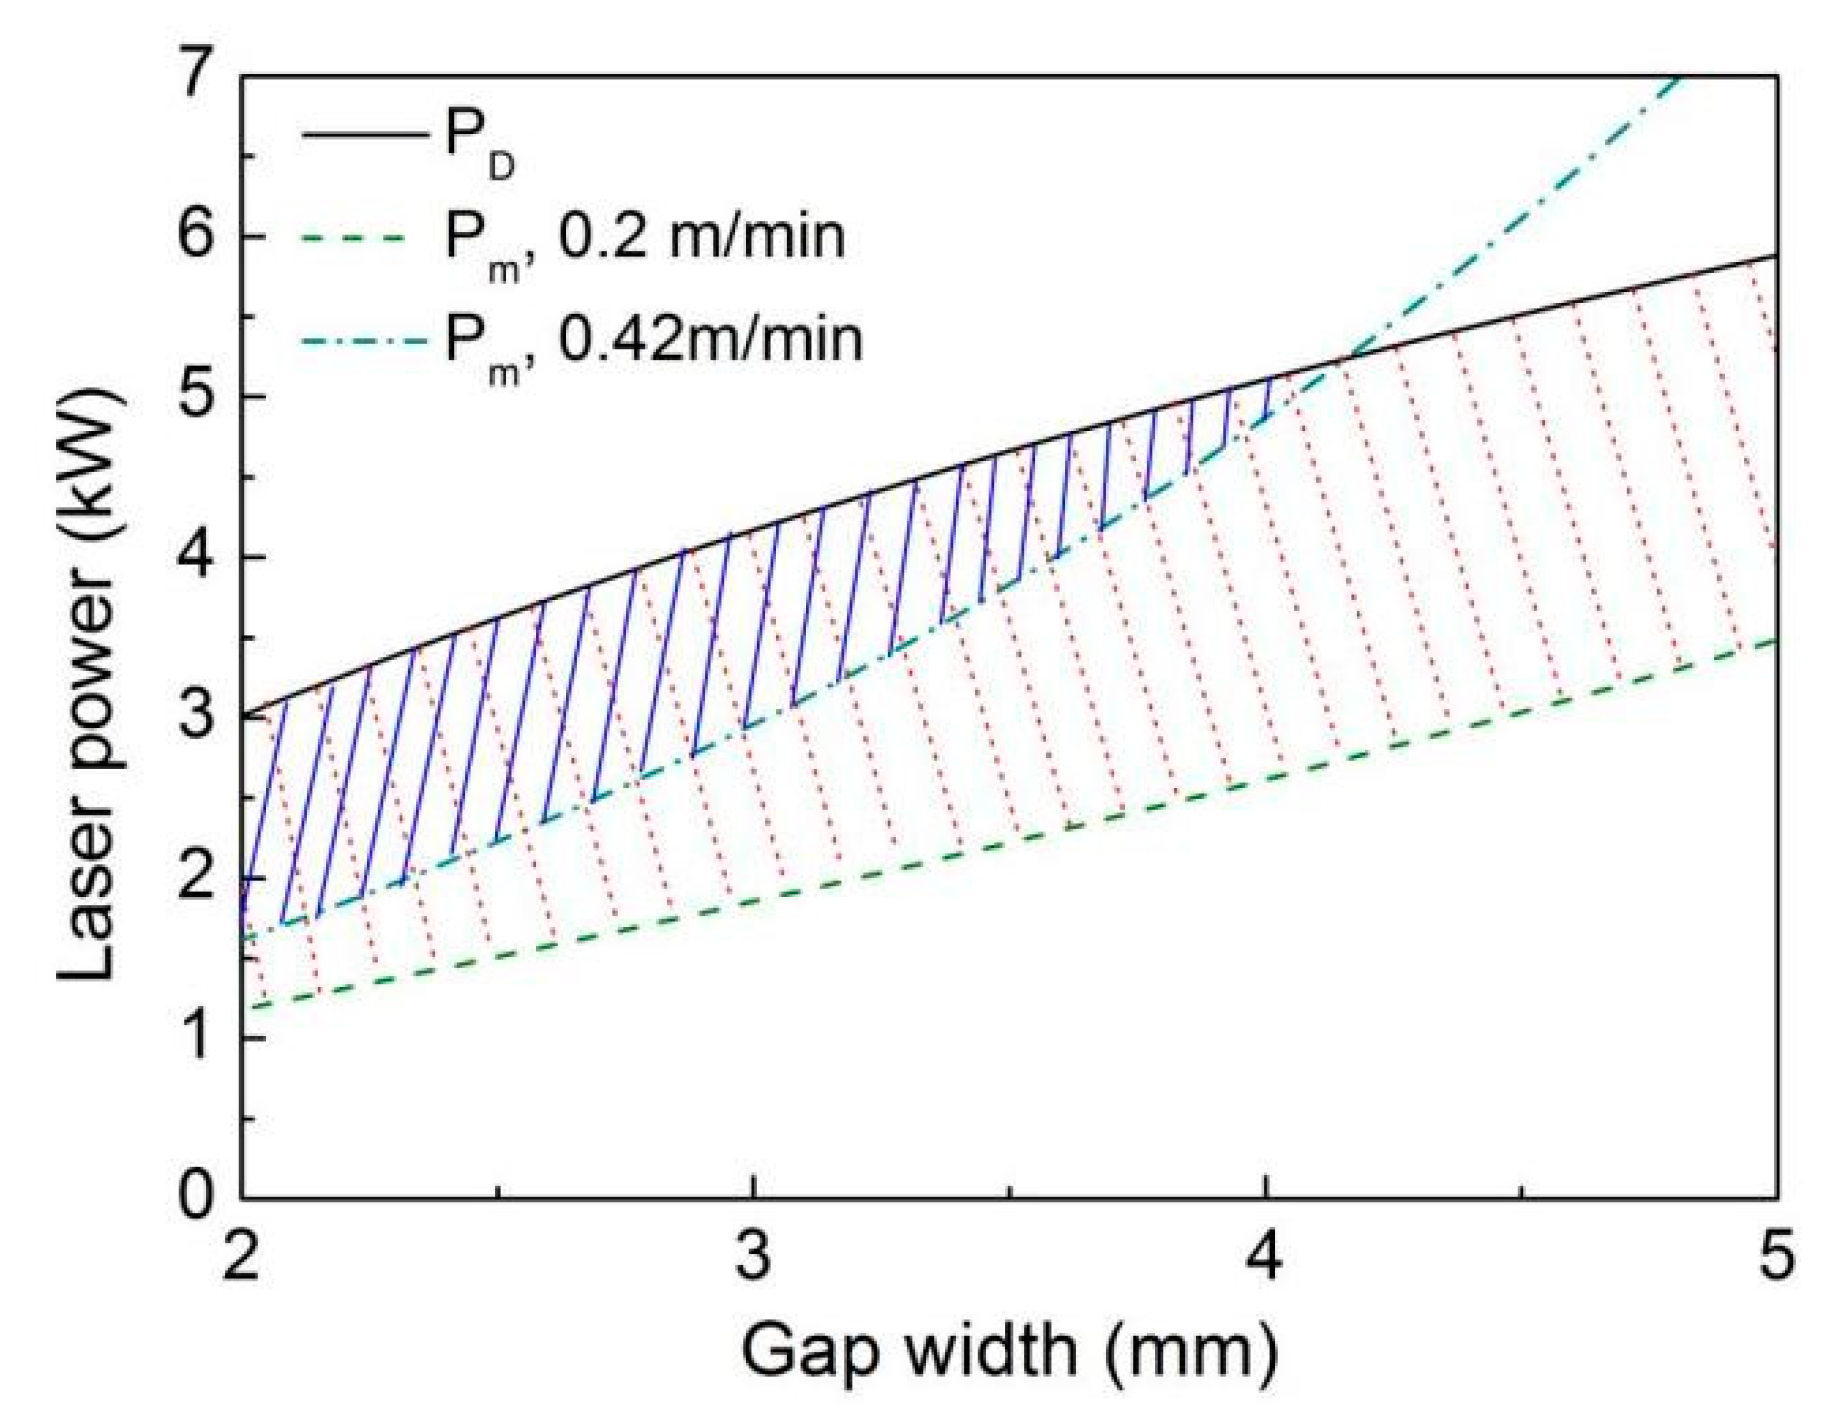
3.1. Physical Properties of the Ultra-Narrow Gap and the Technological Parameters’ Theoretical Value Ranges for Heat Conduction Welding
3.2. The Effects of the Technological Parameters on Weld Defects
3.3. Micro-Structures of the Welding Joints
3.4. Mechanical Properties of the Welding Joints
4. Conclusions
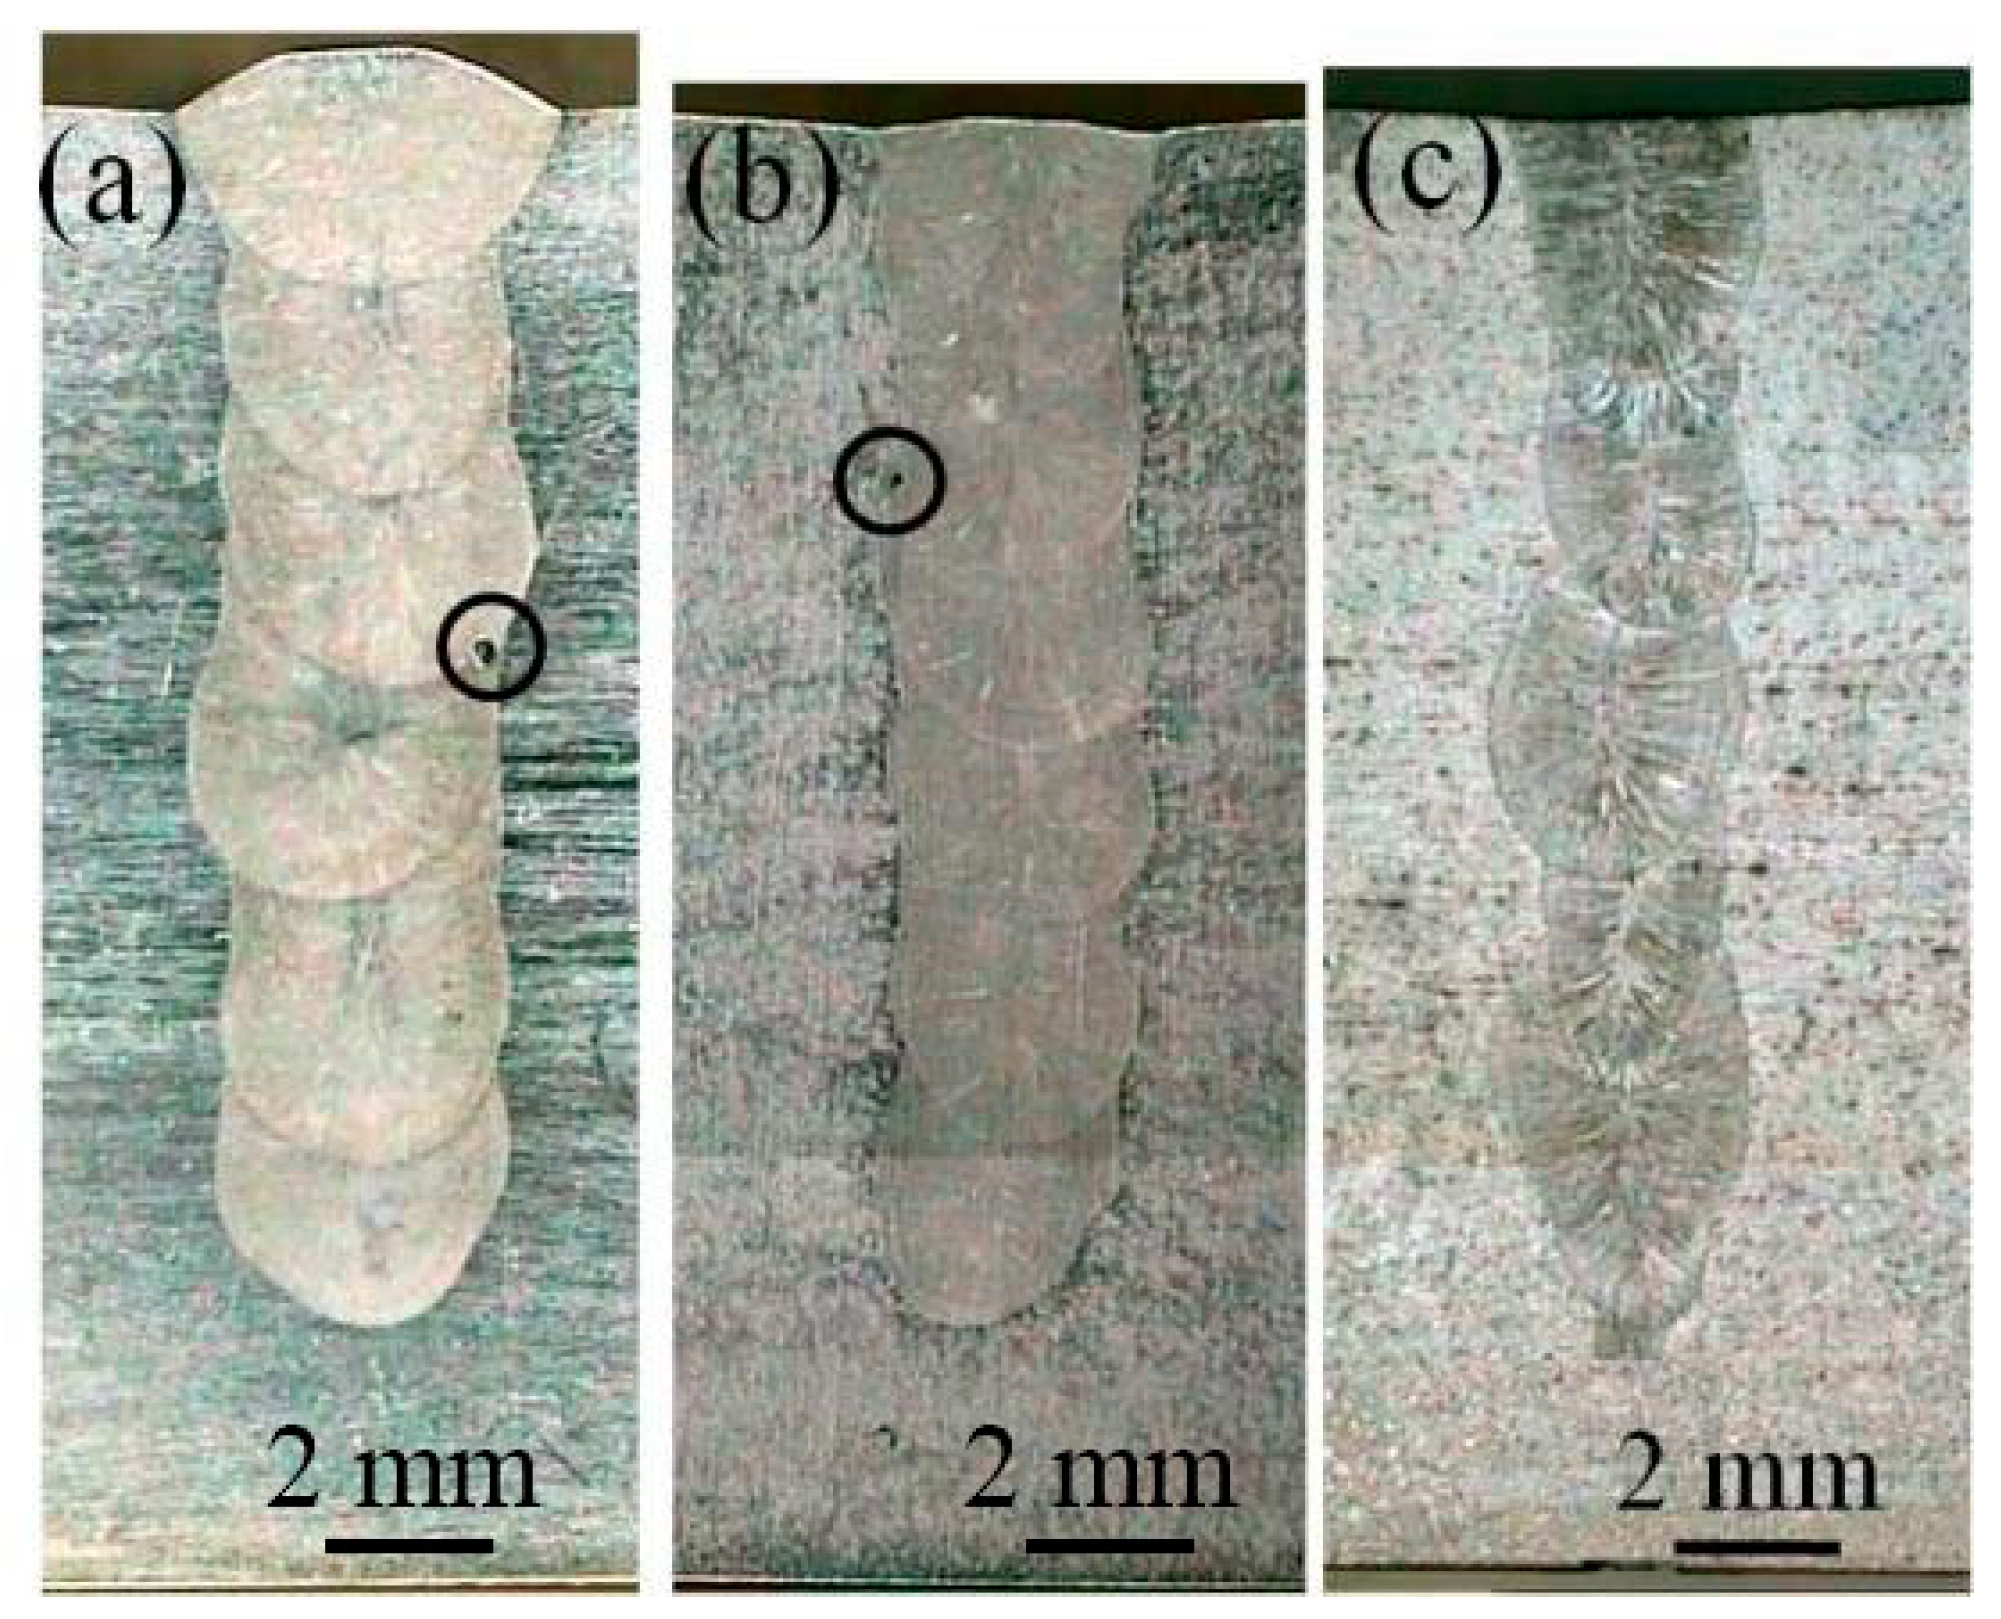
- Using the optimized parameters and a gap with 3 mm width, two 304 stainless steel plates with 60 mm thickness were welding through the 20 times of filling. The obtained weld seam has the uniform widths from the top to bottom (being approximately 3.8 mm), with favorable formation, and no defects such as the incomplete fusion of sidewalls and keyhole-induced porosity can be observed.
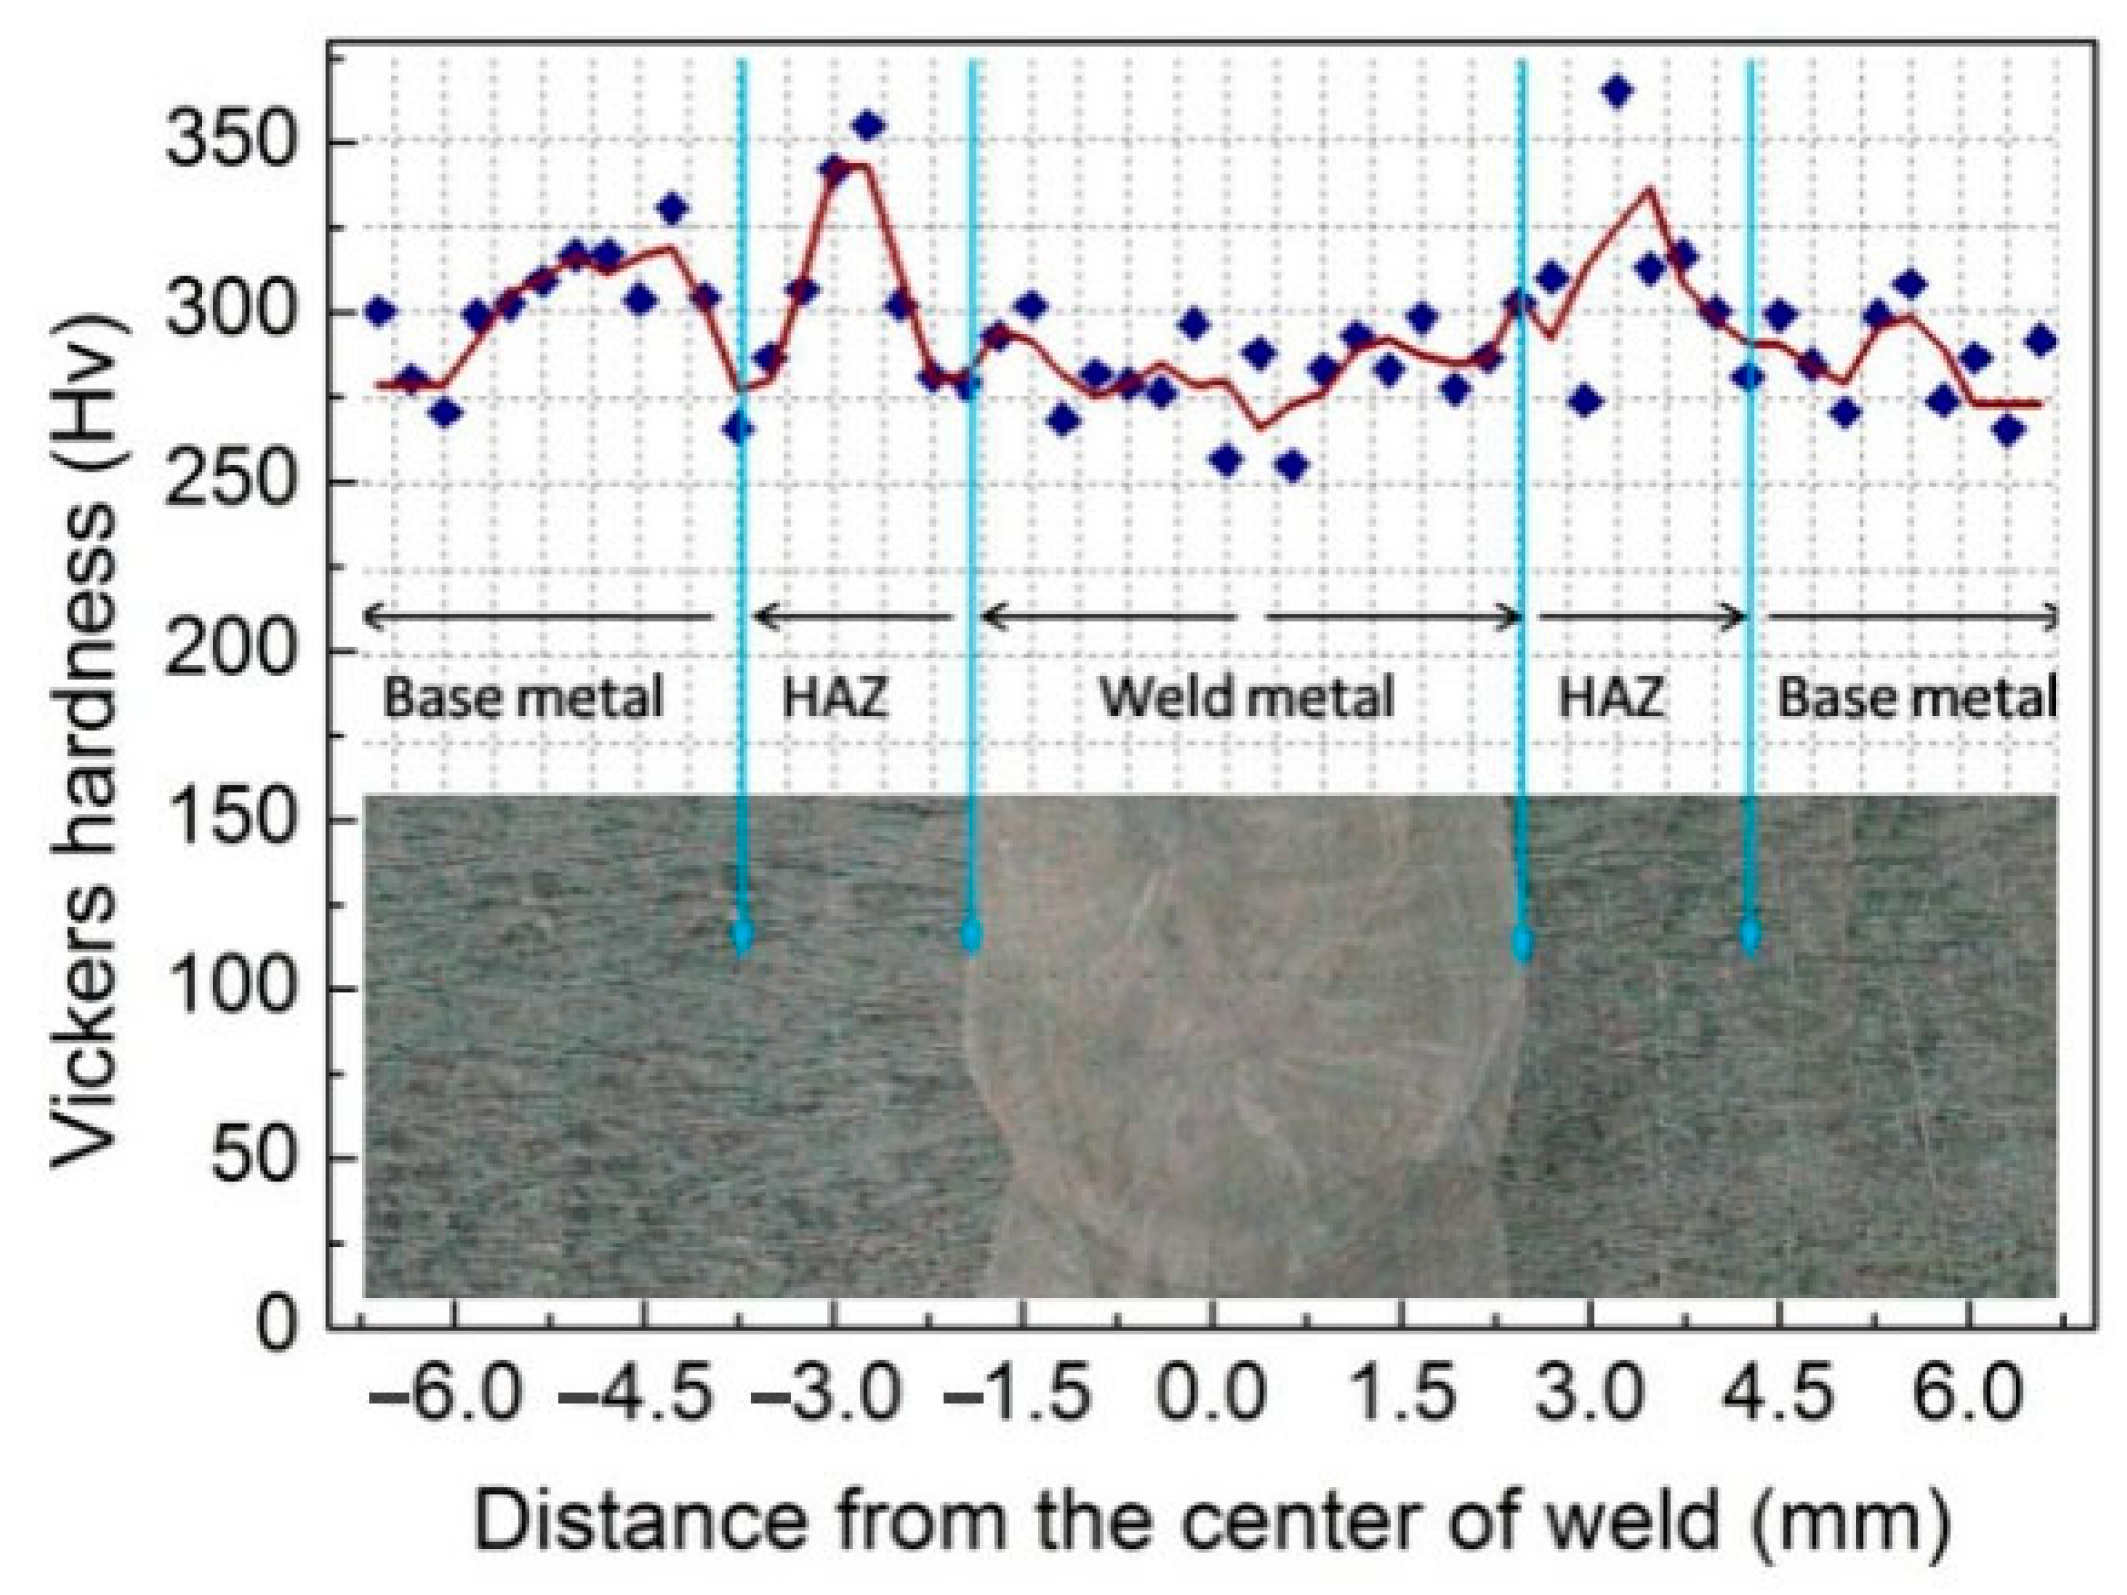
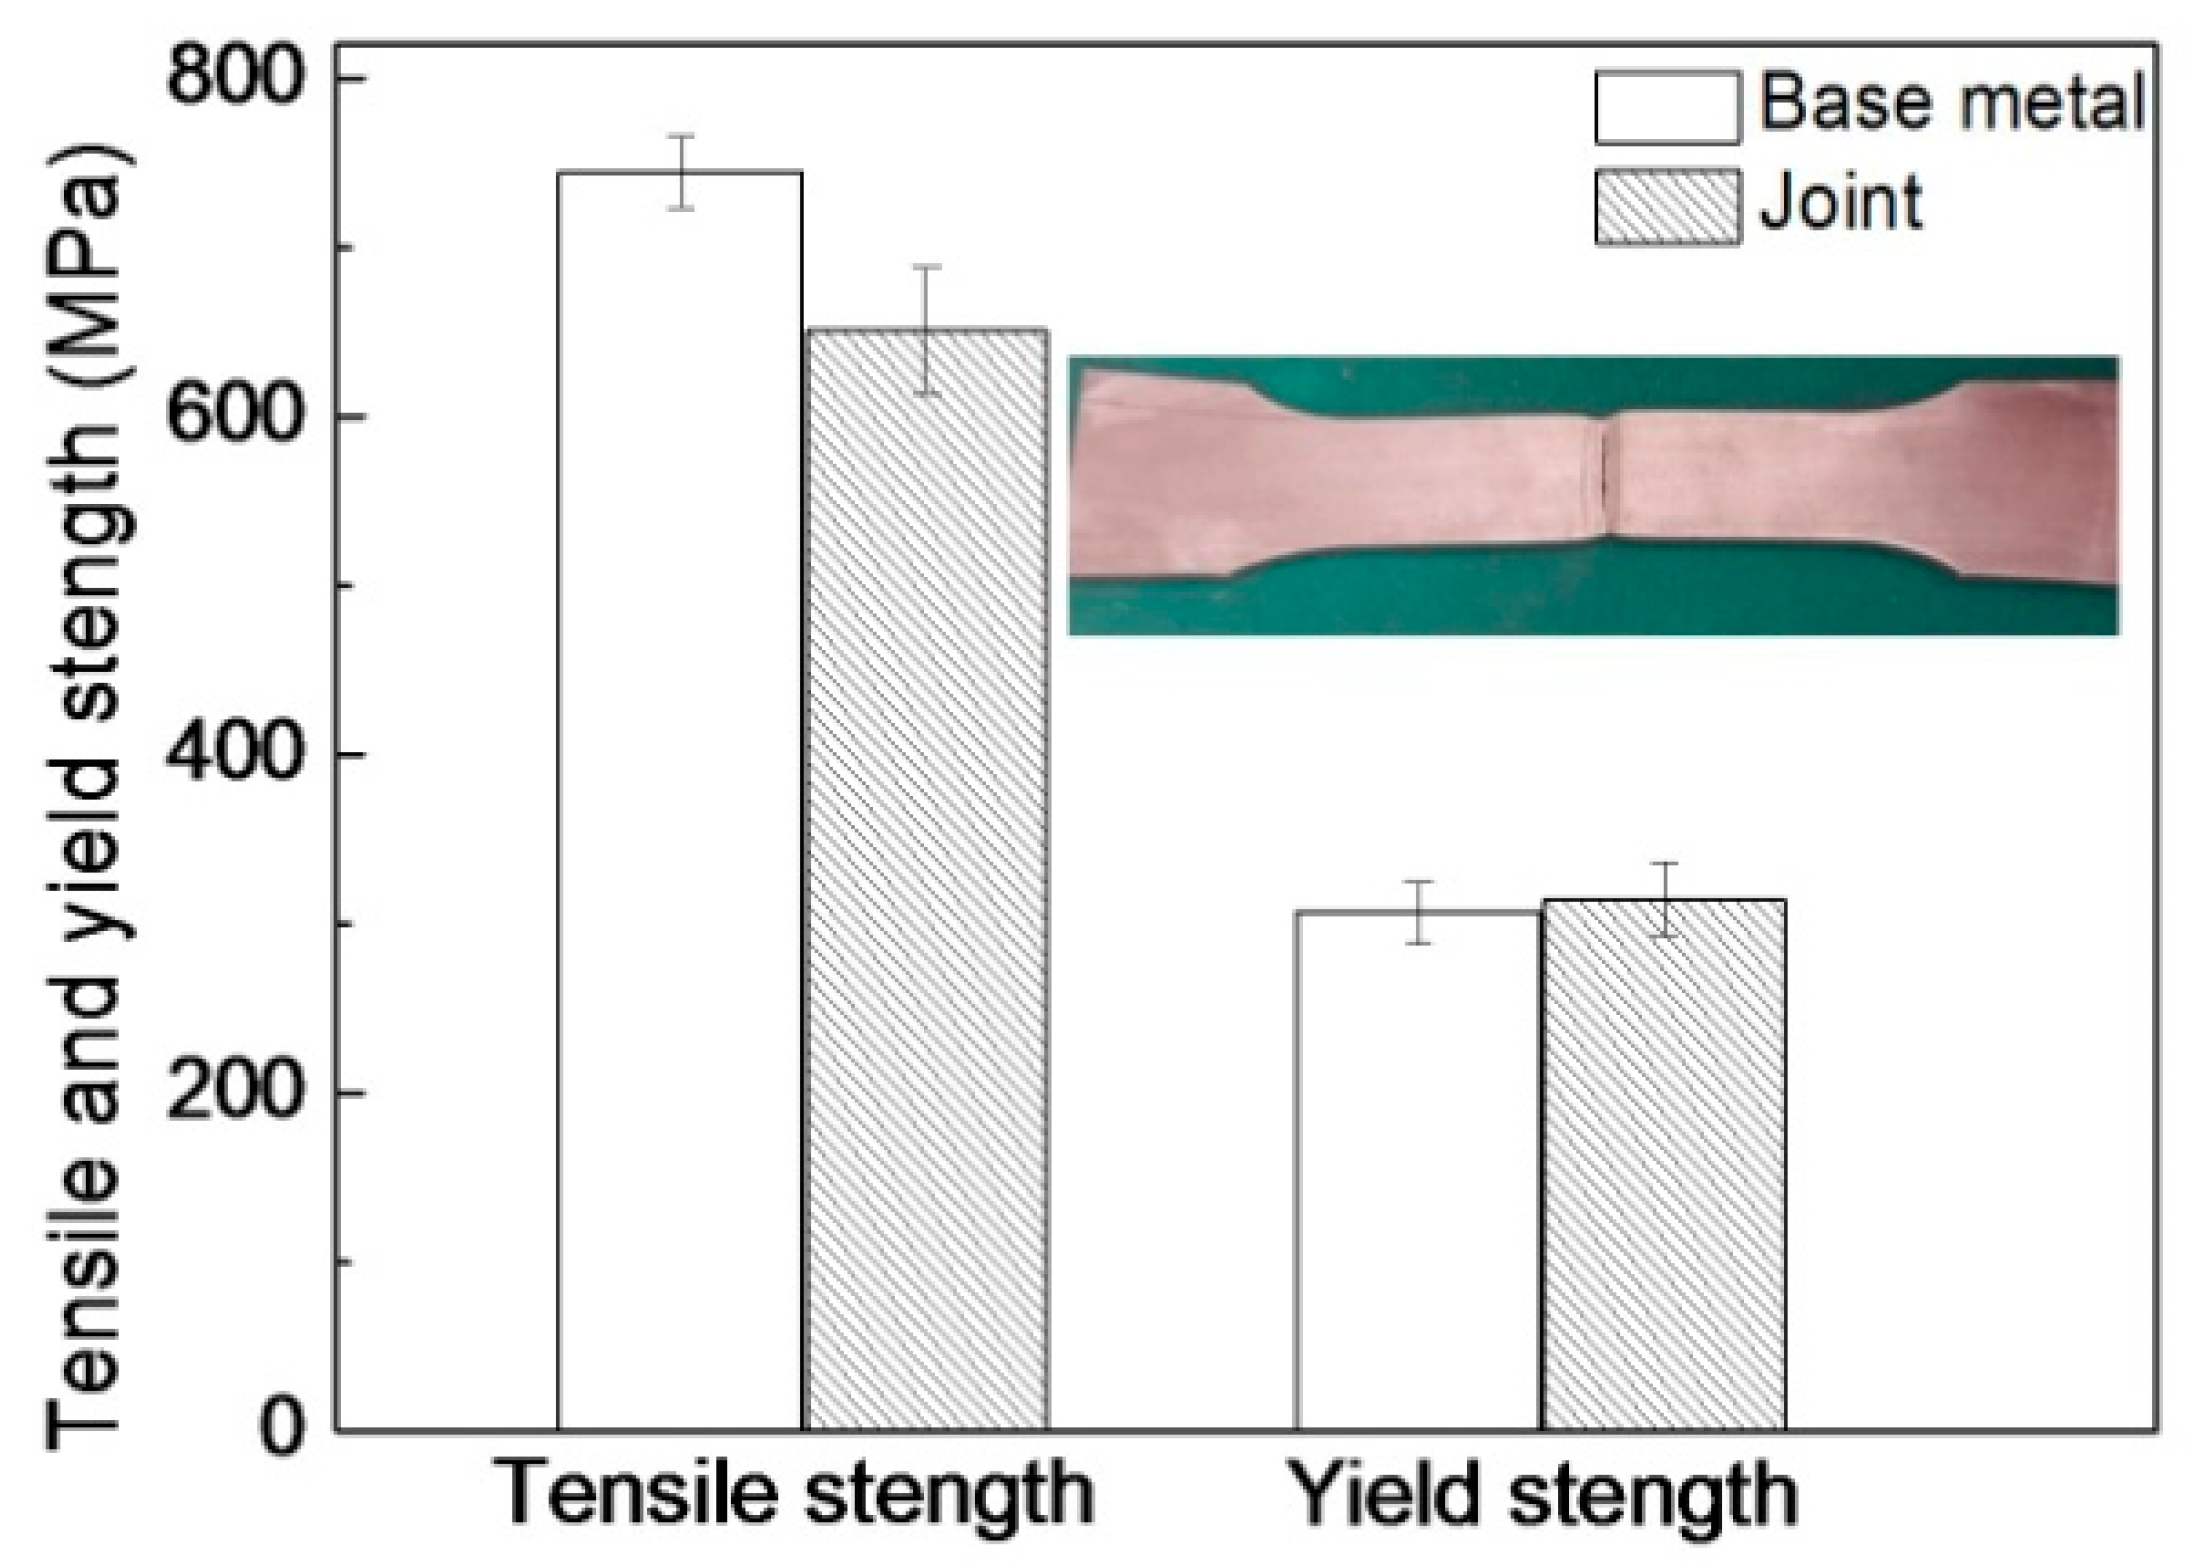
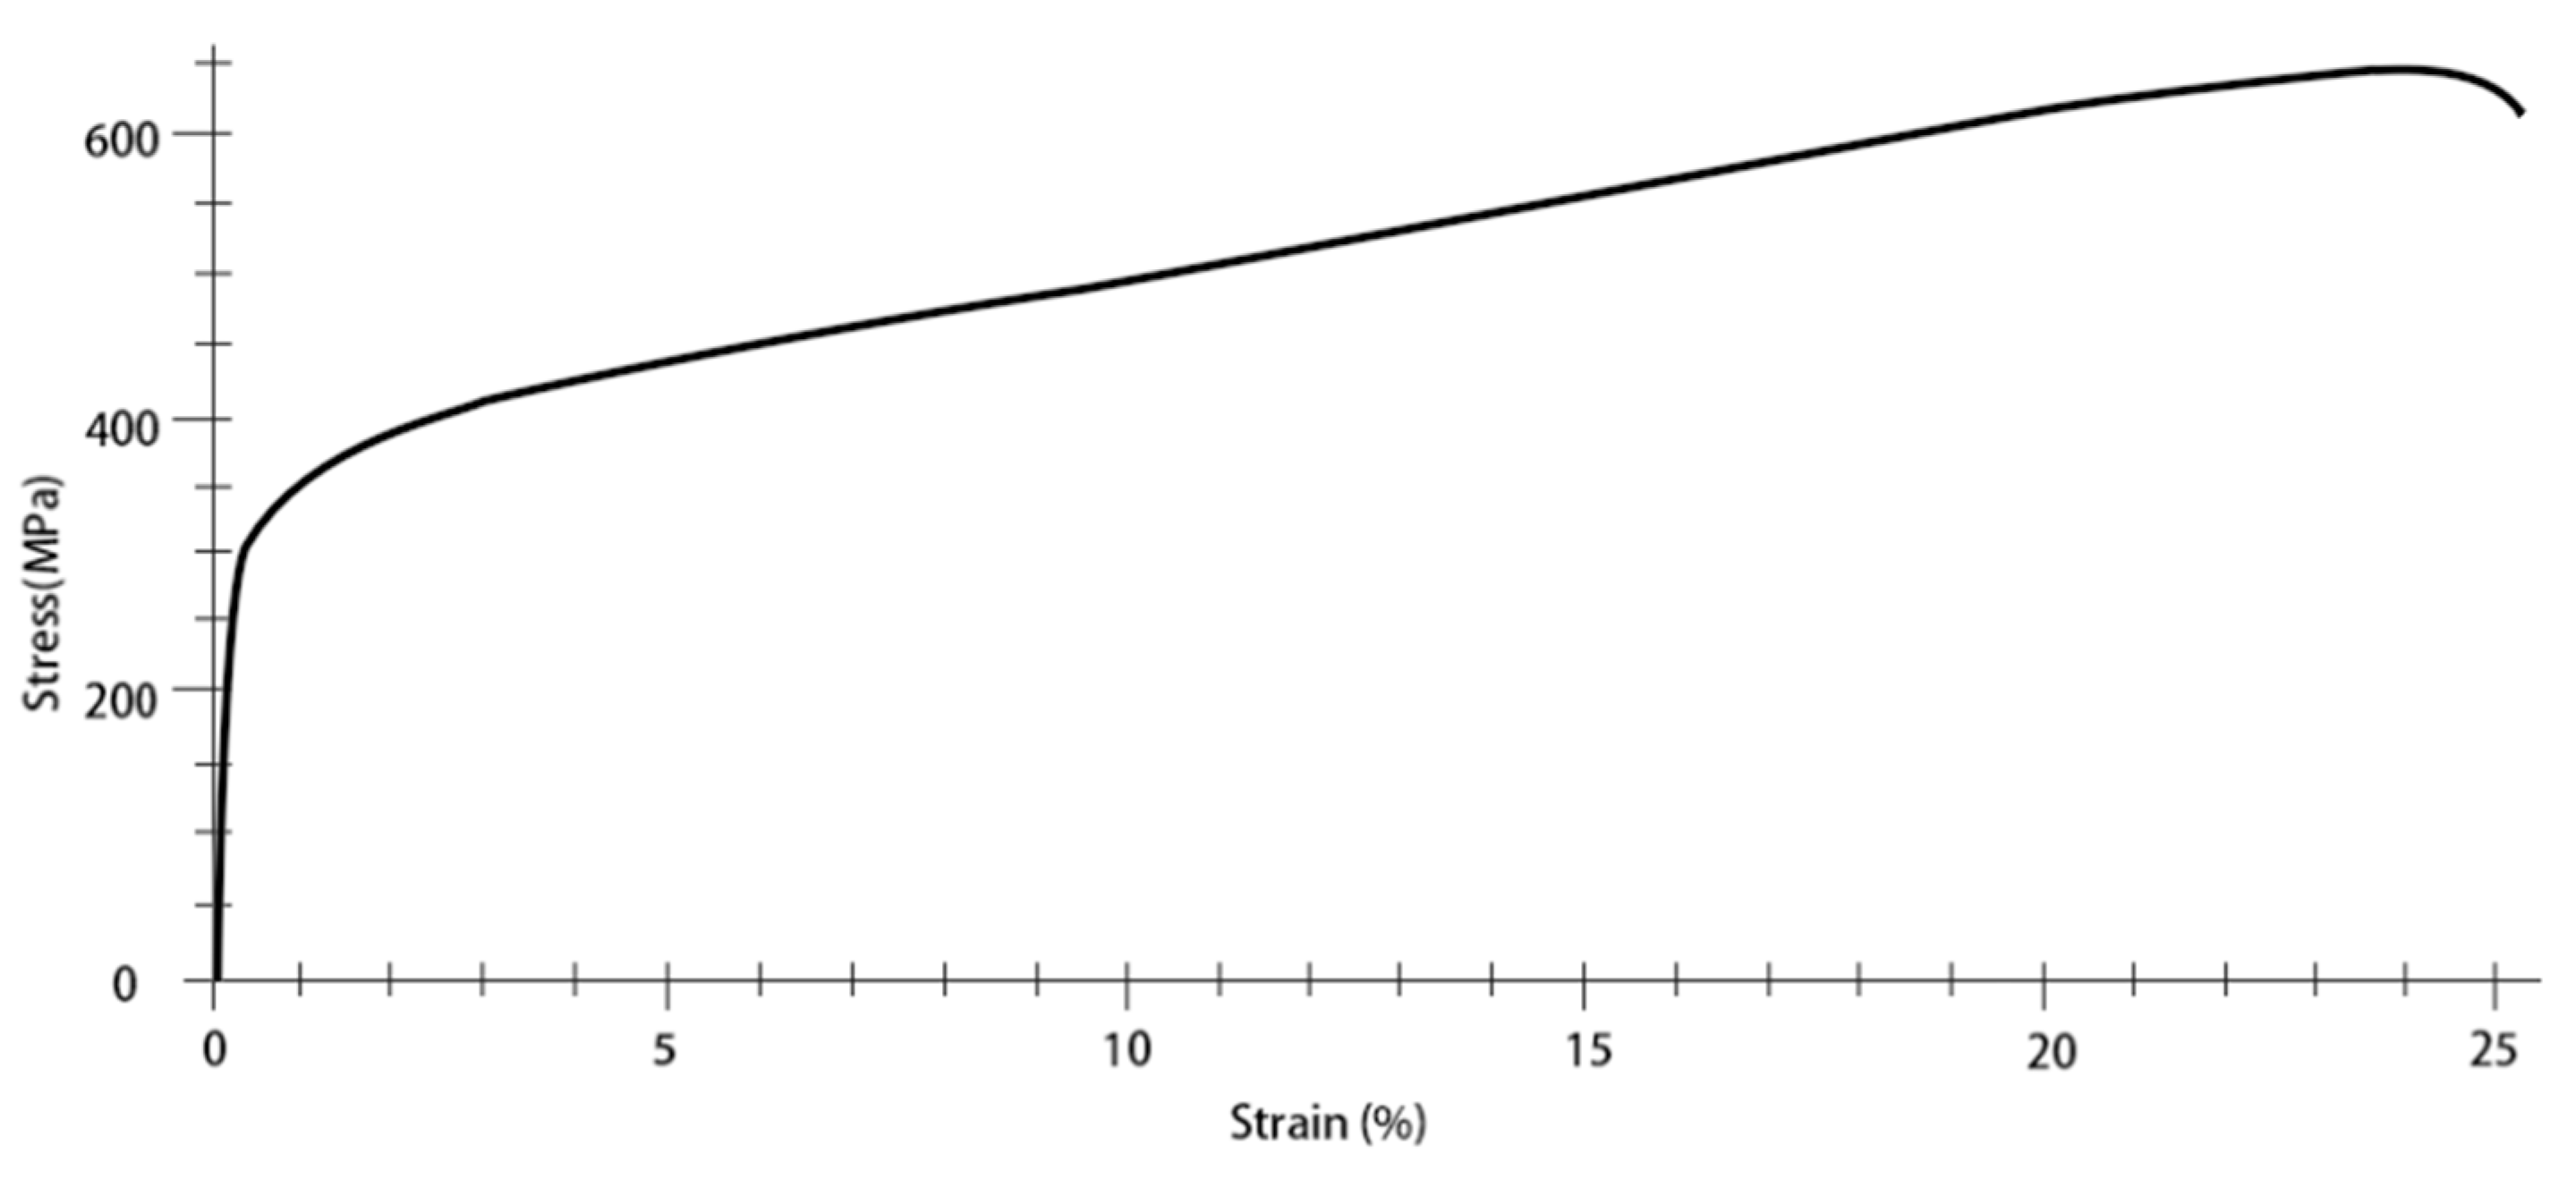
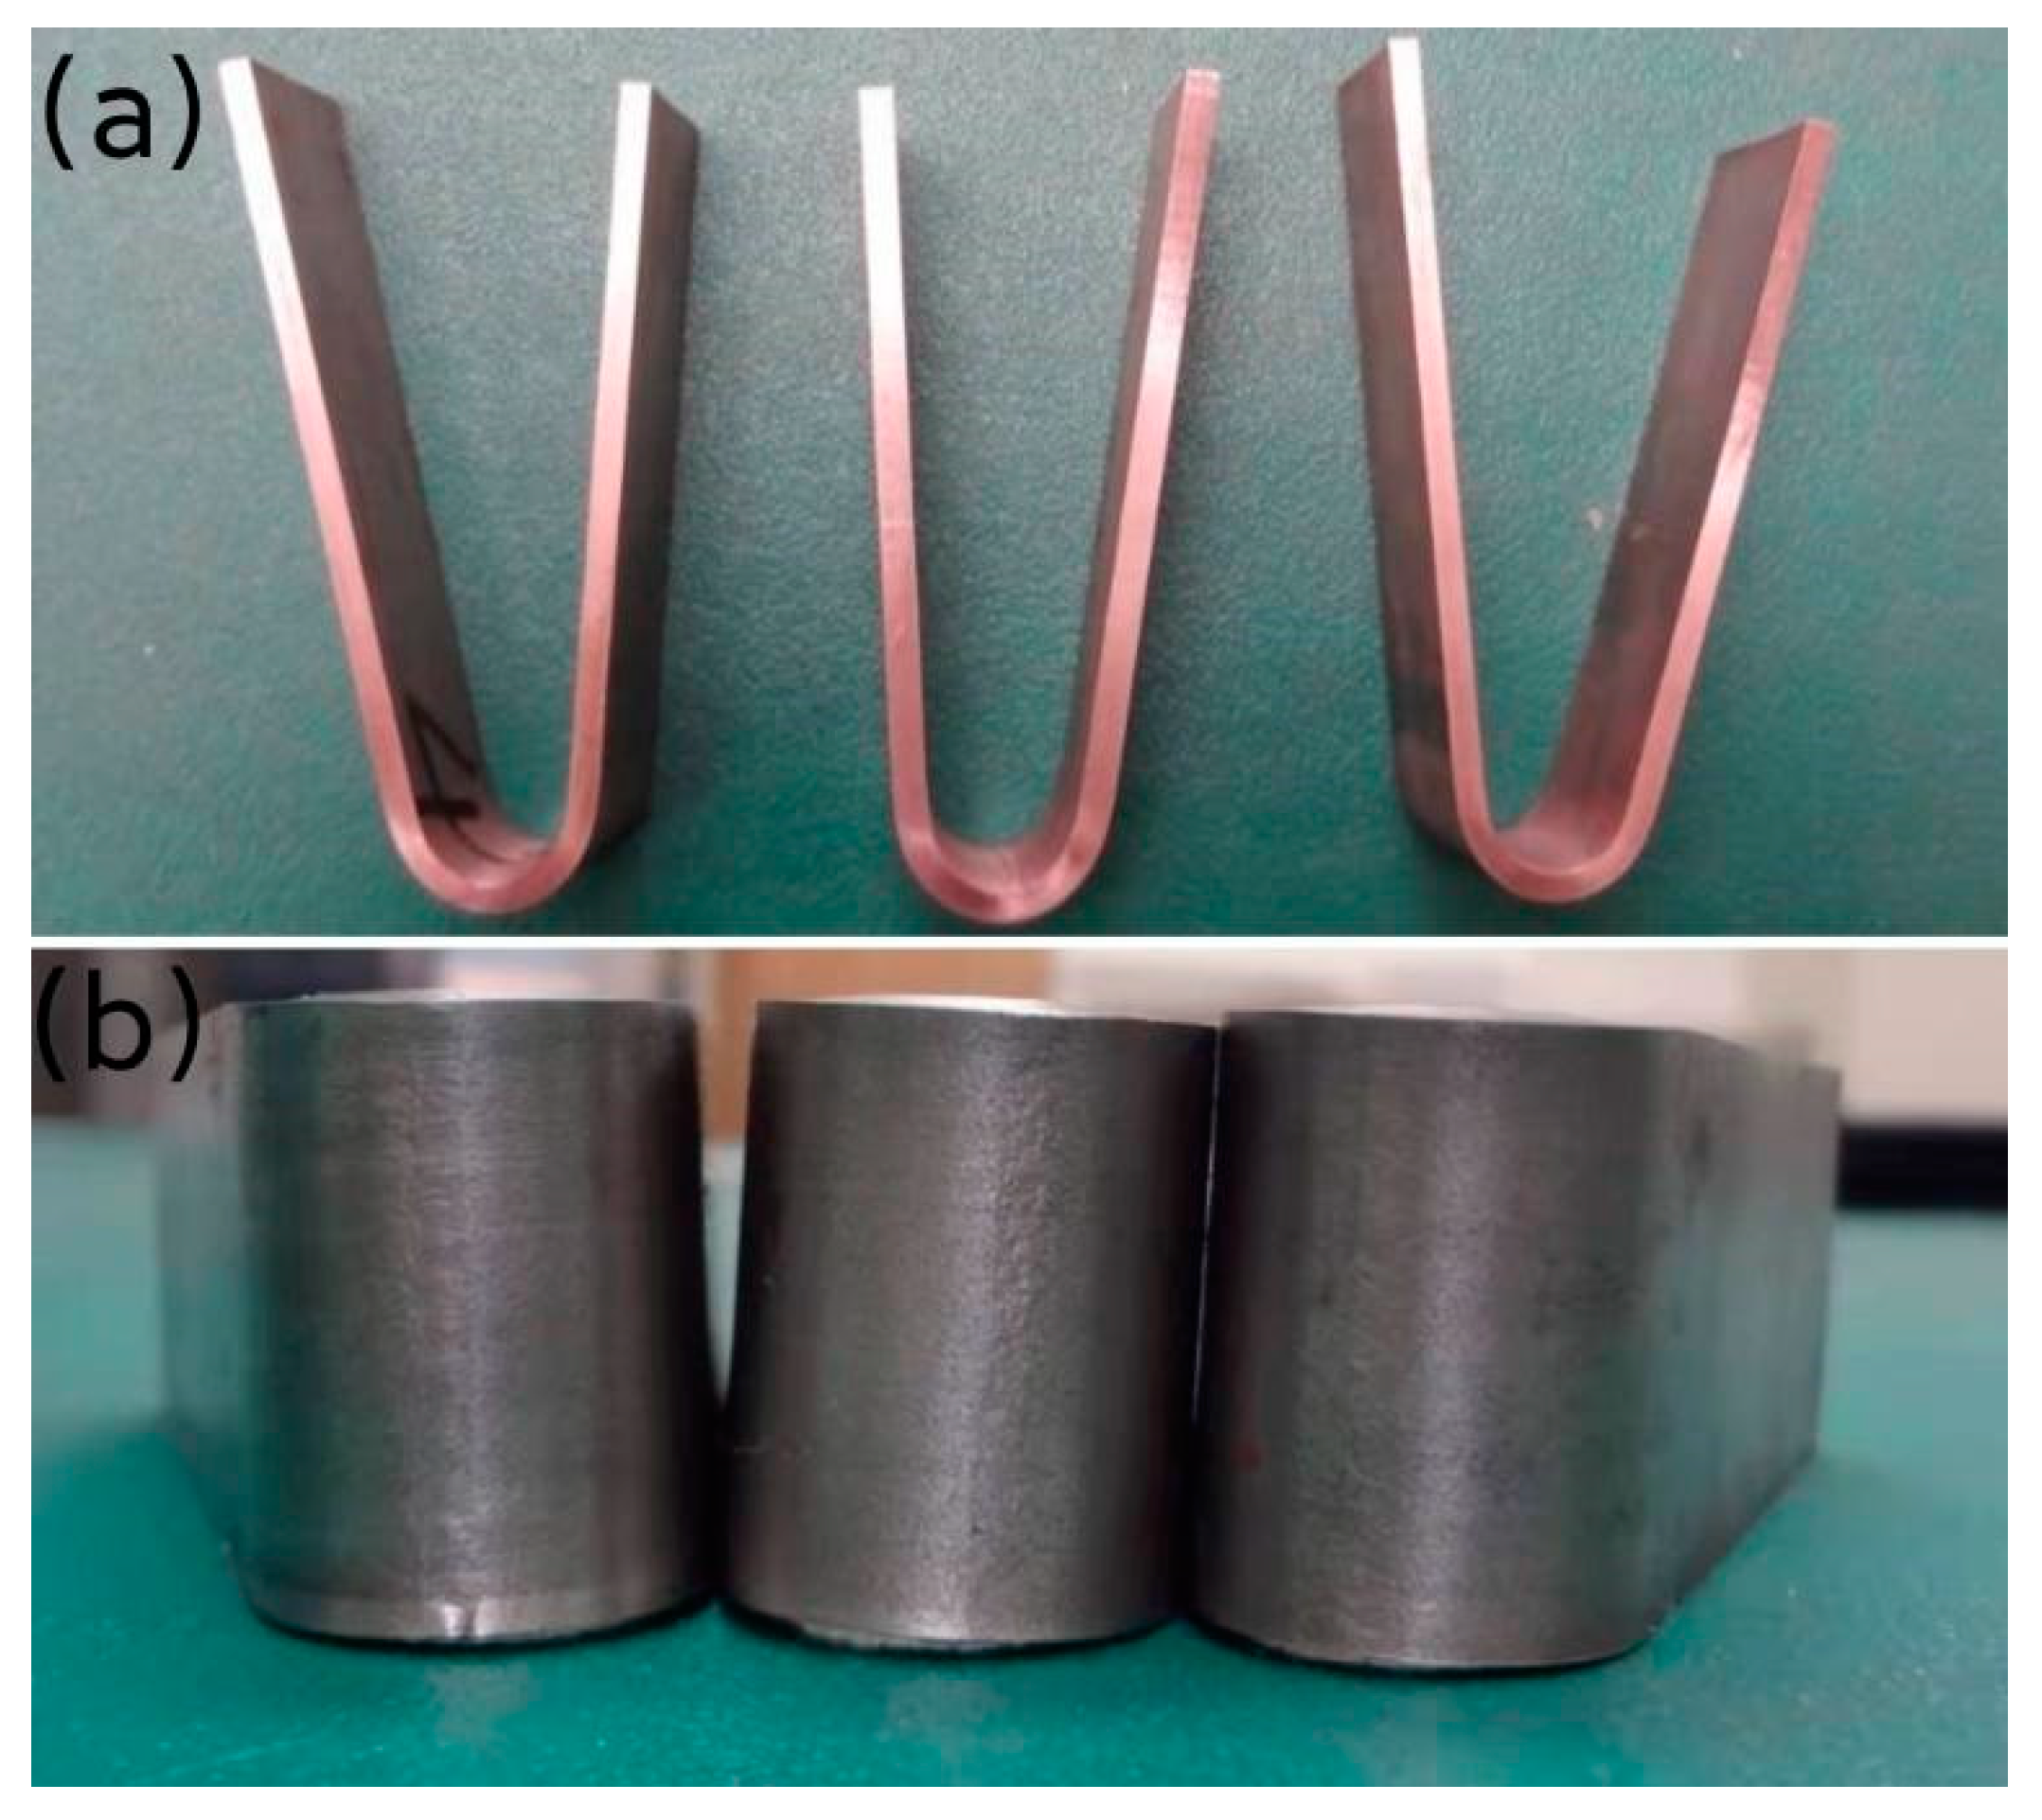
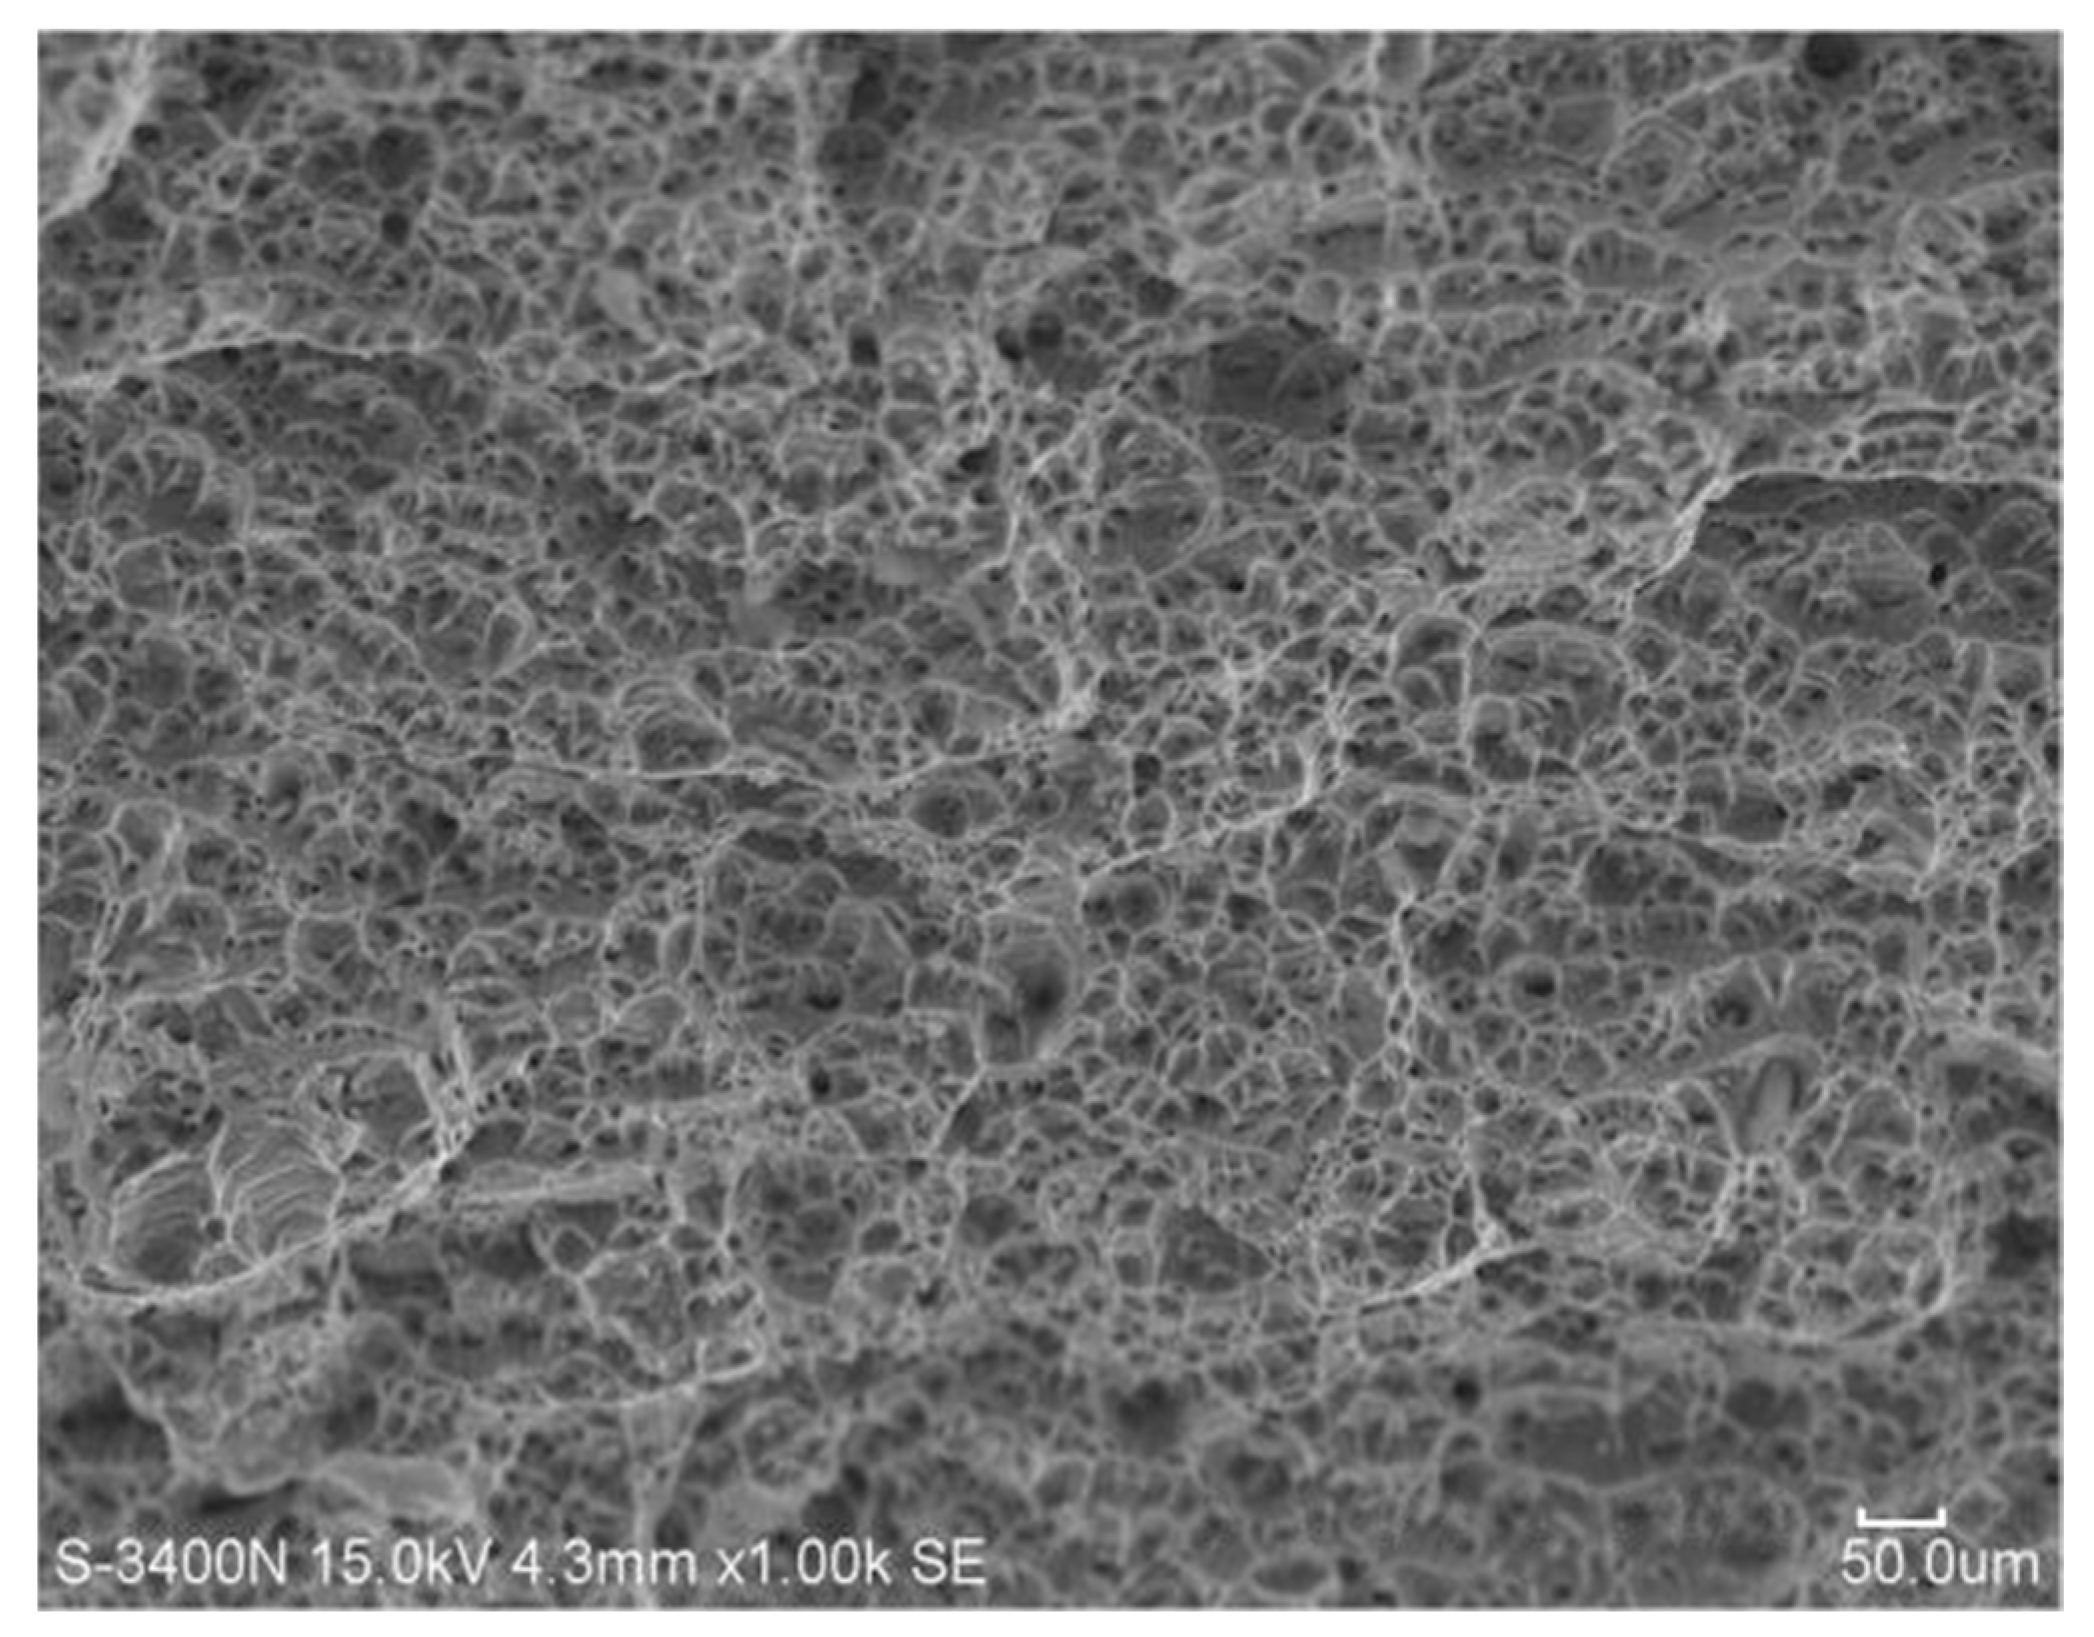
- The micro-hardness of the weld seam is almost equal to that of the base metal, which is slightly lower than that of HAZ. The tensile strength of the welding joint is 87% of that of the base metal, while the yield strength of the joint is slightly higher than that of the base metal.
Author Contributions
Funding
Institutional Review Board Statement
Informed Consent Statement
Data Availability Statement
Conflicts of Interest
References
- Onozuka, M.; Alfile, J.P.; Aubert, P.; Dagenais, J.F.; Grebennikov, D.; Ioki, K.; Jones, L.; Koizumi, K.; Krylov, V.; Maslakowski, J.; et al. Manufacturing and maintenance technologies developed for a thick-wall structure of the ITER vacuum vessel. Fusion Eng. Des. 2001, 55, 397–410. [Google Scholar] [CrossRef]
- Jokinen, T.; Karhu, M.; Kujanpaa, V. Welding of Thick Austenitic Stainless Steel Using Nd:Yttrium-Aluminum-Garnet Laser with Filler Wire and Hybrid Process. J. Laser Appl. 2003, 15, 220–224. [Google Scholar] [CrossRef]
- Coste, F.; Janin, F.; Hamadou, M.; Fabbro, R. Deep Penetration Laser Welding with Nd:Yag Lasers Combination up to 11 kW Laser Power. Proc. SPIE 2003, 4831, 422–427. [Google Scholar]
- Shuey, R.T.; Barlat, F.; Karabin, M.E. Experimental and Analytical Investigations on Plane Strain Toughness for 7085 Aluminum Alloy. Metall. Mater. Trans. A 2009, 40, 365–376. [Google Scholar] [CrossRef][Green Version]
- Staley, J.T.; Liu, J.; Ji, H. Aluminum Alloys for Aerostructures. Adv. Mater. Process. 1997, 152, 10–17. [Google Scholar]
- Ohnishi, T.; Kawahito, Y.; Mizutani, M.; Katayama, S. Butt welding of thick, high strength steel plate with a high power laser and hot wire to improve tolerance to gap variance and control weld metal oxygen content. Sci. Technol. Weld. Join. 2013, 18, 314–322. [Google Scholar] [CrossRef]
- Kawahito, Y.; Mizutani, M.; Katayama, S. High quality welding of stainless steel with 10 kW high power fibre laser. Sci. Technol. Weld. Join. 2009, 14, 288–294. [Google Scholar] [CrossRef]
- Khodakov, V.D.; Danilov, A.I.; Khodakov, D.V.; Praliev, D.A.; Abrosin, A.A.; Gutorov, D.A. Investigation and development of technology for automatic argon-arc narrow gap welding of Du-850 pipes for reactor cooling plant to water-water reactors. Weld. Int. 2015, 29, 372–378. [Google Scholar] [CrossRef]
- Rathod, D.W.; Sun, Y.; Obasi, G.; Roy, M.J. Effect of multiple passes on Lüders/yield plateaus, microstructure and tensile behaviour of narrow-gap thick-section weld plates. J. Mater. Sci. 2019, 54, 12833–12850. [Google Scholar] [CrossRef]
- Qian, X.; Ye, X.; Hou, X.; Wang, F.; Li, S.; Yu, Z.; Yang, S.; Huang, C.; Cui, J.; Zhu, C. Effect of 580 degrees C (20 h) Heat Treatment on Mechanical Properties of 25Cr2NiMo1V Rotor-Welded Joints of Oscillating Arc (MAG) Narrow Gap Thick Steel. Materials 2021, 14. [Google Scholar] [CrossRef]
- Yang, T.; Xu, D.; Chen, W.; Yang, R.; Lv, S. Microstructure evolution and deformation resistance of heavy-thickness Ti-6Al-4V narrow-gap welded joints. Mater. Lett. 2019, 250, 116–118. [Google Scholar] [CrossRef]
- Srinivasan, G.; Arivazhagan, B.; Albert, S.K.; Bhaduri, A.K. Development of Filler Wires for Welding of Reduced Activation Ferritic Martenstic Steel for India’s Test Blanket Module of ITER. Fusion Eng. Des. 2011, 86, 446–451. [Google Scholar] [CrossRef]
- Elmesalamy, A.S.; Li, L.; Francis, J.A.; Sezer, H.K. Understanding the Process Parameter Interactions in Multiple-pass Ultra-narrow-gap Laser Welding of Thick-section Stainless Steels. Int. J. Adv. Manuf. Technol. 2013, 68, 1–17. [Google Scholar] [CrossRef]
- Yu, Y.C.; Huang, W.; Wang, G.Z.; Wang, J.; Meng, X.X.; Wang, C.M.; Yan, F.; Hu, X.Y.; Yu, S.F. Investigation of Melting Dynamics of Filler Wire During Wire Feed Laser Welding. J. Mech. Sci. Technol. 2013, 27, 1097–1108. [Google Scholar] [CrossRef]
- Zhou, Z.; Wu, W.; Wei, J.; Du, S.; Han, S.; Liu, L.; Yu, X.; Li, H.; Foussat, A.; Libeyre, P. Research on Manufacture and Enclosure Welding of ITER Correction Coils Cases. IEEE Trans. Appl. Supercond. 2012, 22, 4202603. [Google Scholar] [CrossRef]
- Liu, G.; Tang, X.; Xu, Q.; Lu, F.; Cui, H. Effects of active gases on droplet transfer and weld morphology in pulsed-current NG-GMAW of mild steel. Chin. J. Mech. Eng. 2021, 34, 66. [Google Scholar] [CrossRef]
- Zhang, X.D.; Ashida, E. Welding of Thick Stainless Steel Plates up to 50 mm with High Brightness Lasers. J. Laser Appl. 2011, 23, 022002. [Google Scholar] [CrossRef]
- Yu, Y.C.; Yang, S.L.; Yin, Y.; Wang, C.M.; Hu, X.Y.; Meng, X.X.; Yu, S.F. Multi-pass laser welding of thick plate with filler wire by using a narrow gap joint configuration. J. Mech. Sci. Technol. 2013, 27, 2125–2131. [Google Scholar] [CrossRef]
- Phaoniam, R.; Shinozaki, K.; Yamamoto, M.; Kadoi, K.; Tsuchiya, S.; Nishijima, A. Development of a Highly Efficient Hot-wire Laser Hybrid Process for Narrow-gap Welding—welding Phenomena and Their adequate Conditions. Weld. World 2013, 57, 607–613. [Google Scholar] [CrossRef]
- Wu, S.K.; Zhang, G.W.; Zou, J.L.; Dong, B.Z.; Li, F.; Xiao, R.S. Ultra-narrow-groove laser welding for heavy sections in ITER. Weld. J. 2016, 95, 300S–308S. [Google Scholar]
- General Administration of Quality Supervision, Inspection and Quarantine of the People’s Republic of China and China National Standardization Administration. GB/T 228.1-2010 Tensile Test of Metallic Materials Part 1: Room Temperature Test Method; General Administration of Quality Supervision, Inspection and Quarantine of the People’s Republic of China and China National Standardization Administration: Beijing, China, 2010.
- Duley, W.W. (Ed.) Laser Welding; John Wiley & Sons, Inc.: Hoboken, NJ, USA, 1998. [Google Scholar]
- Agelaridou, A. Thermal and Solidification Modeling of Welding: A Design Tool Approach. Ph.D. Thesis, Tufts University, Boston, MA, USA, 2002; pp. 60–568. [Google Scholar]
- Hirano, K.; Fabbro, R.; Muller, M. Experimental determination of temperature threshold for melt surface deformation during laser interaction on iron at atmospheric pressure. J. Phys. D Appl. Phys. 2011, 44, 435402. [Google Scholar] [CrossRef]
- Zou, J.L.; He, Y.; Wu, S.K.; Huang, T.; Xiao, R.S. Experimental and theoretical characterization of deep penetration welding threshold induced by 1-μm laser. Appl. Surf. Sci. 2015, 357, 1522–1527. [Google Scholar] [CrossRef]


Publisher’s Note: MDPI stays neutral with regard to jurisdictional claims in published maps and institutional affiliations. |
© 2022 by the authors. Licensee MDPI, Basel, Switzerland. This article is an open access article distributed under the terms and conditions of the Creative Commons Attribution (CC BY) license (https://creativecommons.org/licenses/by/4.0/).
Share and Cite
Zhang, G.; Yu, F. Ultra-Narrow Gap Fiber Laser Conduction Welding Technology for 304 Stainless Steel Thick Plates and the Mechanical Properties of Welding Joints. Coatings 2022, 12, 59. https://doi.org/10.3390/coatings12010059
Zhang G, Yu F. Ultra-Narrow Gap Fiber Laser Conduction Welding Technology for 304 Stainless Steel Thick Plates and the Mechanical Properties of Welding Joints. Coatings. 2022; 12(1):59. https://doi.org/10.3390/coatings12010059
Chicago/Turabian StyleZhang, Guowei, and Feihu Yu. 2022. "Ultra-Narrow Gap Fiber Laser Conduction Welding Technology for 304 Stainless Steel Thick Plates and the Mechanical Properties of Welding Joints" Coatings 12, no. 1: 59. https://doi.org/10.3390/coatings12010059
APA StyleZhang, G., & Yu, F. (2022). Ultra-Narrow Gap Fiber Laser Conduction Welding Technology for 304 Stainless Steel Thick Plates and the Mechanical Properties of Welding Joints. Coatings, 12(1), 59. https://doi.org/10.3390/coatings12010059


