1. Introduction
The rapid urbanization of populations occurring around the globe has led to drastic changes in the natural environment, from species displacement and water contamination to air or light pollution. As cities become larger and more populated, the infrastructure needs to be maintained as soon as the influx of people quickly takes the place of natural forests and other ecosystems. These natural land surfaces are, therefore, being replaced by man-made infrastructures that contribute heat release through human activities [
1]. Man-made construction materials, such as concrete and asphalt, which have a high specific heat capacity, are part of this process. These infrastructures lead to the urban heat island (UHI) effect, which is found to create a 1 to 3 °C annual air temperature increase in cities [
1]. The term UHI can be used to refer to any area that is relatively hotter than its surroundings, but, in general, it refers to human-disturbed areas [
2]. UHI is a complicated phenomenon mainly caused by the modification of land surfaces [
3]. In addition, waste heat generated by energy usage is a secondary contributor [
4]. Population growth in a certain area result in an average temperature increase. In this paper, we specifically address the contribution of pavements to the UHI phenomenon, whereby urban regions experience warmer temperatures than their rural surroundings. Climate model projections found that heat stress increases twice as much as a result of climate change in cities compared to rural areas, leading to longer and more extreme heat waves [
5]. Existing studies linked this UHI effect to human well-being and health problems. Heat waves were determined to result in high mortality rates [
6], more hospital admissions [
7], and higher energy usage [
8]. It was also shown that UHI resulted in more energy consumption for air conditioning and other building cooling methods [
9]. In Phoenix, AZ, nighttime UHI intensity leads to an increase in water usage [
10]. Mitigation strategies such as cool pavements or cool roofs have the potential to limit these consumer costs [
11,
12].
Pavements typically comprise 30%~45% of the land area in major cities and contribute significantly to the UHI effect through the low reflection of solar radiation and high levels of thermal storage [
13]. The influence of pavements in the formation and mitigation of the UHI was recognized by the transportation society to examine the relationship of pavement materials to urban climate concerns. Hot pavements aggravate urban heat islands by warming the local air and contribute to the global warming by radiating heat into the atmosphere. Conventional paving materials can reach peak summertime temperatures of 120–150 °F (48–67 °C), transferring excess heat to the air above them [
5]. Albedo can play a significant role in this regard.
Solar reflectance is the percentage of solar energy reflected by a surface. The majority of the sun’s energy is found in the visible wavelengths; thus, solar reflectance is correlated with a material’s color. Darker surfaces tend to have lower solar reflectance values than lighter surfaces. The absorbed heat increases surface temperatures and contributes to the formation of surface and atmospheric urban heat islands. Although solar reflectance is the main determinant of a material’s surface temperature, thermal emittance, or emissivity, also plays a role in this case. Thermal emittance is a measure of a surface’s ability to shed heat or emit long-wave (infrared) radiation. All things equal, surfaces with high emittance values stay cooler, because they release heat more readily.
Dark pavements absorb a large amount of sunlight, which is released back into the environment, warming the air around it. In California, the average surface temperature of asphalt on a typical spring afternoon is about 40.0 °C, while for concrete it is 33.6 °C [
14]. This is considerably warmer than the average temperature of 25.4 °C for grass [
15]. One way to reduce these effects is to increase the reflectivity of pavement using a solar-reflective coating. However, reflective pavements can also be achieved through many other techniques, which include conventional cement concrete pavement technology; roller-compacted concrete pavement technology; utilizing fly ash and slag in concrete pavement; using a white topping technique; using light aggregates in asphalt concrete surfaces; using sand seals along with light aggregates; applying color pigments and seals; applying colorless reflective synthetic binders; painting on the pavement surface; using sand blasting; resin-based pavements, etc. [
16,
17,
18,
19].
Previous studies have shown that using these functional coatings can reduce the surface temperature of asphalt pavements by 13 °C, and white concrete by 4 °C, depending on the type of asphalt or concrete and the coating used [
14,
20,
21]. Increasing the albedo of pavements using heat-reflective coatings has many benefits including emission reductions, improved comfort, increased driver safety at night, reduced street lighting cost and slowed climate change [
14,
20]. Albedo defines how well this surface would reflect solar energy and varies between 0 and 1. A value of 0 means the considered surface is a perfect absorber, and a value of 1 means that the surface is a perfect reflector. Thus, solar reflectance refers specifically to visible light only, the visible portion of the solar radiation spectrum. The term, albedo, refers to the overall solar radiation reflectance, not just the visible portion of the spectrum [
22]. The basic concept of the heat-reflective coatings can be seen in
Figure 1. An uncoated paved surface reflects less solar radiation, as shown in A, than a surface that is coated, shown in B. Because of this, the coated surface remains cooler than the uncoated surface during the day. Note that, albedo is the measure of the diffuse reflection of solar radiation out of the total solar radiation and is measured on a scale from 0, corresponding to a black body that absorbs all incident radiation, to 1, corresponding to a body that reflects all incident radiation. Surface albedo is defined as the ratio of radiosity
to the irradiance
(flux per unit area) received by a surface [
23]. The proportion reflected is not only determined by properties of the surface itself, but also by the spectral and angular distribution of solar radiation reaching the Earth’s surface. These factors vary with atmospheric composition, geographic location, and time. While bi-hemispherical reflectance is calculated for a single angle of incidence, albedo is the directional integration of reflectance over all solar angles within a given period. The temporal resolution may range from seconds (as obtained from flux measurements) to daily, monthly, or annual averages. For fresh asphalt albedo is 0.04, and for worn asphalt albedo is 0.12 [
24], while new concrete can achieve an albedo of 0.55 [
25].
Cool pavements refer to technologies that can store less heat by reflecting more sunlight with novel coating materials, in order to achieve lower surface temperatures compared with conventional pavements [
20]. Thus, because these pavements have a lower surface temperature, they transmit less heat to the surrounding air. This will keep the temperature of the surrounding area lower, and can help address the problem of urban heat islands, which result in part from the increased temperatures of paved surfaces in a city or suburb. However, emerging cool pavement technologies are not yet as developed as other heat island mitigation strategies, and there is no official standard or labeling program to designate cool paving materials. Many studies measured the role that pavements play in creating urban heat islands, or the impact that cooler pavements can have on reducing the heat island effect [
5,
11,
12,
16,
17,
18,
19,
20]. As such, an alternative paving system is necessary to address this problem in reducing the heating problems in the urban areas. Researchers at Lawrence Berkeley National Laboratory (LBNL) estimated that every 10 percent increase in solar reflectance could decrease surface temperatures by 7 °F (4 °C) [
26]. Furthermore, they predicted that if pavement reflectance throughout a city were increased from 10 percent to 35 percent, the air temperature could potentially be reduced by 1 °F (0.6 °C) [
19]. Moreover, reflective pavements are more effective compared to some other technologies, such as evaporative pavements or phase-change-materials (PCM)-incorporated pavements. Evaporative pavements, which are permeable and porous in nature present a lower albedo and higher convective flux to the atmosphere [
27]. Thus, heat-reflective pavements can potentially be used as an alternate cool pavement technology in mitigating UHI impacts in urban areas.
Thus, reflective pavement technology allows the pavements to lower the urban temperature by facilitating more sunlight reflection from their surfaces. These pavements have the property of high solar reflectance, allowing them to reflect most of the solar radiation during the day and release the remaining absorbed heat during the nighttime [
28]. There are many advantages of reflective pavements. They can decrease the temperature of the outside air and save on power consumption. Reflective pavements cool the air, which can minimize heatwave problems, as well as heat-related illness. It can reduce the heat absorbed by the Earth’s surface, and thus, can potentially minimize the impact of greenhouse gases. However, reflective pavements have some limitations such as glaring problems and a low durability [
29]. Because of the inconsistent results from the application of heat-reflective coatings to pavements for controlling temperature increases, we require an end-to-end evaluation within a robust experimental framework.
In this study, a lab-controlled experimental measurement was conducted to evaluate the performance of the proposed reflective pavement, after using coatings with added pigments or seals in them to increase the reflectance. The goal was to examine the temperature performance of the coating under varying weather conditions in a controlled heating environment. A heat-reflective coating was supplied by Decorative Paving Solutions from Tempe, Arizona. The reflectivity of this coating, or the amount of solar radiation that reflects off the surface without being absorbed by the pavement, is 0.43. The findings from this work are intended to better understand the key mechanisms affecting the coating performance, i.e., the selection of coating types under different weather conditions, and to enhance the optimization of the heat-reflective coating material selection and design procedures.
1.1. Infrared Thermography Background
Infrared Thermography (IRT) is a great tool for measuring the surface temperature of a target object both quickly and accurately. IRT uses infrared radiation readings to calculate the temperature of an object. A high-speed infrared camera records the temperature of the material surface as the heat energy diffuses through the material. When the target is struck by solar radiation, there are three dissipation methods: absorption, transmission, and reflection [
30]. However, in non-transparent objects, the transmittance can be ignored [
25]. We know that the temperature calculated by the thermal camera is related to the infrared radiation of the target object, calculated mathematically with Equation (1). This is the Stefan–Boltzmann formula for a graybody radiator, which states that the total emissive power of this radiator is proportional to the fourth power of its absolute temperature. Here, the pavement surface is considered as a graybody material while running the test and measuring the temperature:
where
is the total emissive power in
,
is emissivity,
is the Stefan–Boltzmann constant, and
is the temperature. Emissivity, ε, is equal to 1 for black bodies and less than 1 for grey bodies. Thus, for a same temperature, the emissive power of the pavement surface is reduced in a proportion to the value of emissivity,
, compared to a black body material.
When using IRT, essentially, the larger the intensity of infrared radiation, the higher the temperature is. However, when receiving radiation from a target object, the thermal camera also receives radiation from many different sources, including the absorbed and reemitted radiation from the target object, the reflected radiation from the target object, and the radiation from other sources, including the objects’ surroundings and the atmosphere [
26], as shown in
Figure 2. It is noteworthy that the radiation from these multiple sources is measured at different wavelengths. However, our thermal camera, FLIR T430SC, records long-wave infrared radiation between 7 μm and 14 μm.
From here, the camera calculates the temperature of the objects surface using Equation (2) [
31]:
where
determines the object temperature, which is the pavement surface in this work;
is the temperature of ambient sources; and
is the temperature of the atmosphere.
calculates the total received radiation power through the re-emitted radiation power of the object,
; reflected radiation power of the object,
; and the radiation power of the surrounding atmosphere,
. Thus,
estimates the emission from the target object,
estimates the reflected emission from ambient sources, and
estimates the emission from the atmosphere. Here,
is the reflectance of the object,
is the emittance of the atmosphere, and
is the transmittance of the atmosphere. This is the general measurement formula for this FLIR T430SC thermographic equipment.
In this equation, there are still several unknowns that the camera must also calculate. These are the atmospheric temperature, which is simply measured with a thermometer; the reflected temperature and emissivity, which are both calibrated for the camera before use; and the transmittance of the atmosphere. The atmospheric transmission is high (close to 1.0) at small distances around 25–50 m or less; therefore, the relative humidity does not have a large effect on readings unless the camera is at further distances from the target object, which is always the case for our experiment. It is noteworthy that we successfully published a series of infrastructure condition assessment studies using thermography [
30,
31,
32]. Other impacts of ambient weather conditions on the temperature of pavements are introduced in the following section.
1.2. Effects of Ambient Weather on Pavement Surface Temperature Readings
In addition to the uncertainties induced by the atmosphere, several ambient weather conditions affect the results of the temperature readings. Three main ambient conditions that affect the pavement surface temperature are air temperature, wind speed and humidity [
33].
The effects of air temperature on the temperature of paved surfaces are simple thermodynamics. During times when the air temperature is warmer than the surface temperature of the pavement, there will be a positive heat transfer into the paved surface as the two mediums approach equilibrium. This idea is typically represented by the morning hours when the sun has warmed the air, but the pavement is not yet warm. The same concept will occur when the air temperature is cooler than the surface temperature; however, in this case, there is a heat loss from the pavement to the surroundings. An example of this would be during nighttime when the paved surface is warmer than the ambient air.
The effects of wind speed on the surface temperature of a pavement slab are relatively intuitive. When wind is present, it creates a convective heat transfer coefficient, which, essentially, either stifles or exaggerates the heat transfer between the air and pavement. In general, when the surface temperature of pavement is hotter than the ambient air temperature, any wind cools the surface, which leads to overall convective heat loss, as shown in
Figure 3. Here, the convective heat loss surpasses the heat gain from the external heat source. This concept is comparable to a section of pavement which has been exposed to the sun for an extended period of time. We observe the opposite effect when the surface temperature is cooler than the surrounding air temperature. In this case, wind helps to warm the surface temperature and lead to the convective heat gain, as shown in
Figure 4 [
33]. In this case, warm air heats up the pavement surface, and thus convective heat gain surpasses heat loss.
Additionally, the wind speed plays a role in the heat transfer between the paved surface and air. A higher wind speed increases the rate of heat transfer between the two mediums, while a lower wind speed leads to a slower heat transfer rate. Furthermore, it was determined that a higher relative humidity increased the convective heat transfer coefficient [
34]. This would imply that when there is a high relative humidity paired with large wind speed, the convective heat loss and heat gain, as shown in
Figure 3 and
Figure 4, respectively, would be exaggerated.
There are several attempts in the literature to quantify the convective heat transfer coefficient. The heat convection,
at the surface of a pavement slab is given by Equation (3) [
35,
36]:
where
is the convective heat transfer coefficient in
,
is the surface temperature of the pavement slab, and
is the ambient air temperature. In order to relate the heat convection from Equation (3) to wind speed, the empirical Equations (4)–(6) were all found to accurately represent this value in different reports [
37,
38,
39]:
In each of these equations,
is the wind speed in m/s. The constants in these equations represent the average roughness of the slab without the effects of wind [
40]. To utilize these equations properly we need to meet some criteria based on the wind speed in the surrounding area [
41]. Thus, with these equations, it becomes possible to accurately incorporate the wind speed into a heat transfer model to quantify the temperature change within the pavement.
1.3. Heat Transfer Characteristics of Pavement
It is important to consider solar radiation and irradiation when analyzing the heat transfer characteristics of the pavement. Radiation refers to the short-wave radiation absorbed by the surface,
, and can be calculated with Equation (7) [
42]:
where
is the solar absorptivity of the pavement surface,
is the intensity factor that accounts for the sun’s angle throughout the day, and
is the daily peak value of solar radiation. As expected, the solar absorptivity varies greatly with surface color, ranging from 0.4 for some cooler pavements to 0.9 for some older and darker pavements. Solar radiation depends greatly on some weather patterns, mainly cloud coverage, and was found to be 1000
on a sunny day, 700
on a partly cloudy day and 300
on an overcast day.
Thermal irradiation,
, is characterized by an equation similar to the Stefan-Boltzmann equation [
43]:
In which ε is emissivity, σ is the Stefan-Boltzmann constant, is surface temperature and is the sky temperature. The impact of the coating on the heat transfer characteristics of the pavement materials is that it increases the reflectivity, leading to lower absorbance. The emissivity is assumed to remain stable at 0.9.
2. Methodology
We adopt the cool pavements approach, which works based on increasing the solar energy reflected from their surfaces using heat-reflective coatings. We conducted a series of lab-controlled experimental measurements to analyze these cool pavements, with consideration given to the performance of surface coating and treatment to combat the UHI effect. Varying weather conditions can affect the temperature of the pavement. To examine how these weather conditions changed the effectiveness of heat-reflective coating, an experimental setup reproducing several environmental weather conditions was utilized for both concrete and asphalt samples. The surface temperature profile measurements were taken using an infrared thermal camera. The effects of these weather conditions on the camera readings were also considered to accurately measure the temperature.
2.1. Experimental Setup
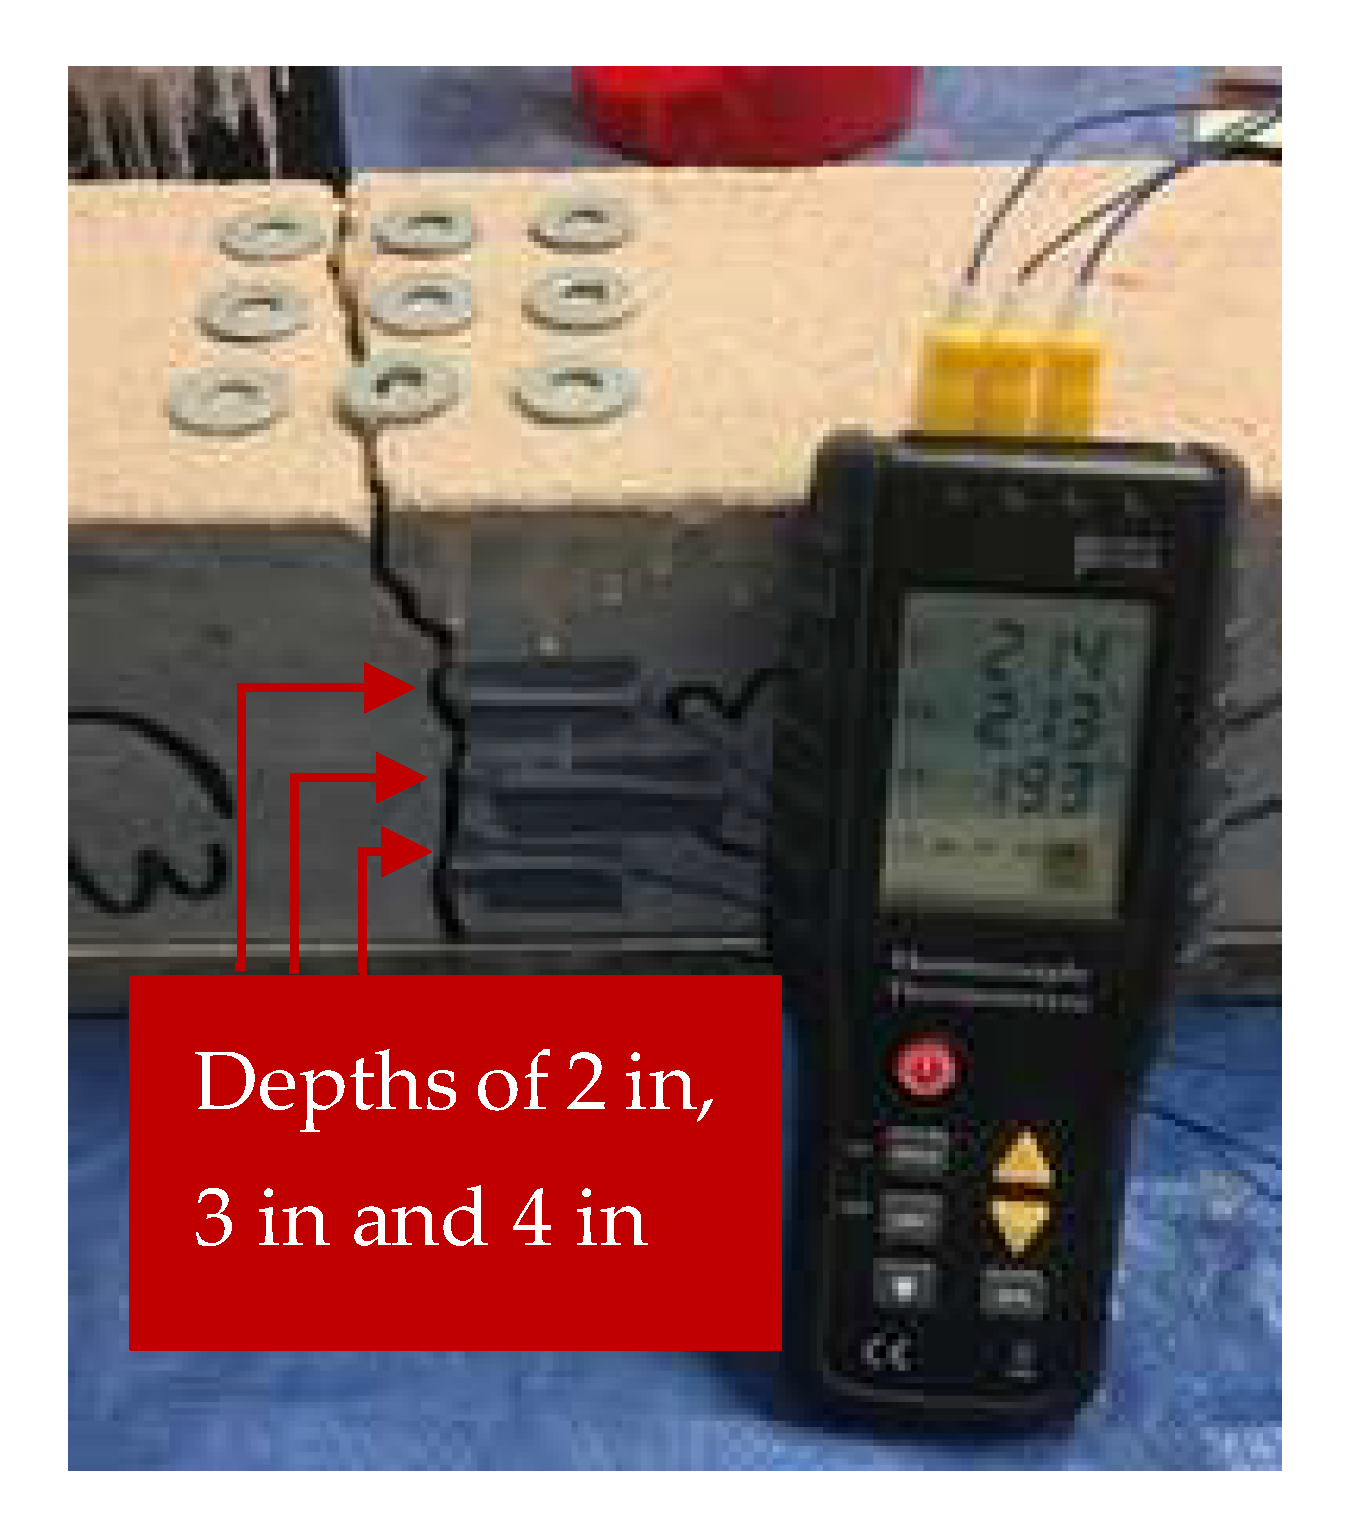
Two types of pavement materials, concrete and asphalt, were used to determine the effectiveness of heat-reflective coating. To begin, a 6 × 6 × 20-inch concrete slab was cast for use as a sample with no reinforcement included within. The strength of the slab was measured at 4500 psi. The slab was then broken into two separate pieces using a flexure test machine. The thermocouples were then placed inside the crack at the very center (3 inches from either side) at depths of 2 inches, 3 inches and 4 inches, as shown in
Figure 5.
For the asphalt, two cylinders were supplied by Idaho Asphalt Supply in Nampa, Idaho. These had a height of 5 inches and radius of 3 inches. The dimensions of both concrete beam and asphalt cylinders were chosen in such a way that their cross-sectional areas closely matched with each other, so that the experiment provided a logical temperature comparison between them. One of these samples was coated with the heat-reflective coating. Two holes were then drilled into each cylinder at 2-inch and 4-inch depths, respectively. The thermocouples were then placed in these holes at 1.5 inches deep in the uncoated cylinder and 1.75 inches deep in the coated cylinder, as shown in
Figure 6.The surface points were chosen based on the placement of the subsurface thermocouples. In total, there were 9 surface points where temperature was measured for concrete, as shown in
Figure 7, and 6 points for the asphalt, as shown in
Figure 8. The middle point in
Figure 7 was situated directly above the thermocouples, 3 inches from each side. The remaining points formed a grid pattern surrounding the center point at distances of 1.5 inches from the center. It is noteworthy that the steel rings are used for thermal point calibration. Marking the points on the pavement with a marker would both skew the results and not show up in the thermal image; however, the rings allowed the points to be accurately positioned from the pavement to the thermal image camera for data collection. Once the data points from the computer program were placed in the center of each ring, the rings were removed, and the trial was started. Additionally, none of the points were placed on top of delamination in the pavement, such as the small gap from the thermocouple crack in the concrete sample, so that these steel rings would not affect the measured temperature at that point. For the asphalt, the two center points were placed above the thermocouples while the other two on each sample were placed on a line through the center 1.5 inches from either edge. Thus, the distances in between the data points for both concrete and asphalt samples were kept the same, in order to meaningfully track the temperature changes in those target areas. For this experiment, only the temperature data from one point, the one situated above the thermocouples, was analyzed. The remaining data points were taken for future study.
Figure 7 (right) and
Figure 8 (right) show the calibration of these surface points with the thermal camera (FLIR Teledyne LLC, Wilsonville, OR, USA) for the concrete and asphalt samples, respectively.
Our in-house experimental setups for controlled heating, airflow heating and humid heating can be seen in
Figure 9. In the controlled heating photo, the sample is in the heating phase, whereas, in the airflow and humidity tests, the sample is in the cooling phase. While this figure shows the set up with concrete, the only difference during asphalt testing was that the two cylinders were placed side by side in the same location as the concrete. An example of this change is shown for the controlled heating test on the asphalt samples in
Figure 10. This was taken during the heating phase, and the thermal camera was removed from its stand so it would not overheat. Each case was numbered for concrete and asphalts samples, as indicated in
Table 1.
There were seven key parts in total in the test setup. These include a 121 × 33 × 51 cm
3 tank used in the humidity control, the concrete or asphalt samples to be tested, a halogen lamp (500 W) used in heating, a FLIR T430SC model infrared thermal camera used to record the surface temperature of the sample, a fan used during airflow tests, a humidifier used during humidity tests, and a temperature/humidity meter.
Figure 11 shows the distances of each of these objects from the center point on the concrete surface, while
Figure 12 shows the distances of each of these objects from the center point between the uncoated and coated asphalt cylinders. This lab-controlled setup allows the authors to study the outdoor or ambient weather conditions by controlling the heating, airflow, and humidity level. By using the tank as an environmental chamber, we controlled the humidity level during the humidity tests and created a wind tunnel during the airflow tests. The infrared thermal camera has a sensitivity of 0.045 at 30 °C [
44]. The number of frames that the camera records per second, or frame rate, is 60 Hz.
The fan used was a standard house fan with three speed settings, although only the first speed setting was used during data collection. The speed of the setting used was measured at 3.54 m/s at a distance of 12 inches. The fan was used to simulate the windy conditions and was placed at this distance because the wind speed was accurately measured for this distance. The humidifier was used to create a humid environment and was placed as far away from the samples as possible. This is because the humidifier creates a small breeze in the tank when in use, and thus this impact on the samples was minimized by placing it far away. The halogen was used to mimic solar radiation and was placed directly above the sample at an appropriate distance to accurately represent the solar loading that the pavement would typically be subject to.
2.2. Testing Procedure and Data Collection
All the tests for controlled heat, airflow heat, and humid heat were performed once on the uncoated concrete, and then once on the coated concrete under similar conditions. For the asphalt, both samples were tested at the same time. The data collection was nearly identical for controlled and airflow heating; however, the process varied for the humid heating. The only difference between the measurements for controlled heat and airflow heat tests was that the fan was placed 12 inches in front of the center surface point for concrete and 12 inches from the point between the two samples for asphalt, running continuously during the 4 h that the experiment was active.
During the controlled heat and airflow heat tests, the sample was heated by the halogen lamp for 2 h. This timeframe was chosen because at this point it could accurately represent the solar radiation from the sun, and the system reached thermal equilibrium. For the airflow test, the fan was turned on at the same time as the halogen lamp and remained on for the duration of the test. During the first 25 min of heating, the subsurface data, along with ambient temperature and humidity, were taken every minute or until the temperatures stabilized. After this, the same data were recorded every 10 min starting at 30 min. At exactly two hours, the halogen lamp was removed, and the thermal camera was set to take the surface temperature at the 9 points continuously for two more hours. During this cooling phase, the subsurface data were also recorded with the ambient temperature and humidity. For the first 10 min, these data were taken every minute, and then every 10 min for the remainder of the two hours.
The humidity testing was performed slightly differently. To start, the entire tank was covered with plastic wrap to create a humidity seal. Once the environment was isolated, the humidifier ran for an hour. After this first hour, heat was applied with the halogen lamp for the next two hours while the humidifier was still running. Throughout this heating phase, data of the subsurface temperatures were taken from the thermocouples every minute for the first twenty minutes, and then every ten minutes after that. After 2 h of heating, the halogen lamp was removed, and the seal was fully replaced. At this point, surface temperature measurements were taken using the thermal camera every 4 min, while subsurface measurements continued every minute for the first ten minutes, and then every ten minutes after that for the remainder of the two-hour cooling phase. During the cooling phase, the humidity was raised up to 80% relative humidity, and then kept between 80% and 85%.
2.3. Coating Application
The heat-reflective coating used was supplied by Decorative Paving Solutions in Tempe, Arizona and came in three parts: part A, part B, and colorant, as shown in
Figure 13. Before use, the directions state that all three parts are mixed together with half a gallon of water. Once mixed thoroughly, it must be used within 12 h. The five-gallon bucket received coats of about 200–250 square feet. Because the samples used in this study were only about 1 square foot, a ratio based on the weight of each component was determined. For the concrete coating, 0.5 kg of part A was mixed with 0.12 kg of part B, 0.02 kg of the colorant and 0.038 kg of water. The coating was applied to the surface of the sample using a roller brush in five coats measuring out to a thickness of 3 mm, as shown in
Figure 14.
4. Conclusions
An increased albedo can reduce the risk of premature failure for both asphalt and concrete pavements by rutting (depressions in the wheel paths) where hot temperatures make this a concern. Installing cool pavements using coatings can be part of a robust strategy to reduce air temperatures, which can result in a wide range of benefits. The use of heat-reflective coatings to combat the effects of pavement on UHI was previously studied, but no consistent conclusions were drawn. In this regard, a robust experimental setup was conducted on concrete and asphalt samples to produce a detailed set of data in a controlled heating environment. We conducted systematic influence analyses of ambient weather conditions for both concrete and asphalt, including a thorough background examination of the effect of weather conditions on heat transfer and infrared thermal imagery. This helped to examine the effectiveness of the coating under these dynamic weather modules. Thus, the data acquired during the tests allowed us to compare the effects of heat-reflective coatings on concrete and asphalt and can be summarized as follows:
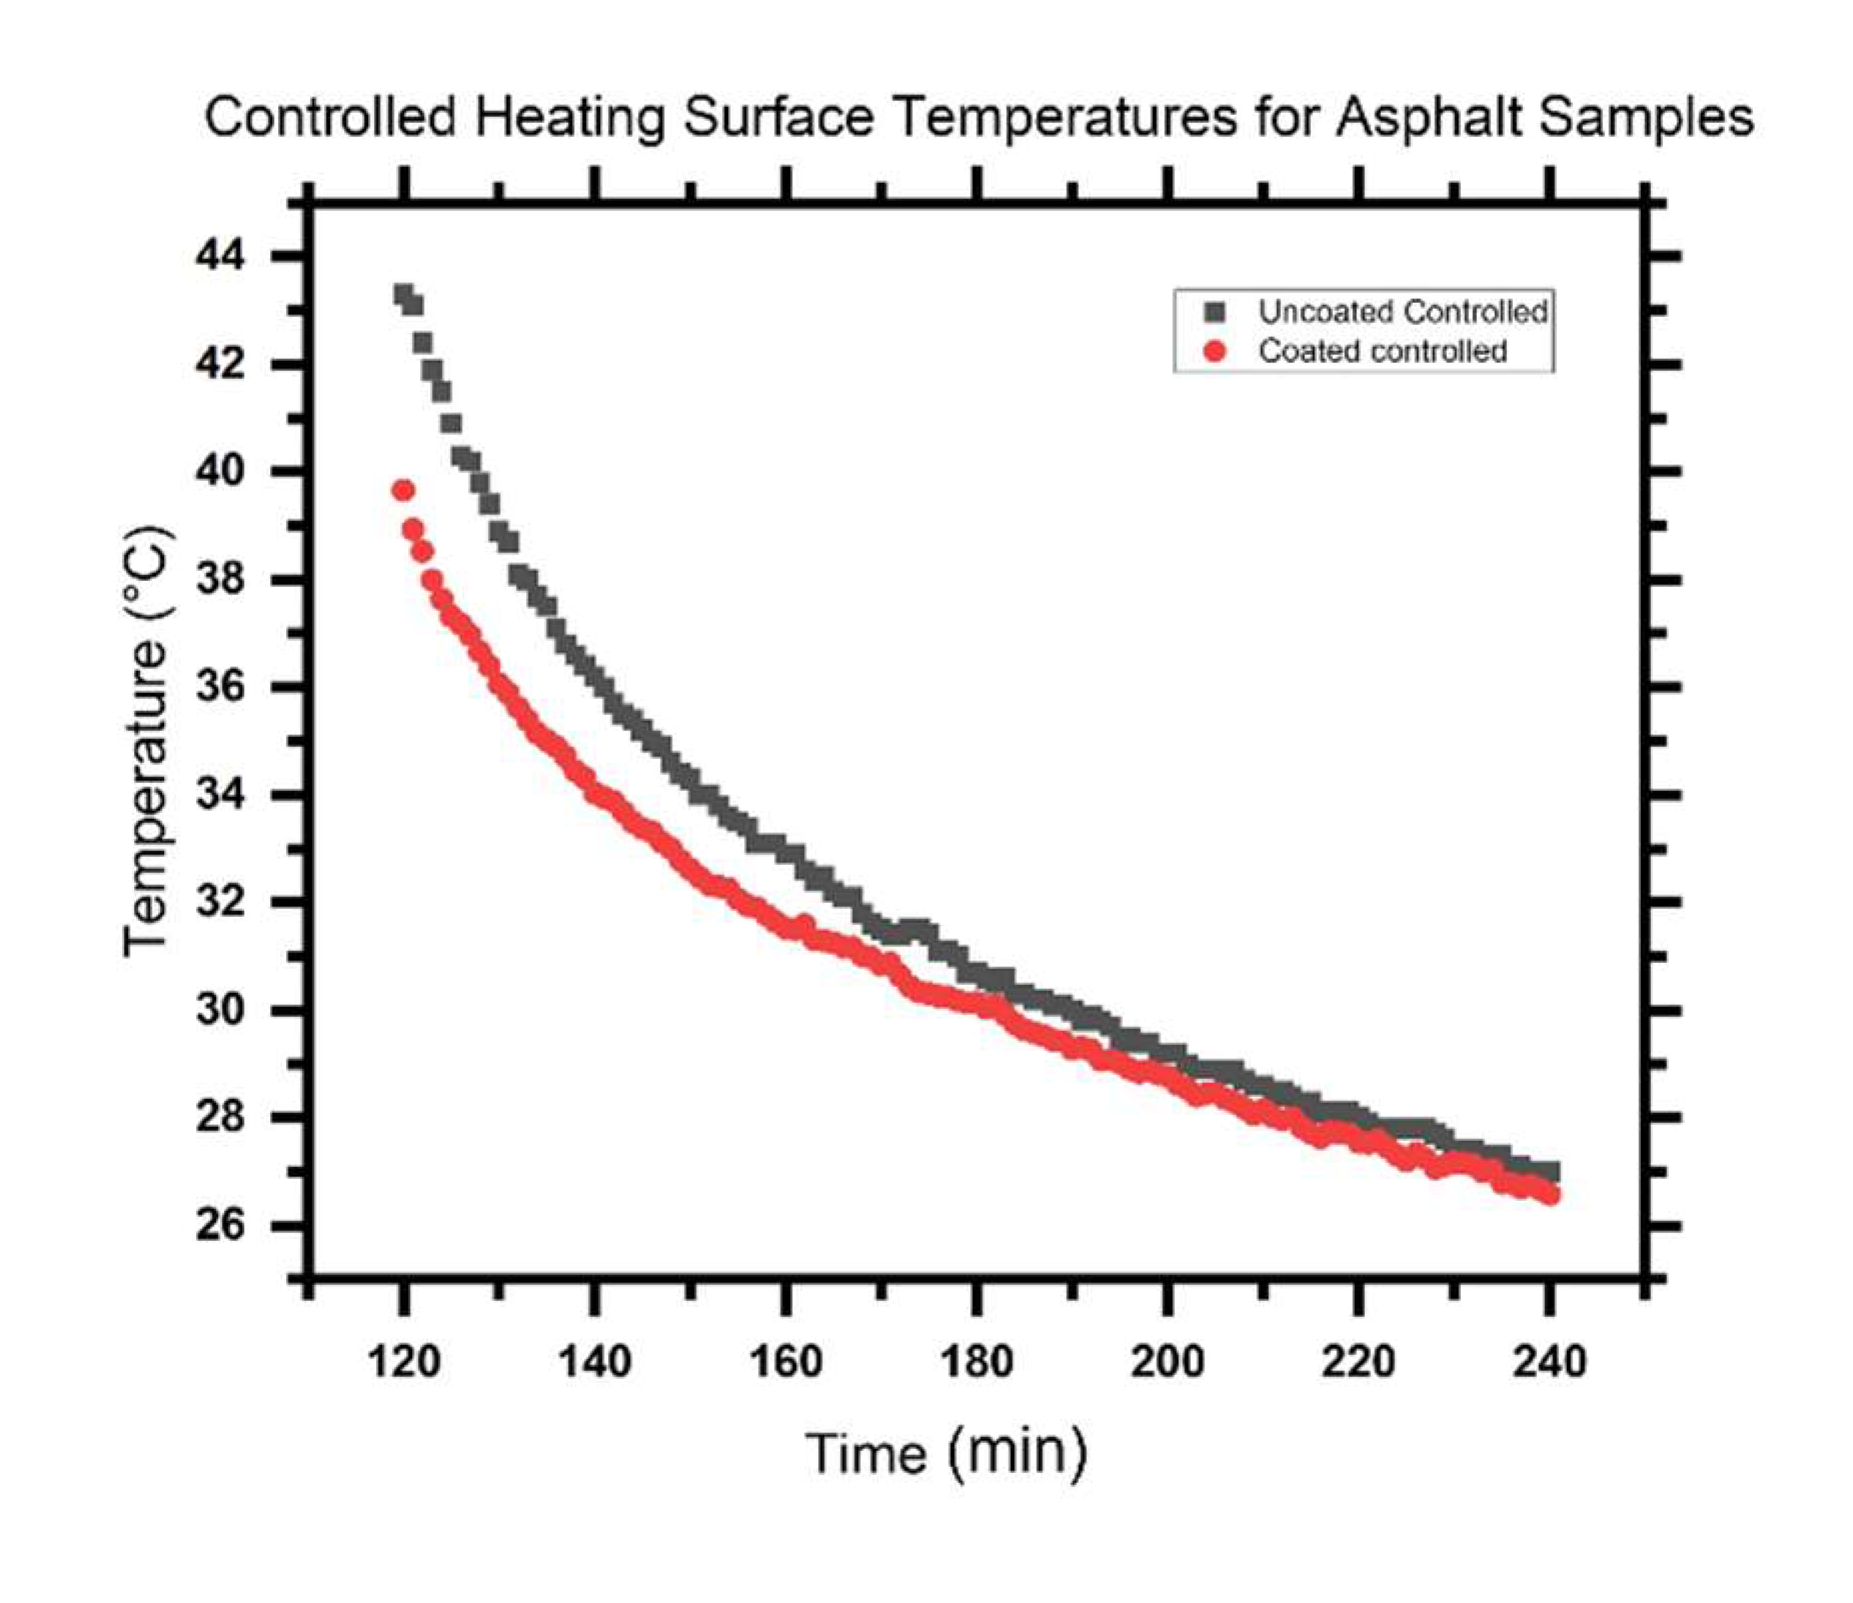
During normal conditions, about 1 °C of cooling occurs in coated concrete and 5 °C cooling occurs in coated asphalt. Cooling effects were also noticed at subsurface depths, showing that the whole body of pavement is cooled as a result of the coating. During humid conditions, the cooling effects of the heat-reflective coating are nearly the same as normal conditions. The coating was found to noticeably reduce both the surface temperature and the subsurface temperature of the samples. For the wind conditions, the effects of the coating were stifled. Under the same conditions for asphalt, there was still some observed cooling; however, it was about half as much as the cooling during the other asphalt tests. The wind affects rough surfaces more than smooth surfaces, and thus making a coating with a smoother finish would likely increase its effectiveness in windy areas. In addition, a lighter-colored coating reflected more solar radiation and enhanced the cooling properties.
The application of coatings technologies to cool pavements can lower pavement temperature because more of the sun’s energy is reflected away, and there is less heat at the surface to absorb into the pavement. In terms of urban climate impact, it can contribute to lower air temperatures in both day and night conditions, although air temperatures are not directly related to surface temperatures and many complicating factors are involved. The findings suggest that cool pavements can be used in all applications, such as trails and roads. They may be most effective when paving large, exposed areas such as parking lots.
The use of heat-reflective coatings, mainly on asphalt, has the potential to reduce UHI in many cities that have different climates. These coatings would be the most effective in cities that have consistently sunny weather, such as Phoenix, AZ or Los Angeles, CA. They would also be useful in humid climates, such as Tampa Bay, FL or Boston, MA. However, since the results of the windy conditions show that the coating is not as efficient in this type of environment, cities known for constant wind, such as Chicago, IL, may not see as many benefits.
The results from the sensitivity analysis support the notion that an increase in surface albedo has a local cooling effect by increasing the total outgoing radiation. The results also demonstrated the sensitivities of the climate-related impacts to changes in surface albedo and could be used to guide mitigation strategies.
In conclusion, using heat-reflective coatings in pavements with increased albedo can indeed be considered as a promising solution to mitigate UHI. The results emphasize the importance of considering the ambient climate effect on the cooling performance. This work provides a more accurate and effective technical means for evaluating the cooling effect of the coatings compared with other techniques. Thus, the findings from this work can play a crucial role as a reference guideline in selecting and designing the application of heat-reflective coating materials in pavements.


