Abstract
The paper proposes a surface plasmon resonance (SPR) biosensor utilizing MXene and a Molybdenum Disulfide (MoS2) material layer, placed on the Ag metal-based conventional biosensor to detect disease in human teeth. The SPR biosensor works on the principle of attenuated total reflection. The transverse matrix method was utilized for the reflectivity calculation. The thickness of the Ag layer, MXene, and MoS2 were taken as 45, 0.993, and 0.375 nm, respectively. Single-layer MoS2 and two layers of MXene were taken, and the highest sensitivity of the sensor for the enamel, dentin, and cementum was obtained at 83.219 deg/RIU, 91.460 deg/RIU, and 104.744 deg/RIU. MoS2 was used to enhance the biocompatibility of the analyte with the sensing layer. The aqueous solution had been considered as sensing medium.
1. Introduction
For decades, surface plasmon-based biosensors have been employed in biochemical sensing. They are suitable for sensing-based applications due to their qualities such as dependability, label-free detection, increased sensitivity, and immediate detection capabilities [1,2,3]. SPR biosensors based on prisms [4], optical fibres [5], and Bragg gratings [6] have been implemented. Based on the attenuated total reflection (ATR) phenomena [7,8], Kretschmann proposed a prism-based configuration [9]. In this configuration, a layer of metal has been placed over the prism (also known as a traditional biosensor). At the prism-metal contact in this configuration, the transverse magnetic (TM) polarised input wave generates evanescent waves. These waves decay exponentially at the metal prism interface [10]. Finally, a surface plasmon is generated at the metal-prism interaction. Due to the formation of large surface plasmons, a change in the RI of the sensing medium produces a shift in the resonance angle [11]. The performance characteristics of the traditional biosensor setup (Kretschmann’s configuration) are poor. 2D materials are placed between the metal and the sensing layer to increase the biosensor’s performance [12]. Besides SPR biosensors, other optical devices such as metal-dielectric-metal (MDM) waveguide structures have also gained a lot of attention among different plasmonic guiding structures. This is due to its features of sustaining zero-bend, deep subwavelength modes with the ease of fabrication and losses [13,14].
Besides conventional caries detection methods, some other methods used to detect diseases in human teeth include: diagnodent, electrical caries monitor (ECM), Fiber-optic Transillumination (FOTI), Digital Imaging Fiber-optic Transillumination (DIFOTI), Quantitative Light Induced Fluorescence (QLF), digital radio graphs, etc. [15]. These detection methods have been tabulated in Table 1, demonstrating their advantages and disadvantages. Proposed SPR biosensor can diagnose common diseases of the oral cavity. It has great potential for the clinical diagnosis of early dental caries. Dental caries is the most prevalent chronic disease worldwide.

Table 1.
Advantages and disadvantages of some detection methods for human teeth disease detection.
MoS2 has a great 1.8 eV band gap, a high absorption efficiency of 6%, and a broad 5.1 eV work function [16,17,18]. Due to its hydrophobic nature, MoS2 has a high affinity for absorbing biomolecules, which can be used in biological sensing [19] and used as a protective layer for the metal’s oxidation [20,21]. According to various studies, work has been performed on the design of SPR sensors based on graphene, BP, and transition metal dichalcogenides (TMDCs) materials [22,23,24]. BP-MoS2 materials are used as the primary 2D material in the SPR biosensor that Srivastava and Jha described, which has a sensitivity of 110 deg/RIU [25]. Singh and Raghuvanshi proposed a gas detection SPR sensor with a sensitivity of 245.5 deg/RIU using a bi-Au layer and BP layers [26]. A biosensor with a sensitivity of 279 deg/RIU had been proposed by Wu et al. The proposed design contained graphene, black phosphorus, and Au as a metal layer [27]. A gold grating over gold-aluminium metal layers was used to build a 279.6 deg/RIU sensitivity SPR biosensor by Bijalwan et al. [28]. Karki et al. proposed a biosensor with 352 deg/RIU sensitivity, consisting of franckeite nanosheets and nickel and silver metal films [29]. Liu et al. developed an SPR biosensor based on a tilted fibre Bragg grating (TFBG) for the detection of environmental estrogens (EEs) [30]. The idea of a pressure sensor was first out by Sun et al. Their main findings included the device’s 45 ms reaction time and 14,000 cycles of astonishing cyclic repeatability [31]. Du et al. proposed a reliable optical fibre-based photodetector, based on vertical ZnO-P3HT heterostructure to accomplish a self-powered and ultra-fast UV sensing [32]. They were able to obtain a response and recovery time of under 40 milliseconds and a customizable photo response. A gas sensor based on the ZnO-Bi2O3 structure was introduced by Liu et al. and may be used to identify diabetes early on [33]. Shangguan et al. and Wu et al. proposed RI-based absorption sensors and attained greater terahertz absorption rates [34,35]. MXene is a new emerging 2D material that has recently gained popularity among researchers due to its electrical properties, such as high conductivity, and optical properties such as the ability to easily access hydrophilic surfaces [36,37], greater spacing between interlayers, higher thermal stability, and surface area [38]. It features a hexagonal crystal structure with optical qualities, such as bandgap correction, increased light, and matter interactions. is the generic formula, with , , and being transition metals, or/and , where is an integer between 1 and 3, and surface functional groups, respectively [39]. MXene has previously been used in sensing-based applications such as gas, electrochemical, etc. Other uses included energy storage, water purification, photo detector, and chemical catalysts, etc.
Since the sensor reports greater sensitivity, Ag was the favoured plasmonic metal in the SPR sensor [40,41]. The primary disadvantage of silver was that it oxidised easily, which may be mitigated to a higher amount using the sensor’s bimetallic layer [42,43]. The Au-prism-based SPR sensor had limited sensitivity to the analyte since gold had superior chemical stability but a low capacity to bind molecules [44]. Another disadvantage of Au metal-based sensors was that their SPR curves were broader. As a result, measuring sensitivity accurately was difficult, and the full width half maximum (FWHM) parameter was large.
2. Proposed Structure and Design Methodology
As illustrated in Figure 1, the suggested sensor is comprised of three layers, with the SF11 prism acting as the foundation material. The He-Ne laser source had been used as the optical source [45]. After the input wave was reflected from the prism-metal contact in the output portion, the signal was received by a photodetector. Due to its high RI [42], the SF11 prism was an excellent candidate. The sensor design consisted of a silver (Ag) layer thickness of nm above the prism base, followed by layers of MoS2 and MXene with nm nm, respectively. The sensing layer was where bio-molecular interactions between immobilized ligands and analytes occurred. Enamel, dentin, and cementum have refractive indexes of 1.631, 1.540, and 1.582, respectively [43].
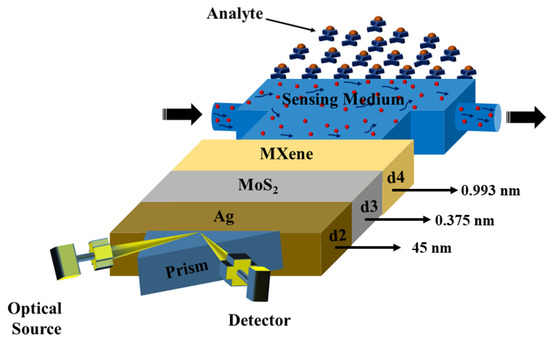
Figure 1.
Sensor diagram.
Using the Sellmeier equation, the coupling prism’s RI is expressed as [46]:
The constants , , have the values 1.73759695, 0.313747346, and 1.89878101, respectively, and other constants , and have values 0.013188707, 0.0623068142 and 155.23629, respectively. The RI of silver metal is calculated by the formula [47]:
where the is the collision wavelength whose value is equal to 8.9342 × 10⁻⁶ m, and is the plasma wavelength whose value equals 1.6826 × 10⁻⁷ m [45]. The other layers (MoS2 and MXene) RI are taken as and , respectively, at 633 nm.
The problem of indigestion is caused if we do not chew food properly. Therefore, as a concern, its early detection of dental caries is necessary. Although these are the suspended particles, and a small amount (concentration) of the enamel, dentin and cementum particles are added to the sensing layer for the sensing purpose; the sensing layer’s RI changes. The biochemical reaction process occurs between the enamel, dentin, and cementum and water, changing the RI of the solution as the concentration of these particles is added. This RI change can be mathematically expressed as:
The represents RI of the sensing layer after the particle’s adsorption and RI of the solution before adding the particles into the sensing layer. Let us consider 100 nM of the molecular particle concentration has been added into the sensing layer, i.e., . The fraction indicates the increasing value of RI due to the inclusion of the particles. This increment parameter value of RI is . The propagation constant of surface plasmon wave (SPW) alters with alteration in SPR angle given by [48]:
The reflectance computation without approximation was completed by the transfer matrix method. An N-layer structure was defined using a characteristics matrix shown here:
where, is the layer matrix, and optical admittance and phase factor, respectively.
and
denotes the incident angle and denotes the dielectric constant.
The reflection coefficient for the p-polarized wave has been calculated by:
The performance parameters are used to describe an SPR sensor’s performance. Sensitivity (S), detection accuracy (DA), full width half maximum (FWHM), and figure of merit are crucial performance characteristics (FOM). The maximum values for S and DA should indicate that the suggested sensor is performing satisfactorily. The FWHM value should be as low as possible. is the formula for an SPR sensor’s sensitivity calculation. Degree/RIU is its unit. It can be characterised as the change in the resonance angle () in relation to the change in the RI of the sensing medium (). The SPR curve is used to calculate this factor. When DA = 1/FWHM, the detection accuracy is calculated. It has the degree: 1 unit. The SPR curve is used to calculate this factor. The mathematical formula for the full-width half maxima (FWHM) is , and the unit is degree. This parameter provided information about the reflectance curve’s width and sharpness. The Figure of Merit (FOM) was written as . is its unit. FOM represented the SPR sensor’s resolution.
2.1. Numerical Modelling
As demonstrated in this research, the proposed model was created and evaluated using a numerical simulation based on the finite element technique (FET). In order to simulate the given model, we simulated the 2D geometry of the suggested sensor using COMSOL Multiphysics version 5.5. The suggested (BK7/ Ag/ MoS2/ MXene) SPR biosensor is shown in Figure 2b, with a light source incident at a 633 nm wavelength on the top of prism BK7. Once more, the periodicity boundary conditions and periodic port conditions (indicated in red in Figure 2) were applied [49]. A very fine physics-controlled sized mapped mesh with elements as small as 5 × 10⁻⁵ μm and as large as 0.025 μm had been selected for this FEM model, as seen in Figure 2a. Additionally, we used the parametric sweep operation to carry out the angular interrogation technique, while altering the incident angle of the source. With an incremental deviation of 0.1 degrees, the incident angle had been simulated from 53 to 90 degrees. The reflectance intensity for each entering angle was calculated to obtain the resonance angle. Then, by examining the minimum reflectance intensity at the output, the resonance angle was ascertained from the output intensity curve. The frequency-domain solver was used to solve the model at a frequency of 3 × 10⁸⁄λ Hz.
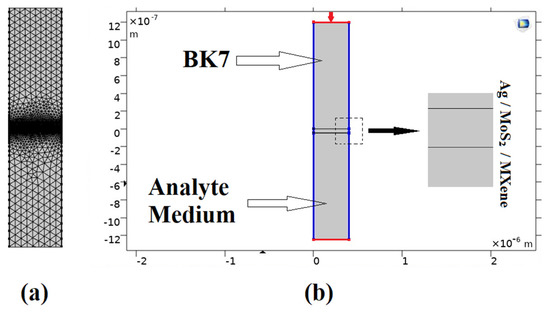
Figure 2.
COMSOL Multiphysics design layout for the proposed (BK7/ Ag/ MoS2/ MXene) SPR biosensor: (a) The field of computational meshing; (b) A simulation-based model for the proposed structure.
The shift in the output reflection intensity curve for the analyte layer refractive index fluctuation was calculated to determine the sensors sensitivity and performance. In order to show the suggested model in SPR circumstances, we also displayed the electric field strength and magnetic field propagation at the resonance angles, as shown in Figure 3. Due to the intense localization and maximal excitations of surface plasmons in the plasmonic layer, the electric field and magnetic field were increased in the resonance state [50,51]. When resonance was present, as shown in Figure 3, the plasmonic gold layer showed an increased electric field intensity.
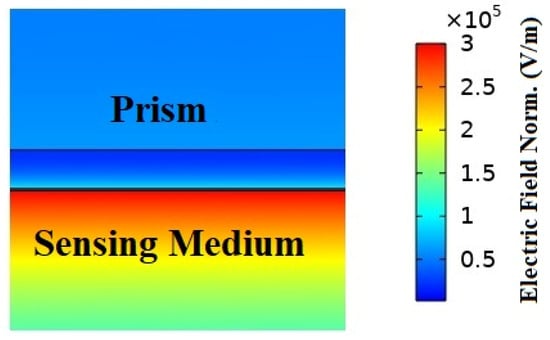
Figure 3.
The electric field normal distribution and magnetic field propagation of the suggested hybrid (BK7/ Ag/ MoS2/ MXene) SPR biosensor structure are as follows: On the surface of gold, the distribution of the electric field exhibits an amplified field at a resonance angle.
2.2. Field Distribution Computation
The field distribution of the input TM polarised wave within each layer for the proposed SPR sensor provided information about the augmentation of the evanescent field under various circumstances. The generation of the evanescent field over the analytical interface was crucial for the SPR phenomena. It is due to this that the analytes interface was where the sensing was completed. The distribution of the field components with the top layer was defined by the overall characteristics matrix. Its expression is [52]:
where, denotes the magnetic and electric fields, respectively.
denotes the incident magnetic field amplitude and denotes the reflection coefficient.
Next, these field distributions within the layer are given by:
3. Results and Discussion
The sensitivity of a biosensor with a modified Kretschmann configuration that included MoS2 and graphene is discussed here in this section. The transfer matrix method was used to create reflectance curves that demonstrated how the reflectivity of light changed with incident angle. Figure 4A showed the conventional sensor design, . Figure 4B,C demonstrated the modified conventional designs with layer combinations and and Figure 4D gave the reflectance spectra for the proposed sensor design (). The RI range of sensing media varies from 1.33 to 1.631. For Figure 4A–D, the values of minimum reflectance and change in SPR angle () calculated have been shown in Table 2.
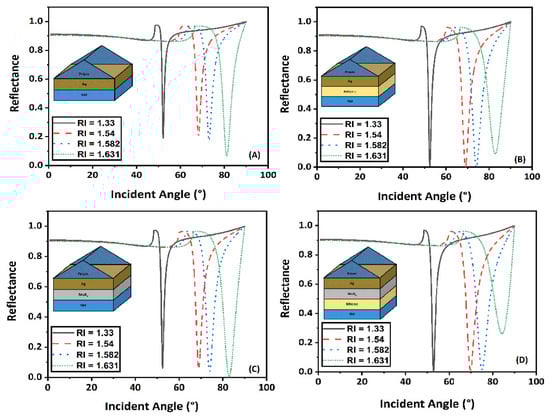
Figure 4.
Change in reflectance with incident angle for different RI of sensing medium (A) , (B) , (C) , and (D) .
Table 2.
Computed minimum reflectance and change in SPR angle values.
As a result, we may infer that adding one MoS2 and one MXene layer to our biosensor greatly increased its sensitivity, compared to the current design. To better understand how MoS2 and MXene layers increased the sensitivity of the biosensor, we also plotted the relationship between the sensitivity of the biosensor and the RI of the sensing layer (see Figure 5).
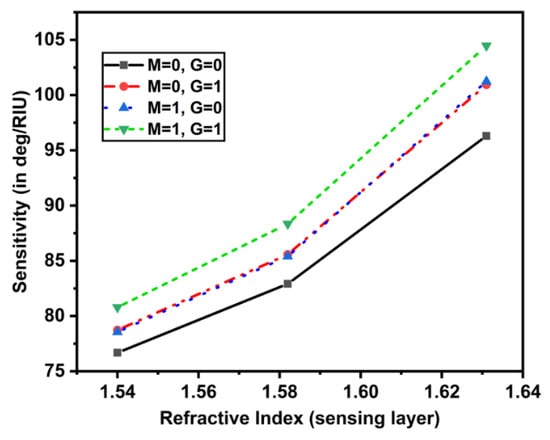
Figure 5.
Sensitivity plot w.r.t. the RI of sensing layer (1.54 to 1.64).
It can be seen that as the sensing layer’s RI rose from 1.54 to 1.64, the sensitivity rose dramatically. Figure 6A gave the impact of the addition of MoS2 layers with mono MXene on the sensitivity by varying the RI of the sensing layer. For (), (), and (), the sensitivity increased, but in another case () the sensitivity increased until 1.58 RI of sensing layer, then the values remained almost constant. The maximum value of sensitivity obtained was 104.471 deg/RIU. A similar trend was obtained for another case, in which the MXene layers varied from 1 to 4 with a monolayer of MoS2 as shown in Figure 6B. These sensitivity values for both cases have been tabulated in Table 3 and Table 4.
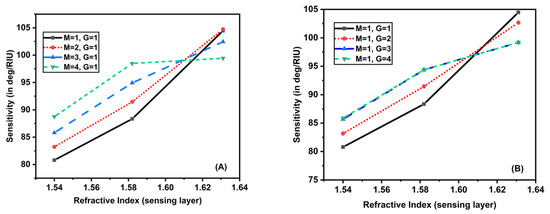
Figure 6.
Plot showing sensitivity as a function of RI of sensing layer by varying (A) MXene layers with a monolayer of MoS2, (B) MoS2 layers with a monolayer of MXene.
Table 3.
Sensitivity computation when the number of MXene layers varies with a single MoS2 layer.
Table 4.
Sensitivity computation when the number of MoS2 layers varies with a single MXene layer.
3.1. Detection
This section has theoretically investigated the detection of tooth particles using an SPR sensor. The tooth particles’ concentration (C) was added to the sensing layer using the input unit of the flowcell. The concentration added amounts were 0 nm, 25 nm, 50 nm, 100 nm, and 200 nm. Adding these concentrations resulted in an alteration in the RI of the sensing layer. These RI changed in response to the amount of concentration added, giving rise to different SPR curves at different incident angles (Figure 7).
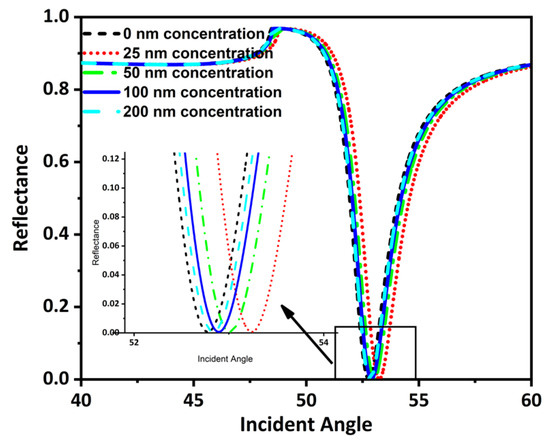
Figure 7.
Reflectance and incident angle graph for different detectable targets.
The value of minimum reflectance and incident angle for these concentrations has been shown here using Table 5.
Table 5.
Rmin and incident angle values for different target concentrations.
The performance of the existing SPR work with the present study has been summarized in Table 6. As the sensitivity of an SPR biosensor is the most important parameter for evaluation of its performance, a comparison is made on its basis. The wavelength considered was 632.8 or 633 nm.
Table 6.
Performance comparison for current work with existing SPR literatures.
3.2. Electric Field Analysis
We used the electric field distribution of the suggested BK7/Ag/MoS2/MXene sensor construction at a resonance angle to further demonstrate the significant SPR excitation at 52.835 degrees and at analyte 1.631 in Figure 8. As can be observed, the sensing surface produced a considerable electric field augmentation, and the target biomolecules were present in the sensing medium where the electric field strength exponentially diminished [53]. The field strength indicating a larger interaction volume of the field in the sensing. Therefore, while utilising our suggested sensor, the electric probing field close to the MXene layer [57] was very strong and highly sensitive to biomolecule interactions. Similar to few optical sensors [58,59], the proposed sensor was promising for betterment aids in dental applications.
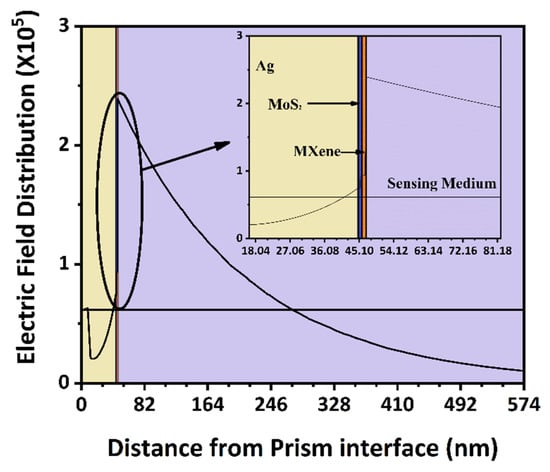
Figure 8.
Electric field distribution plot along the direction normal to BK7 prism base indicating the evanescent wave at sensing boundary.
4. Conclusions
The modified Kretschmann configuration was proposed to measure disease in the human teeth, employing Ag, MXene, and the MoS2 layer. MXene was a 2D material used in the sensor to improve the performance and also work as a protective layer for the Ag to prevent oxidation. MoS2 was enhancing the bio-interaction ability of the sensor. The designed hybrid biosensor was highly sensitive, and a sensitivity of 104.744 deg/RIU had been observed.
Author Contributions
Conceptualization: M.K.A., V.D., A.N., R.N., M.U.Z., K.K.G., R.B., M.S.M., A.K.N. and H.A.; methodology: V.D., A.N. and R.N.; software: V.D., A.N. and R.N.; validation: V.D., A.N. and R.N.; formal analysis: V.D., A.N. and R.N.; investigation: V.D., A.N. and R.N.; resources: V.D., A.N. and R.N.; data curation: V.D., A.N. and R.N.; writing—original draft preparation: M.K.A., V.D., A.N., R.N., M.U.Z., K.K.G., R.B., M.S.M., A.K.N. and H.A.; writing—review and editing: M.K.A., V.D., A.N., R.N., M.U.Z., K.K.G., R.B., M.S.M., A.K.N. and H.A.; visualization: M.K.A. and V.D.; supervision: M.K.A. and V.D.; project administration: M.K.A. and V.D.; funding acquisition: M.K.A. All authors have read and agreed to the published version of the manuscript.
Funding
Deanship of Scientific Research at Jouf University, Grant No. DSR2022-RG-0158.
Data Availability Statement
All data are available within the manuscript.
Conflicts of Interest
The authors declare no conflict of interest.
References
- Akib, T.; Mou, S.; Rahman, M.; Rana, M.; Islam, R.; Mehedi, I.; Mahmud, M.; Kouzani, A. Design and numerical analysis of a graphene-coated SPR biosensor for rapid detection of the novel coronavirus. Sensors 2021, 21, 3491. [Google Scholar] [CrossRef] [PubMed]
- Gao, Y.; Xin, Z.; Zeng, B.; Gan, Q.; Cheng, X.; Bartoli, F.J. Plasmonic interferometric sensor arrays for high-performance label-free biomolecular detection. Lab Chip 2013, 13, 4755–4764. [Google Scholar] [CrossRef] [PubMed]
- Chabot, V.; Miron, Y.; Grandbois, M.; Charette, P.G. Long range surface plasmon resonance for increased sensitivity in living cell biosensing through greater probing depth. Sens. Actuators B Chem. 2012, 174, 94–101. [Google Scholar] [CrossRef]
- Yang, X.; Yuan, Y.; Dai, Z.; Liu, F.; Huang, J. Optical property and adsorption isotherm models of glucose sensitive membrane based on prism SPR sensor. Sens. Actuators B Chem. 2016, 237, 150–158. [Google Scholar] [CrossRef]
- Hou, D.; Ji, X.; Luan, N.; Song, L.; Hu, Y.; Luo, M.; He, J.; Bai, Z.; Bai, Z.; Liu, J. Surface Plasmon Resonance Sensor Based on Double-Sided Polished Microstructured Optical Fiber with Hollow Core. IEEE Photonic J. 2021, 13, 1–8. [Google Scholar] [CrossRef]
- Sahu, S.; Ali, J.; Yupapin, P.P.; Singh, G. Porous Silicon Based Bragg-Grating Resonator for Refractive Index Biosensor. Photonic Sens. 2018, 8, 248–254. [Google Scholar] [CrossRef]
- Homola, J. Surface plasmon resonance sensors for detection of chemical and biological species. Chem. Rev. 2008, 108, 462–493. [Google Scholar] [CrossRef]
- Karki, B.; Pal, A.; Singh, Y.; Sharma, S. Sensitivity enhancement of surface plasmon resonance sensor using 2D material barium titanate and black phosphorus over the bimetallic layer of Au, Ag, and Cu. Opt. Commun. 2021, 508, 127616. [Google Scholar] [CrossRef]
- Kretschmann, E.; Raether, H. Radiative decay of non-radiative surface plasmons by light. Z. Nat. 1968, 23, 2135–2136. [Google Scholar]
- Karki, B.; Uniyal, A.; Sharma, T.; Pal, A.; Srivastava, V. Indium phosphide and black phosphorus employed surface plasmon resonance sensor for formalin detection: Numerical analysis. Opt. Eng. 2022, 61, 017101. [Google Scholar] [CrossRef]
- Kashyap, R.; Chakraborty, S.; Zeng, S.; Swarnakar, S.; Kaur, S.; Doley, R.; Mondal, B. Enhanced biosensing activity of bimetallic surface plasmon resonance sensor. Photonics 2019, 6, 108. [Google Scholar] [CrossRef]
- Uniyal, A.; Chauhan, B.; Pal, A.; Singh, Y. Surface plasmon biosensor based on Bi2Te3 antimonene heterostructure for the detection of cancer cells. Appl. Opt. 2022, 61, 3711–3719. [Google Scholar] [CrossRef]
- Deng, Y.; Cao, G.; Yang, H.; Zhou, X.; Wu, Y. Dynamic Control of Double Plasmon-Induced Transparencies in Aperture-Coupled Waveguide-Cavity System. Plasmonics 2017, 13, 345–352. [Google Scholar] [CrossRef]
- Deng, Y.; Cao, G.; Wu, Y.; Zhou, X.; Liao, W. Theoretical Description of Dynamic Transmission Characteristics in MDM Waveguide Aperture-Side-Coupled with Ring Cavity. Plasmonics 2015, 10, 1537–1543. [Google Scholar] [CrossRef]
- Datta, S.; Modak, B.; Chaki, N. A Complete Review on Dental Carious Lesion Detection Methods and its Challenges. Acta Sci. Dent. Sci. 2019, 3, 74–81. [Google Scholar] [CrossRef]
- Wu, L.; Jia, Y.; Jiang, L.; Guo, J.; Dai, X.; Xiang, Y.; Fan, D. Sensitivity Improved SPR Biosensor Based on the MoS2/Graphene–Aluminum Hybrid Structure. J. Light Technol. 2016, 35, 82–87. [Google Scholar] [CrossRef]
- Kim, N.-H.; Choi, M.; Kim, T.W.; Choi, W.; Park, S.Y.; Byun, K.M. Sensitivity and stability enhancement of surface plasmon resonance biosensors based on a large-area Ag/MoS2 substrate. Sensors 2019, 19, 1894. [Google Scholar] [CrossRef]
- Lin, Z.; Jiang, L.; Wu, L.; Guo, J.; Dai, X.; Xiang, Y.; Fan, D. Tuning and Sensitivity Enhancement of Surface Plasmon Resonance Biosensor with Graphene Covered Au-MoS 2-Au Films. IEEE Photonic J. 2016, 8, 1–8. [Google Scholar] [CrossRef]
- Kumar, A.; Yadav, A.K.; Kushwaha, A.S.; Srivastava, S. A comparative study among WS2, MoS2 and graphene based surface plasmon resonance (SPR) sensor. Sens. Actuators Rep. 2020, 2, 100015. [Google Scholar] [CrossRef]
- Karki, B.; Uniyal, A.; Chauhan, B.; Pal, A. Sensitivity enhancement of a graphene, zinc sulfide-based surface plasmon resonance biosensor with an Ag metal configuration in the visible region. J. Comput. Electron. 2022, 21, 445–452. [Google Scholar] [CrossRef]
- Nurrohman, D.T.; Chiu, N.-F. Surface Plasmon Resonance Biosensor Performance Analysis on 2D Material Based on Graphene and Transition Metal Dichalcogenides. ECS J. Solid State Sci. Technol. 2020, 9, 115023. [Google Scholar] [CrossRef]
- Pal, A.; Jha, A. A theoretical analysis on sensitivity improvement of an SPR refractive index sensor with graphene and barium titanate nanosheets. Optik 2021, 231, 166378. [Google Scholar] [CrossRef]
- Zhao, Y.; Gan, S.; Zhang, G.; Dai, X. High sensitivity refractive index sensor based on surface plasmon resonance with topological insulator. Results Phys. 2019, 14, 102477. [Google Scholar] [CrossRef]
- Sathya, N.; Karki, B.; Rane, K.P.; Jha, A.; Pal, A. Tuning and Sensitivity Improvement of Bi-Metallic Structure-Based Surface Plasmon Resonance Biosensor with 2-D ε-Tin Selenide Nanosheets. Plasmonics 2022, 17, 1001–1008. [Google Scholar] [CrossRef]
- Srivastava, T.; Jha, R. Black Phosphorus: A New Platform for Gaseous Sensing Based on Surface Plasmon Resonance. IEEE Photonic Technol. Lett. 2018, 30, 319–322. [Google Scholar] [CrossRef]
- Singh, Y.; Raghuwanshi, S.K. Sensitivity Enhancement of the Surface Plasmon Resonance Gas Sensor with Black Phosphorus. IEEE Sens. Lett. 2019, 3, 1–4. [Google Scholar] [CrossRef]
- Wu, L.; Guo, J.; Wang, Q.; Lu, S.; Dai, X.; Xiang, Y.; Fan, D. Sensitivity enhancement by using few-layer black phosphorus-graphene/TMDCs heterostructure in surface plasmon resonance biochemical sensor. Sens. Actuators B Chem. 2017, 249, 542–548. [Google Scholar] [CrossRef]
- Bijalwan, A.; Rastogi, V. Gold–aluminum-based surface plasmon resonance sensor with a high quality factor and figure of merit for the detection of hemoglobin. Appl. Opt. 2018, 57, 9230–9237. [Google Scholar] [CrossRef]
- Karki, B.; Sharma, S.; Singh, Y.; Pal, A. Sensitivity Enhancement of Surface Plasmon Resonance Biosensor with 2-D Franckeite Nanosheets. Plasmonics 2021, 17, 71–78. [Google Scholar] [CrossRef]
- Liu, L.; Zhang, X.; Zhu, Q.; Li, K.; Lu, Y.; Zhou, X.; Guo, T. Ultrasensitive detection of endocrine disruptors via superfine plasmonic spectral combs. Light Sci. Appl. 2021, 10, 181. [Google Scholar] [CrossRef]
- Sun, J.; Du, H.; Chen, Z.; Wang, L.; Shen, G. MXene quantum dot within natural 3D watermelon peel matrix for biocompatible flexible sensing platform. Nano Res. 2021, 15, 3653–3659. [Google Scholar] [CrossRef]
- Du, X.; Tian, W.; Pan, J.; Hui, B.; Sun, J.; Zhang, K.; Xia, Y. Piezo-phototronic effect promoted carrier separation in coaxial p-n junctions for self-powered photodetector. Nano Energy 2021, 92, 106694. [Google Scholar] [CrossRef]
- Liu, W.; Zheng, Y.; Wang, Z.; Wang, Z.; Yang, J.; Chen, M.; Qi, M.; Rehman, S.U.; Shum, P.P.; Zhu, L.; et al. Ultrasensitive Exhaled Breath Sensors Based on Anti-Resonant Hollow Core Fiber with In Situ Grown ZnO-Bi2O3 Nanosheets. Adv. Mater. Interfaces 2021, 8, 2001978. [Google Scholar] [CrossRef]
- Shangguan, Q.; Chen, Z.; Yang, H.; Cheng, S.; Yang, W.; Yi, Z.; Wu, X.; Wang, S.; Yi, Y.; Wu, P. Design of Ultra-Narrow Band Graphene Refractive Index Sensor. Sensors 2022, 22, 6483. [Google Scholar] [CrossRef]
- Bu, W.; Wu, Z.; Shum, P.P.; Shao, X.; Pu, J. Sensitivity Enhanced Refractive Index Fiber Sensor Based on Long-Range Surface Plasmon Resonance in SiO2-Au-TiO2 Heterostructure. Photonics 2021, 8, 379. [Google Scholar] [CrossRef]
- Naguib, M.; Mochalin, V.N.; Barsoum, M.W.; Gogotsi, Y. 25th anniversary article: MXenes: A new family of two-dimensional materials. Adv. Energy Mater. 2014, 26, 992–1005. [Google Scholar] [CrossRef]
- Pandey, P.S.; Singh, Y.; Raghuwanshi, S.K. Theoretical analysis of the LRSPR sensor with Enhance FOM for Low Refractive Index Detection using MXene and Fluorinated Graphene. IEEE Sens. J. 2021, 21, 23979–23986. [Google Scholar] [CrossRef]
- Anasori, B.; Lukatskaya, M.R.; Gogotsi, Y. 2D metal carbides and nitrides (MXenes) for energy storage. Nat. Rev. Mater. 2017, 2, 16098. [Google Scholar] [CrossRef]
- Miranda, A.; Halim, J.; Lorke, A.; Barsoum, M.W. Rendering Ti3C2Tx (MXene) monolayers visible. Mater. Res. Lett. 2017, 5, 322–328. [Google Scholar] [CrossRef]
- Uniyal, A.; Chauhan, B.; Pal, A.; Srivastava, V. InP and graphene employed surface plasmon resonance sensor for measurement of sucrose concentration: A numerical approach. Opt. Eng. 2022, 61, 057103. [Google Scholar] [CrossRef]
- Johnson, P.B.; Christy, R.W. Optical Constant of the Nobel Metals. Phys. Rev. B 1972, 6, 4370–4379. [Google Scholar] [CrossRef]
- Karki, B.; Trabelsi, Y.; Uniyal, A.; Pal, A. Zinc sulfide, silicon dioxide, and black phosphorus based ultra-sensitive surface plasmon biosensor. Opt. Quantum Electron. 2022, 54, 107. [Google Scholar] [CrossRef]
- Liu, L.; Wang, M.; Jiao, L.; Wu, T.; Xia, F.; Liu, M.; Kong, W.; Dong, L.; Yun, M. Sensitivity enhancement of a graphene–barium titanate-based surface plasmon resonance biosensor with an Ag–Au bimetallic structure in the visible region. JOSA B 2019, 36, 1108–1116. [Google Scholar] [CrossRef]
- Singh, Y.; Paswan, M.K.; Raghuwanshi, S.K. Sensitivity Enhancement of SPR Sensor with the Black Phosphorus and Graphene with Bi-layer of Gold for Chemical Sensing. Plasmonics 2021, 16, 1781–1790. [Google Scholar] [CrossRef]
- Gwon, H.R.; Lee, S.H. Spectral and angular responses of surface plasmon resonance based on the kretschmann prism configuration. Mater. Trans. 2010, 51, 1150–1155. [Google Scholar] [CrossRef]
- Srivastava, S.K.; Verma, R.; Gupta, B.D. Theoretical modeling of a self-referenced dual mode SPR sensor utilizing indium tin oxide film. Opt. Commun. 2016, 369, 131–137. [Google Scholar] [CrossRef]
- Mostufa, S.; Paul, A.K.; Chakrabarti, K. Detection of hemoglobin in blood and urine glucose level samples using a graphene-coated SPR based biosensor. OSA Contin. 2021, 4, 2164–2176. [Google Scholar] [CrossRef]
- Hossain, B.; Rana, M.; Abdulrazak, L.F.; Mitra, S.; Rahman, M. Design and analysis of graphene–MoS2 hybrid layer based SPR biosensor with TiO2–SiO2 nano film for formalin detection: Numerical approach. Opt. Quantum Electron. 2019, 51, 195. [Google Scholar] [CrossRef]
- Rahman, M.; Rana, M.; Rahman, S.; Anower, M.; Mollah, A.; Paul, A.K. Sensitivity enhancement of SPR biosensors employing heterostructure of PtSe2 and 2D materials. Opt. Mater. 2020, 107, 110123. [Google Scholar] [CrossRef]
- Mostufa, S.; Akib, T.B.A.; Rana, M.; Islam, R. Highly Sensitive TiO2/Au/Graphene Layer-Based Surface Plasmon Resonance Biosensor for Cancer Detection. Biosensors 2022, 12, 603. [Google Scholar] [CrossRef]
- Basak, C.; Hosain, K.; Sazzad, A.A. Design and Simulation of a High Sensitive Surface Plasmon Resonance Biosensor for Detection of Biomolecules. Sens. Imaging 2019, 21, 2. [Google Scholar] [CrossRef]
- Shalabney, A.; Abdulhalim, I. Electromagnetic fields distribution in multilayer thin film structures and the origin of sensitivity enhancement in surface plasmon resonance sensors. Sens. Actuators A Phys. 2010, 159, 24–32. [Google Scholar] [CrossRef]
- Verma, A.; Prakash, A.; Tripathi, R. Performance analysis of graphene based surface plasmon resonance biosensors for detection of pseudomonas-like bacteria. Opt. Quantum Electron. 2014, 47, 1197–1205. [Google Scholar] [CrossRef]
- Xia, L.; Yin, S.; Gao, H.; Deng, Q.; Du, C. Sensitivity Enhancement for Surface Plasmon Resonance Imaging Biosensor by Utilizing Gold–Silver Bimetallic Film Configuration. Plasmonics 2011, 6, 245–250. [Google Scholar] [CrossRef]
- Rouf, H.K.; Haque, T. Performance enhancement of Ag-Au bimetallic surface plasmon resonance biosensor using InP. Prog. Electromagn. Res. M 2018, 76, 31–42. [Google Scholar] [CrossRef]
- Rahman, M.S.; Anower, S.; Hasan, R.; Hossain, B.; Haque, I. Design and numerical analysis of highly sensitive Au-MoS2-graphene based hybrid surface plasmon resonance biosensor. Opt. Commun. 2017, 396, 36–43. [Google Scholar] [CrossRef]
- Ramanavicius, S.; Ramanavicius, A. Progress and Insights in the Application of MXenes as New 2D Nano-Materials Suitable for Biosensors and Biofuel Cell Design. Int. J. Mol. Sci. 2020, 21, 9224. [Google Scholar] [CrossRef]
- Tabrizi, M.A.; Ferre-Borrull, J.; Marsal, L.F. Advances in Optical Biosensors and Sensors Using Nanoporous Anodic Alumina. Sensors 2020, 20, 5068. [Google Scholar] [CrossRef]
- Li, K.; Zhou, W.; Zeng, S. Optical Micro/Nanofiber-Based Localized Surface Plasmon Resonance Biosensors: Fiber Diameter Dependence. Sensors 2018, 18, 3295. [Google Scholar] [CrossRef]


Publisher’s Note: MDPI stays neutral with regard to jurisdictional claims in published maps and institutional affiliations. |
© 2022 by the authors. Licensee MDPI, Basel, Switzerland. This article is an open access article distributed under the terms and conditions of the Creative Commons Attribution (CC BY) license (https://creativecommons.org/licenses/by/4.0/).