Abstract
This work aims to reveal the effects of 3D roughness parameters of sandblasted surfaces on bond strength between thermal spray coatings and substrates. The investigation was carried out on the surface of AISI 4140, which were pretreated with automatic-sandblasting system. 3D topography and roughness parameters were analyzed by a 3D optical profiler. The bond strength of WC-12Co coatings was measured using a pull-off test method. Scanning electron microscope revealed that the morphology of the surface after sandblasting was rough. Furthermore, the surface topography was characterized by several irregular peaks and pits with different directions and no fixed orientation randomly distributed on sandblasted surface. The average values for surface roughness Sa = 4.84 ± 0.34 μm and bond strength = 32.8 ± 2.8 MPa were obtained. In terms of 3D roughness parameters, Sa, Sdr, Sdq and Sq were found to have more significant impact on affecting the bond strength, showing a nonlinear regression relationship. Furthermore, bond strength was positively correlated with Sa, Sdr and Sdq, while inversely proportional to Sq. This confirmed that a greater surface roughness of a sandblasted surface was not more conducive to the improvement of bond strength. The influence mechanism of each parameter was discussed, which was consistent with the regression mathematical model.
1. Introduction
The bond strength (BS) between coatings and substrates is an important property to evaluate the quality of thermal spray coatings (TSCs), and directly affects the service performance of TSCs, such as corrosion resistance [1], wear resistance [2] and bending fatigue resistance [3]. The bonding mechanism between TSCs and substrates can generally be classified into three categories, including mechanical bonding, physical bonding (generated when substrate surface is very clean or activated) and metallurgical bonding (generated when exothermic reaction occurs or particle temperature is very high), in which mechanical bonding plays a leading role. Mechanical bonding mainly results from the fact that the TSC shrinks and bites the convex points on the pretreated surface of a substrate during rapid condensation. Therefore, the morphology characteristics of the pretreated surface significantly affect the bonding property of TSCs [4]. At present, many types of technologies have been employed for pretreating surfaces of the components to be sprayed, such as water jet [5,6], sandblasting [7,8], laser surface texture technology [9,10] and turning [11], etc. Among them, the sandblasting process, as a conventional pretreatment process, has the advantages of simple processing steps, high efficiency and low cost. Therefore, the sandblasting process is extensively used in engineering applications.
Sandblasting process parameters, including sandblasting distance, sandblasting pressure, sandblasting time and sandblasting angle, etc., are normally adjusted to improve bonding properties, such as enhancing BS, reducing porosity and cracking resistance. The optimization of sandblasting parameters has attracted the attentions of many researchers. Asl, S.K. et al. [12] sandblasted an AISI 4130 steel with Al2O3 particles and measured the mean roughness (Ra) of the surfaces. The results showed that a 90° blasting angle gave slightly higher Ra = 8.65 μm in comparison with the results obtained for a blasting angle of 45° (Ra = 7.93 μm). Staia, M.H. et al. [13] found that as the sandblasting pressure changed from 0.345 to 0.621 MPa, the average surface roughness Ra ranged from 9.74 to 12.57 mm, and the maximum BS increased considerably from 32.7 to 52.5 MPa. Day, J. et al. [14] studied the correlation of the following factors such as grit size (20, 36, 54), blasting pressure (20, 35, 50 psi), blasting time (4, 6, 8 passes), blasting distance (4, 6 in.), and blasting angle (45°,90°) with the BS. Finally, they found that the linear regression equation can predict precisely of the BS values and roughness Rz using the process parameters. In addition, sand particles of copper [15], white alumina [16], steel shot [17], HG40 [18] could produce sandblasted surfaces with different roughness levels, thereby obtaining TSCs with different bonding properties.
In summary, the sandblasting process parameters can affect the BS of TSCs by preparing the substrate with different surface roughness. However, using the same sandblasting process parameters to blast substrates with different materials will lead to different sandblasted surface morphology. In other words, the surface morphology and roughness of the substrate after being sandblasted not only depend on the sandblasting process parameters, but also have a great relationship with the type of substrate materials. Therefore, the research of process parameters can only focus on a specific matrix material, and the research results are not universal, which cannot directly guide the sandblasting process development of other materials. In recent years, surface morphology analysis techniques have been increasingly employed in surface quality evaluation of sandblasted surfaces [19]. As important parameters of surface characteristics of the substrate, line roughness parameters are often used to analyze the coarsening degree of the surface after being sandblasted, which are also named as 2D roughness parameters and defined in ISO 4287. The following 2D roughness parameters are widely used [20].
- −
- Rz, sum of height of the largest profile peak height and the largest profile valley depth within a sampling length.
- −
- Ra, arithmetic mean of the absolute ordinate values within a sampling length.
- −
- Rq, root mean square value of the ordinate values within a sampling length.
- −
- RSk, quotient of the mean cube value of the ordinate values Z(x) and the cube of Rq, respectively, within a sampling length.
- −
- Rp, largest profile peak height within a sampling length.
- −
- Rku, quotient of the mean quadratic value of Z(x) and the fourth power of Rq within a sampling length.
It has been generally confirmed that different linear roughness parameters result in different BS of TSCs [18,21]. Using different preparation methods such as milling, waterjet cutting, grit blasting with coarse and fine alumina of size 520–550 mm and 100 mm to prepare the samples and obtained the surface with different linear roughness parameters, the coatings prepared on the different surface showed that high linear roughness resulted in poor wear resistance [22], high porosity [23], but the hardness was independent of the substrate roughness [24]. Paredes, R.S.C. et al. [25] studied the variation of coating roughness with different sandblasted substrate surfaces. They found that the reduction of substrate roughness leading to smoother coating surfaces, which was a great benefit to the post processing. In addition, substrate surface roughness affected the particle deformation process during impact with the maximum high equivalent plastic strain achieved are 4.5, 3.7, 5.4 and 2.2 for impact simulated on flat, inclined, peak and valley surfaces, respectively [26]. Due to the larger and smaller line surface roughness, the spherical droplets were flattened out to form disc and splash splats, which were more commonly associated with good contact areas and poor contact regions in both the high- and low-adhesion samples, respectively [27]. Singh, R. et al. [28] used cold-spray process to deposit IN 718 powders on the IN 718 substrates which were well-polished, sandblasted with F-150 grit and F-36 grit, respectively. In was found that the higher the roughness, the larger the powder particle plastic deformation and the higher the interfacial material mixing. On the contrary, due to poor intermixing of material, defects such as cracks and spalling would appear after coating solidification when the substrate surface roughness was low.
However, the aforementioned research mainly analyzed the influence of line roughness parameters on the BS. Since the roughening of a substrate surface is a stochastic process [29], the surface topography of sandblasted surface has strong randomness [30]. The line roughness parameters would not completely reflect the morphological characteristics of the sandblasted surface [31] and influence on the BS of TSCs. Areal roughness parameters, namely 3D roughness parameters (3DRPs), represent the contour features within a larger area compared to that of the line roughness parameters [32]. According to ISO 25178-2, the 3DRPs can be divided into amplitude parameters and comprehensive parameters, and the definitions of common parameters are as follows.
- −
- Sa, this parameter expands the line roughness parameter Ra three dimensionally, represents the arithmetic mean of the absolute coordinate Z (x, y) in a defined area.
- −
- Sku, this parameter expands the line roughness parameter Rku three dimensionally, and is used to evaluate sharpness in the height distribution.
- −
- Sp, this parameter expands the line roughness parameter Rp three dimensionally. It is the maximum value for peak height.
- −
- Sq, this parameter expands the line roughness parameter Rq three dimensionally. It represents the root mean square for Z(x, y) within the evaluation area.
- −
- Ssk, this parameter expands the line roughness parameter Rsk three dimensionally; parameter Ssk, is used to evaluate deviations in the height distribution.
- −
- Sv, this parameter expands the line roughness parameter Rv three dimensionally. It is the maximum value for the valley’s depth.
- −
- Sz, this parameter expands the line roughness parameter Rz three dimensionally. The maximum height Sz is equivalent to the sum of the maximum peak height Sp and maximum valley depth Sv.
- −
- Sdq, this parameter expands the line roughness parameter Rdq three dimensionally. It indicates the mean magnitude of the local gradient (slope) of the surface. The surface is more steeply inclined as the value of the parameter Sdq becomes larger.
- −
- Sdr, this parameter signifies the rate of an increase in the surface area. The increase rate is calculated from the surface area derived by the projected area.
It is obviously that 3DRPs can more accurately describe the surface roughness of the substrate due to the fact that 3DRPS can expand the line roughness parameter three dimensionally [33]. Therefore, it is of great significance to study the influence of 3DRPs of sandblasted surfaces on the bonding properties of TSCs. It was experimentally confirmed that the surface morphology on the cross-section after being sandblasted exhibited fractal characteristic, which was more closely related to the BS of ceramic coatings than roughness parameters traditionally used [34]. However, the influences of different 3DRPs on the bonding properties of TSCs were not further studied in published literatures.
In this study, an orthogonal test with sandblasting distance and sandblasting speed as influencing factors was designed and was conducted on widely used AISI 4140 material by an automatic sandblasting system. A 3D optical profiler was employed to analyze the surface topography of sandblasted surfaces obtained by different sandblasting process parameters. After sandblasting, HVOF WC-Co coating was prepared on the surface and the BS was determined. In addition, a mathematical model of BS of TSCs as a function of 3DRPs was developed by using a regression analysis method. The aim of the study is to analyze the effects of 3D morphology of sandblasted surface on BS of TSCs. The novelty of the study is that the key 3DRPs which exhibit significant influences on the BS of TSCs are determined by a nonlinear regression method and the influence mechanisms of key 3DRPs are explored.
2. Experimental Procedures
2.1. Experimental Materials
Round specimens of 25 mm diameter and 5 mm thickness made of hardened AISI 4140 were used in this study. Its chemical composition is listed in Table 1. To simulate a hardened component surface, the surface of the sample was hardened by induction quenching prior to sandblasting. As shown in Figure 1, the hardened layer is composed of lath martensite and acicular martensite. The Vickers hardness of the hardened layer varies between 580 and 620 HV.

Table 1.
Chemical composition of AISI 4140 steel (wt.%).
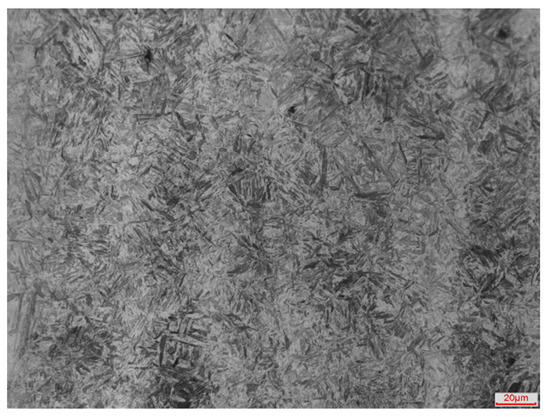
Figure 1.
Microstructure of substrate hardened layer.
The grit material used for sandblasting pretreatment was white corundum with a particle size of 24 mesh. As shown in Figure 2, the sand particles had the shapes of irregular edge angles, around which many sharp peaks were randomly distributed. Under the action of compressed air, the sand particles impacted the substrate surface at high speed. The sharp peaks were conducive to cut the substrate surface and realize a coarsening treatment of the substrate surface. After the pretreatment of substrate surface, the coating was prepared by HVOF. The powder deposited was WC-Co powder (Metco™ 72F-NS, Sulzer-Metco, Winterthur, Switzerland) with a mixture of 88% WC and 12% Co in weight and was of spherical shape in scanning electron microscopy (Figure 3). The particle size of the WC-Co powder was in the range of 15–45 μm.
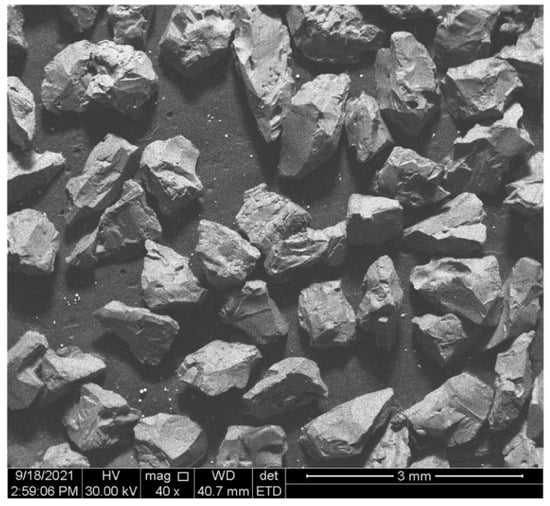
Figure 2.
Morphology of sandblasting sand.
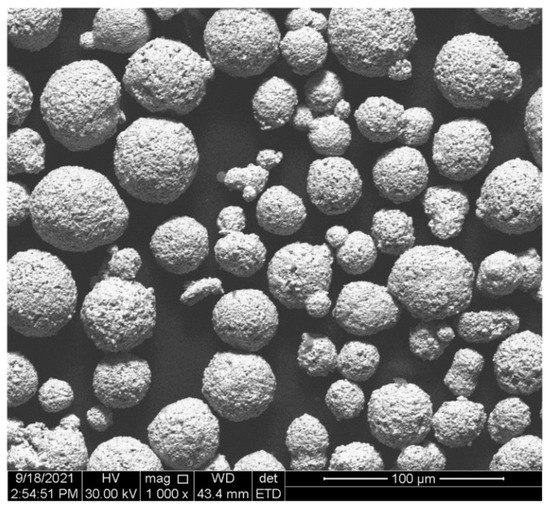
Figure 3.
Morphology of HVOF powder (WC-12Co).
2.2. Sandblasting Process and Samples Preparation
The automatic sandblasting system was used for the sandblasting treatment of substrate surface to realize a sandblasting process with high repeatability and reproducibility (Figure 4). The system is composed of three major modules: sample holder module, motion control module, and sandblasting module. Before sandblasting process, samples to be pretreated were degreased and rust-removed with acetone and attached to the sample holder with strong magnets. Subsequently, sandblasting parameters (such as sandblasting distance, sandblasting angle, and sandblasting pressure) and motion parameters (such as sandblasting speed and overlapping rate) were set through sandblasting module and motion control module, respectively. It should be noticed that the sandblasting gun could feed at any speed along with X, Y and Z directions, owing to precise control of the motion control module.
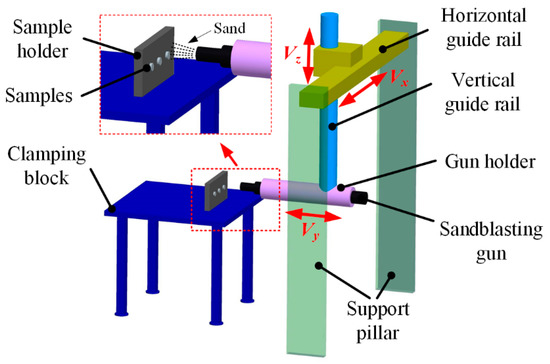
Figure 4.
A schematic diagram of the automatic sandblasting system.
To prepare sandblasted surface with different morphological characteristics, an orthogonal test plan based on statistical Design of Experiments (DOE) with sandblasting distance and sandblasting speed as influencing factors was designed. The results were subsequently analyzed and evaluated using includes central composite design (CCD) response surface methods. In the CCD test design, the test points are composed of cube points, center points, and axial points [35,36]. Based on the previous process research results, the center point of sandblasting speed and sandblasting distance was set as 200 mm/s and 200 mm, respectively. As listed in Table 2, five levels were set for each factor ranged from 129.3 to 270.7. Other process parameters were as follows: the sandblasting angle was 90°, the sandblasting pressure was 0.7 MPa, the overlapping rate was 50%, and each sample was sandblasted once at a time. To remove residual sand particles, sample surfaces were cleaned with compressed air after sandblasting.
Table 2.
The levels of sand blasting process parameters.
The WC-12Co coating on the surface of the BS test sample was fabricated by HVOF system (JET KOTE III, Stellite, Latrobe, PA, USA), which used propylene as fuel gas, oxygen as auxiliary fuel gas and argon as powder gas. The spraying processes were carried out according to the process parameters listed in Table 3.
Table 3.
Thermal spraying process parameters.
2.3. Test Design
The surface topography of the samples before and after sandblasting was evaluated by Inspect S50 tungsten filament scanning electron microscope. In addition, the surface of each sample after being sandblasted was inspected by a 3D optical profiler (Contour GT-K1, Bruker, Karlsruhe, Germany), which was a precision instrument developed on the basis of white light interferometry [37]. The vertical scanning interferometry mode was used to characterize the rough surface [38]. Due to the topography of sandblasted surface was uniform and anisotropy [34], topographical measurements were taken at 5 different random locations on each sample based on ISO 4287, ISO 12085, ISO 13565–2/3 and ISO 25178–2. The scanning surface area and scanning speed was 1267.2 μm × 950.4 μm and 0.5 mm/s, respectively. Furthermore, to reduce the measurement uncertainty and noise, the instrument was placed on a vibration isolation platform, and the threshold of signal-to-noise level was set to 5%. Finally, the raw data obtained from the profiler was filtered and processed according to the ISO 4288:1996 using VISION 64™ software (v5.8.4, Bruker, Germany) [39].
To observe the characteristics of the interface between coatings and substrates, samples with HVOF coatings were cut along the direction parallel to the diameter. Subsequently, standard metallography measures were employed to fabricate samples for microstructure analysis. After corroded with aqua regia solution (HCl: HNO3 = 3:1, v/v), the cross-section surfaces were characterized using an optical microscope (DMI5000M, Leica, München, Germany).
BS test specimens were prepared according to ISO 14916-2017. The diameter of the cylindrical auxiliary connecting block was d = 25 mm, which was the same as that of the coating samples. Before bonding, the non-sprayed surface of the coated sample and the surface of the auxiliary connecting block were sandblasted, respectively. E-7 glue (Shanghai Huayi Resins Co., Ltd., Shanghai, China) was used to bond the coating samples and the auxiliary connecting blocks. Then the test specimens were placed in an incubator at a constant temperature of 100 °C for 3 h for curing.
As shown in Figure 5, the clamping system consisted of a ball joint, which ensured clamping and loading of the specimens through the center line following no bending and torsion moments. Before the BS test, the clamping block was connected to a tensile testing machine (AGS-X, Shimadzu, Kyoto, Japan), and then was pulled in the opposite direction at a speed of 1 mm/min. To avoid the influence of defects in the BS test specimens, a handheld X-ray fluorescence spectrometer (S1 TITAN 200, Bruker, München, Germany) was used to detect whether the iron content at the fracture section increased significantly, which meant that the sample was cracked from the interface between the coating and the substrate. The BS test results were only obtained if the separation occurred at the interfaces between coatings and substrates. The BS of the coatings for each group of sandblasting samples were tested for three effective values, and the average of the above three test values was taken as the BS of the TSCs corresponding group of sandblasting parameters.
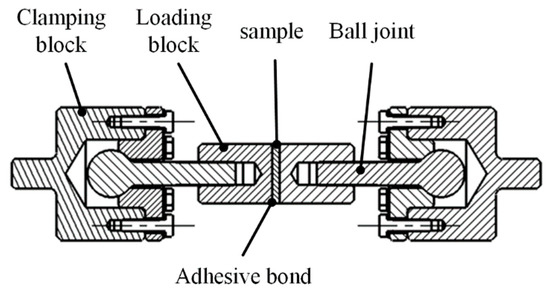
Figure 5.
A schematic diagram of the specimen connection device for BS test.
3. Results and Discussion
3.1. Morphological Characteristics of Substrate Surface
Figure 6 shows the typical micromorphology of the sample surface before and after sandblasting. The surface before sandblasting is relatively smooth without obvious pits and convex peaks and evenly distributed with machining grooves and residual chip edges (Figure 6a). Nevertheless, morphology of the surface after being sandblasted is relatively rough, the number of pits and peaks are significantly increased, and the unevenness was clearly observed (Figure 6b).
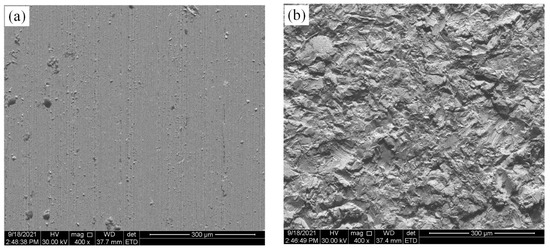
Figure 6.
Micrographs of the surfaces (a) the sample before sandblasting; (b) the sample after sandblasting.
According to the 3D morphological characteristics of the sample surface after sandblasting pretreatment (Figure 7), it could be seen that many irregular peaks and pits are randomly distributed on the substrate surface, with different directions and no fixed orientation. Furthermore, the common 3DRPs of sandblasted surface are analyzed and shown in Table 4.
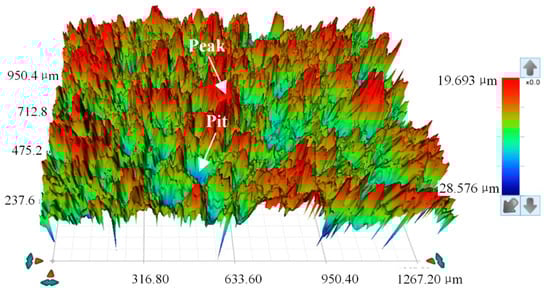
Figure 7.
3D topography of the sandblasted surface.
Table 4.
The results of 3DRPs and BS of TSCs.
3.2. Details of HVOF Coatings
Based on the designed orthogonal test scheme, WC-Co TSCs were sprayed on the samples surfaces pretreated with various sandblasting process parameters. Figure 8 presents the cross-sectional morphology of the prepared TSC. It can be observed that the thickness of WC-Co TSC was 0.25 mm on average, and the coating is generally dense. Moreover, the coating-substrate interface is well combined. A large number of grey lines (blue arrows) and black dots (red arrows) are randomly distributed in the coatings microstructure, and the EDS composition of point I was detected, as shown in Table 5, which indicates that oxides and pores are formed during the coating deposition process [40,41]. In addition, some areas (red dotted box) of the interface are distributed with pore defects and are significantly deeper than the surrounding areas. The interfacial microstructure features can be attributed to the morphology of the substrate after sandblasting.
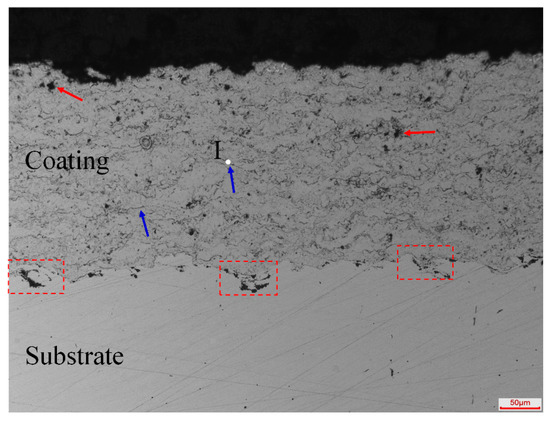
Figure 8.
The cross-section morphology of HVOF WC-12Co coating.
Table 5.
EDS spectra of position I.
Subsequently, the BS test was carried out and the BS of the TSCs were presented in Table 4. Figure 9 demonstrates the typical macroscopic morphology of the fracture section after testing, which is uniform and without residual epoxy resin adhesive. Subsequently, the Fe content at the fracture section of samples is detected, and the test results of BS of the samples with high iron content are retained.
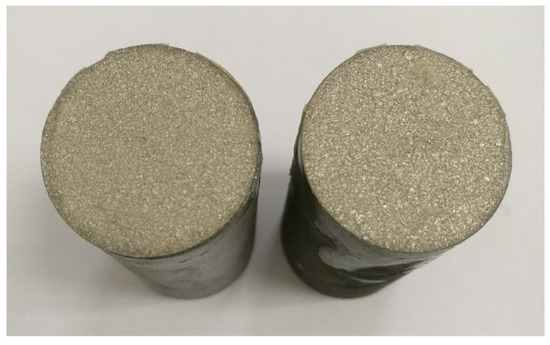
Figure 9.
Macroscopic morphology of the fracture section of the BS test specimen.
3.3. Analysis of Regression Mathematical Model
After calculating average values of the 3DRPs and BS of samples under the same sandblasting process parameters as shown in Table 4, regression analysis method was employed to analyze the influence of 3DRPs on BS, and a regression analysis mathematical model was developed. According to the definitions of common parameters, Sp represents the height of the highest peak in the measured area, it can reflect overall morphology characteristics of the area. In other words, Sp can only reflect the characteristics of the highest peak in the evaluation area, but not the overall characteristics of the evaluation area. Similarly, Sv represents the maximum depth of the valley bottom and Sz represents the maximum height, which also cannot reflect the overall morphology characteristics of the evaluation area. Therefore, the aforementioned three factors are not suitable to evaluate the effect of roughness parameters on BS and are not considered in the regression analysis.
3.3.1. Analysis of Linear Regression Mathematical Model
Firstly, it is assumed that there is a linear relationship between 3DRPs and BS of the TSCs. Equation (1) shows the assumed mathematical model.
where bondstreth is BS of the coatings, is the assumed constant and , , , , , are the assumed coefficients of roughness parameters Sa, Sdq, Sdr, Sku, Ssk, Sq, respectively.
Multiple linear regression analysis was conducted based on the measured data in Table 4, and the analysis results were shown in Table 5. The linear regression mathematical model obtained from the analysis and calculation results in Table 5 was shown in Equation (2).
The significance test method is used to verify the effectiveness of the regression model. There are generally two methods, one is the F test to calculate the overall significance of the regression equation, and the other is the t test to calculate the individual significance of the regression coefficient [42]. Generally, if the conditions of the coefficient of determination R-value (0.8–1), the critical value of F-distribution F-value > F1−α(k,n − k − 1), and the error probabilities p-value < α are met, there is a significant linear correlation between the dependent variable and the independent variable, meaning that the regression mathematical model is acceptable [43]. According to the analysis and calculation results in Table 6, it could be concluded that when the significant level α is taken as 0.05, the correlation coefficient R-value = 0.7884 < 0.8, F-value = 2.6579 < F1−0.05(6,3) = 8.941, and p-value = 0.3681 > 0.05. Therefore, it is considered that there is no linear correlation between the dependent variables and the independent variables.
Table 6.
The results of linear regression analysis.
3.3.2. Analysis of Nonlinear Regression Mathematical Model
Since the functional relationship between the independent variables Sa, Sdq, Sdr, Sku, Ssk, Sq and the BS of TSCs is not clear, the power function shown in Equation (3) is assumed as the preliminary nonlinear regression mathematical model.
In order to facilitate the solution, both sides of Equation (3) are taken logarithm to convert the original equation from nonlinear function to linear function, as shown in Equation (4).
It is supposed that , , , , , , , , the above equation is transformed into the equation shown in Equation (5).
Multiple linear regression analysis was carried out on the basis of the measured data in Table 4, and Table 7 showed the regression coefficient analysis results. It could be found that when the significant level α is 0.05, R-value = 0.9395 > 0.8, F-value = 11.7585 > F1−0.05(6,3) = 8.941, and p-value = 0.0523 > 0.05, indicating that the regression mathematical model is acceptable. At the same time, it could also be seen that the confidence interval of the regression coefficient contained zero point, indicating that the influence of Sku on the BS is not significant. The time series residual diagram obtained from the analysis is shown in Figure 10. Most of the error bars pass through the zero line, but the error bar of the fifth sample deviates far from the zero line, which indicates that it is a singular point, and the sample data should be removed in the subsequent model optimization process.
Table 7.
The results of regression analysis.
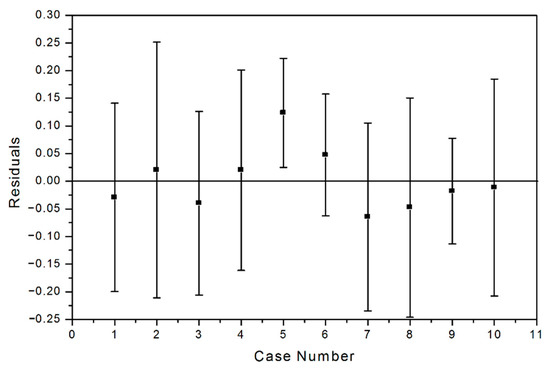
Figure 10.
Residual plot of regression analysis.
To further analyze and obtain the 3DRPs of sandblasted surface that have a significant impact on the BS, a stepwise regression analysis method is used to optimize the regression mathematical model. As shown in Table 8, the Sku and Ssk have no significant impact on the BS of TSCs and could be removed.
Table 8.
The results of stepwise regression analysis.
After removing the influencing factors Sku, Ssk and the fifth group sample data, multiple linear regression analysis is performed on the remaining experimental data. According to the analysis results in Table 9, the mathematical model equation of the power function regression after linear transformation could be obtained as shown in Equation (6).
Table 9.
The results of linear regression analysis.
When the significant level α is 0.05, R-value = 0.9107 > 0.8, F-value = 6.0716 > F1−0.05(4,5) = 5.192, p-value = 0.037 < 0.05, and the confidence interval of each variable does not contain zero points, indicating that the linear transformation power function model optimized by stepwise regression analysis has strong correlation. The mathematical model is restored to the power function regression mathematical model, as shown in Equation (7). It can be seen that the 3DRPs that significantly affect the BS of the coating are Sa, Sdr, Sdq and Sq.
3.4. Influence Mechanisms of 3DRPs
The regression mathematical model reveals that a nonlinear regression relationship between 3DRPs and BS was obtained. To verify the feasibility of the regression model, the influence mechanism of each parameter on the bonding property is analyzed in this section. It should be noted that the definition and calculation formula of each parameter and reference surface are in compliance with ISO 25178–2.
3.4.1. Influence Mechanisms of Sa and Sdr
Sa represents the arithmetic mean of the absolute value of the height differences between pits and convex peaks in a definition area relative to a reference surface, and the calculation formula is shown in Equation (8). This parameter extends the surface profile roughness parameter Ra to three dimensions, which can reflect the characteristics of a sandblasted surface more comprehensively.
where A is area of the definition area, Z(x,y) is the function of surface contour curve.
As shown in Equation (9), Sdr represents increase rate of the extended area (surface area) of a region relative to the projected area, which increases with refinement and roughness of surface structure.
In order to illustrate the influence mechanisms of Sa and Sdr on the BS of TSCs, the actual 3D contour is extracted from the sample surface (Figure 11). It is obvious that the left area is coarser and more uniform than the right area. The height differences between the pits or peaks of left area and the reference surface (|Z(xL,yL)|) are larger than that of right area (|Z(xR,yR)|), which results in that Sa-Left in left area is larger than Sa-Right in right area based on Equation (8). Similarly, according to Equation (9), larger |Z(x,y)| could obtain larger Sdr. Based on the above analysis, the variation trends of parameters Sa and Sdr are consistent, which is also demonstrated in Table 4. When the definition area A is the same, the larger Sa and Sdr are ascribed to the greater height differences between the pits or peaks on the contour surface and the reference surface, and lead to the larger surface area of the contour [33]. This increases the contact area in the interfaces between TSCs and substrates [18]. In addition, the pits and peaks with large height differences could provide more anchor points for TSCs, which is conducive to further improve the coating BS [44,45]. Therefore, the bonding performance of TSCs is proportional to Sa and Sdr, which is consistent with the mathematical model in Equation (7).
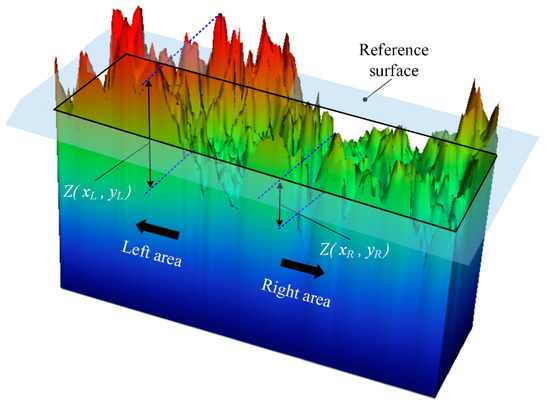
Figure 11.
Under the same evaluation area, larger Sa and Sdr of left area represent that the height differences Z(xL,yL) is larger than Z(xR,yR), which lead to more anchor points for TSCs and larger contact area at the interface between TSCs and substrates.
3.4.2. Influence Mechanisms of Sdq
Sdq is the root mean square slope, and the calculation formula is shown in Equation (10), which represents steepness of the sandblasted surface and is equal to root mean square of the slope of all points on the surface. As an example, Sdq is zero meaning the surface is an ideal flat plane. In other words, the steeper the surface, the greater the Sdq.
Figure 12a presents the contour curve along X-Z longitudinal section of the sandblasted surface. The solid red line in Figure 12b shows the actual contour curve of the extracted local area A, whose function equation is assumed to be Z1(x, y). It can be observed that the depth of the contour shown by the solid red line is deeper, and the contour bottom is relatively flat. The absolute value of slope of each point (|∂Z1(x, y)/∂x|) in this area is approximately zero. Similarly, in the Y-Z longitudinal section, the absolute value of slope of each point (|∂Z1(x, y)/∂y|) is also approximately zero. Consequently, the value of Sdq of the area A calculated by Equation (10) is relatively small. In contrast, the hypothetical comparative analysis contour curve shown by the dashed black line, with an assumed function equation Z2(x, y), exhibits a uniform distribution of pits and peaks with no flat area. Therefore, it is obvious that the absolute value of slope value of each point in the X-Z longitudinal section (|∂Z2(x, y)/∂x|) and the Y-Z longitudinal section (|∂Z2(x, y)/∂y|) is relatively larger, resulting in a larger Sdq.
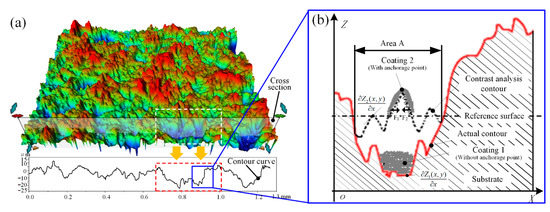
Figure 12.
(a) 3D surface morphology and contour curve of a surface area after sandblasted; (b) analysis of the influence of sandblasted surface with different Sdq on the bonding strength of TSCs. Sdq represents sharpness of the pits or peaks on the surface. Larger Sdq means that the surface is composed of sharper pits and peaks and fewer flat areas.
According to the above analysis results, the sandblasted surface with small Sdq is characterized by pits and peaks with low slope angle and flat bottom/tip, which are detrimental to form anchor points, resulting in forming splash splats during the deposition process [28] and poor BS between TSCs and substrates [45]. On the contrast, large Sdq represents that the surface is composed of sharper pits and peaks and fewer flat areas, which means more anchor points for mechanical bonding [22] and higher deformation of molten particle. In general, the anchor points and high deformation of particle are benefit to improve the BS of coatings [46]. Therefore, it can be concluded that the BS of TSCs is directly proportional to Sdq, which further proves the acceptability of the mathematical model.
3.4.3. Influence Mechanisms of Sq
Sq is the root mean square of the height difference of each point in the definition area relative to the reference surface, that is, the standard deviation of the height difference of each point in the area. The calculation formula is shown in Equation (11).
Figure 13 shows actual morphological characteristics of a sandblasted surface. It could be observed that the height differences (|Z1(x, y)|) of the points above the reference surface is smaller than that of the points below the reference surface (|Z2(x, y)|). Furthermore, the larger the value of Sq, the greater the difference between (|Z1(x, y)|) and (|Z2(x, y)|), and the surface is mainly distributed with deep pits, as presents in Figure 13. Due to these deep pits, the molten powder particles are sticked to the sidewalls of the pits during thermal spraying [47], which would affect the coating deposition process in the following two aspects. Firstly, the molten particles could not reach the bottom of the pits, and subsequently residual pore defects are easily formed at the bottom of the pits [48], as shown in Figure 8. Secondly, the speed of the molten particles reaching surfaces of the deep pits would be greatly reduced, which is not conducive to the wetting effect between TSCs and substrates, thereby reducing the bonding performance [49]. In summary, it is found that the higher the Sq, the lower the BS, which is consistent with the mathematical model (Equation (7)). Moreover, according to Equations (8) and (11), Sa and Sq are directly proportional to height difference (|Z(x, y)|) of each point on the sandblasted surface. Therefore, the regression mathematical model further confirms that it is not that the greater the sandblasted surface roughness, the higher the BS [50].
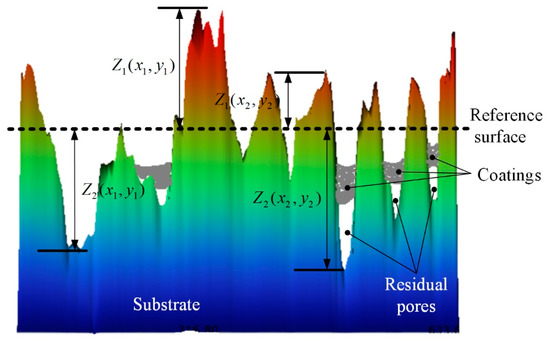
Figure 13.
The sandblasted surface with large Sq is mainly distributed with deep pits. During thermal spraying process, the stickiness of side walls of deep pits reduces the speed of molten particles, and prevents the molten particles from reaching the bottom of the deep pits, which leads to the residual pore defects and poor BS of the TSCs.
On the basis of the influence mechanisms of 3DRPs on BS, the influence trends of Sa, Sdr, Sdq and Sq are in agreement with the regression mathematical model (Equation (7)). As a conclusion, the regression mathematical model is able to reveal the relationship between the 3DRPs of sandblasted surface and the BS of TSCs. In order to optimize sandblasting process parameters, the influence mechanisms of different process parameters on the key 3DRPs should be furtherly explored in the future research.
4. Conclusions
In this study, the influence of 3DRPs of the sandblasted surface of the substrate on the BS of the WC-Co coating was studied. The substrates were pretreated with different sandblasting process parameters and analyzed using a 3D optical profiler. The mathematical model between the 3DRPs and the BS of the coating was established by regression analysis method, and the key 3DRPs that had a significant impact on the BS were obtained. Furthermore, the influence mechanism of the key 3DRPs on the BS was explored. The following conclusions are made based on detailed study.
- (1)
- 3D morphology shows that there are many irregular peaks and pits randomly distributed on the sandblasted surface of the substrate, with different directions and no fixed orientation. However, the sandblasted surfaces obtained by some sandblasting process parameters are characterized by fine and deep pits and widened area, which are unfavorable to the BS between TSCs and the substrate.
- (2)
- 3DRPs Sa, Sdr, Sdq and Sq of the sandblasted surface have significant effects on the BS of TSCs, which present a nonlinear regression relationship. The obtained nonlinear regression mathematical model is . According to the model, Sa, Sdr and Sdq are correlated positively with the BS, on the contrary, Sq is in inverse proportion to the BS, which further confirms that it is not that higher surface roughness of the sandblasted surfaces lead to higher BS of TSCs.
- (3)
- The influence mechanisms of the 3DRPs on the BS of TSCs are mainly concluded as follows: Sa and Sdr mainly signify the rate of an increase in the surface area and affect the contact area between the TSCs and the substrates. Sdq mainly represents the sharpness of pits and peaks on the sandblasted surface, which affects the number of anchor points for mechanical bonding of the TSCs. Sq is equal to the deviation degree of the height differences between pits and peaks on the sandblasted surface and the reference surface, which influences the quantity of coating defects and the wetting effect of interface between TSCs and the substrates.
Author Contributions
J.W.: conceptualization, methodology, investigation, writing—original draft, visualization. C.A.: conceptualization, resources, writing—review and editing, supervision, project administration, funding acquisition. X.Y.: investigation, writing—review and editing, supervision. Z.C.: conceptualization, resources, writing—review and editing, supervision. B.H.: investigation. All authors have read and agreed to the published version of the manuscript.
Funding
This research was funded by the National Key Technologies Research and Development Program, the number is 2019YFB2005301.
Institutional Review Board Statement
Not applicable.
Informed Consent Statement
Not applicable.
Data Availability Statement
The datasets generated during and/or analyzed during the current study are available from the corresponding author on reasonable request.
Conflicts of Interest
The authors declare no conflict of interest.
References
- Ye, D.; Xu, Z.; Pan, J.; Yin, C.; Hu, D.; Wu, Y.; Li, R.; Li, Z. Prediction and Analysis of the Grit Blasting Process on the Corrosion Resistance of Thermal Spray Coatings Using a Hybrid Artificial Neural Network. Coatings 2021, 11, 1274. [Google Scholar] [CrossRef]
- Jiang, C.P.; Xing, Y.Z.; Zhang, F.Y.; Hao, J.M.; Song, X.C. Wear Resistance and Bond Strength of Plasma Sprayed Fe/Mo Amorphous Coatings. J. Iron Steel Res. Int. 2014, 21, 969–974. [Google Scholar] [CrossRef]
- Gonzalez-Hermosilla, W.A.; Chicot, D.; Lesage, J.; La Barbera-Sosa, J.G.; Gruescu, I.-C.; Staia, M.H.; Puchi-Cabrera, E.S. Effect of Substrate Roughness on the Fatigue Behavior of a SAE 1045 Steel Coated with a WC–10Co–4Cr Cermet, Deposited by HVOF Thermal Spray. Mater. Sci. Eng. A 2010, 527, 6551–6561. [Google Scholar] [CrossRef]
- Jiang, Y.; Liu, M.; Wang, H.Y.; Mu, X.J. Recent Development of Experimental and Numerical Analysis of Adhesion Strength of Thermal Spray Coatings. Mater. Res. Innov. 2015, 19, S5–S168. [Google Scholar] [CrossRef]
- Knapp, J.K.; Taylor, T.A. Waterjet Roughened Surface Analysis and Bond Strength. Surf. Coat. Technol. 1996, 86, 22–27. [Google Scholar] [CrossRef]
- Samson, T.; MacDonald, D.; Fernández, R.; Jodoin, B. Effect of Pulsed Waterjet Surface Preparation on the Adhesion Strength of Cold Gas Dynamic Sprayed Aluminum Coatings. J. Therm. Spray Technol. 2015, 24, 984–993. [Google Scholar] [CrossRef]
- Yang, J.; Qu, K.; Yang, J. Fatigue Performance of Q355B Steel Substrate Treated by Grit Blasting with and without Subsequent Cold Spraying with Al and Cu. Surf. Coatings Technol. 2021, 405, 126662. [Google Scholar] [CrossRef]
- Abbas, M.; Smith, G.M.; Munroe, P.R. Microstructural Study of HVOF Sprayed Ni Particles on a Grit-Blasted Stainless-Steel Substrate. Surf. Coatings Technol. 2021, 409, 126832. [Google Scholar] [CrossRef]
- Bagade, V.U.; Duraiselvam, M.; Sarangi, N.; Parthiban, K. Effect of Laser Surface Texturing on Coating Adherence and Tribological Properties of CuNiIn and MoS2 Coating. Trans. Indian Inst. Met. 2022, 75, 239–250. [Google Scholar] [CrossRef]
- Kromer, R.; Raoelison, R.N.; Danlos, Y.; Verdy, C.; Costil, S.; Liao, H. Adhesion Strength Improvement by Laser Surface Texturing of Metallic Repair Coatings Deposited by Cold Spraying. In Proceedings of the ITSC2021, Indianapolis, IN, USA, 19–22 September 2021; pp. 241–246. [Google Scholar]
- Hoffmeister, H.-W.; Schnell, C. Mechanical Roughing of Cylinder Bores in Light Metal Crankcases. Prod. Eng. 2008, 2, 365–370. [Google Scholar] [CrossRef]
- Asl, S.K.; Sohi, M.H. Effect of Grit-blasting Parameters on the Surface Roughness and Adhesion Strength of Sprayed Coating. Surf. Interface Anal. 2010, 42, 551–554. [Google Scholar] [CrossRef]
- Staia, M.H.; Ramos, E.; Carrasquero, A.; Roman, A.; Lesage, J.; Chicot, D.; Mesmacque, G. Effect of Substrate Roughness Induced by Grit Blasting upon Adhesion of WC-17% Co Thermal Sprayed Coatings. Thin Solid Film. 2000, 377, 657–664. [Google Scholar] [CrossRef]
- Day, J.; Huang, X.; Richards, N.L. Examination of a Grit-Blasting Process for Thermal Spraying Using Statistical Methods. J. Therm. Spray Technol. 2005, 14, 471–479. [Google Scholar] [CrossRef]
- Kumar, S.; Bae, G.; Lee, C. Influence of Substrate Roughness on Bonding Mechanism in Cold Spray. Surf. Coatings Technol. 2016, 304, 592–605. [Google Scholar] [CrossRef]
- Mellali, M.; Grimaud, A.; Leger, A.C.; Fauchais, P.; Lu, J. Alumina Grit Blasting Parameters for Surface Preparation in the Plasma Spraying Operation. J. Therm. Spray Technol. 1997, 6, 217–227. [Google Scholar] [CrossRef]
- Bobzin, K.; Öte, M.; Linke, T.F.; Sommer, J.; Liao, X. Influence of Process Parameter on Grit Blasting as a Pretreatment Process for Thermal Spraying. J. Therm. Spray Technol. 2016, 25, 3–11. [Google Scholar] [CrossRef]
- Varacalle, D.J.; Guillen, D.P.; Deason, D.M.; Rhodaberger, W.; Sampson, E. Effect of Grit-Blasting on Substrate Roughness and Coating Adhesion. J. Therm. Spray Technol. 2006, 15, 348–355. [Google Scholar] [CrossRef]
- Zhang, P.; Xu, G.; Liu, J.; Yi, X.; Wu, Y.; Chen, J.W. Effect of Pretreating Technologies on the Adhesive Strength and Anticorrosion Property of Zn Coated NdFeB Specimens. Appl. Surf. Sci. 2016, 363, 499–506. [Google Scholar] [CrossRef]
- Mikuliszyn, J.; Starosta, R. The Study of Linear Correlation between Surface Roughness Parameters and Adhesion of Flame Sprayed Coatings. J. KONES 2016, 23, 223–230. [Google Scholar] [CrossRef]
- Kumar, S.; Bae, G.; Lee, C. Deposition Characteristics of Copper Particles on Roughened Substrates through Kinetic Spraying. Appl. Surf. Sci. 2009, 255, 3472–3479. [Google Scholar] [CrossRef]
- Padmini, B.V.; Niranjan, H.B.; Kumar, R.; Padmavathi, G.; Nagabhushana, N.; Mohan, N. Influence of Substrate Roughness on the Wear Behaviour of Kinetic Spray Coating. Mater. Today Proc. 2020, 27, 2498–2502. [Google Scholar] [CrossRef]
- Schwankl, M.; Kellner, R.; Singer, R.F.; Körner, C. The Influence of Sandblasting on the Morphology of Electroless Deposited Zinclayers on Aluminum Sheets. Appl. Surf. Sci. 2013, 283, 202–208. [Google Scholar] [CrossRef]
- Matějíček, J.; Vilémová, M.; Mušálek, R.; Sachr, P.; Horník, J. The Influence of Interface Characteristics on the Adhesion/Cohesion of Plasma Sprayed Tungsten Coatings. Coatings 2013, 3, 108–125. [Google Scholar] [CrossRef]
- Paredes, R.S.C.; Amico, S.C.; d’Oliveira, A. The Effect of Roughness and Pre-Heating of the Substrate on the Morphology of Aluminium Coatings Deposited by Thermal Spraying. Surf. Coatings Technol. 2006, 200, 3049–3055. [Google Scholar] [CrossRef]
- Nastic, A.; Vijay, M.; Tieu, A.; Rahmati, S.; Jodoin, B. Experimental and Numerical Study of the Influence of Substrate Surface Preparation on Adhesion Mechanisms of Aluminum Cold Spray Coatings on 300M Steel Substrates. J. Therm. Spray Technol. 2017, 26, 1461–1483. [Google Scholar] [CrossRef]
- Griffiths, B.J.; Gawne, D.T.; Dong, G. The Role of Grit Blasting in the Production of High-Adhesion Plasma Sprayed Alumina Coatings. Proc. Inst. Mech. Eng. Part B J. Eng. Manuf. 1997, 211, 1–9. [Google Scholar] [CrossRef]
- Singh, R.; Rauwald, K.H.; Wessel, E.; Mauer, G.; Schruefer, S.; Barth, A.; Wilson, S.; Vassen, R. Effects of Substrate Roughness and Spray-Angle on Deposition Behavior of Cold-Sprayed Inconel 718. Surf. Coat. Technol. 2017, 319, 249–259. [Google Scholar] [CrossRef]
- Saad-Eldeen, S.; Parunov, J.; Kodvanj, J.; Saad-Eldeen, S.; Soares, C.G. Experimental Assessment of Tensile Strength of Corroded Steel Specimens Subjected to Sandblast and Sandpaper Cleaning. Mar. Struct. 2016, 49, 18–30. [Google Scholar] [CrossRef]
- Wang, Y.Q.; Yang, H.F.; Han, Q.G.; Fang, L.; Ge, S.R. Tribological and Lubrication Properties of Sandblast-Textured Surfaces with Varied Roughness. Adv. Mater. Res. 2011, 154–155, 1019–1022. [Google Scholar] [CrossRef]
- Liu, B.; Yu, H.Y.; Ye, F.; Guo, J.Y. Assessment of the Three-Dimensional Surface Roughness Parameters. In Applied Mechanics and Materials; Trans Tech Publications Ltd.: Bäch, Switzerland, 2013; Volume 274, pp. 174–178. [Google Scholar]
- Nunes, E.; de Oliveira, A.F.; Sekeres, T.; Wichern, C.; Plaut, R.L. Inter-Relationship among Skin Pass Reduction, 3d and 2d Roughness Parameters and the Stampability/Paintability of Cold Rolled Steel Sheets for the Automotive Industry: A Preliminary Analysis. In Materials Science Forum; Trans Tech Publications Ltd.: Bäch, Switzerland, 2014; Volume 783–786, pp. 1039–1045. [Google Scholar]
- Linins, O.; Krizbergs, J.; Boiko, I. Wear Estimation Using 3D Surface Roughness Parameters. In Key Engineering Materials; Trans Tech Publications Ltd.: Bäch, Switzerland, 2013; Volume 527, pp. 167–172. [Google Scholar]
- Amada, S.; Hirose, T. Planar Fractal Characteristics of Blasted Surfaces and Its Relation with Adhesion Strength of Coatings. Surf. Coat. Technol. 2000, 130, 158–163. [Google Scholar] [CrossRef]
- Sun, C.; Ning, J.; Song, Z.X.; Xie, P.; Tang, Z.S. Optimization of extraction process of total flavonoids from seabuckthorn pomace by central composite design response surface methodology. Mod. Chin. Med. 2018, 20, 74–82. [Google Scholar]
- Zi, J.Y.; Zhang, S.P.; Li, Y.Q.; Zhou, W. Optimization of diesel engine performance parameters based on response surface design. Small Intern. Combust. Engine Veh. Technol. 2020, 49, 28–34. [Google Scholar]
- Molnar, V.; Szabo, G. Designation of Minimum Measurement Area for the Evaluation of 3D Surface Texture. J. Manuf. Process. 2022, 83, 40–48. [Google Scholar] [CrossRef]
- Karmiris-Obratański, P.; Karkalos, N.E.; Kudelski, R.; Markopoulos, A.P. Experimental Study on the Effect of the Cooling Method on Surface Topography and Workpiece Integrity during Trochoidal End Milling of Incoloy 800. Tribol. Int. 2022, 176, 107899. [Google Scholar] [CrossRef]
- Javed, M.A.; Stoddart, P.R.; McArthur, S.L.; Wade, S.A. The Effect of Metal Microstructure on the Initial Attachment of Escherichia Coli to 1010 Carbon Steel. Biofouling 2013, 29, 939–952. [Google Scholar] [CrossRef]
- Wang, Q.; Chen, Z.H.; Ding, Z.X. Performance of Abrasive Wear of WC-12Co Coatings Sprayed by HVOF. Tribol. Int. 2009, 42, 1046–1051. [Google Scholar] [CrossRef]
- Santana, Y.Y.; Barbera-Sosa, L.J.G.; Caro, J.; Puchi-Cabrera, E.S.; Staia, M.H. Mechanical Properties and Microstructure of WC–10Co–4Cr and WC–12Co Thermal Spray Coatings Deposited by HVOF. Surf. Eng. 2008, 24, 374–382. [Google Scholar] [CrossRef]
- Eekhout, I.; Van De Wiel, M.A.; Heymans, M.W. Methods for Significance Testing of Categorical Covariates in Logistic Regression Models after Multiple Imputation: Power and Applicability Analysis. BMC Med. Res. Methodol. 2017, 17, 129. [Google Scholar] [CrossRef]
- Yan, Q.; Yang, K.; Wang, Z.D.; Chen, M.Z.; Sun, G.F.; Ni, Z.H. Surface Roughness Optimization and High-Temperature Wear Performance of H13 Coating Fabricated by Extreme High-Speed Laser Cladding. Opt. Laser Technol. 2022, 149, 107823. [Google Scholar] [CrossRef]
- Blochet, Q.; Delloro, F.; N’guyen, F.; Jeulin, D.; Borit, F.; Jeandin, M. Effect of the Cold-Sprayed Aluminum Coating-Substrate Interface Morphology on Bond Strength for Aircraft Repair Application. J. Therm. Spray Technol. 2017, 26, 671–686. [Google Scholar] [CrossRef]
- Begg, H.; Riley, M.; de Villiers Lovelock, H. Mechanization of the Grit Blasting Process for Thermal Spray Coating Applications: A Parameter Study. J. Therm. Spray Technol. 2016, 25, 12–20. [Google Scholar] [CrossRef]
- Peng, Y.; Zhang, C.; Zhou, H.; Liu, L. On the Bonding Strength in Thermally Sprayed Fe-Based Amorphous Coatings. Surf. Coat. Technol. 2013, 218, 17–22. [Google Scholar] [CrossRef]
- Zou, H.; Zhang, H. Effects of Sand Blasting on the TBCs Fabrication Quality. In Key Engineering Materials; Trans Tech Publications Ltd.: Bäch, Switzerland, 2013; Volume 531, pp. 290–294. [Google Scholar]
- Tan, N.; Xing, Z.; Wang, X.; Wang, H.; Jin, G.; Xu, B. Investigation of Sprayed Particle Filling Qualities within the Texture on the Bonding Behavior of Ni-Based Coating. Surf. Coat. Technol. 2017, 330, 131–139. [Google Scholar] [CrossRef]
- Liu, T.; Yu, Y.; Liu, J.; Cheng, X.; Zhang, D.; Group, B.T. Influence of Spray Process Parameters on Microstructure and Properties of AlSi-Hexagonal Boron Nitride Abradable Seal Coating. Therm. Spray Technol. 2019, 11, 24–30. [Google Scholar]
- Ivosevic, M.; Gupta, V.; Knight, R.; Cairncross, R.A.; Baldoni, J.A.; Twardowski, T.E. Effect of Substrate Roughness on Splatting Behavior of HVOF Sprayed Polymer Particles: Modeling and Experiments. J. Therm. Spray Technol. 2006, 15, 725–730. [Google Scholar] [CrossRef]


Publisher’s Note: MDPI stays neutral with regard to jurisdictional claims in published maps and institutional affiliations. |
© 2022 by the authors. Licensee MDPI, Basel, Switzerland. This article is an open access article distributed under the terms and conditions of the Creative Commons Attribution (CC BY) license (https://creativecommons.org/licenses/by/4.0/).