Abstract
Asphalt bridge deck pavement is a weak bridge structure area, and early damage usually occurs in this area under vehicle loads. Due to the complexity and diversity of vehicle loads and material structures, it is difficult to truly reflect the mechanical response of bridge deck pavement under vehicle loads. This paper studies the vehicle road interaction from a microscopic perspective. In this research, the dynamic response of asphalt bridge deck pavement under multiple loads is comparatively studied, considering the mesoscopic structure of the asphalt materials. First, the compressive properties, tensile properties and interlaminar shear properties of each layer were studied through laboratory tests. Second, the asphalt mixture bridge deck pavement model, including mesostructured, was established. Then, the subprograms of the sinusoidal vibration load, rolling load and vehicle road coupling load were realised using the discrete element method (DEM). Finally, the mesomechanical response of asphalt bridge deck pavement under those three dynamic loads was comparatively studied. The study finds that there is a large difference in the mechanical response of bridge deck pavement under multiple loads. A sinusoidal vibration load can simply be the moving load, the edge of the loading area and the bottom of the lower layer bear large tensile stress, and the shear stress at the edge of the loading area is approximately 4 times that of the middle area. The rolling load can better reflect the status of the vehicle. There is a certain difference in the shear stress response between the rolling load and the sinusoidal vibration load, and the lower layer bears compressive–tensile alternating stress. Under the vehicle road coupling load, the volatility of the dynamic response is obvious due to the road roughness. Therefore, it is of vital importance to improve the abrasion resistance of the surface layer. The results show that the comprehensive consideration of multiple loads and the mesostructure can provide a more reliable method for the dynamic design of bridge deck pavement, which is of great significance for improving the durability of the pavement.
1. Introduction
As an auxiliary facility of the bridge, bridge deck pavement plays a role in protecting the bridge structure, ensuring the safety of the bridge, and improving driving comfort. However, asphalt bridge deck pavement tends to be damaged before bridge structures [1,2,3]. In order to prevent the occurrence of bridge deck pavement diseases, it is particularly important to study the true mechanical response to guide the design of bridge deck pavement.
Previous studies have focused on using the finite element method (FEM) to analyse the mechanical response of bridge deck pavement. They established various bridge models through the FEM and carried out a series of numerical analyses, considering the dynamic characteristics under traffic loads or vehicle–bridge coupling loads, analysing the mechanical responses of asphalt pavements [4,5,6]. Simultaneously, the Chinese asphalt pavement design standard adopts a static load, which is different from actual vehicle loads [7]. Dong, Si et al. [8,9,10] established a viscoelastic multilayer system model of semirigid base asphalt pavement and analysed the dynamic response of asphalt pavement under the nonlinear and nonuniform characteristics of dynamic moving vehicle loads. Gao, Gong, Ye et al. [11,12,13] used algorithms to study the mechanical response analysis of asphalt bridge deck pavement, considered the effect of random vehicle loads, speeds and road roughness, and established the relationship between half-sine loads, triangular loads, vertical step loads and moving loads. However, those studies ignored the heterogeneity and nonlinearity characteristics of the asphalt mixture. The material gradation and shape will affect the mechanical response of bridge deck pavement. Furthermore, no inductive analysis was performed on different mechanical responses under different loads. In recent years, accelerated pavement tests have been introduced to reflect the long-term damage effect of actual traffic loads on pavement in a short time, but the cost is high [14,15,16]. Economic aspects are also required for sustainability and cost-benefit studies cannot be ignored [17]. To coordinate economic and social development, it is of vital importance to reflect the real mechanical response of bridge deck pavement by numerical simulation.
Therefore, it is necessary to consider the mechanical response of bridge deck pavement under multiple loads from a mesoscopic view. Previous studies used the discrete element method (DEM) to simulate uniaxial compression tests, four-point bending fatigue tests, rutting tests, etc., and the aggregate shape and gradation [18,19], force chain and fracture distribution [20,21] were analysed. The results of the simulation test are well matched with the laboratory test. However, this method is mostly used in laboratory tests and is rarely seen in bridge deck pavement design.
To achieve the objective of this research, first, the performance of each bridge deck pavement layer is studied and the mesoscopic parameters are obtained through numerical simulation. Then, the bridge deck pavement DEM model is established on this basis. To analyse the influence of different loads on bridge deck pavement, the effects of sinusoidal vibration loads, rolling loads and vehicle–road coupling loads are realised in the software, and the mechanical response characteristics of the pavement layers under multiple load effects are comparatively analysed, which provides a reference for guiding the design of long-life bridge deck pavement. The flowchart of this research is shown in Figure 1.
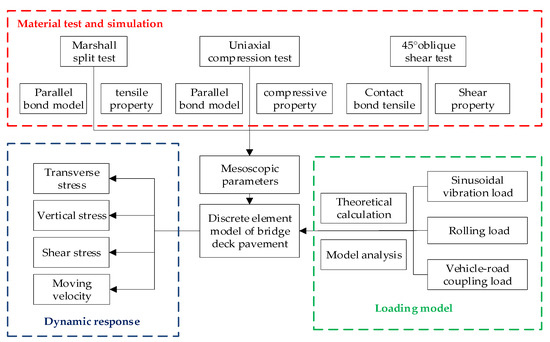
Figure 1.
Research flowchart.
2. Material Experiment and Parameter Optimization
2.1. Material Experiment
A uniaxial compression test [22] was carried out on the surface layer, the uniaxial compression test piece was formed by the rotary compaction method, and the size of the test piece was Φ100 mm × 100 mm. During the test, the ambient temperature was set to 20 °C, the diameter of the platen was 120 mm, and the loading speed was set to 2 mm/min. When the specimen was damaged, the stress-strain curve of the specimen was obtained. To reduce the experimental error, a group of three parallel specimens were loaded separately, and the average value of the three parallel specimens was taken as the final test result.
The Marshall split test [22] was carried out on the lower layer. Marshall is critical in the design of the ability to resist rutting and shoving due to the stability of the pavement [23]. A standard Marshall specimen of Φ101.6 mm × 63.5 mm was formed by the compaction method for the splitting test. The formed standard test specimen was removed from the 20 °C constant temperature water tank and quickly placed on the fixture of the test bench to conduct the asphalt mixture splitting test. The loading rate was set to 50 mm/min. Finally, through cracks were generated on the vertical line of the centre of the specimen. To ensure the reliability of experimental results, a group of six parallel specimens were loaded separately, and the average value of the six parallel specimens was taken as the final test result.
A 45° oblique shear test was performed on the waterproof adhesive layer to test its shear resistance [24]. A 300 mm × 300 mm × 100 mm size mould was used to make the bridge deck pavement composite structure piece. First, a 50 mm thick C 50 cement concrete test piece was formed. The waterproof bonding layer and asphalt mixture pavement layer were spread on the surface, and the wheel rolling method was used to roll the asphalt mixture until the thickness of the asphalt mixture layer reached 50 mm. Four specimens were drilled through a rutting plate for parallel experiments, and the average value was taken as the final interlaminar shear strength.
Figure 2 shows the process of the uniaxial compression test, splitting test and 45° oblique shear test.
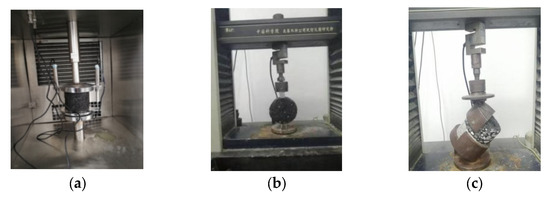
Figure 2.
Laboratory test progress. (a) Uniaxial compression test, (b) splitting test, and (c) 45° oblique shear test.
2.2. Numerical Simulation and Parameter Optimization
The size of the numerical simulation model of the uniaxial compression test was Φ100 mm × 100 mm, the asphalt mortar was represented by small balls with a particle size of 1.18~2.36 mm, and the coarse aggregate was represented by clumps whose diameters were in the range 4.75~13.6 mm.
The two-dimensional contour shape of the aggregate was obtained by the CT scanning experiment, then, typical two-dimensional aggregate characteristics were depicted by CAD software (version 2018), and twelve kinds of aggregates were randomly dropped according to the real gradation characteristics of the aggregates. The porosity was set to 4% by removing the asphalt mortar particles. After model establishment, the surface loading plate moved downwards at a constant speed of 0.01 m/s, and the bottom loading plate remained stationary. When the specimen was destroyed, the stress value of the loading plate dropped to 70% of the peak value, stopping the test. Figure 3 is the numerical simulation of the uniaxial compression test.

Figure 3.
Numerical simulation of the uniaxial compression test. (a) The early loading; (b) 1/4 cycle; (c) 1/2 cycle; (d) the end of loading.
As seen from Figure 3, with the increase in load, the specimen internal crack was gradually red, the early part of the load crack was scattered at the local scope, the mid-load model of the internal crack produced a large number of cracks in Figure 3c, and a wide distribution of load crack specimen damage rapidly developed, with the end of the specimen having obvious cracks in the oblique direction in Figure 3d.
The numerical simulation process of the splitting test is shown in Figure 4. The bottom indenter was kept fixed, the downwards movement rate of the surface loading plate was set to 50 mm/s, and the displacement and loading force were determined by monitoring the wall.

Figure 4.
Numerical simulation of splitting test. (a) The early loading; (b) 1/4 cycle; (c) 1/2 cycle; (d) the end of loading.
Figure 4 shows that with increasing load, the cracks were mainly distributed in the axial region, the cracks expanded rapidly at the end of loading, and the axial stress decreased accordingly.
Figure 5 shows the numerical simulation process of the inclined shear test of the bridge deck pavement composite structure. In the simulation test, the surface wall is controlled to descend at a constant speed of 50 mm/s until the interlayer bond is broken, and then the asphalt mixture and the cement concrete are separated.

Figure 5.
Numerical simulation of the 45° oblique shear test. (a) The early loading; (b) 1/4 cycle; (c) 1/2 cycle; (d) the end of loading.
Figure 6 shows the comparative curves of the virtual and laboratory test.

Figure 6.
Comparative curves of the virtual test and laboratory test. (a) Uniaxial compression test, (b) splitting test, and (c) 45° oblique shear test.
Comparing the simulation results with the laboratory test results in Figure 6, the trial-and-error method was adopted; that is, the parameters were constantly adjusted to make the simulation results close to the laboratory test results. When the virtual and the laboratory test curve were basically consistent, the calibrated mesoparameters were close to the real test results, which can reflect the mechanical properties of the materials and can be used in subsequent virtual tests. Considering that the study of the size effect phenomenon of asphalt mixture specimens is aimed at finding the law between the performance of asphalt mixtures and the size of the specimens, the load peak value and slope error were within 5%, so the calibrated mesoscopic parameters met the accuracy requirements of numerical testing.
According to the laboratory test results and the conversion relationship between macroscopic and mesoscopic parameters [25], the mesoscopic parameters of the C50 cement concrete bridge deck were determined, and the final obtained mesoscopic parameters of each structural layer are shown in Table 1 and Table 2.

Table 1.
Mesoscopic parameters of each structural layer of bridge deck pavement.

Table 2.
Mesoscopic parameters of waterproof adhesive layer.
3. Construction of Model and Realization of Dynamic Load
3.1. Construction of the Discrete Element Model
The bridge deck pavement structure of the double-layer asphalt mixture was established as shown in Figure 7. The thickness of the waterproof bonding layer was 2 mm, and the thickness of the cement concrete bridge deck was 35 cm. A previous study found that the mid-span of the bridge is the most unfavourable stress position of the bridge structure [26]. This paper focuses on the mesomechanical response of the pavement at the mid-span of the bridge. To improve the calculation efficiency, the load applied in this paper only acted within 2 m of the mid-span, the irregular aggregate was set within 2 m of the mid-span, and the particle size of the rest of the structure was 1 cm. The waterproof adhesive layer was represented by a regular arrangement of small balls with a particle size of 1 mm.
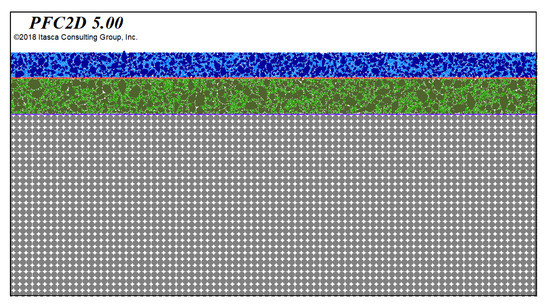
Figure 7.
Discrete element model of the bridge deck pavement. Blue layer is the upper layer of asphalt, green layer is the lower layer of asphalt, grey layer is the cement layer, red and purple line is waterproof bonding layer.
The contact model is shown in Figure 8. The grey area represents the parallel bonding model inside the asphalt mixture; the orange layer represents the contact bonding model of the waterproof bonding layer.
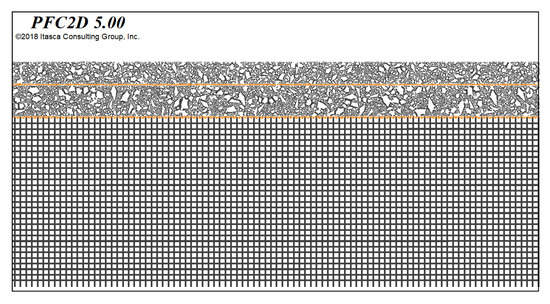
Figure 8.
Contact model distribution. First layer is the upper layer of asphalt, second layer is the lower layer of asphalt and third layer is the cement layer.
In Figure 9, particles in typical parts of the bridge deck pavement are marked in black to monitor the movement state and contact force of the asphalt pavement material particles. Figure 10 shows the distribution settings of the measurement circle. The diameter of the measurement circle was 3 cm in the asphalt layer and 6 cm in the cement layer. The mean stress in those areas was calculated by setting the measurement circle in the model test area.
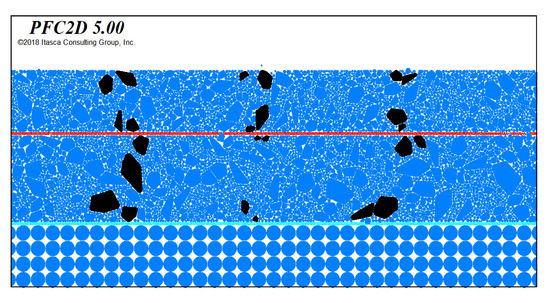
Figure 9.
Typical particle of the model. First layer is the upper layer of asphalt, second layer is lower layer of asphalt, third layer is the cement layer, blue and red line is waterproof bonding layer.
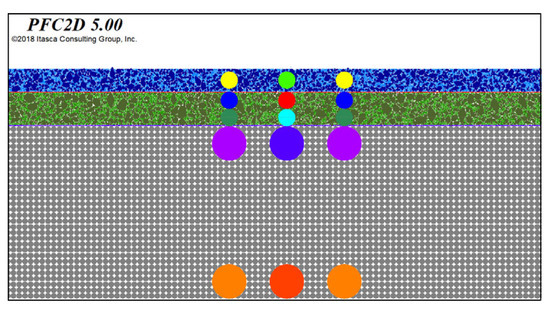
Figure 10.
Layout of the measurement circle. Blue layer is the upper layer of asphalt, green layer is the lower layer of asphalt, grey layer is the cement layer, red and purple line are the waterproof bonding layer, the circles are the measurement area of each layer.
3.2. Multiple Loads
To better simulate a vehicle load on the bridge deck pavement structure and compare the mechanical response of the bridge deck pavement under different loads, multiple loads, such as vibration load, rolling load and vehicle–road coupled load, were studied in this paper.
3.2.1. Vibration Load and Mechanical Response Analysis
A sinusoidal vibration load can simply be the moving load [27]. The vehicle moving load was replaced by a half-sine function approximation and 20 small spherical particle units with equal particle sizes were generated on the surface of the bridge deck pavement as the loading belt. The loading model and load curves are shown in Figure 11.
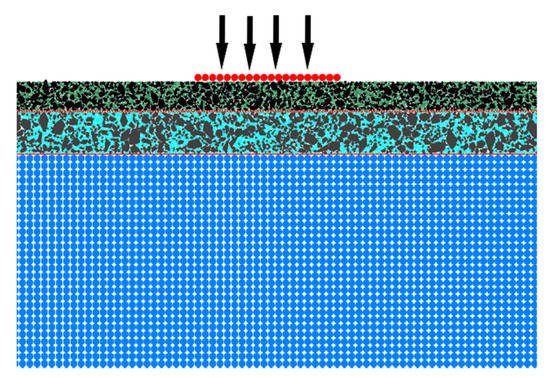
Figure 11.
Vibration load model diagram. Green layer is the upper layer of asphalt, light blue layer is the lower layer of asphalt, blue layer is the cement layer, red and orange lines are the waterproof bonding layer, and red circle is the loading plate.
The relationship between the loading force F and p was calculated by the following equation:
In the formula, n is the number of balls; R is the radius of the balls; F is the force applied to the balls (N); p is the ground pressure; and T is the two-dimensional. The thickness of the discrete element mesomechanical model is usually set to 1. According to the asphalt pavement design specification, the tire ground pressure specified in the standard is 0.7 MPa, the applied load force is obtained by the above formula, the average force is 7 kN per particle and the load action frequency is taken as 10 Hz. The load is applied by writing a half-sine wave program in fish language. The analysis results are as follows.
Figure 12 shows that with increasing load, the lateral stress of each part of the surface layer basically changes with the half sine wave form. The surface part of the surface layer and the bottom layer have a transverse compressive stress of −0.26 MPa and −0.14 MPa, respectively; the lower part of the bottom layer has a transverse tensile stress of approximately 0.15 MPa. With increasing depth, the internal lateral stress of the bridge deck pavement is transformed from compressive stress to tensile stress. The transverse tensile and compressive stresses on the cement layer are relatively large, and the distribution is basically symmetrical.
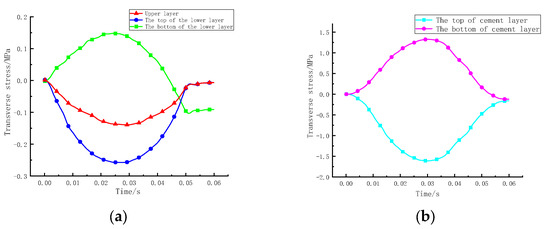
Figure 12.
Transverse stress curve under vibration load. (a) Asphalt layer, (b) cement layer.
According to Figure 13, the vertical stress of each layer of the bridge deck pavement basically changes according to a half-sine curve. Under the action of the load, the vertical stress of the surface layer is approximately 0.65 MPa at maximum. The vertical stress at the top and bottom of the cement layer is quite different, and the bottom of the cement layer is basically not subject to vertical stress. The general trend is that the vertical stress decreases with increasing depth.
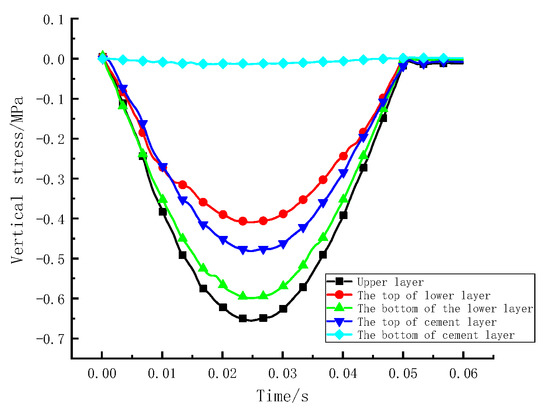
Figure 13.
Vertical stress curve under a vibration load.
Figure 14 shows that the maximum shear stress occurs beside the load edge, and the maximum shear stress is approximately −0.28 MPa, which is approximately 4 times higher than the maximum shear stress value at the load centre, which indicates that the surface layer at the wheel edge is most prone to shear damage. The shear stress response curve still shows the trend of sinusoidal change. The results of the study are not much different from the reference.
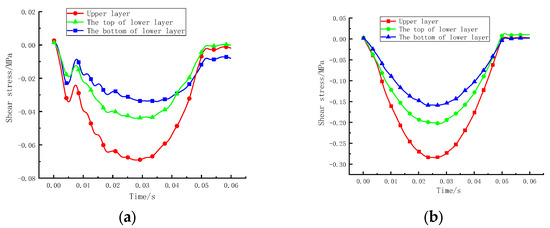
Figure 14.
Shear stress curve under a vibration load. (a) The centre of the loading area. (b) The edge of the loading area.
3.2.2. Rolling Load and Mechanical Response Analysis
In the discrete element software, 410 pebbles were arranged in a certain order to generate a rigid clump wheel. The wheel was placed on the surface of the pavement and the movement of the load was realised by applying a horizontal speed. When the wheel was given a horizontal speed, the friction force between the wheel and the bridge deck made the wheel roll. The elastic modulus of the rigid wheel was 5 × 10⁶ Pa, the radius was 320 mm, and the friction coefficient was 0.15.
The rolling loading model and contacts are shown in Figure 15 and Figure 16. As seen in Figure 16, there was a new linear rolling resistance model between the wheel and the bridge deck pavement [28], which is represented by purple segments. This contact model can impart sliding friction to the model without producing adhesion, which can well simulate the rolling action of the wheel on the bridge deck. The asphalt surface layer and cement concrete are represented in grey segments as the parallel bond model, and the bonding layer is represented in orange segments as the contact bond model.
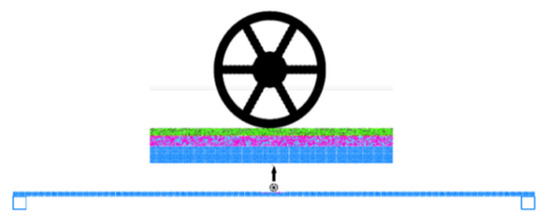
Figure 15.
Rolling load model. Green layer is the upper layer of asphalt, pink layer is the lower layer of asphalt and light blue layer is the cement layer.
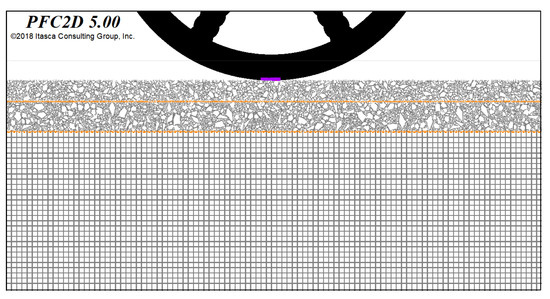
Figure 16.
Rolling load contact model. First layer is the upper layer of asphalt, second layer is the lower layer of asphalt, orange line is waterproof bonding layer.
The vertical stress under the tire was monitored by adjusting the vertical load applied to the rigid wheel, and the stress at this time was regarded as the tire ground contact pressure. When the ground pressure reached 0.7 MPa, the loading force of the wheel was 44 kN. The rolling load was carried out with this load and the vertical stress, transverse stress, shear stress and particle movement speed of the bridge deck pavement layer under rolling load were calculated, respectively.
Figure 17 shows that the bridge deck pavement layers are all subject to vertical compressive stress. The vertical stress increases and decreases rapidly before and after the rolling load passes, and the vertical stress response curve shows a symmetric distribution. The maximum vertical stress of the surface layer is approximately 0.61 MPa and the vertical stress decreases with increasing depth. The vertical stress at the bottom of the cement layer is basically zero.
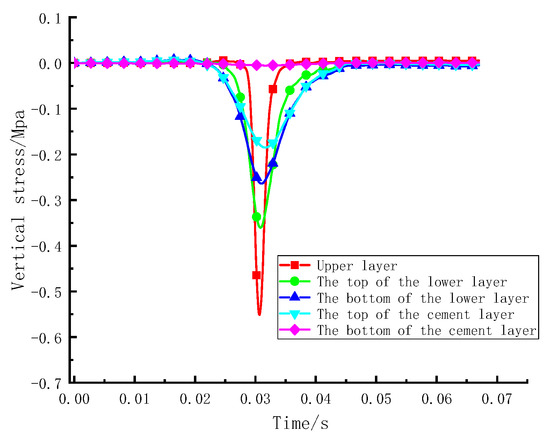
Figure 17.
Vertical stress curve under rolling load.
Figure 18 indicates that the changing trends of the shear stress under the action of rolling load and vibration load are obviously different. The direction of the shear stress of each layer changes after the wheel passes, and the shear stress of the upper layer is the largest at approximately −0.42 MPa, so the upper layer is prone to shear failure. The shear stress response value is smaller than the vertical stress. The shear stress value decreases with increasing depth.
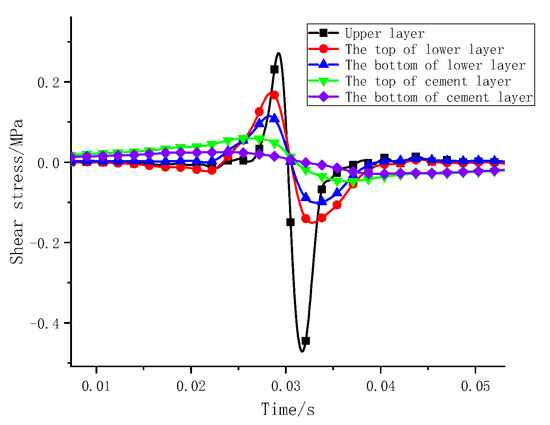
Figure 18.
Shear stress curve under rolling load.
Figure 19 shows that when the wheel passes through the mid-span, the upper layer is dominated by compressive stress after experiencing a short tensile stress, the maximum compressive stress is approximately −0.43 MPa, the bottom of the lower layer will experience an alternating change in tensile and compressive stress and the tensile stress is up to 0.2 MPa, which indicates that the lower layer is prone to fatigue damage. The cement concrete is the main bearing member and the transverse stress value is large and basically symmetrical.
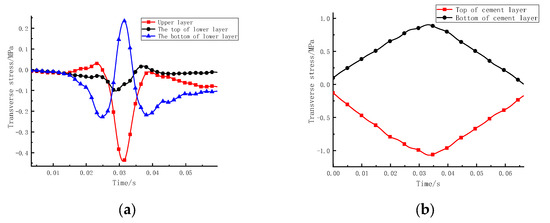
Figure 19.
Transverse stress curve under rolling load. (a) Asphalt layer; (b) Cement layer.
Figure 20 shows that the particle velocity changes sharply under the effect of the rolling load. The transverse moving velocity of the surface and bottom particles of each layer of the asphalt surface layer are opposite, and the moving speed of the particles in the upper layer is significantly greater than that of the particles in the lower layer. Figure 20b shows that the vertical velocity of the particles in the pavement layer has experienced a direction change under the load action, while the change trend of the vertical movement speed of the particles in each layer is basically the same.
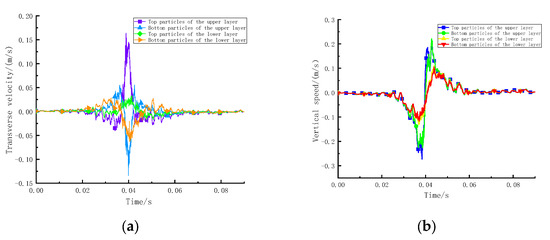
Figure 20.
Particle velocity. (a) Transverse velocity; (b) vertical velocity.
3.2.3. Vehicle Road Coupling Load and Mechanical Response Analysis
The vehicle road coupling model considers the interaction between the vehicle and the road surface and studies the dynamic response of the vehicle and the road surface with the road surface unevenness as the excitation [29]. The vehicle system was simulated as a two-degree-of-freedom quarter car suspension model, and the tire dynamic load under the interaction of the vehicle axle was calculated. This system only considers the car body and wheel mass, damping, and unevenness of the bridge deck pavement.
The differential equation of the vehicle system dynamics is:
In the formula, m1 and m2 are the body mass and wheel mass (kg), respectively, converted to the wheel;
z1 and z2 represent the absolute displacement of the body and the absolute displacement of the wheel (m);
Cs and Ct represent the suspension damping coefficient and wheel damping coefficient (N۰s/m), respectively.
Ks and Kt represent stiffness and wheel stiffness (N/m), respectively.
f represents pavement unevenness excitation.
Assuming that the car is in full contact with the bridge deck at all times during driving and the roughness road spectrum is simulated by a sine function, the excitation of the tire can be obtained as
In the formula, v is the driving speed of the vehicle, h is the amplitude of the road surface roughness, λ is the wavelength of the bridge deck roughness, and w is the external excitation frequency.
The calculation parameters of the car model are shown in Table 3.

Table 3.
Car model calculation parameters.
The wavelength of road roughness was taken as 10 m and the amplitude of road roughness was taken as h = 0.02 m. The driving speed of the vehicle was v = 72 km/h, the coupling dynamic force between the vehicle and the road was represented by the dynamic force between the vehicle and the road, and only the vehicle body displacement in the vertical direction was considered. The dynamic load of the wheel is calculated from Equation (4).
In the formula
The force of the tire on the bridge deck includes the static load of the vehicle and the dynamic load of the wheel. The static load of the vehicle selected in this paper is 50 kN, and the vehicle road coupling load is obtained by superimposing the static load and the dynamic load. A schematic diagram of vehicle–road coupling is shown in Figure 21.
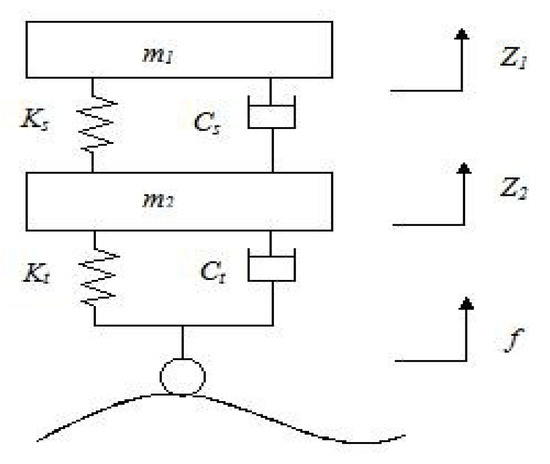
Figure 21.
Vehicle road dynamics model. m1 is car body mass, m2 is wheel mass, Ks is suspension stiffness coefficient, Cs is suspension damping coefficient, Kt is tire stiffness coefficient, Ct is tire damping coefficient, Z1 is the vertical displacement of car body, Z2 is vertical displacement of wheel and f is pavement unevenness.
The coupled dynamic tire force of the vehicle under the action of vehicle–road coupling is the dynamic excitation of the asphalt pavement during the vehicle’s constant speed driving. The calculated vehicle–road coupling load was stored in the corresponding text data file at intervals of 0.001 s, and the table function in the software was used to read and call the vehicle–road coupling load. In each cycle, the ball particles at one end were deleted, and ball particles were generated from the other end to realize the movement of the load. The moving speed of the load is related to the number of loading steps in each cycle. The final loading model diagram is shown in Figure 22.
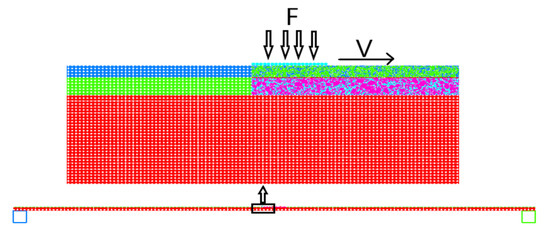
Figure 22.
Vehicle road coupling model. F is vehicle road coupling load and V is velocity of load movement. Blue part is the upper layer outside 2 m of the mid span, green mixed blue part is the upper lay inside 2 m of the mid span, green part is lower layer outside 2 m of the mid span, pink mixed blue part is the lower lay inside 2 m of mid span and red part is the cement layer.
The red curve in Figure 23 is the vertical stress response of the surface layer. Under the action of the coupled dynamic force, the vertical stress value of the surface layer changes drastically; as the depth of the pavement layer increases, the vertical stress decreases, so the coupled load has the greatest influence on the surface of the bridge deck pavement. Figure 24 shows that the shear stress value of the surface layer fluctuates greatly; the vehicle road interaction force has the greatest impact on the surface layer. As the depth of the pavement layer increases, the shear stress value decreases, and the curve becomes relatively smooth. The trend of the shear stress response is similar to that of the rolling load.
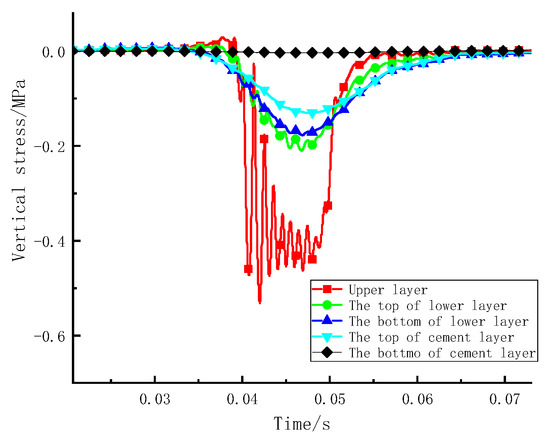
Figure 23.
Vertical stress curve under the coupling load.
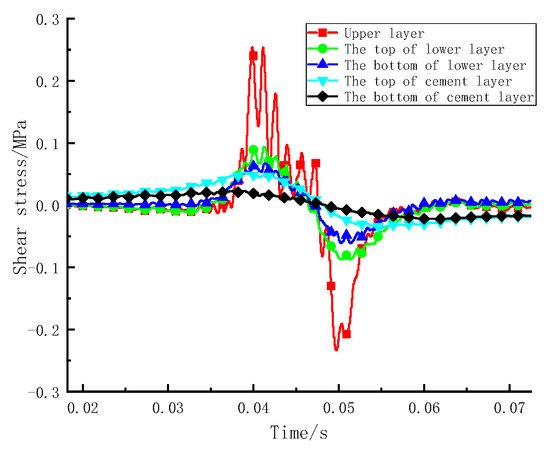
Figure 24.
Shear stress curve under the coupling load.
Figure 25 shows that under the action of the vehicle road coupling load, the transverse stress fluctuates greatly. The upper layer is mainly subjected to compressive stress. The bottom of the lower layer bears the compressive stress first and then bears tensile stress; the compressive stress value is −0.15 MPa, and the tensile stress value reaches 0.1 MPa. The trend of the dynamic response is similar to reference [30]. The alternating phenomenon of tensile and compressive stress at the bottom of the lower layer is obvious.
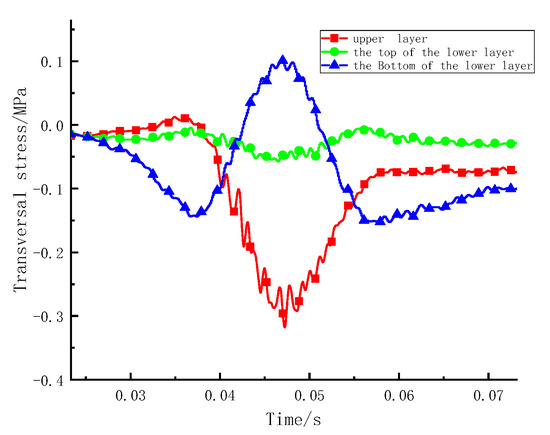
Figure 25.
Transverse stress curve under the coupling load.
4. Conclusions
In this paper, through laboratory and virtual tests, the mesoscopic parameters of different pavement layers were obtained and an asphalt bridge deck pavement model was established by DEM considering the mesostructures of the asphalt materials. Additionally, the mesomechanical response of the deck pavement layer under multiple loads was comparatively analysed through numerical simulations. Based on the analysis presented in this paper, the conclusions of the study are summarised as follows.
- (1)
- There is a certain difference between the mechanical response under multiple loads. Therefore, it is significant to predict the damage behaviour of bridge deck pavement by considering multiple load forms.
- (2)
- Sinusoidal vibration loads can simply be the moving load. Under the action of vibration loading, the upper layer mainly bears compressive stress, and the lower layer mainly bears tensile stress. The shear stress at the edge of the loading area is approximately 4 times that at the centre of the loading area. Therefore, the edge of the wheel is a weak stress area and is prone to shear failure, and it is recommended to promote the shear resistance of the upper layer.
- (3)
- The rolling load considers the rolling friction force, applying horizontal force to the road, which can better reflect the rolling action of an actual wheel. The stress in the pavement structure increased and then gradually returned to its original stress before and after the vehicle travelled along the road. The direction of shear stress changes before and after the load passes through. The upper layer bears compressive stress, and the lower layer bears alternating tension and compression stress. It is suggested to improve the shear fatigue resistance of the upper layer and ensure the tensile fatigue resistance of the lower layer.
- (4)
- The stress response trend of the bridge deck pavement under a vehicle road coupling load and a rolling load is basically the same. However, when introducing the road roughness, the stress response value changes dramatically, which causes a significant effect on the upper layer. Therefore, the adhesion between the aggregate and asphalt should be improved to prevent pavement particles peeling from the upper layer.
This research provides theoretical support to prevent the development of bridge deck pavement diseases and saves the life cycle cost of bridge deck pavements.
In the future, the influence of the external environment on the mechanical response of pavement materials will be considered, further studying the difference in mechanical response in different climates.
Author Contributions
Conceptualization, C.S.; methodology, Y.C.; software, Y.C.; validation, S.L. and T.F.; formal analysis, S.L.; investigation, Y.C.; resources, C.S.; data curation, Y.C.; writing—original draft preparation, Y.C.; writing—review and editing, Y.C.; visualization, C.S.; supervision, C.S.; project administration, C.S.; funding acquisition, C.S. All authors have read and agreed to the published version of the manuscript.
Funding
This research was funded by the National Natural Science Foundation of China (Grant Nos. 11972237,12072205,11872555) and Project of Hebei Provincial Department of Transportation (Grant Nos. JD-202006, JD-202007, JX-202010).
Institutional Review Board Statement
Not applicable.
Informed Consent Statement
Not applicable.
Data Availability Statement
Not applicable.
Conflicts of Interest
The authors declare no conflict of interest.
References
- Lee, I.K.; Kim, W.; Kang, H.T.; Seo, J.W. Analysis and Prediction of Highway Bridge Deck Slab Deterioration. J. Korea Inst. Struct. Maint. Insp. 2015, 19, 68–75. [Google Scholar] [CrossRef]
- Huang, W. Integrated Design Procedure for Epoxy Asphalt Concrete–Based Wearing Surface on Long-Span Orthotropic Steel Deck Bridges. J. Mater. Civ. Eng. 2015, 28, 04015189. [Google Scholar] [CrossRef]
- Wang, L.B.; Hou, Y.; Zhang, L.; Liu, G.J. A combined static-and-dynamics mechanics analysis on the bridge deck pavement. J. Clean. Prod. Sci. 2017, 166, 209–220. [Google Scholar] [CrossRef]
- Wang, L.; Kang, X.; Jiang, P. Vibration analysis of a multi-span continuous bridge subject to complex traffic loading and vehicle dynamic interaction. KSCE J. Civ. Eng. 2016, 20, 323–332. [Google Scholar] [CrossRef]
- Zhao, Y.; Fang, T.; Ni, F.; Cao, J. Mechanical response of thin layer asphalt mixture in bridge deck pavement. J. Transp. Eng. B-Pavements 2010, 10, 1–9. [Google Scholar]
- Si, C.; Su, X.; Cen, E. Comparative study on dynamic response of deck pavement of two kinds of box girder bridges under moving loads. Shock Vib. 2019, 2019, 6052745. [Google Scholar] [CrossRef]
- JTG D50-2017; Highway Asphalt Pavement Design Code. Ministry of Transport of the People’s Republic of China, People’s Communications Press: Beijing, China, 2017.
- Dong, Z.; Tan, Y.; Ou, J. Dynamic response analysis of asphalt pavement under three-directional nonuniform moving load. China Civ. Eng. J. 2013, 46, 122–130. [Google Scholar]
- Dong, Z.; Ni, F. Dynamic model and criteria indices of semi-rigid base asphalt pavement. Int. J. Pavement Eng. 2014, 15, 854–866. [Google Scholar] [CrossRef]
- Si, C.; Chen, E.; You, Z.; Yang, F. Dynamic response of temperature-seepage-stress coupling in asphalt pavement. Constr. Build Mater. 2019, 211, 824–836. [Google Scholar] [CrossRef]
- Gao, L.; Dan, H.; Li, L. Response Analysis of Asphalt Pavement under Dynamic Loadings: Loading Equivalence. Math. Probl. Eng. 2019, 2019, 7020298. [Google Scholar] [CrossRef]
- Gong, M.; Sun, Y.; Chen, J. Mechanical response analysis of asphalt pavement on curved concrete bridge deck using a mesostructure-based multi-scale method. Constr. Build Mater. 2021, 285, 122858. [Google Scholar] [CrossRef]
- Ye, Z.; Miao, Y.; Zhang, W.; Wang, L. Effects of random non-uniform load on asphalt pavement dynamic response. Int. J. Pavement Res. Technol. 2020, 14, 299–308. [Google Scholar] [CrossRef]
- Mejías-Santiago, M.; Doyle, J.D.; Rushing, J.F. Accelerated Pavement Testing of Warm-Mix Asphalt for Heavy-Traffic Airfields. Transport. Res. Rec. 2014, 2456, 11–20. [Google Scholar] [CrossRef]
- Tian, Y.; Lee, J.; Nantung, T.; Haddock, J. Development of a mid-depth profile monitoring system for accelerated pavement testing. Constr. Build Mater. 2017, 140, 1–9. [Google Scholar] [CrossRef]
- Liu, Z.; Gu, X.; Ren, H.; Zhou, Z.; Wang, X.; Tang, S. Analysis of the Dynamic Responses of Asphalt Pavement Based on Full-Scale Accelerated Testing and Finite Element Simulation. Constr. Build Mater. 2022, 325, 126429. [Google Scholar] [CrossRef]
- Rafiq, W.; Musarat, M.A.; Altaf, M.; Napiah, M.; Sutanto, M.H.; Alaloul, W.S.; Javed, M.F.; Mosavi, A. Life Cycle Cost Analysis Comparison of Hot Mix Asphalt and Reclaimed Asphalt Pavement: A Case Study. Sustainability 2021, 13, 4411. [Google Scholar] [CrossRef]
- Mahmound, E.; Masad, E.; Nazarian, S. Discrete element analysis of the influences of aggregate properties and internal structure on fracture in asphalt mixture. J. Mater. Civ. Eng. 2010, 22, 10–20. [Google Scholar] [CrossRef]
- Liu, W.; Gao, Y.; Huang, X. Effects of aggregate size and specimen scale on asphalt mixture cracking using a micromechanical simulation approach. J. Wuhan Univ. Technol. 2017, 32, 1503–1510. [Google Scholar] [CrossRef]
- Tao, M.; Zhang, D.; Zhang, Y.; Zhang, Y. Simulation of wheel tracking test for asphalt mixture using discrete element modelling. Road Mater. Pavement 2018, 2, 367–384. [Google Scholar]
- Zhou, X.; Chen, S.; Ge, D.; You, Z. Investigation of asphalt mixture internal structure consistency in accelerated discrete element models. Constr. Build Mater. 2020, 244, 118272. [Google Scholar] [CrossRef]
- JTG E20-2011; Test Code for Asphalt and Asphalt Mixture in Highway Engineering. Ministry of Transport of the People’s Republic of China, People’s Communications Publishing House: Beijing, China, 2011.
- Awan, H.H.; Hussain, A.; Javed, M.F.; Qiu, Y.; Alrowais, R.; Mohamed, A.M.; Fathi, D.; Alzahrani, A.M. Predicting Marshall Flow and Marshall Stability of Asphalt Pavements Using Multi Expression Programming. Buildings 2022, 12, 314. [Google Scholar] [CrossRef]
- JTG/T 3364-02-2019; Technical Specification for Design and Construction of Highway Steel Bridge Deck Pavement. Ministry of Transport of the People’s Republic of China, People’s Communications Press: Beijing, China, 2019.
- You, Z.; Buttlar, W. Discrete element modeling to predict the modulus of asphalt concrete mixtures. J. Mater. Civ. Eng. 2004, 16, 140–146. [Google Scholar] [CrossRef]
- Chen, E.; Zhang, X.; Wang, G. Rigid-flexible coupled dynamic response of steel–concrete bridges on expressways considering vehicle–road–bridge interaction. Adv. Struct. Eng. 2020, 23, 160–173. [Google Scholar] [CrossRef]
- Yan, Z.; Chen, E.; Wang, Z.; Si, C. Research on Mesoscopic Response of Asphalt Pavement Structure under Vibration Load. Shock Vib. 2019, 2019, 2620305. [Google Scholar] [CrossRef]
- Wang, Y.; Liu, R.; Sun, R.; Xu, Z. Macroscopic and mesoscopic correlation of granular materials based on rolling resistance linear contact model. Geotech. Mech. 2022, 4, 945–956+968. [Google Scholar] [CrossRef]
- Zhang, J.; Yang, S.; Li, S.; Lu, Y.; Ding, H. Influence of vehicle-road coupled vibration on tire adhesion based on nonlinear foundation. Appl. Math. Mech.-Engl. 2021, 42, 607–624. [Google Scholar] [CrossRef]
- Yan, Z.; Wang, Z.; Chen, E. Dynamic response analysis of asphalt pavement vehicle-road based on discrete element method. Chin. J. Highw. 2019, 32, 51–60+79. [Google Scholar]
Publisher’s Note: MDPI stays neutral with regard to jurisdictional claims in published maps and institutional affiliations. |
© 2022 by the authors. Licensee MDPI, Basel, Switzerland. This article is an open access article distributed under the terms and conditions of the Creative Commons Attribution (CC BY) license (https://creativecommons.org/licenses/by/4.0/).