Article

Research on the Thickness and Microstructure of Plate-like TiO2 by the Nanosheet-Seeding Growth Technique

1
Henan Key Laboratory of High Temperature Functional Ceramics, School of Materials Science and Engineering, Zhengzhou University, Zhengzhou 450001, China
2
Henan Institute of Product Quality Supervision and Inspection, Zhengzhou 450014, China
3
School of Ecology and Environment, Zhengzhou University, Zhengzhou 450001, China
*
Authors to whom correspondence should be addressed.
These authors contributed equally to this work.
Coatings 2022, 12(11), 1673; https://doi.org/10.3390/coatings12111673
Submission received: 13 September 2022 / Revised: 28 October 2022 / Accepted: 2 November 2022 / Published: 4 November 2022
(This article belongs to the Special Issue Advances in Low-Cost Energy Materials and Thin Films)

Abstract

:
The nanosheet-seeding growth (NSG) technique is an interesting synthesis method for preparing two-dimensional (2D) materials by employing ultrathin nanosheets as templates. In this work, the synthesis of 2D TiO2 nanoplates using Ti0.87O2 nanosheets via the NSG process is thoroughly studied to achieve a better understanding of this process. The influence of various synthesis conditions on the morphology and phase composition has been carefully examined. The study of synthesis time reveals that the TiO2 grows in the Stranski–Krastanov mode on the templates and the growth follows second-order kinetics. It is also found that the concentration of precursors and the synthesis time are the effective parameters in controlling the thickness of TiO2 nanoplates. The phase of the sample changes from anatase TiO2 to NH4TiOF3 and the morphology changes from flake to disk with the increase in the precursor concentration. The synthesis temperature has a large influence on the morphology and thickness of the sample but has little effect on the phase composition. However, the synthesis temperature changes the color of the sample, and a high temperature enlarges the light absorption range of the sample.

Graphical Abstract

1. Introduction

Two-dimensional (2D) materials have received tremendous attention due to their interesting physical, chemical, electronic and optical properties [1,2,3,4]. At present, all of the synthesis methods can be categorized into two categories: top-down and bottom-up methods. In the top-down strategy, nanosheets are exfoliated from their bulk layered crystals, either by chemical reaction or mechanical effect [5,6,7,8,9]. It is impossible to synthesize the 2D compounds without layered precursors by this method. The bottom-up strategy involves directly growing 2D materials starting from atoms, ions or molecules. It has no limitation on the prerequisite structure in contrast to the top-down method, but it is a great challenge to find a general synthetic route to obtain 2D materials with different compositions. Therefore, it is necessary to develop a new strategy to synthesize 2D materials.
The nanosheet-seeding growth (NSG) technique is a template growth method that combines the bottom-up and top-down strategies for the synthesis of 2D materials. Hua et al. synthesized graphene-like 2D-Al2O3 nanosheets by using graphene as seeds [10]. This method was used to synthesize 2D TiO2 anatase crystals as well, and the TiO2 anatase nanoplates can be tuned to expose the {001} or {100} facet by the selection of the proper nanosheet seeds, such as Ti0.87O2 and Ca2Nb3O10. The TiO2 anatase nanoplates seeding on Ti0.87O2 show high photocatalytic performance for water splitting [11,12]. However, controlling the morphology or microstructure of the nanoplates has not been studied, even though the morphology is one of the most important parameters that determine the performance of the material [13]. On the other hand, the preparation process of the NSG method needs to be completed in a liquid phase under stirring conditions in order to achieve well dispersion of the nanosheet template. The turbulence could have a huge impact on the prepared samples, but little work has been carried out in this respect. The above-mentioned issues are greatly dependent on the crystal growth behavior of materials. Thus, it is important to investigate the crystal growth behavior of materials on ultrathin nanosheets.
TiO2 is a promising photocatalytic material and has been widely studied. For example, artificial oxygen defects can be generated on its surface, which can improve the photocatalytic performance of TiO2. It is found that Ag-TiO2 nano-structured nanofibers have excellent structural and physical properties, which are suitable for efficient photocatalytic and antimicrobial applications [14,15]. Moreover, the influence of the poly(titanium oxide) structure has a significant effect on the relaxation behavior of organo-inorganic interpenetrating polymer network samples [16]. Ultrathin TiO2 flakes can fully optimize their crucial CO2 photo reduction processes by affording abundant catalytically active sites and increased two-dimensional conductivity, which could potentially help to relieve the increasing energy crisis and the worsening global climate [17]. In this paper, the synthesis of anatase TiO2 nanoplates via the NSG technique has been studied thoroughly to understand the crystal growth of TiO2 on ultrathin nanosheets. The crystal growth of TiO2 was investigated by varying the synthesis conditions, including the precursor concentration, the synthesis temperature, the synthesis time and the stirring rates (turbulence), and the morphology and microstructure change were also discussed.

2. Experiment

2.1. Preparation of Ti0.87O2 Nanosheets

Ti0.87O2 nanosheets were prepared by the exfoliation of the layered titanate K0.8Li0.27Ti1.73O4 (KLTO) [18,19,20]. The first step is to prepare layered KLTO by high-temperature solid-phase sintering. The raw materials of Li2CO3 (Macklin, 99%, Shanghai, China), K2CO3 (Macklin, 99.5%) and TiO2 (Macklin, 99%), with a molar ratio of 0.8: 0.27: 3.46, are mixed and calcined at 800 °C. After 30 min, the mixture was naturally cooled to room temperature, and the pre-fired mixture was taken out and ground in a mortar. Then, the mixture was calcined at 1200 °C for 24 h, and KLTO crystals were obtained after natural cooling. In the second step, KLTO crystals were further processed in HCl solution to prepare H1.07Ti1.73O4 (HTO) crystals. Each gram of KLTO was treated with 100 mL of 1 mol/L HCl solution. The acidic solution was refreshed every day. After 3 days of the treatment, the powder was washed with a large amount of deionized water, filtered and naturally dried, and then the HTO powder was obtained. In the third step, 0.1 g of HTO powder was mixed with water and TBAOH, with a molar ratio of TBAOH/H+ of 4/1, in a total volume of 20 mL. After stirring for 7 days, the Ti0.87O2 nanosheet suspension was obtained [21,22]. The nominal concentration of the Ti0.87O2 nanosheet suspension is 5 g/L.

2.2. Preparation of Anatase TiO2 Nanoplates

Anatase TiO2 nanoplates were synthesized by the nanosheet-seeding growth of TiO2 on the Ti0.87O2 nanosheets, as described by the previous study [11,12]. Briefly, (NH4)2TiF6 (Macklin, 98%) and H3BO3 (Macklin, 99.5%) were used as precursors, and they were dissolved in 200 mL deionized water while vigorously stirring. The molar ratio of (NH4)2TiF6/H3BO3 was ½, and the (NH4)2TiF6 concentration was 0.05 M (or 0.025 M, 0.1 M, 0.15 M, 0.2 M and 0.3 M). After mixing the precursors for 1 min, 2.4 mL Ti0.87O2 nanosheets were used as templates to prepare the nanoplates. The mixture had been stirred at 30 °C (or 10, 50, 70, 80, 90 and 100 °C) for 48 h (or 3, 6,12 and 24 h) to allow the TiO2 crystal to grow on the TO nanosheets. The stirring rate of the mixture was 900 rpm (or 300, 600, 1200 and 1500 rpm). The final products were filtered, washed and collected. The resulting powders were then annealed at 450 °C for 4 h in air.

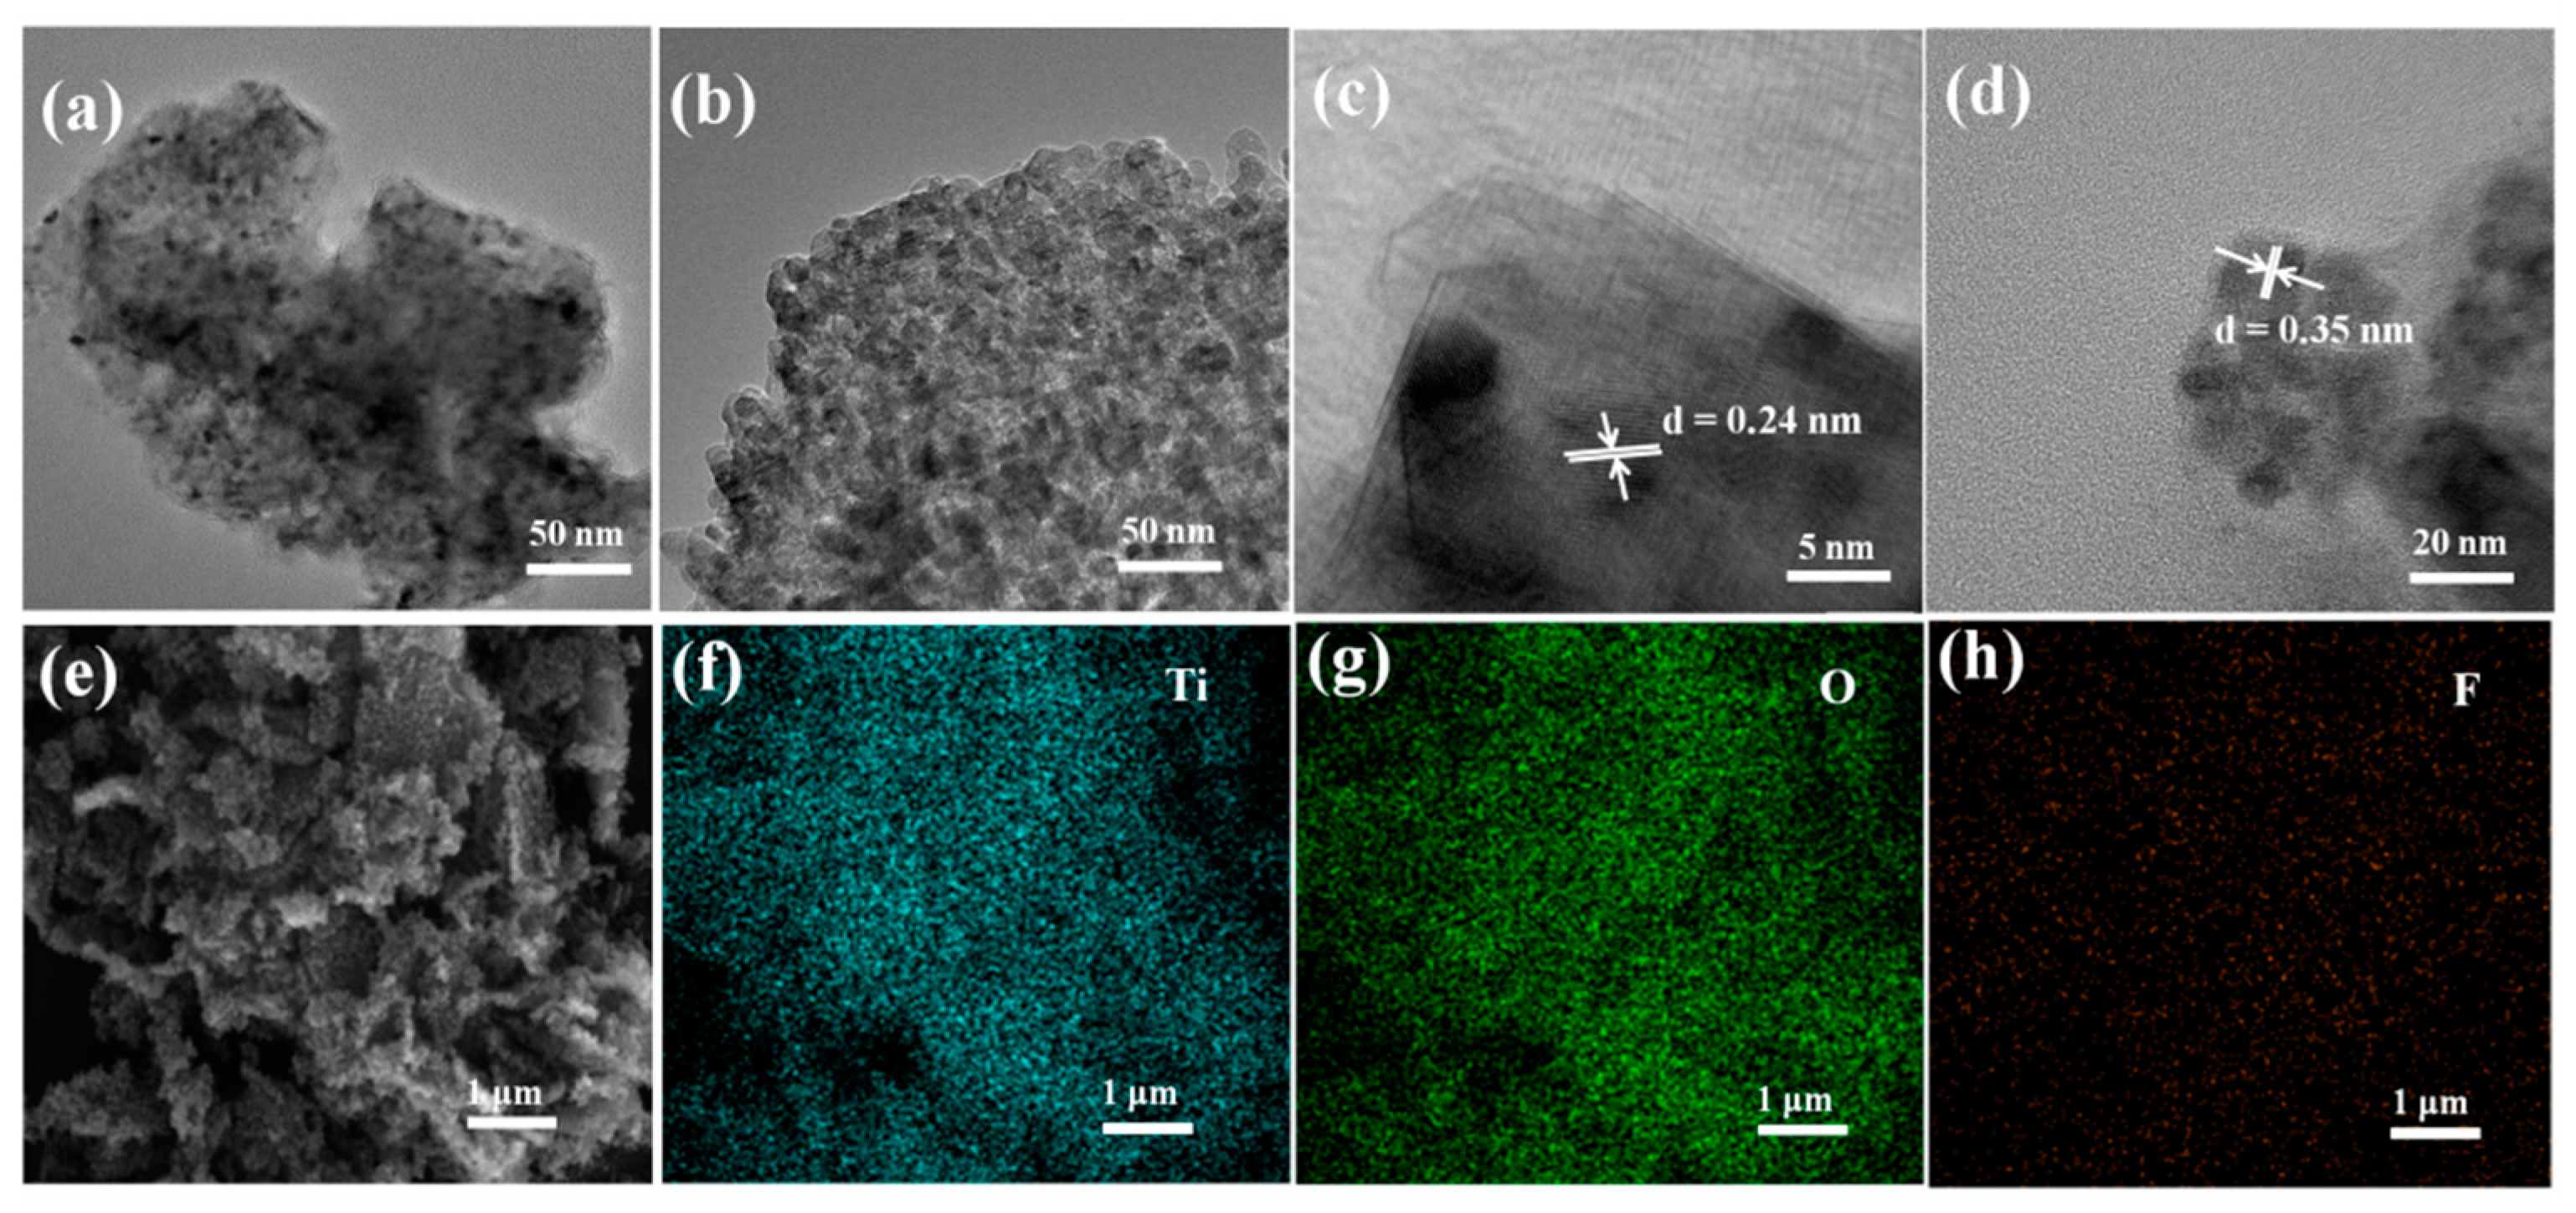
2.3. Characterization

The X-ray diffraction (XRD) data of the samples were acquired on a Philips X’pert diffractometer with CuKα radiation (λ = 1.5418 Å). Scanning Electron Microscopy (SEM, ZEISS MERLIN compact, Oberkochen, Germany) was used to acquire information on the morphology, and the image software (version 2015) was used to measure the layer thickness. Each thickness datum was obtained from at least 10 different nanoplates. Transmission Electron Microscopy (TEM) was performed on a JEOL JEM-2100 at 200 kV (Tokyo, Japan), with the sample supported on a copper microgrid. UV-Vis diffuse reflectance spectra (UV-Vis DRS) were recorded with a Shimadzu (Tokyo, Japan) UV-3600 UV-Vis spectrophotometer in transmission mode within a 200–800 nm range.

3. Results and Discussion

By using the NSG technique, it is facile to obtain plate-like particles under various conditions, and the particles show similar morphological and element features. As shown in Figure 1a,b, the samples are a sheet structure and are covered with particulate matter. The lattice spacing of 0.24 nm and 0.35 nm in Figure 1c,d corresponds to the (103) and (101) planes of anatase type TiO2, respectively, evidencing the formation of anatase TiO2.The EDS analysis shows that all the samples consist of Ti, O and F elements, as shown in Figure 1e–h. Obviously, the contents of Ti and O distribute uniformly. In addition, the F content in all the samples under various conditions is ~1.1 mass%, which is due to the residual element from the precursor solution [23,24].

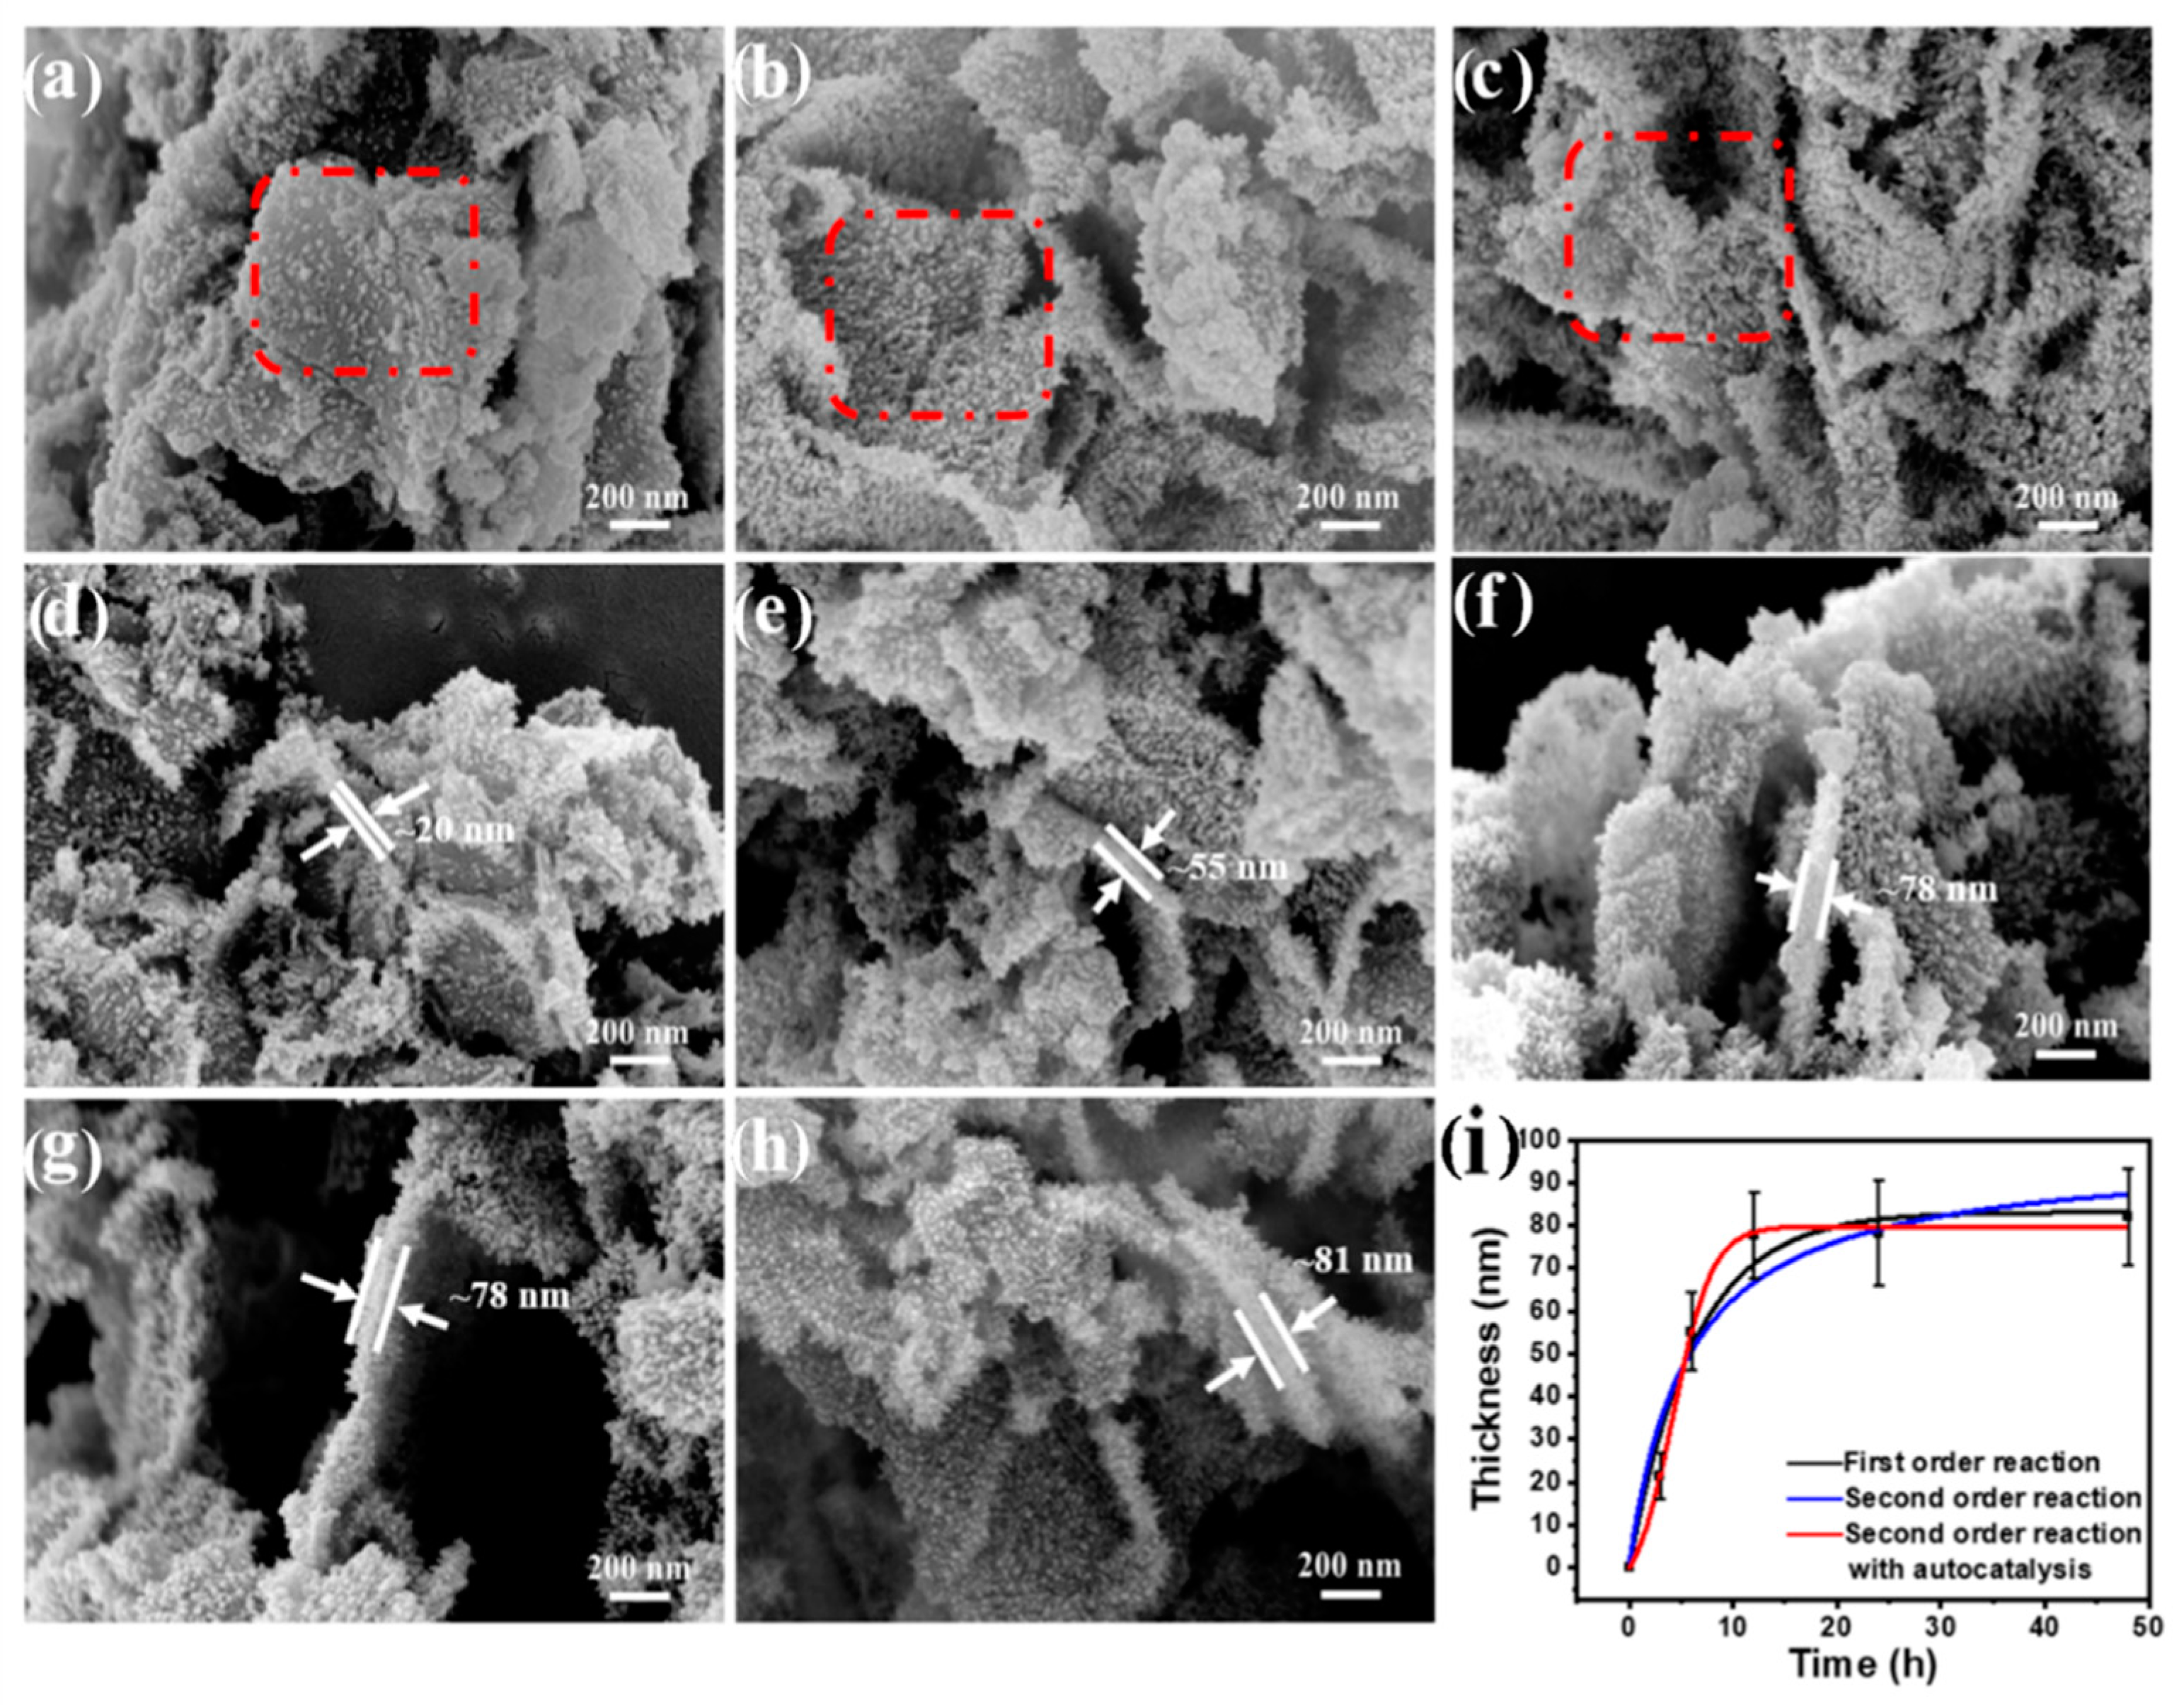
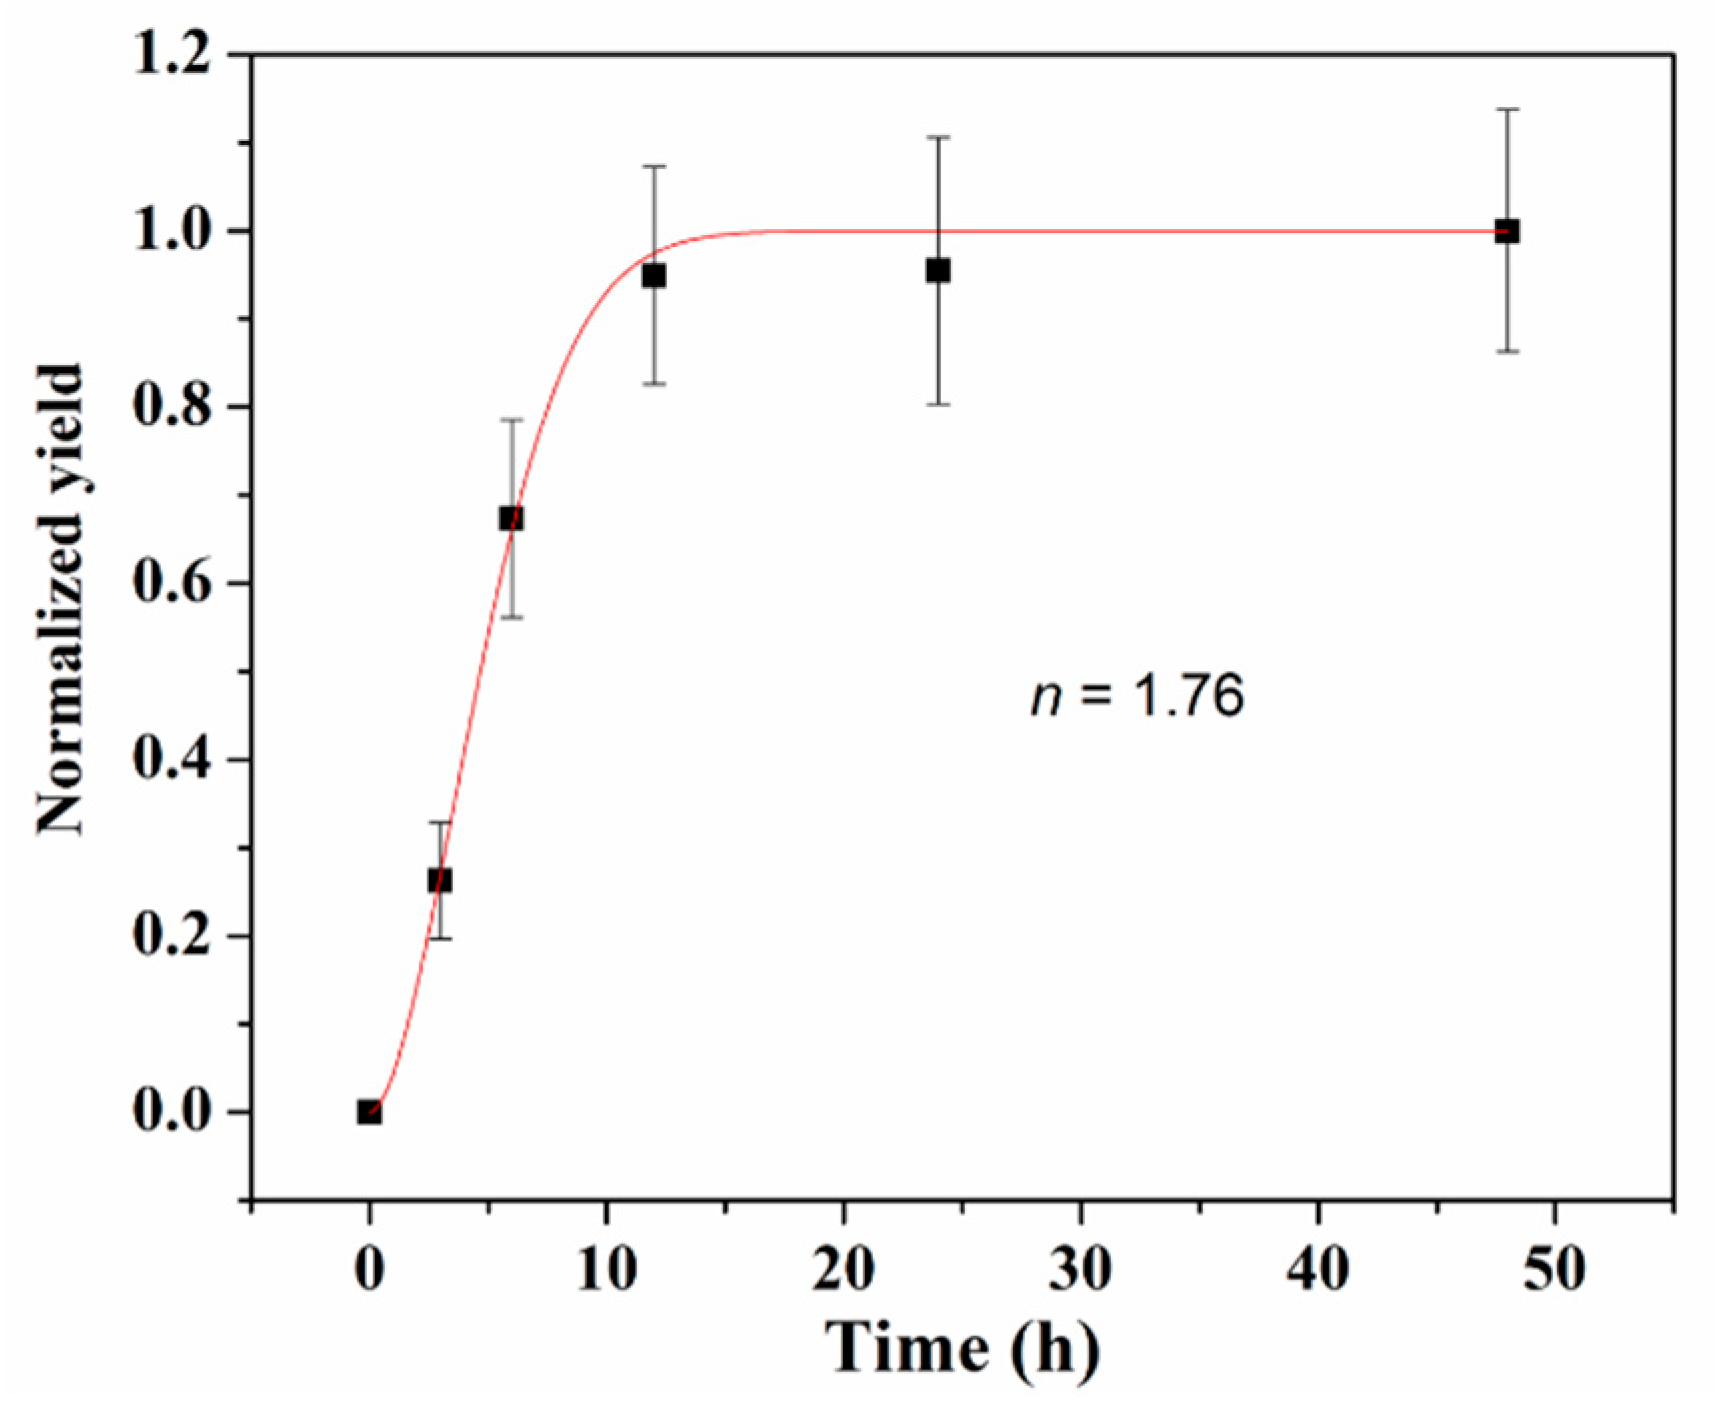
3.1. The Effect of Synthesis Time

The effect of synthesis time on the formation of crystalline Ti0.87O2 nanoplates was studied at 30 °C with the (NH4)2TiF6 concentration of 0.05 M. The XRD patterns of Ti0.87O2 nanoplates obtained at different synthesis times (Figure S1) illustrate that all samples are anatase TiO2 (JCPDS 21-1272). In addition, all the samples have sharp peaks, indicating the good crystallinity of the samples. The SEM images of the Ti0.87O2 nanoplates at various synthesis times are shown in Figure 2. It can be clearly seen that the morphology of all the samples is sheet-like. However, the morphology changes with time. When the synthesis time was 3 h, the deposition was observed on the template as island-like (Figure 2a), and its thickness reached 20 nm, much thicker than the original nanosheets (Figure 2d). After 6 h, the surface of the prepared sample is almost completely covered with needle-like particles (Figure 2b), and the thickness was 55 nm (Figure 2e). After 12 h, the surface feature and thickness of the sample hardly change (Figure 2c,f–h). By fitting the thickness with the different kinetic modes, as presented in Table 1, it is found that the TiO2 growth follows the second-order kinetics (with autocatalysis), as shown in Figure 2i. The fitting to this kinetics yields a reaction rate of 1.68 × 10⁻⁶ s−1.
The XRD patterns shown in Figure S1 show all the samples with a good crystallinity. It can be calculated by the Scherrer formula that the crystallite sizes with different synthesis times are 11.8 nm, 11.5 nm, 12.6 nm, 12.7 nm and 13.4 nm, respectively. The crystallite size increases slightly with the change in synthesis time. We employed the Johnson–Mehl-Avrami–Kolmogorov (JMAK) model to obtain the details of the crystal growth, and the fitting shown in Figure 3 yields an Avrami kinetic exponent n of 1.76. The Avrami kinetic exponent is a decimal between 1 and 2, suggesting that the crystallization process on nanosheets is a combination of one-dimensional and two-dimensional growth. In order to visualize the crystal growth of TiO2 on nanosheets, the deposition was also conducted on Langmuir–Blodgett fabricated nanosheet thin films, and the surface configuration was studied by AFM. The AFM results (Figure S2) show that the thin film becomes thicker and thicker (Figure S2a–h), and the surface is smooth at the initial stage of the deposition (roughness: 0.17 nm at 2 h) and becomes rougher and rougher with time (Figure S2i–l). So, it is concluded that the growth of TiO2 on the Ti0.87O2 nanosheet follows the Stranski–Krastanov growth mode [25,26,27].

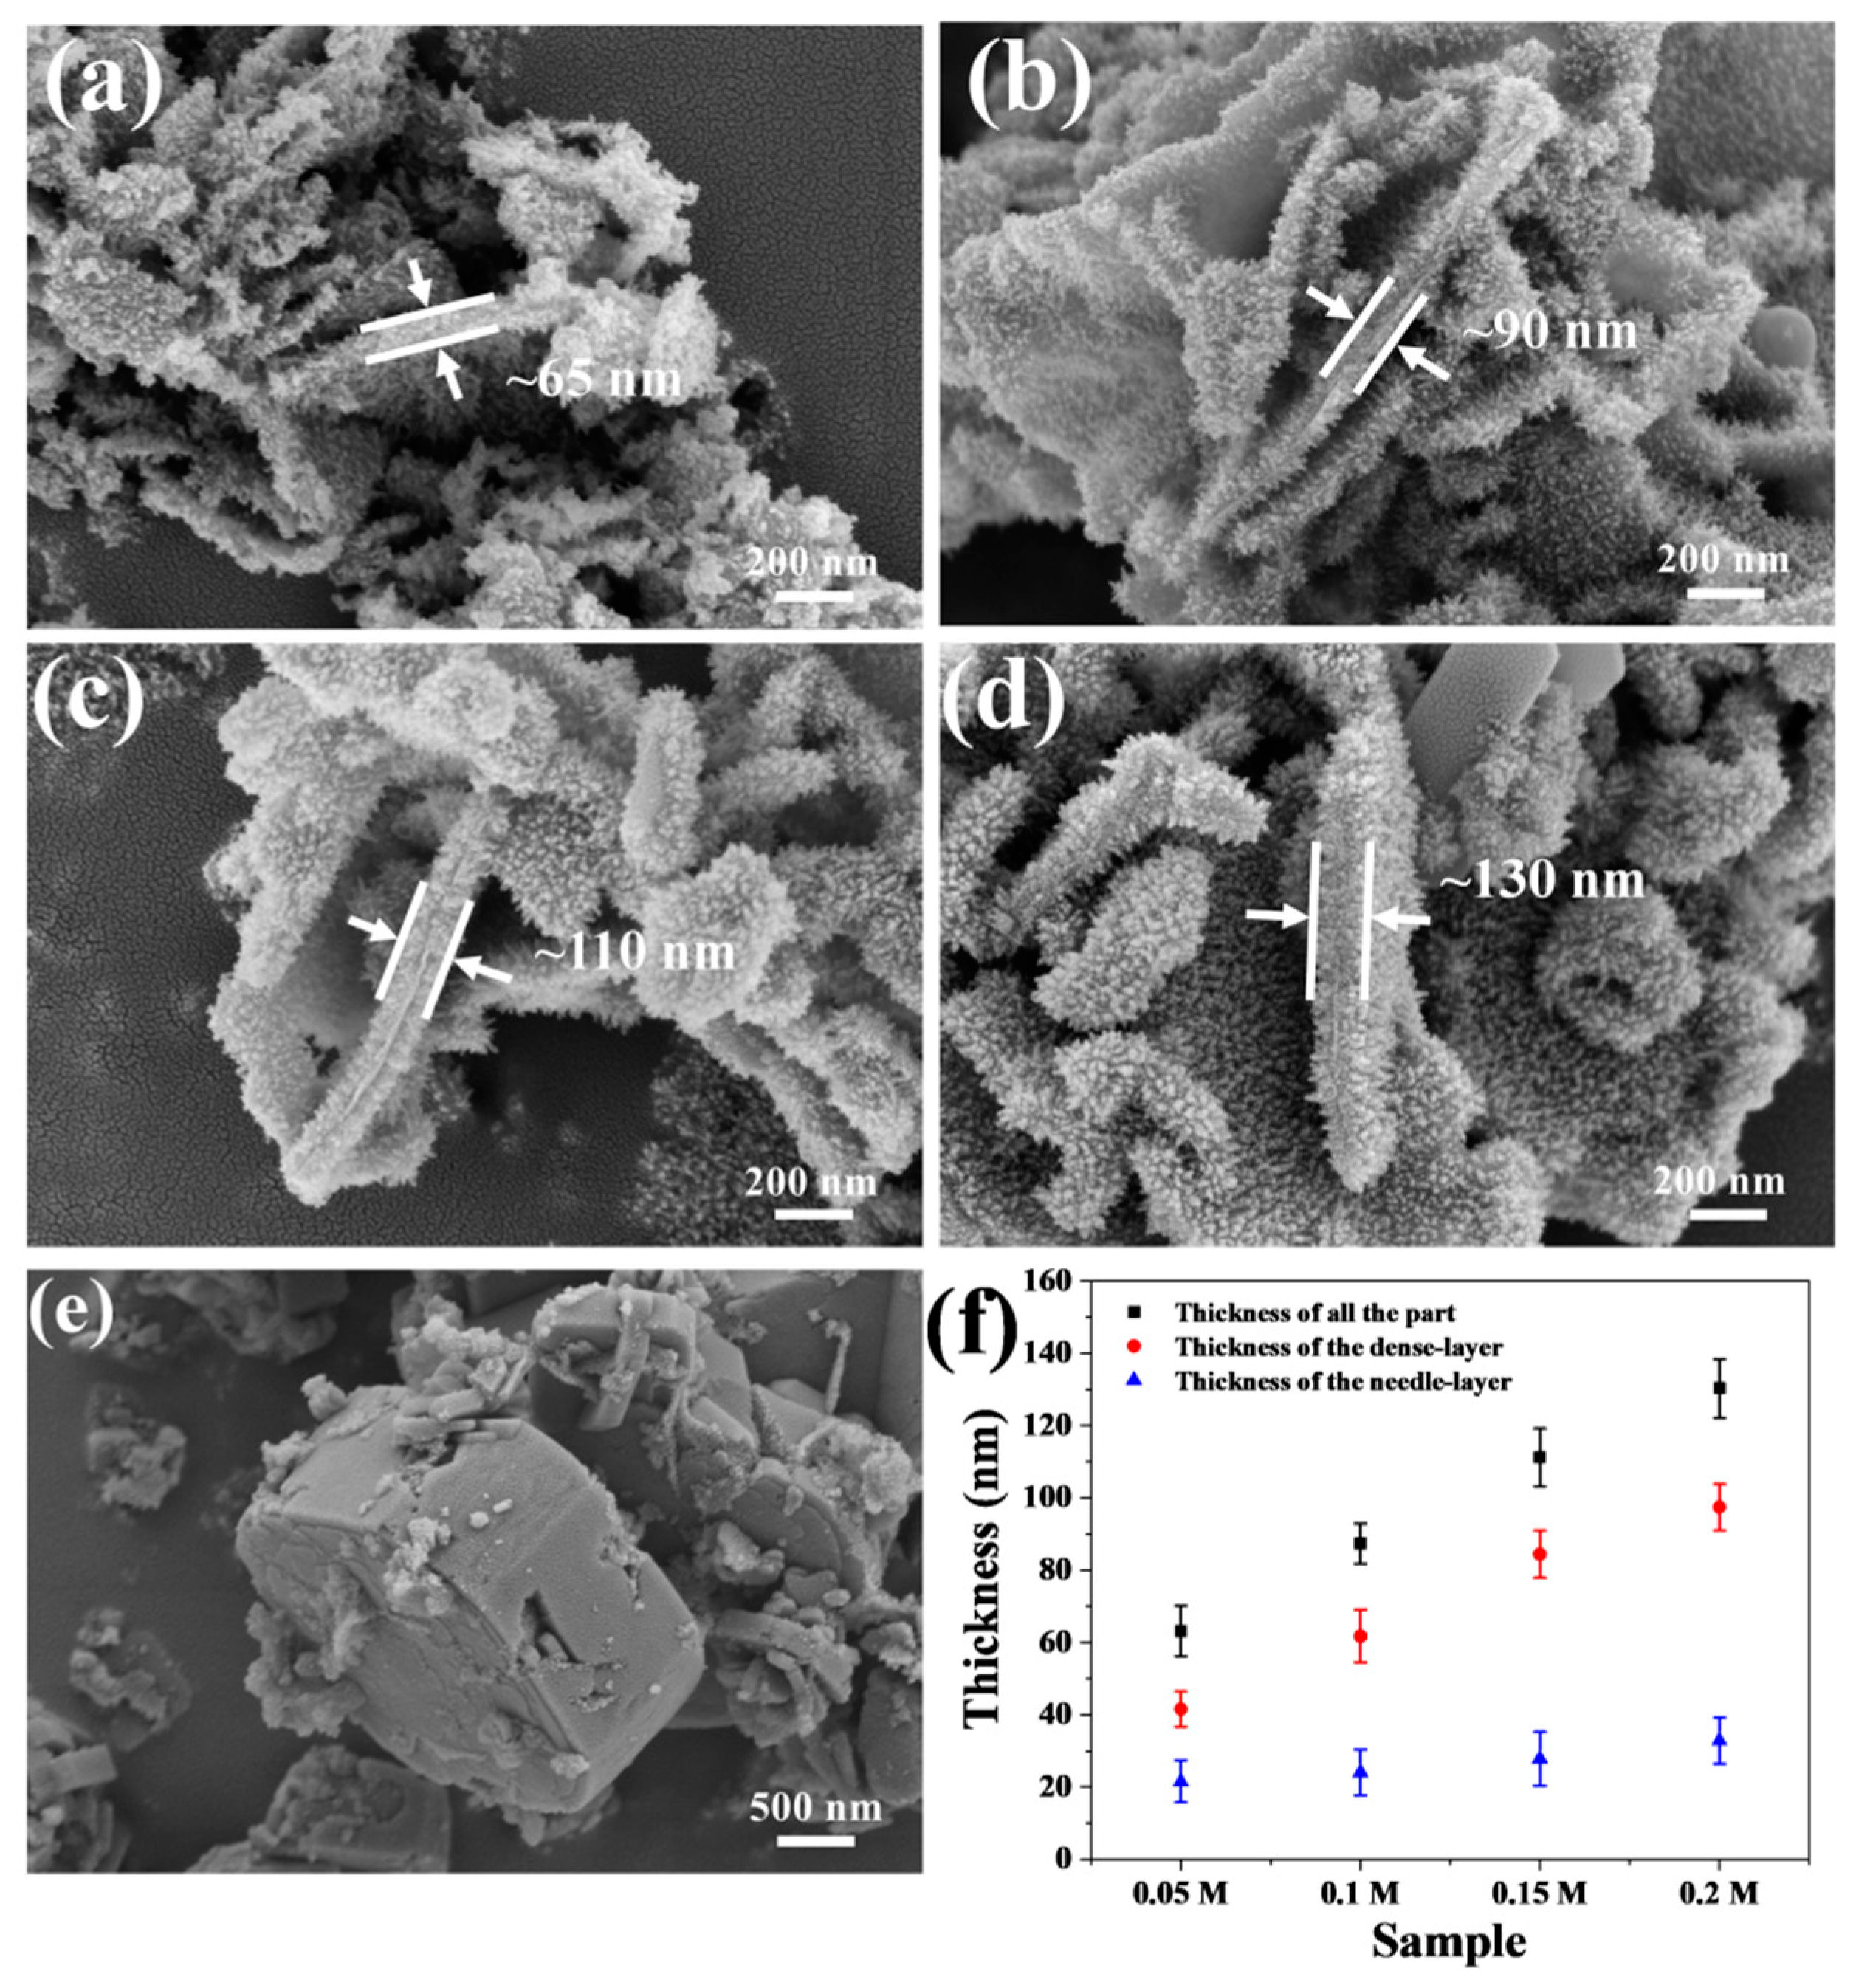
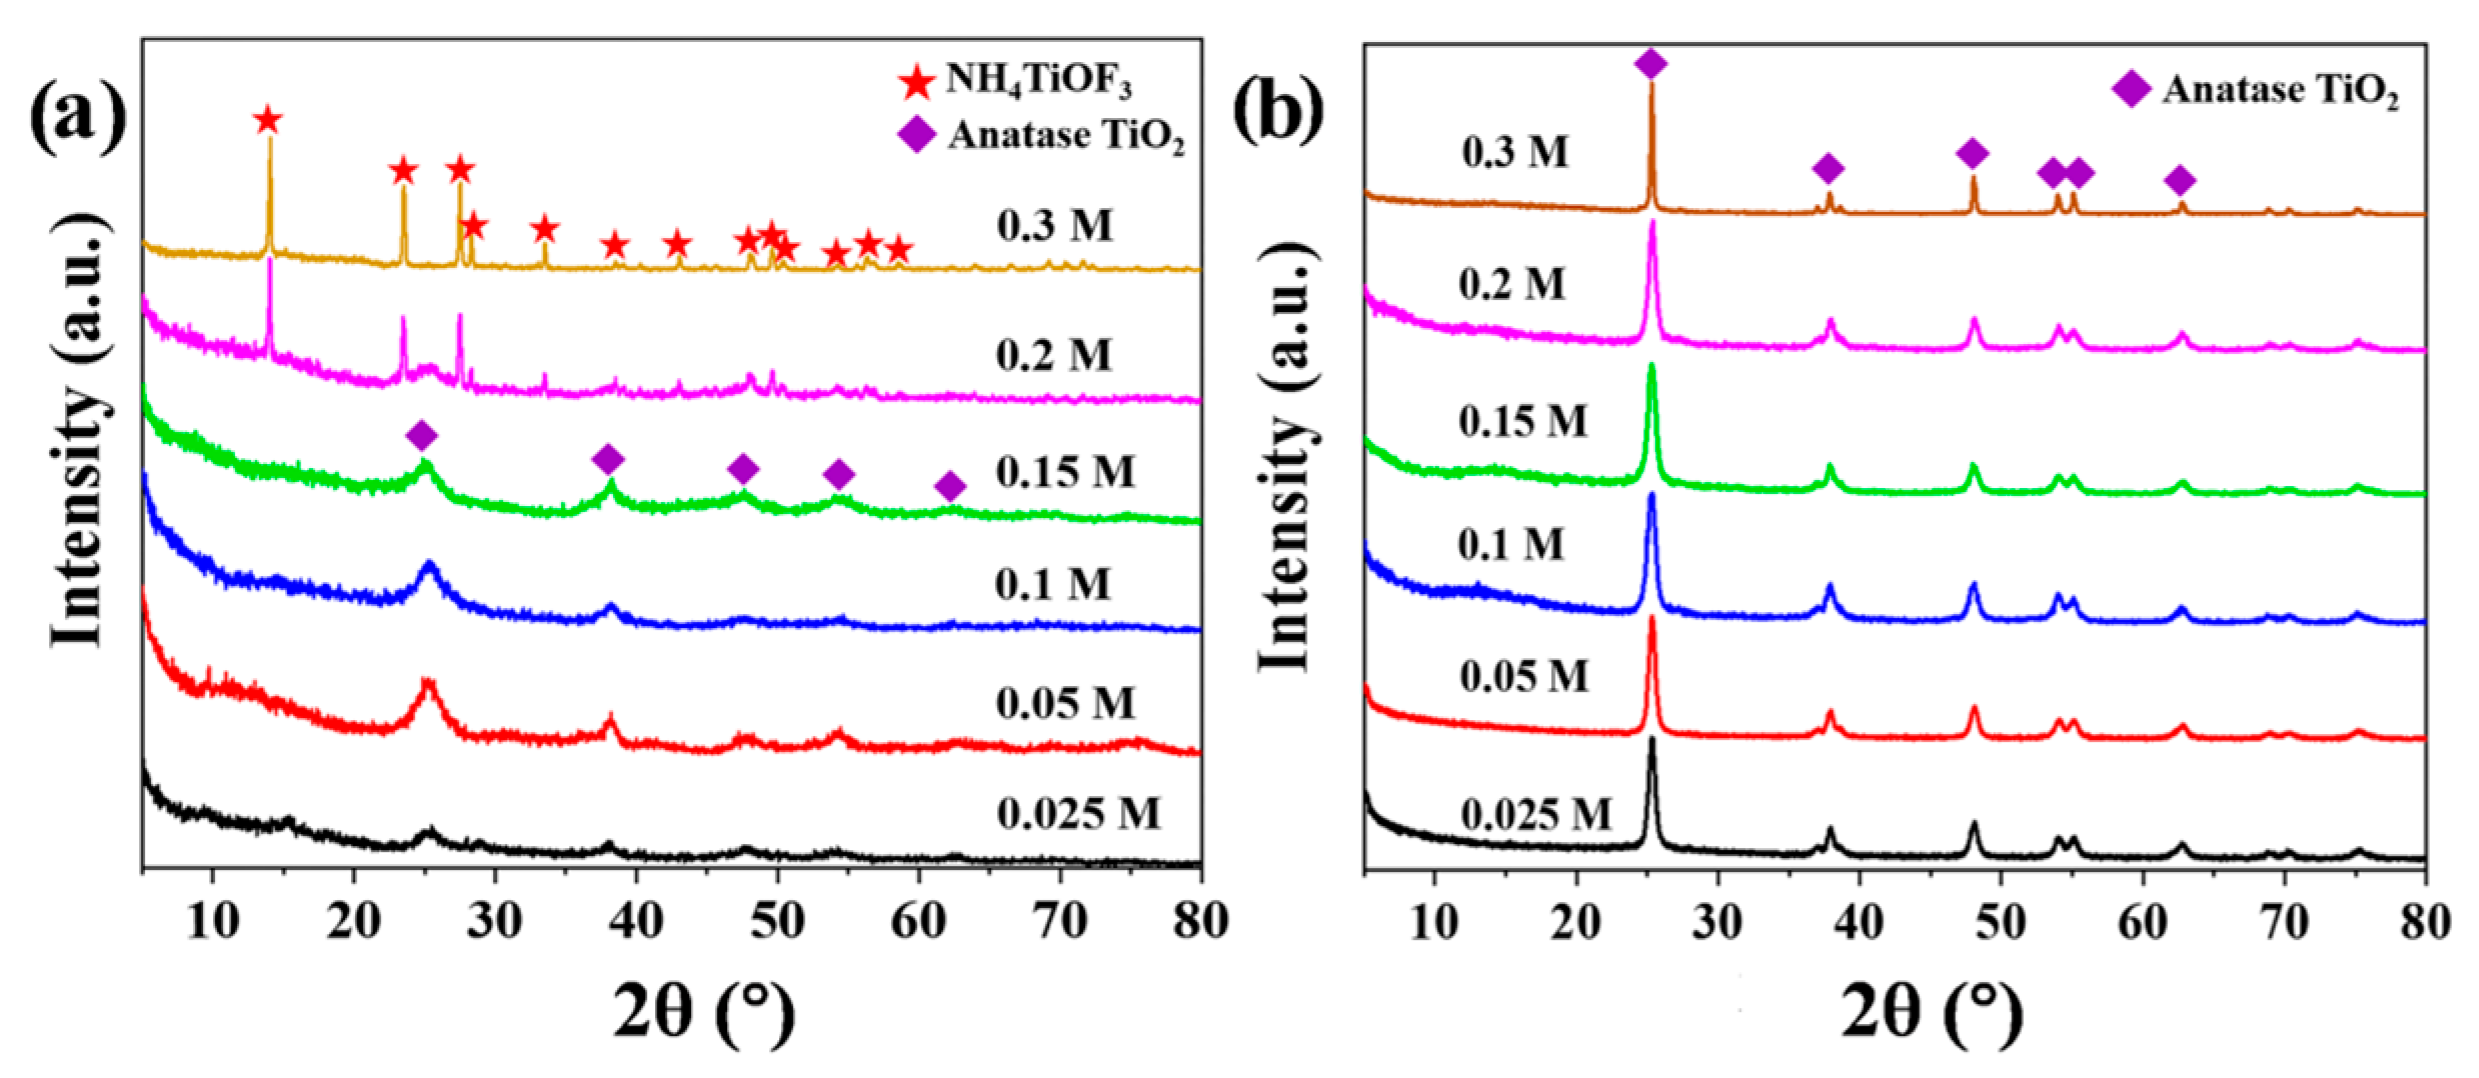
3.2. The Influence of (NH4)2TiF6 Concentration

The SEM images of the samples prepared with different (NH4)2TiF6 concentrations from 0.025 M to 0.3 M are shown in Figure 4. When the concentration of (NH4)2TiF6 is 0.025 M, the prepared sample stacks severely due to the small thickness (Figure S3a). When the concentration of (NH4)2TiF6 is 0.05 M and up to 0.2 M, all the samples demonstrate a sheet-like structure, and the nanoplates are covered by vertically standing needle-like crystals (Figure S3b–e). The surface feature of the samples is consistent with our previous results [11]. It is noted that the disc-like structure was also observed in the sample with the (NH4)2TiF6 concentration of 0.2 M. On the other hand, the thickness of the sample increases as the concentration of (NH4)2TiF6 increases. A statistical study shows that the thickness of the nanoplates obtained is 65–130 nm (Figure 4f). In detail, the nanoplates are composed of a dense layer and a needle-like layer. The thicknesses of the dense layers of different samples are about 41 nm, 65 nm, 84 nm and 97 nm, respectively. In contrast to the dense layer, the thickness of the needle-like layer does not change significantly as the precursor concentration increases, and its range is 20–33 nm (Figure 4f). So, the overall thickness is mainly attributed to the increased dense layer. This feature reflects that the crystal growth of TiO2 on nanosheets follows the Stranski–Krastanov growth mode, which is consistent with the previous discussion. When the concentration of (NH4)2TiF6 increases further to 0.3 M, the morphology of the sample becomes a disc-like structure (Figure S3e). After annealing, the morphology of the sample changes from a disc-like structure to a regular cubic structure (Figure S3f).
Figure 5 shows the XRD patterns of the samples before and after calcination at 450 °C. When the concentration of (NH4)2TiF6 is less than 0.2 M, the prepared sample is anatase TiO2 (JCPDS 21-1272), as shown in Figure 5a. However, when the concentration of (NH4)2TiF6 is 0.2 M, the phase of the prepared sample is TiO2 and NH4TiOF3. As the concentration of (NH4)2TiF6 further increases to 0.3 M, the phase of the prepared sample is only NH4TiOF3. This phenomenon is also reported in a previous report [28]. However, all the annealed samples are anatase TiO2, and the prepared samples have good crystallinity (Figure 5b). When the concentration of NH4TiOF3 increases from 0.025 M to 0.3 M, after calcination, the crystallite sizes of TiO2 are 15.5 nm, 15.0 nm, 12.7 nm, 13.4 nm, 15.1 nm and 46.4 nm, respectively. The much larger crystallite size of the latter one can be explained by the disc-like structure, while the others are plate-like structures (Figure 4e).
The TiO2 deposition on the template can be described by the following processes: [29,30]
[TiF6]2− + nH2O ⇌ [TiF6−n(OH)n]2− + nHF
H3BO3 + 4HF ⇌ BF4 + H3O+ + 2H2O
[Ti(OH)6]2− →TiO2↓ + 2H2O + 2OH
Apparently, the addition of H3BO3 causes the consumption of non-coordinating F- ions in Equation (2), accelerates the hydrolysis reaction of [TiF6]2− to produce [Ti(OH)6]2− in Equation (1) and finally dehydrates [Ti(OH)6]2− to produce TiO2 in Equation (3). In the process of preparing TiO2 with (NH4)2TiF6 and H3BO3, NH4TiOF3 is also produced. The reaction equations can be described as follows [31]:
[TiF6]2− + 3H2O ⇌ [TiF3(OH)3]2− + 3HF
[TiF3(OH)3]2− + H+ + NH4+ ⇌ NH4TiOF3↓+3H2O
The hydrolysis of [TiF6]2− is a gradual process, as shown in Equations (1) and (2), and it cannot be hydrolyzed in one step to produce [Ti(OH)6]2−. In its hydrolysis process, [TiF3(OH)3]2− can be generated as an intermediate, as stated in Equation (4). When the concentration of (NH4)2TiF6 is high compared to the concentration of HBO3 in the solution, the hydrolysis of [TiF6]2− can produce more [TiF3(OH)3]2−, which consequently combines with NH4+ and H+ to form the NH4TiOF3 in the solution, as shown in Equation (5) [32,33,34].

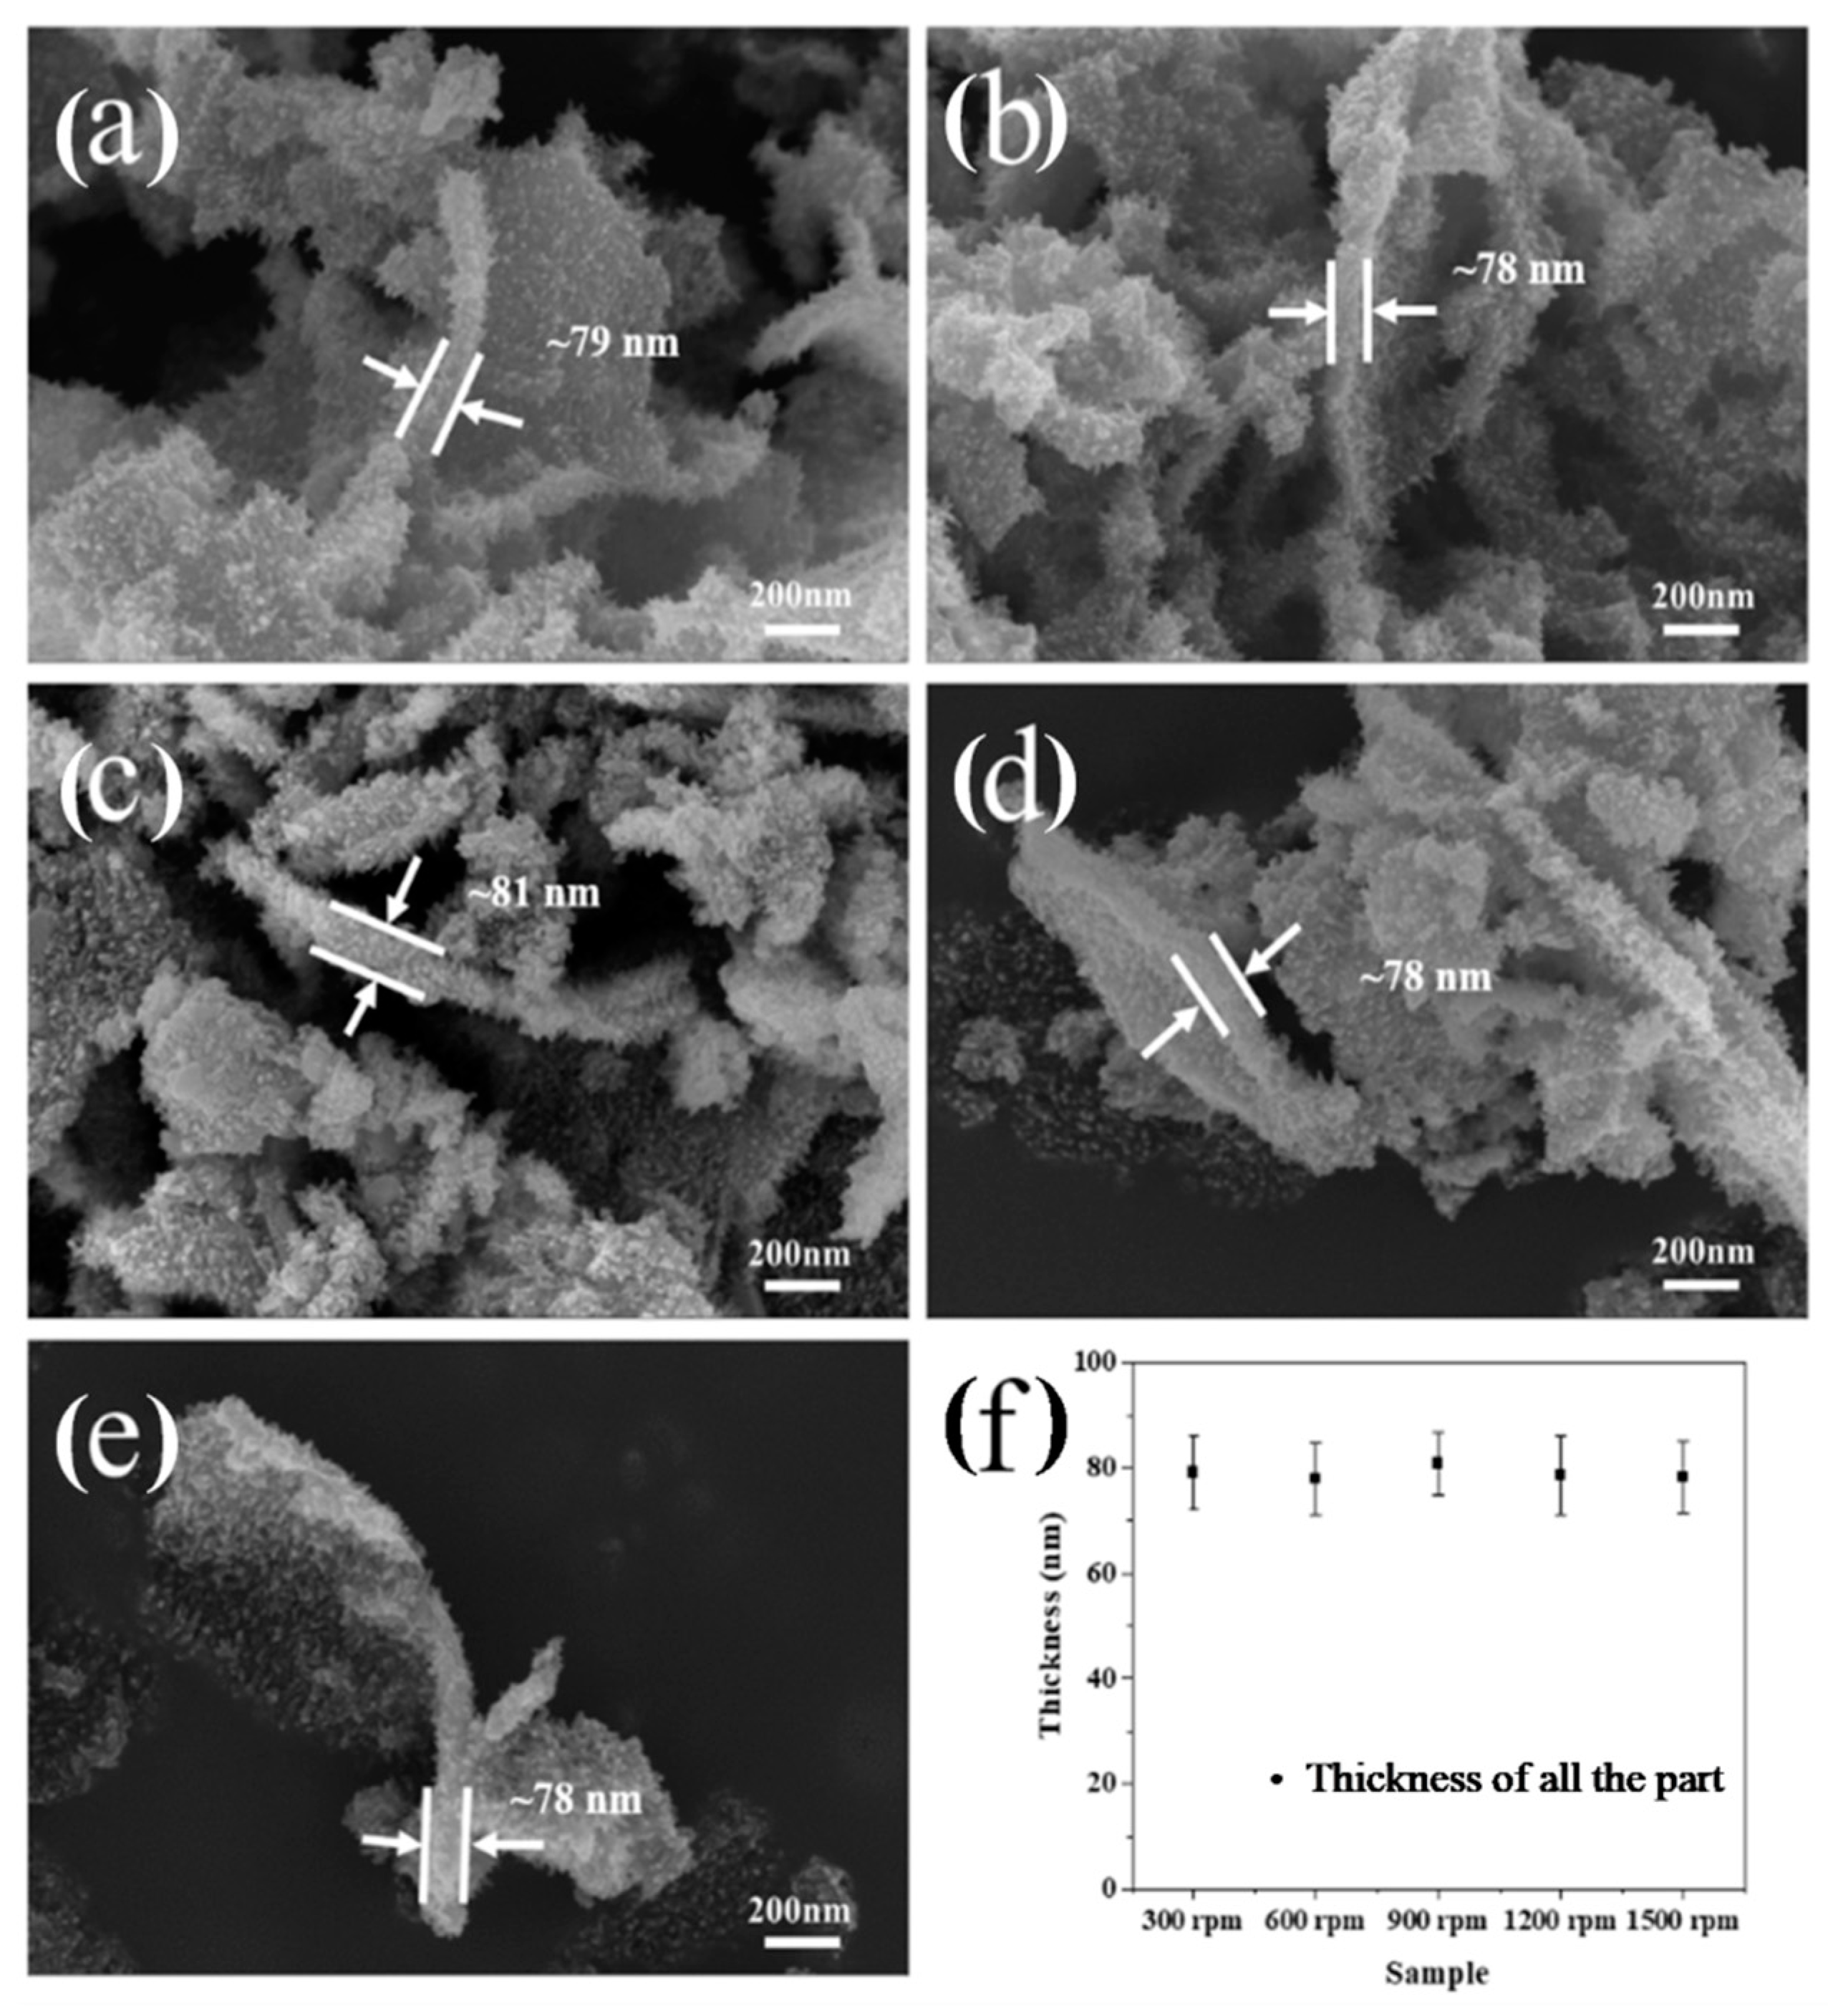
3.3. The Influence of Stirring Rate

The effect of the stirring rate on the material growth is also studied in this work. Different samples were prepared at stirring rates between 300 rpm and 1500 rpm, while keeping the rest of the process parameters the same. Figure 6 shows the SEM images of different samples, and the results reveal that different samples have a similar surface morphologies and that all the samples are sheet-like with needle-like crystals on the surface (Figure S4a–e). The statistical analysis of the thickness of the sample reveals that its thickness did not change with the change in the stirring rate, and the average thickness of different samples was about 80 nm, as shown in Figure 6f.
The XRD patterns of the samples shown in Figure S4f demonstrate that all the samples have the same peak positions, and the phase composition is identified to be anatase TiO2 (JCPDS 21-1272). The crystallite size is 13.8, 13.1, 14.0, 14.2 and 13.5 nm, respectively, and the stirring rate has little effect on the crystallite size. On the other hand, the peak intensities of all the samples are strong, suggesting a good crystallinity.

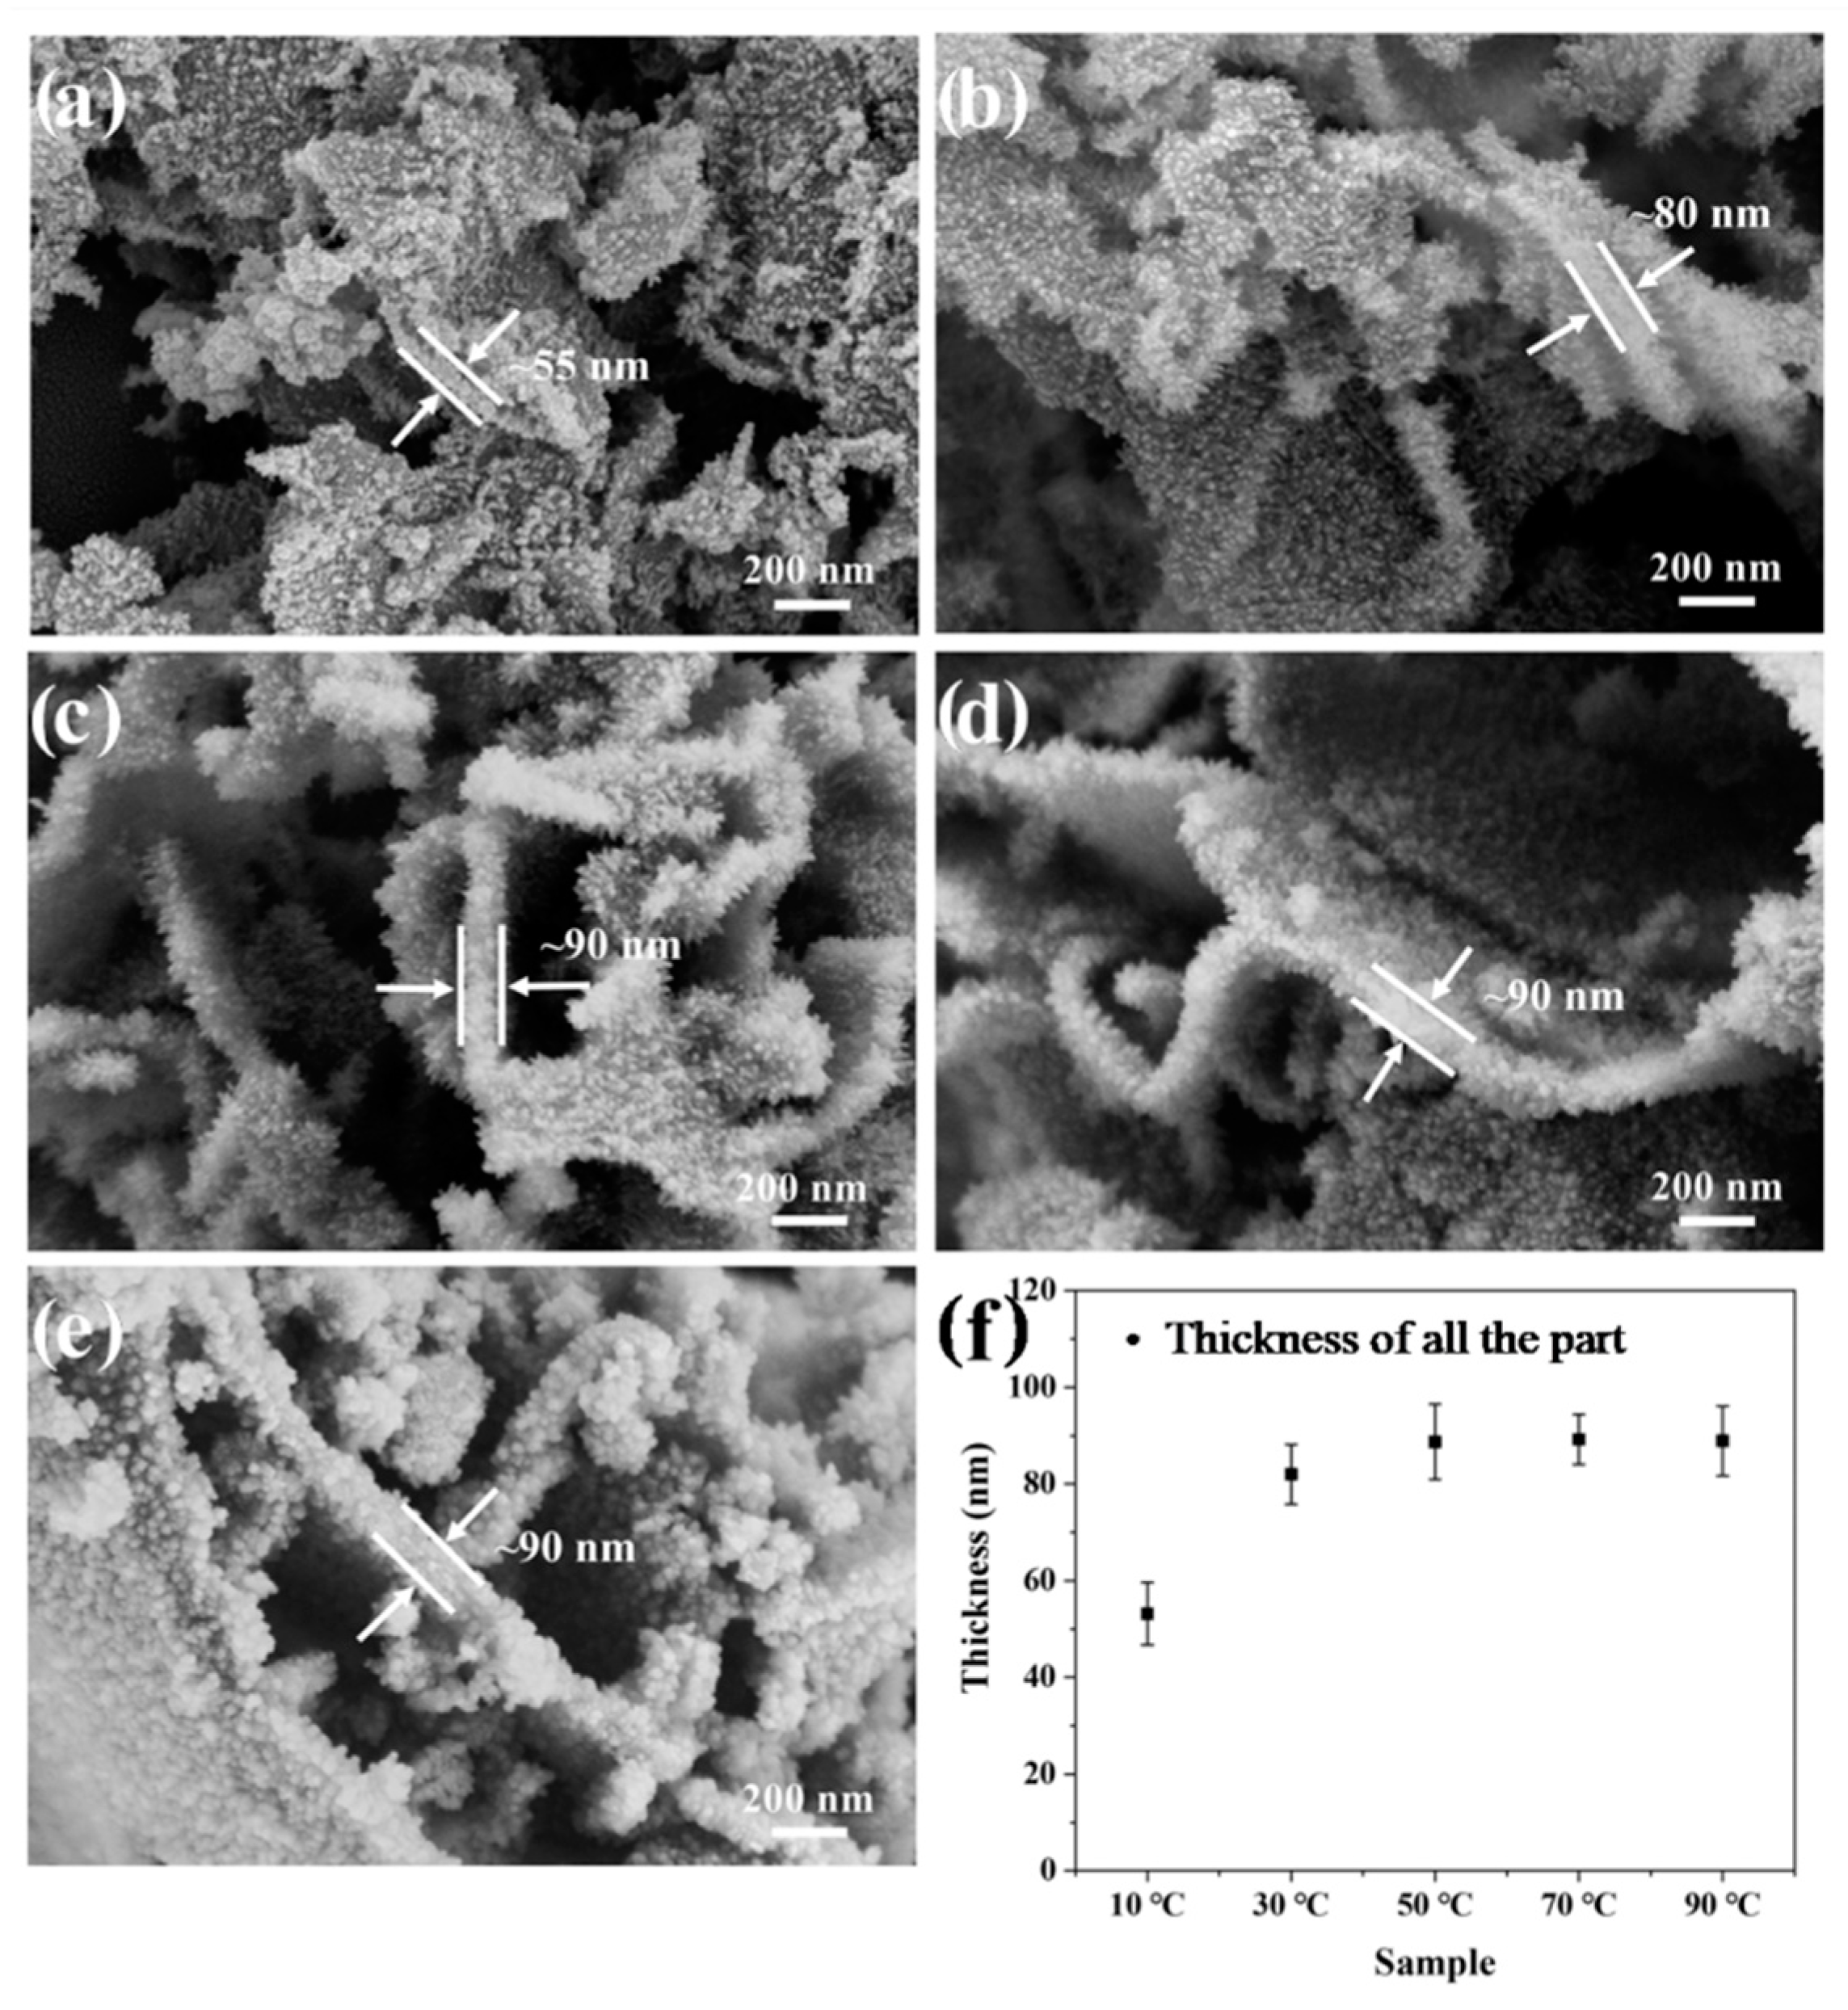
3.4. The Effect of the Synthesis Temperature

In order to investigate the effect of temperature on the morphology and thickness of the samples, the samples with synthesis temperatures from 10 °C to 100 °C were synthesized while other conditions were kept identical. The SEM images of the different samples are shown in Figure 7a–e, which demonstrate that all the samples have a sheet-like structure, and the surface is covered by spike-like crystals. As the synthesis temperature increases, the crystals on the surface of the sample become dense, and the morphology of the crystals changes from needle-like to hump-like. The statistics of the thickness of different samples, shown in Figure 7f, reveal that the thickness of the sample increases as the temperature increases, from ~55 nm at 10 °C to ~90 nm above 50 °C. Furthermore, the XRD patterns shown in Figure S5 evidence that all of the samples are anatase TiO2. The crystallite size is 11.5 nm, 13.4 nm, 15.3 nm, 16.7 nm, 18.1 nm, 17.3 nm and 17.2 nm, respectively. Before 70 °C, the peak intensity of the XRD patterns enhances with the increase in temperature, and the crystallite size is also increasing. When the synthesis temperature exceeds 70 °C, the crystallite size changes slightly.
Interestingly, the color of the prepared samples changed from white to light yellow as the synthesis temperature increased (Figure 8a). The UV–vis diffuse reflectance spectra of the samples, as shown in Figure 8b, demonstrate that the white samples show strong absorption in the UV region, and the optical absorption wavelength was consistent with that of TiO2. The light yellow samples show strong absorption in the UV region as well as extra absorption in the visible light region (400–600 nm). The absorption peaks at 450 nm and 700–800 nm are attributed to the existence of the oxygen vacancy and the reduced Ti3+ ions, respectively [35]. Obviously, simply increasing the synthesis temperature can enhance the absorption of the samples in the visible light region while keeping the phase composition unchanged as anatase TiO2 (Figure S5). This strategy may find applications in photocatalysis to address energy and environmental challenges through light-chemical conversion processes [36].

4. Conclusions

In summary, we thoroughly studied the fabrication of TiO2 nanoplates using Ti0.87O2 nanosheets via the NSG method. It is found that the concentration of the precursor and the synthesis time are the effective parameters in tuning the thickness of the obtained TiO2 nanoplates. The synthesis time does not change the phase composition, while, as the concentration of the precursor increases, the phase of the prepared sample changes from anatase TiO2 to NH4TiOF3, and the morphology of the sample will change from flake- to disc-shaped. In addition, it is found that the samples grow in the Stranski–Krastanov mode on the templates, and the growth follows second-order kinetics. Furthermore, the synthesis temperature has a great effect on the morphology and thickness of the sample but not on the phase composition of the sample. More importantly, the synthesis temperature can change the color of the sample and expand the light absorption range of the sample. However, the stirring rates have almost no effect on the morphology and composition of the sample.

Supplementary Materials

The following are available online at https://www.mdpi.com/article/10.3390/coatings12111673/s1, Figure S1: XRD of the samples with different synthesis time, 3 h, 6 h, 12 h, 24 h and 48h, Figure S2: AFM images of TiO2 growth on monolayer T0.87O2 nanosheet thin film, (a) 2 h, (b) 4 h, (c) 8h and (d) 16h, Figure S3: Typical SEM images of the samples, (a) 0.025 M, (b) 0.05 M, (c) 0.1 M, (d) 0.15 M and (e) 0.2 M; (f) SEM image of the sample after calcination at 0.3 M, Figure S4: SEM images of the samples with different stirring rates, (a) 300 rpm, (b) 600 rpm, (c) 900 rpm, (d) 1200 rpm and (e) 1500 rpm; (f) XRD patterns of the samples, Figure S5: XRD of the samples with different synthesis temperatures, 10 °C, 30 °C, 50 °C, 70 °C, 80 °C, 90 °C and 100 °C.

Author Contributions

Conceptualization, H.Y.; Data curation, Y.Z., H.L. and J.C.; Funding acquisition, H.Y.; Investigation, Y.Z., H.L. and J.C.; Methodology, H.Y. and B.W.; Resources, X.B. and D.Y.; Supervision, X.B., D.Y. and H.Y.; Visualization, Y.Z. and H.L.; Writing—original draft, Y.Z. and H.L.; Writing—review & editing, H.Y. and B.W. All authors have read and agreed to the published version of the manuscript.

Funding

This research was funded by the Young Top-notch Talent Program of Zhengzhou University (No. 125/32310189), the China Postdoctoral Science Foundation (No. 2020M672267) and the National Natural Science Foundation of China (NSFC) (Grant. No. 51902290).

Institutional Review Board Statement

Not applicable.

Informed Consent Statement

Not applicable.

Data Availability Statement

Not applicable.

Acknowledgments

The authors would like to thank Tingting Xu for the TEM measurements, and they also appreciate Shawn Zhang’s help with the language polishing.

Conflicts of Interest

The authors declare no conflict of interest.

References

  1. Tan, C.; Cao, X.; Wu, X.-J.; He, Q.; Yang, J.; Zhang, X.; Chen, J.; Zhao, W.; Han, S.; Nam, G.-H.; et al. Recent advances in ultrathin two-dimensional nanomaterials. Chem. Rev. 2017, 117, 6225–6331. [Google Scholar] [CrossRef] [PubMed]
  2. Zhuang, X.; Mai, Y.; Wu, D.; Zhang, F.; Feng, X. Two-dimensional soft nanomaterials: A fascinating world of materials. Adv. Mater. 2015, 27, 403–427. [Google Scholar] [CrossRef]
  3. Sun, Z.; Chang, H. Graphene and graphene-like two-dimensional materials in photodetection: Mechanisms and methodology. ACS Nano 2014, 8, 4133–4156. [Google Scholar] [CrossRef] [PubMed]
  4. Wang, B.; Zhou, A.; Liu, F.; Cao, J.; Wang, L.; Hu, Q. Carbon dioxide adsorption of two-dimensional carbide MXenes. J. Adv. Ceram. 2018, 7, 237–245. [Google Scholar] [CrossRef] [Green Version]
  5. Tian, W.; Yan, F.; Cai, C.; Wu, Z.; Zhang, C.; Yin, T.; Hu, L. Freeze-drying and hot-pressing strategy to embed two-dimensional Ti0.87O2 monolayers in commercial polypropylene films with enhanced dielectric properties. J. Adv. Ceram. 2021, 10, 368–376. [Google Scholar] [CrossRef]
  6. Novoselov, K.S.; Geim, A.K.; Morozov, S.V.; Jiang, D.; Zhang, Y.; Dubonos, S.V.; Grigorieva, I.V.; Firsov, A.A. Electric field effect in atomically thin carbon films. Science 2004, 306, 666–669. [Google Scholar] [CrossRef] [Green Version]
  7. Osada, M.; Sasaki, T. Nanosheet architectonics: A hierarchically structured assembly for tailored fusion materials. Polym. J. 2014, 47, 89–98. [Google Scholar] [CrossRef]
  8. Nicolosi, V.; Chhowalla, M.; Kanatzidis, M.G.; Stranol, M.S.; Coleman, J.N. Liquid exfoliation of layered materials. Science 2013, 340, 1226419. [Google Scholar] [CrossRef] [Green Version]
  9. Tian, Z.; Chen, K.; Sun, S.; Zhang, J.; Cui, W.; Xie, Z.; Liu, G. Crystalline boron nitride nanosheets by sonication-assisted hydrothermal exfoliation. J. Adv. Ceram. 2019, 8, 72–78. [Google Scholar] [CrossRef] [Green Version]
  10. Huang, Z.; Zhou, A.; Wu, J.; Chen, Y.; Lan, X.; Bai, H.; Li, L. Bottom-up preparation of ultrathin 2D aluminum oxide nanosheets by duplicating graphene oxide. Adv. Mater. 2016, 28, 1703–1708. [Google Scholar] [CrossRef]
  11. Yuan, H.; Han, K.; Dubbink, D.; Mul, G.; Ten Elshof, J.E. Modulating the external facets of functional nanocrystals enabled by two-dimensional oxide crystal templates. ACS Catal. 2017, 7, 6858–6863. [Google Scholar] [CrossRef] [PubMed]
  12. Liu, H.; Cui, J.; Bai, X.; Liu, R.; Yang, D.; Xu, T.; Shan, C.; Yuan, H. Suppressing photocarrier recombination in anatase TiO2 nanoplates via thickness optimization for enhanced photocatalytical H2 generation. Appl. Surf. Sci. 2021, 566, 150698. [Google Scholar] [CrossRef]
  13. Ding, Y.; Yang, I.S.; Li, Z.; Xia, X.; Lee, W.I.; Dai, S.; Bahnemann, D.W.; Pan, J.H. Nanoporous TiO2 spheres with tailored textural properties: Controllable synthesis, formation mechanism, and photochemical applications. Prog. Mater. Sci. 2020, 109, 100620. [Google Scholar] [CrossRef]
  14. Badmus, K.; Wewers, F.; Al-Abri, M.; Shahbaaz, M.; Petrik, L. Synthesis of oxygen deficient TiO2 for improved photocatalytic efficiency in solar radiation. Catalysts 2021, 11, 904. [Google Scholar] [CrossRef]
  15. Pascariu, P.; Cojocaru, C.; Airinei, A.; Olaru, N.; Rosca, I.; Koudoumas, E.; Suchea, M.P. Innovative Ag–TiO2 nanofibers with excellent photocatalytic and antibacterial actions. Catalysts 2021, 11, 1234. [Google Scholar] [CrossRef]
  16. Tsebriienko, T.; Popov, A.I. Effect of poly(titanium oxide) on the viscoelastic and thermophysical properties of interpenetrating polymer networks. Crystals 2021, 11, 794. [Google Scholar] [CrossRef]
  17. Qamar, S.; Lei, F.; Liang, L.; Gao, S.; Liu, K.; Sun, Y.; Ni, W.; Xie, Y. Ultrathin TiO2 flakes optimizing solar light driven CO2 reduction. Nano Energy 2016, 26, 692–698. [Google Scholar] [CrossRef]
  18. Nijland, M.; Kumar, S.; Lubbers, R.; Blank, D.H.A.; Rijnders, G.; Koster, G.; Ten Elshof, J.E. Local control over nucleation of epitaxial thin films by seed layers of inorganic nanosheets. ACS Appl. Mater. Interfaces 2014, 6, 2777. [Google Scholar] [CrossRef]
  19. Sasaki, T.; Kooli, F.; Iida, M.; Michiue, Y.; Takenouchi, S.; Yajima, Y.; Izumi, F.; Chakoumakos, B.C.; Watanabe, M. A mixed alkali metal titanate with the lepidocrocite-like layered structure. Preparation, crystal structure, protonic form, and acid−base intercalation properties. Chem. Mater. 1998, 10, 4123–4128. [Google Scholar] [CrossRef]
  20. Tanaka, T.; Ebina, Y.; Takada, K.; Kurashima, K.; Sasaki, T. Oversized titania nanosheet crystallites derived from flux-grown layered titanate single crystals. Chem. Mater. 2003, 15, 3564–3568. [Google Scholar] [CrossRef]
  21. Yuan, H.; Lubbers, R.; Besselink, R.; Nijland, M.; Ten Elshof, J.E. Improved langmuir-blodgett titanate films via in situ exfoliation study and optimization of deposition parameters. ACS Appl. Mater. Interfaces 2014, 6, 8567–8574. [Google Scholar] [CrossRef] [PubMed]
  22. Yuan, H.; Dubbink, D.; Besselink, R.; Ten Elshof, J.E. The rapid exfoliation and subsequent restacking of layered titanates driven by an acid-base reaction. Angew. Chem. Int. Ed. 2015, 54, 9239–9243. [Google Scholar] [CrossRef] [PubMed]
  23. Yu, J.; Yu, H.; Cheng, B.; Zhao, X.; Yu, J.; Ho, W. The effect of calcination temperature on the surface microstructure and photocatalytic activity of TiO2 thin films prepared by liquid phase deposition. J. Phys. Chem. B 2003, 107, 13871–13879. [Google Scholar] [CrossRef]
  24. Kishimoto, H.; Takahama, K.; Hashimoto, N.; Aoi, Y.; Deki, S. Photocatalytic activity of titanium oxide prepared by liquid phase deposition (LPD). J. Mater. Chem. 1998, 8, 2019–2024. [Google Scholar] [CrossRef]
  25. Carbone, L.; Cozzoli, P.D. Colloidal heterostructured nanocrystals: Synthesis and growth mechanisms. Nano Today 2010, 5, 449–493. [Google Scholar] [CrossRef]
  26. Casavola, M.; Buonsanti, R.; Caputo, G.; Cozzoli, P.D. Colloidal strategies for preparing oxide-based hybrid nanocrystals. Eur. J. Inorg. Chem. 2008, 2008, 837–854. [Google Scholar] [CrossRef]
  27. Chen, J.; Ma, Q.; Wu, X.J.; Li, L.; Liu, J.; Zhang, H. Wet-chemical synthesis and applications of semiconductor nanomaterial-based epitaxial heterostructures. Nano-Micro. Lett. 2019, 11, 86. [Google Scholar] [CrossRef] [Green Version]
  28. Deki, S.; Aoi, Y.; Hiroi, O.; Kajinami, A. Titanium (IV) oxide thin films prepared from aqueous solution. Chem. Lett. 1996, 1996, 433–434. [Google Scholar] [CrossRef]
  29. Gong, J.; Yang, C.; Pu, W.; Zhang, J. Liquid phase deposition of tungsten doped TiO2 films for visible light photoelectrocatalytic degradation of dodecyl-benzenesulfonate. Chem. Eng. J. 2011, 167, 190–197. [Google Scholar] [CrossRef]
  30. Zhang, M.; Yang, C.; Pu, W.; Tan, Y.; Yang, K.; Zhang, J. Liquid phase deposition of WO3/TiO2 heterojunction films with high photoelectrocatalytic activity under visible light irradiation. Electrochim. Acta 2014, 148, 180–186. [Google Scholar] [CrossRef]
  31. Zhou, L.; Smyth-Boyle, D.; O’Brien, P. A facile synthesis of uniform NH4TiOF3mesocrystals and their conversion to TiO2mesocrystals. J. Am. Chem. Soc. 2008, 130, 1309–1320. [Google Scholar] [CrossRef] [PubMed]
  32. Gao, Y.; Masuda, Y.; Koumoto, K. Microstructure-controlled deposition of SrTiO3 thin film on self-assembled monolayers in an aqueous solution of (NH4)2TiF6-Sr(NO3)2-H3BO3. Chem. Mater. 2003, 15, 2399–2410. [Google Scholar] [CrossRef]
  33. Saito, N.; Haneda, H.; Seo, W.S.; Koumoto-Langmuir, K. Selective deposition of ZnF(OH) on self-assembled monolayers in ZnNH4F aqueous solutions for micropatterning of zinc oxide. Langmuir 2001, 17, 1461–1469. [Google Scholar] [CrossRef]
  34. Liotta, S. Kinetics of precipitation. J. Am. Chem. Soc. 1965, 87, 1414. [Google Scholar] [CrossRef]
  35. Pan, X.; Yang, M.; Fu, X.Q.; Fu, X.; Zhang, N.; Xu, Y.J. Defective TiO2 with oxygen vacancies: Synthesis, properties and photocatalytic applications. Nanoscale 2013, 5, 3601–3614. [Google Scholar] [CrossRef]
  36. Nowotny, J. Titanium dioxide-based semiconductors for solar-driven environmentally friendly applications: Impact of point defects on performance. Energy Environ. Sci. 2008, 1, 565–572. [Google Scholar] [CrossRef]
Figure 1. HRTEM images (ad) and elemental mappings (eh) of the plate-like TiO2samples.
Coatings 12 01673 g001
Figure 2. SEM images of the prepared samples with different synthesis times: (a,d) 3 h, (b,e) 6 h, (c,f) 12 h, (g) 24 h and (h) 48 h. (i) Fitting curves to the sample thickness. Red circles highlight the surface characteristics.
Coatings 12 01673 g002
Figure 3. Fitting of the crystallization of TiO2 on nanosheets by means of the Avrami equation (red line is the fitting curve).
Coatings 12 01673 g003
Figure 4. SEM images of the samples prepared with different (NH4)2TiF6 concentrations before calcination: (a) 0.05 M, (b) 0.1 M, (c) 0.15 M, (d) 0.2 M, (e) 0.3 M. (f) The thickness data of the samples.
Coatings 12 01673 g004
Figure 5. XRD of the different samples (a) before and (b) after annealing.
Coatings 12 01673 g005
Figure 6. SEM images of the prepared samples with different stirring rates: (a) 300 rpm, (b) 600 rpm, (c) 900 rpm, (d) 1200 rpm and (e) 1500 rpm. (f) The thickness data of the samples.
Coatings 12 01673 g006
Figure 7. Typical SEM images of the samples with different synthesis temperatures: (a) 10 °C, (b) 30 °C, (c) 50 °C, (d) 70 °C and (e) 90 °C. (f) The thickness data of the samples.
Coatings 12 01673 g007
Figure 8. (a) Color change diagram of different samples, (b) typical UV–vis DRS of the sample with different synthesis temperatures.
Coatings 12 01673 g008
Table 1. Summary of the kinetic fitting to the sample synthesis.
Reaction KineticsKinetic Equation k ValueR2
First-order reaction y = a ( 1 e k t ) k = 4.45 × 10⁻⁵ s−10.97009
Second-order reaction y = a 2 k t 1 + a k t k = 5.16 × 10⁻⁷ s−10.94305
Second-order reaction
with autocatalysis
y = a b ( e ( a + b ) k t 1 ) a + b e ( a + b ) k t k = 1.68 × 10⁻⁶ s−10.99871
Publisher’s Note: MDPI stays neutral with regard to jurisdictional claims in published maps and institutional affiliations.

