
Surface Potentials of Mixtures Containing Oddly Charged Colloids
Department of Chemistry, Sapienza University of Rome, Cannizzaro Building, P.le A. Moro 5, 00185 Rome, Italy
Coatings 2022, 12(11), 1715; https://doi.org/10.3390/coatings12111715
Submission received: 26 August 2022
/
Revised: 9 October 2022
/
Accepted: 13 October 2022
/
Published: 10 November 2022
(This article belongs to the Section Surface Characterization, Deposition and Modification)
Abstract
:Charged surfaces and particles of the same sign never attract, but oppositely oppositely charged ones do. If the surface potentials of two colloids, namely ψA and ψB, differ in sign, the difference among representative exponentials, i.e., (exp+(zεΨA//kT) − exp−(zeψB/kT)), is solved by the Poisson–Boltzmann, P–B, equation. The procedure is simple to handle when |ψA| ≈ |ψB|. It is troublesome to address the problem when potentials largely differ from each other in modulus. To overcome these difficulties, the P–B equation was reformulated so that drawbacks inherent to its classical form are bypassed. The above relation was rewritten in a promptly readable mode. The similarities and differences met when |ψA| ≠ |ψB| are discussed. It is shown in which conditions the revised form of the P–B equation overlaps with the classical one. From the re-formulation, it is also possible to determine the electrostatic energy occurring among interacting colloid particles dispersed in a given medium.
1. Introduction
Colloid particles dispersed in a solvent bear a net surface charge density, σ, and an electrical potential, ψ [1]. Such quantities depend on the ionization of outside-facing groups, on the amount of entering/exiting ions [2], on the surface adsorption of ions, surfactants [3,4], or polymers [5]. ψs, and σs are responsible for colloid stability and avoid coagulation [6,7,8]. The electrostatic energy term acting between colloid entities is responsible for their stability, dispersibility, and clustering, as well.
Theories developed so far [9,10,11] rely on the DLVO theory [12] (so named after Derjaguin, Landau, Verwey, and Overbeek. Russian and Dutch groups derived similar expressions, despite the former two authors did not know the results of the other two colleagues), combining electrostatics and statistical thermodynamics. They give rise to the well-known Poisson–Boltzmann equation, P–B, whose use is ubiquitous in colloid sciences. It applies to clays, inorganic colloids [13,14], latexes [15], cells [16], and is at the basis of colloid titration [17]. Originally, the P–B equation referred to entities with the same electrical potential, |ψ| [18,19]. The above relation can be solved by calculating the hyperbolic form of (exp(zeψ/kT) − exp−(zeψ/kT)) and linearizing the resulting difference (provided that (zeψ/kT) << 1). Thus, the computing utility of the P–B equation is noteworthy.
Perhaps colloidal dispersions contain particles largely differing in surface potentials. Current examples are many, mostly in biological fluids, the red and plasma blood cells being one example [20,21]. Adsorbed ions, or proteins, build up systems differing in surface potentials and termed ψA and ψB, respectively. It is helpful determining from first principles which interactions occur among entities endowed with different ψs or σs. In such cases, the P–B equation is not easy to handle and dramatic failures in the computation procedures are met [22,23]. Thus, the results must be manipulated to be properly interpreted.
When ψA and ψB differ in modulus, the effective potential, ψeff, is given by the relation [24]
where ψA and ψB are the aforementioned potentials and k and d have their usual meaning [25].
ψeff = ψAcosh(kx) + [ψBcsch(2kd) − ψAcoth(2kd)]sinh(kx)
In some cases, Equation (1) is physically inconsistent, as can be seen by differentiation and reintegration. In particular, ψeff values seem realistic at “moderate” distances and reach the expected minimum. For “very small” distances, however, ψeff values are erratic and Equation (1) no longer holds. The expected ψeff minimum vanishes and conflicting results on the sign of electrostatic potential with respect to that of σ can be met [24].
Some more points deserve consideration. If colloid entities bear grossly the same potential, the canonical P–B form holds true. If the ψ-based exponents differ in modulus, computation is cumbersome, Figure 1. In particular, the difference among exponentials is not symmetric with respect to the origin of the function. Thus, one must consider separately the positive and negative branches of the curves in Figure 1. The difference among the two exponentials approaches zero for negative (zeψ/KT) values but amplifies in the reverse regime. This can be seen inverting the left-hand-side branch of the curves with respect to the origin. In physical terms, the presence of two such regimes is nonsense. A simple way out to escape this paradox is suggested.
In this contribution, the eventuality that electrical potential of A-type particles, ψA, differs from that of B-type ones, ψB, is explicitly accounted for. If |ψA| ≠ |ψB|, one may transfer the potential in excess from A to B particles, to equalize them. The procedure is physically consistent and implies a partial charge transfer, occurring at the expense of an energy cost, dGtr, proportional to |ψA| − |ψB|. The difference, α = |ψA| − |ψB|, is then partitioned among the two potentials. The minor term grows and the major decreases symmetrically until the same modulus is attained by both particles. This fact corresponds to a charge transfer among the two entities. The resulting relation has the form of a P–B equation, with an additional term multiplying the difference among the two (zeψ/kT)-based exponentials. The difference is indicated here from (1 + α/2). The suggested procedure is consistent with classical electrostatics.
In the present revision, the work needed to equalize the two potentials, dGtr, is accounted for. Note that the revised form of the PB-like relation introduced here approaches the classical one when |ψA| = |ψB|. A brief description of that procedure is developed. The advantages and drawbacks of the present formulation are discussed.
2. Methods
The systems may contain disks, rods, spheres, or their mixtures. σ values are uniform; no knife-edges, acuminate borders, or steep curvatures are accounted for. Mixtures are diluted; the volume fractions of A-particles, ϕA, and B- ones, ϕΒ, respectively, can be varied. Both volume fractions are <<1 and the respective densities are known. The dielectric permittivity of solvent, ε, controlling σs and ψs, must be known. The same holds for the ionic strength, I. In what follows, calculations were performed at I = 5.00 mmol kg−1 NaCl. In the calculations, I fixed the ionic strength (the particle content was close to 0.10% volume fraction) in such a way to obtain, nearly, the constancy of all forces but double-layer ones. The latter arose from the net NP surface charge density. In this way, terms due to vdW forces are practically constant.
Dispersions of A and B colloids, whose potentials are |ψA| > |ψB|, are considered here. The difference |ψA| − |ψB| is > 0. A linear perturbation regime holds true and zeψ << KT. The major component is (zeψA/kT) = (αzeψB/kT) + (zeψB/kT). The term αzeψB is the difference among |ψA| and |ψB|.
When the two entities are in contact, they partly transfer their charge, until a new equilibrium is attained and ψA’ = ψB’ at the end of the process.
The difference among the original functions is
exp(zeψA/kT) − exp(zeψB/kT) = [exp(zeψB/kT)exp(αzeψB/kT) − exp(zeψB/kT)]
Implicit in Equation (2) is the assumption that surface potentials, or surface charge densities, of the two particles (i.e., ψA and ψB) bear an opposite sign.
Equation (2) is multiplied by [exp−(αzeψB/kT)/exp−(αzeψB/kT)] and rewritten as
[exp−(αzeψB/KT)/exp−(αzeψB/KT)][exp(zeψB/KT)exp(αzeψB/KT) − exp(zeψB/KT)]
After some straightforward algebra, Equation (3) is transformed into
where the term in brackets has the correct Euler’s form. Equation (4) is rewritten as
[exp−(αzeψB/kT)/exp−(αzeψB/kT)][exp(zeψB/kT)exp(αzeψB/kT) − exp−(zeψB/kT) exp−(αzeψB/kT)]
[exp(αzeψB/kT)][exp(zeψB/kT)(1 + α/2) − exp−(zeψB/kT)(1 + α/2)]
Equation (5) has the same meaning of the P–B equation, but with the presence of an additional pre-exponential multiplier, i.e., (exp(αzeψB/kT)). Let us rewrite Equation (5) in hyperbolic form to obtain
2exp(αzeψB/2KT)sinh[(zeψB/kT)(1 + α/2)]
Equation (6) applies to all possible cases met in real systems. If α = 0, the term exp[αzeψB/2kT] is unity and the function reduces to 2sinh[zeψB/kT]. In other words, when α = 0, |ψA| = |ψB|, as expected.
The hyperbolic function reported above is calculated as usual [26,27]. No drawbacks with respect to the classical form occur, whose intrinsic physical meaning is, thus, retained. According to Equation (6), 50% of the unbalanced potential, α/2, is transferred from ψA to ψB. The latter increases in modulus, when ψA decreases symmetrically. Equation (6) is a true P–B equation, with the presence of an a-dimensional multiplier. The original form of P–B theory, thus, holds true and the equation can be extended to multicomponent colloid mixtures, whatever the original ψs are.
3. Results
Let us consider the following possibilities, i.e., zeψ << kT; zeψ ≈ kT; and zeψ > kT. The respective graphs are reported in Figure 2 and Figure 3, respectively. Significant departures from linearity are met if (zeψB/kT) > 1 and α is significant (N.B. when α > 2, |ψA| > 3|ψB|). The role of α and the charge transfer processes are outlined below.
3.1. The Role of α
It is assumed that α > 0 and it was imposed that relations are symmetrical with respect to the sign. The value of α is proportional to the difference, in modulus, between two electrostatic potentials. For low-perturbation regimes, if 0.01 < (zeψ/kT) < 0.2 [26], the hyperbolic form is easily linearized, whatever α is, Figure 2. If zeψ/kT is > 0.5, departures from linearity may occur, depending on α, see Figure 3.
The modified P–B equation holds at moderate potentials. The term zeψ is both superiorly and inferiorly limited. Current working conditions are between the lowest value ensuring stability to colloids (≈25 mV, at 25.0 °C) [27] and 100 mV. Higher ψs imply ion condensation onto the NP (nanoparticle) surfaces [28] and are not considered.
3.2. The Charge Transfer
Transferring energy from A to B particles equalizes the potentials. The electrostatic energy required to charge/discharge a colloid particle of known surface charge density is calculated by
The following relation makes explicit the surface charge density, obtained by the relation
when n° is the number of ions. If (zeψ << kT), σ is easily linearized to give
Introducing Equation (9) in Equation (7) leads to
In all these relations, the energy of transfer is proportional to α. It is also worth noting that Equation (12) does not require the constancy of σ. Similar relations are obtained by integrating ψs between 1 and (1 + α); in that case, the lower limit of the integration is ψB and the upper is ψA.
An easy-to-handle relation comes from ζ potentials. In that case, the transfer energy is
where κ is Debye’s screening length (related to I). Whatever ψs or ζs are, ΔGel is always proportional to α.
This re-formulation deals with particles differing in ψ or σ when the ratio αzeψ/kT < 1. The case when |ψA| = |ψB| is, thus, part of a more general behavior. It is obvious that a comprehensive theory must consider the eventuality that potentials differ in modulus.
4. Discussion
The most relevant aspects of this rewritten form of the P–B equation deal with (Section 4.1) interactions among colloids differing in size, shape, ψ’s, or σ’s; (Section 4.2) cell–host interactions occurring in real or bio-mimetic systems; and (Section 4.3) colloid titration procedures.
4.1. Colloid Crystals and Hybrid Colloids
The interactions among oppositely charged NPs in a medium may give rise to Colloid Crystals, CCs, or Hybrid Colloids, HCs. The former pack in analogy to oppositely charged ions and build well-defined crystalline lattices [29,30,31,32]. They display the same associative behavior as ions do in a crystal, but on a much larger-size scale, showing typical light diffraction features and forming arrays in one or two directions. The processes leading to CCs’ formation are irreversible. Electric or magnetic fields help in obtaining crystals with the desired organization mode [33,34]. The building-up details include ion adsorption onto NPs, matching the solvent and NP properties (size, shape, σ, etc.), combining Brownian motion with dielectrophoresis, which ensures orientation along a given direction, if required, and so forth. Interactions depend on ζ potential gradients sensed by the reacting entities. These processes occur both when sizes and shapes are the same or differ from each other.
Let us consider the case when ζ = (4πτσ/ε) = (4πσ/εk), where τ is the effective double-layer thickness. Introducing Equation (13) in Equation (12) gives the interaction energy, expressed as
ΔGel is proportional to α and grossly linear if α << 1. Note too that when Equation (14) refers to unscreened potentials, Equation (13) applies to the effective value outside NPs. The electric Gibbs energy drives the formation of CCs. Similar considerations apply to HCs, entities which are built-up by reacting with different colloids [35,36,37,38]. NP sizes and shapes are immaterial and the ΔGel dependence on α, Figure 4, implies only charge effects. In this approach, it is the electric contribution that drives the process.
4.2. Bio-Intended and Bio-Mimetic Systems
Cells and oppositely charged viruses, but also proteins, DNA, or related entities [39,40], interact with each other. The number of charges depends on the objects in question. These are, as a rule, negatively charged with ions in excess trapped in the membrane lipid wells, where ions are firmly bound and the interaction energy, U, is >>KT [41,42]. Unfortunately, the quality of such data is questionable and a quantitative determination is not easy to perform.
Interactions among vesicles and bio-macromolecules fulfill the same rules. For instance, it was demonstrated that bovine serum albumin (BSA) binding on oppositely charged vesicles is more efficient the lower the pH is [43] (i.e., there is a clear relationship among binding and protein net charge). Similar considerations apply to DNA binding onto oppositely charged vesicles [44].
Cells interact with hosts and viruses through the combination of different effects. In almost all dispersions, the dominant inter-particle interaction forces are van der Waals (vdW) and electrical double-layer ones. The former is usually attractive and favors coagulation (sometimes through untoward mechanisms). The second can be attractive, repulsive, or may change from one mode to another, depending on the separation distance among particles (i.e., on concentration) and ionic strength. The combined action of such major forces, eventually in combination with minor ones (as host–guest), is responsible for the onset of different bio-based aggregates, someway modulated by the medium ionic strength, I.
As mentioned above, the organization of bio-intended matter is driven by either vdW or host–guest interactions, but electrostatic contributions are quite relevant too. For instance, the double-layer thickness plays a key role in the electrostatic interactions of cells with viruses. This fact holds true when ion concentration in the membrane boundary layer differs from that in the bulk. Both pH and presence of salts in the bulk influence the double-layer thickness. Thus, an increasing salt concentration, or ion valency, reduces the thickness of such a layer and facilitates virus adsorption onto surfaces, despite their surface charge being negative. In other words, variations in surface potentials induce the interactions by changing the double-layer effects [45].
In this contribution, the calculations were performed at low ionic strength and fixed particle content, of moderate volume fraction. In this way, it is presumed to obtain the constancy of all forces but double-layer ones. Further, despite a number of biologically relevant cases being investigated (some of which are of questionable accuracy), a quantitative determination of the interactions occurring in such media is not easily performed. Presumably, the role of pH and ionic strength of the medium are not considered with due care and the modulation of vdW forces is not properly accounted for.
4.3. Colloid Titration
Colloid titration procedures apply to mixtures of oppositely charged polymers and to charged cells interacting with a host. Titration implies adduct precipitation and/or a large increase in turbidity. Charge inversion occurs and the process continues well above charge neutralization [46]. Let us consider, in this regard, a negatively charged vesicular system titrated with Lysozyme (Lyso). Vesicles are made by mixing oppositely charged amphiphilic ions in non-stoichiometric amounts. Thus, vesicle charge depends on the surfactant species in excess. The ionic strength is fixed and controlled by counter-ions, i.e., cations and anions, released through metathesis. Lysozyme is in its native form and there is no need for buffers.
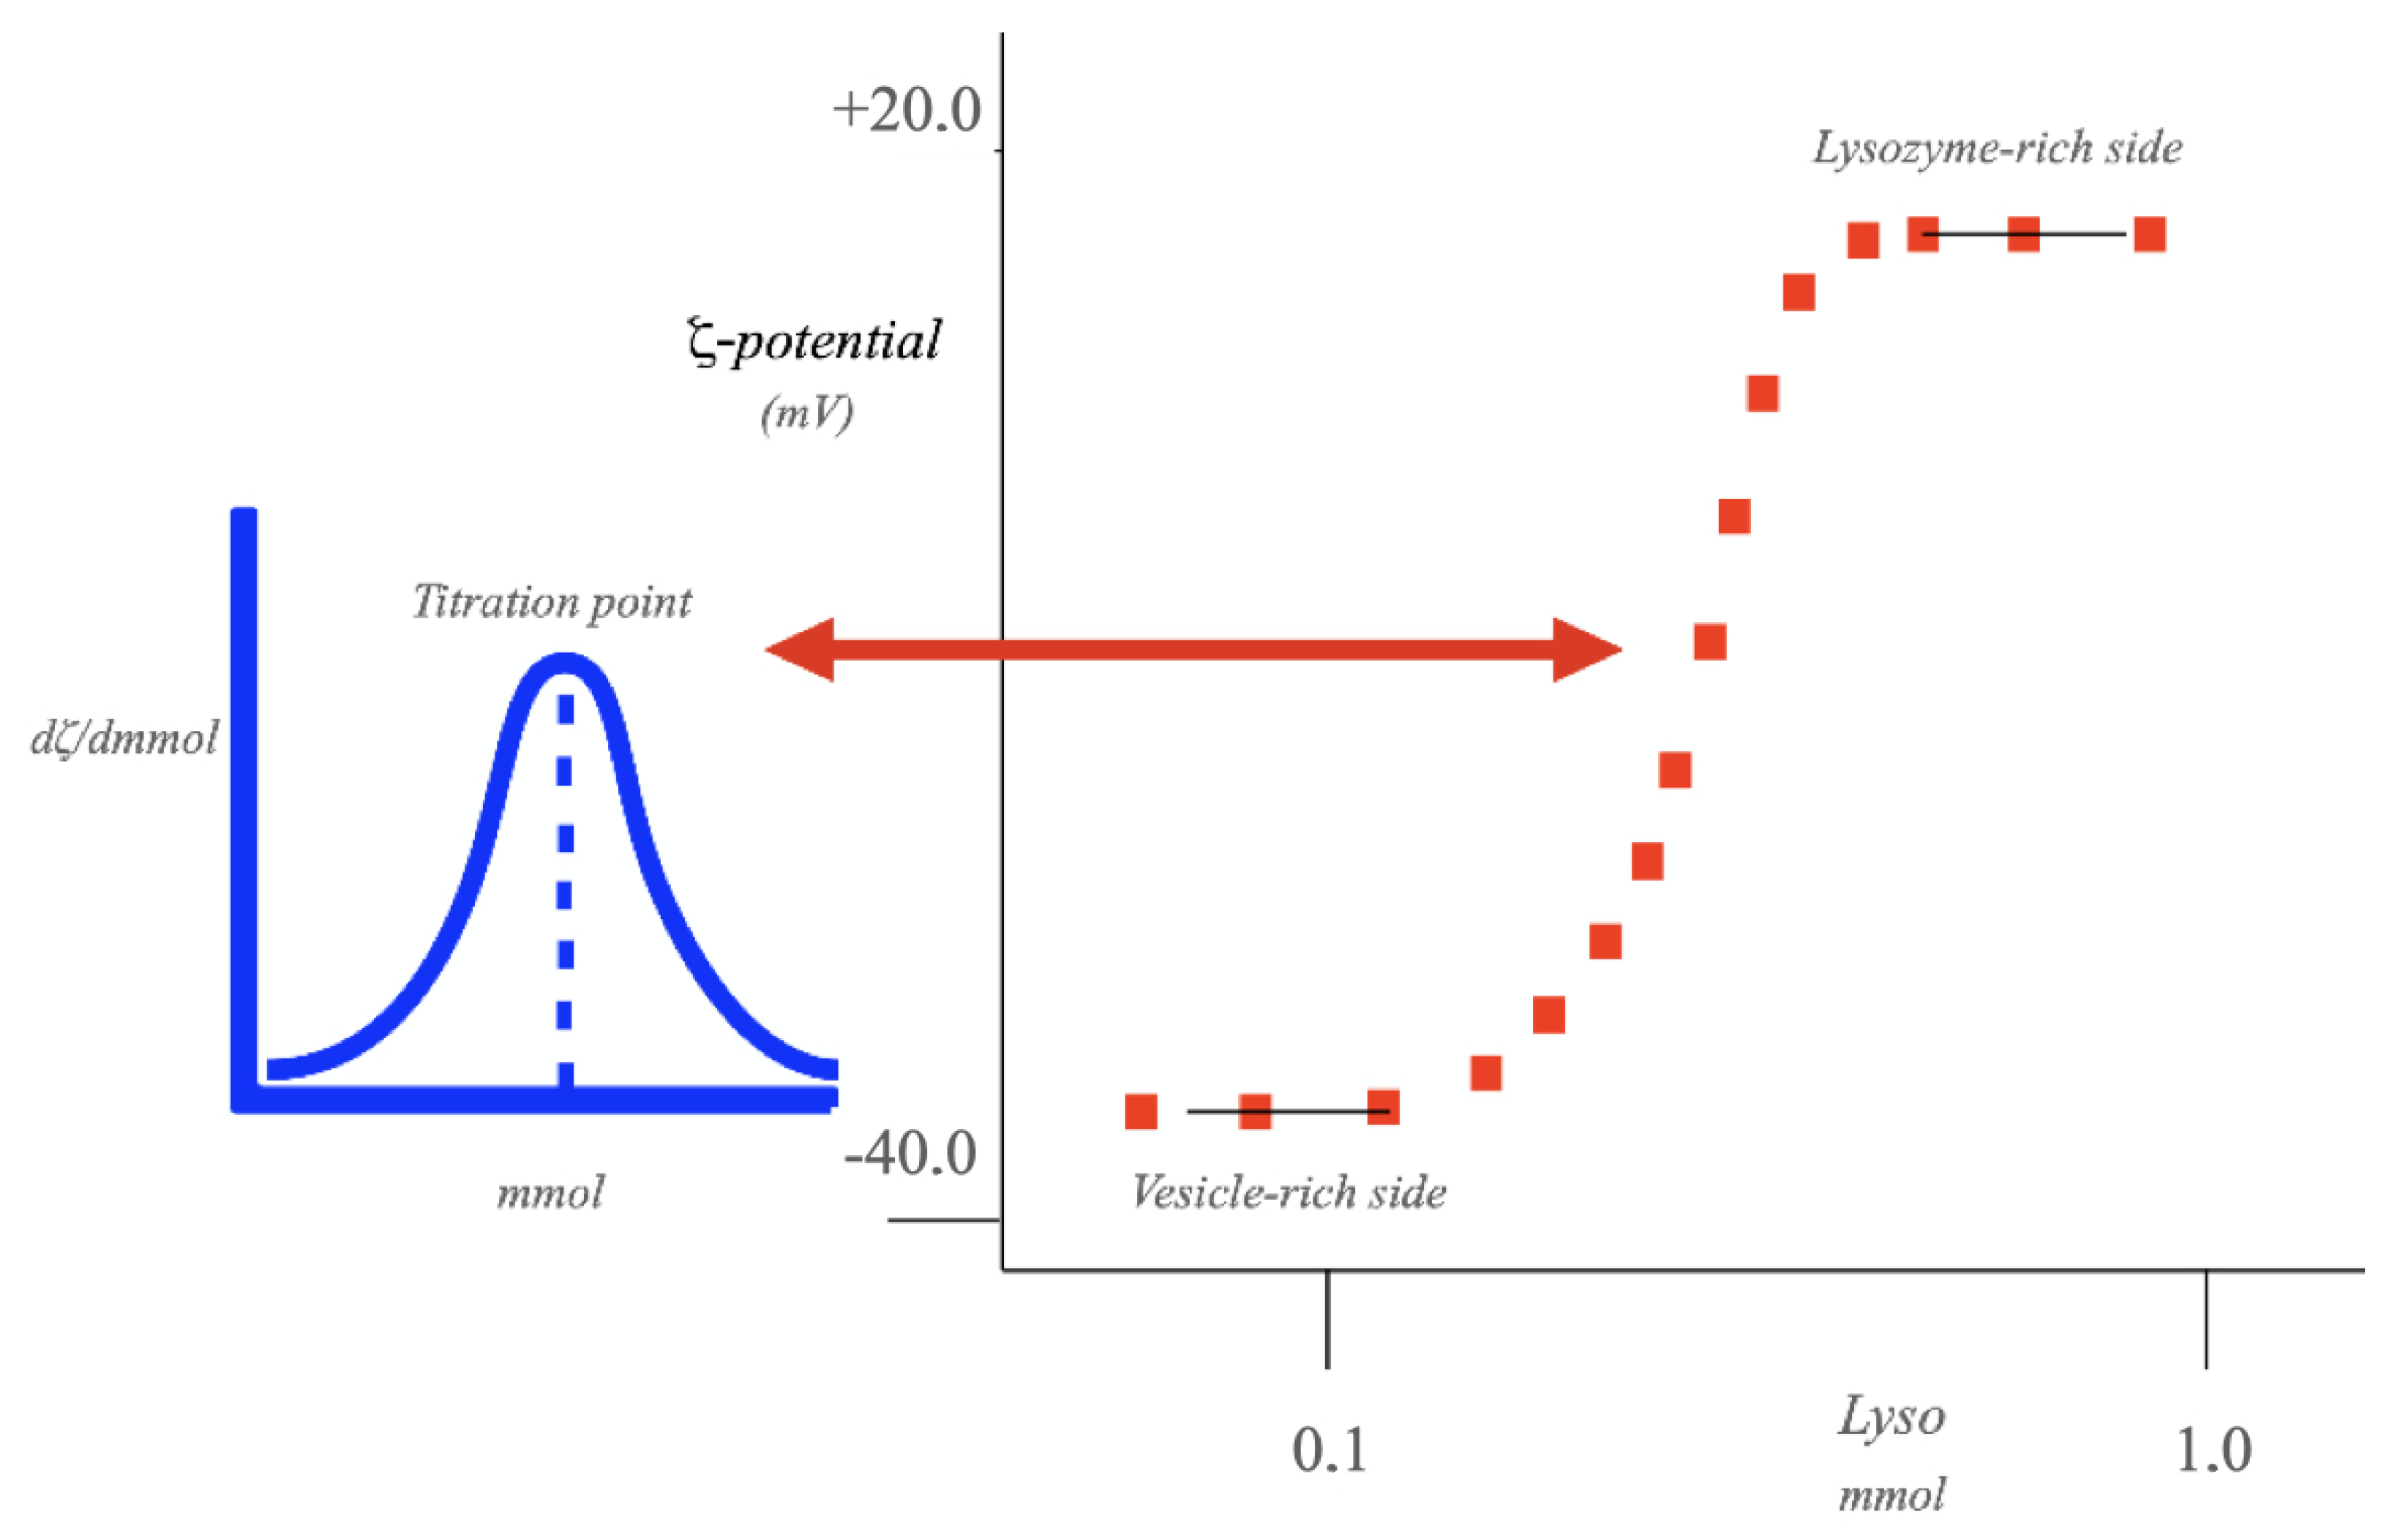
Starting from the vesicle-rich side, one obtains a progressive reduction in ζ potential on increasing protein content. This fact is due to the substantial amount of (protein-vesicle) adducts that are formed. The above process is associated with the onset of a significant turbidity. Lyso binding ensures charge neutralization and inversion of the adducts that do form. Figure 5 clearly demonstrates the validity of Equation (13). In fact, ζ potential progressively inverts its sign and approaches the value pertinent to free protein. Although this is not explicitly stated, note that α values change continuously between the two limits in Figure 5.
5. Conclusions
Equations for colloids with potentials differing in modulus are solved writing hyperbolic forms of the P–B equation in a way that explicitly accounts for such a difference. The mother equation was rewritten. From the equi-partition of potential in excess, one obtains a relation having exactly the same physical meaning as the original one. The ΔGel value that is concomitant to a partial charge transfer is proportional to α, i.e., to ψA − ψB. This re-write was applied also to ζ potential values. Numerical examples and elaboration of previous literature data suggest the validity of the proposed reformulation and indicate the possibility to use it in many cases, mostly in bio-based ones. The present approach predicts what could be expected in the building of composites made of different nanoparticles and in bio-intended hybrids [47].
Funding
This research received no external funding.
Institutional Review Board Statement
Not applicable.
Informed Consent Statement
Not applicable.
Data Availability Statement
Not applicable.
Acknowledgments
Deep thanks are due to G. Risuleo, for support in the linguistic revision and useful suggestions on the bio-intended part of the manuscript. Thanks to an anonymous reviewer for suggestions on the correct form of Equation (2).
Conflicts of Interest
There is no conflict of interest.
References
- Oshima, H. Surface Charge Density/Surface Potential Relationship for a Spherical Colloidal Particle in a Salt-Free Medium. J. Colloid Interface Sci. 2002, 247, 18–23. [Google Scholar] [CrossRef]
- Lyklema, J.; Golub, T. Electrical Double Layer on Silver Iodide and Overcharging in the Presence of Hydrolyzable Cations. Croat. Chem. Acta 2007, 80, 303–311. [Google Scholar]
- Van Riemsdijk, V.H.; Bolt, G.H.; Koopal, L.K.; Blaakmeer, J. Electrolyte adsorption on heterogeneous surfaces: Adsorption models. J. Colloid Interface Sci. 1986, 109, 219–228. [Google Scholar] [CrossRef]
- Paria, S.; Khilar, K.C. A review on experimental studies of surfactant adsorption at the hydrophilic solid–water interface. Adv. Colloid Interface Sci. 2004, 110, 75–95. [Google Scholar] [CrossRef] [PubMed]
- Shubin, V. Adsorption of Cationic Polyacrylamide onto Monodisperse Colloidal Silica from Aqueous Electrolyte Solutions. J. Colloid Interface Sci. 1997, 191, 372–377. [Google Scholar] [CrossRef]
- Philipse, A.P. Colloidal sedimentation (and filtration). Curr. Opin. Colloid Interface Sci. 1997, 2, 200–206. [Google Scholar] [CrossRef]
- Robins, M.M. Emulsions-creaming phenomena. Curr. Opin. Colloid Interface Sci. 2000, 5, 265–272. [Google Scholar] [CrossRef]
- Ansell, G.C.; Dickinson, E. Brownian-dynamics simulation of the formation of colloidal aggregate and sediment structure. Faraday Discuss. Chem. Soc. 1987, 83, 167–177. [Google Scholar] [CrossRef]
- Deriaguin, R.V. Theory of the Stability of Colloids and Thin Films; Consultants Bureau: New York, NY, USA; London, UK, 1989. [Google Scholar]
- Landau, L.D. Collected Works; Nauka: Moscow, Russia, 1969; Volume I, pp. 386–411. [Google Scholar]
- Verwey, E.J.W.; Overbeek, J.T.G. Theory of the Stability of Lyophobic Colloids; N.B. It Is the Reprint of the 1948 Original Version; Dover Books on Chemistry: Mineola, NY, USA, 1999. [Google Scholar]
- Ninham, B.W. On progress in forces since DLVO theory. Adv. Colloid Interface Sci. 1999, 83, 1–17. [Google Scholar] [CrossRef]
- Clare, K.E.; Cruchley, A.E. Laboratory Experiments in The Stabilization of Clays With Hydrated Lime. Géotechnique 1957, 7, 97–111. [Google Scholar] [CrossRef]
- Sperling, R.A.; Parak, W.J. Surface modification, functionalization and bioconjugation of colloidal inorganic nanoparticles. Philos. Trans. R. Soc. A 2010, 368, 1333–1383. [Google Scholar] [CrossRef]
- Thompson, K.L.; Armes, S.P.; York, D.W.; Burdis, J.A. Synthesis of Sterically-Stabilized Latexes Using Well-Defined Poly(glycerol monomethacrylate) Macromonomers. Macromolecules 2010, 43, 2169–2177. [Google Scholar] [CrossRef]
- Byrnes, A.P.; Griffin, D.E. Binding of Sindbis Virus to Cell Surface Heparan Sulfate. J. Virol. 1998, 72, 7349–7356. [Google Scholar] [CrossRef] [PubMed] [Green Version]
- Fogolari, F.; Brigo, A.; Molinari, H. The Poisson-Boltzmann equation for biomolecular electrostatics: A tool for structural biology. J. Mol. Recognit. 2002, 15, 377–392. [Google Scholar] [CrossRef] [PubMed]
- Parsegian, V.A.; Gingell, D. On the Electrostatic Interaction across a Salt Solution between Two Bodies Bearing Unequal Charges. Biophys. J. 1972, 12, 1192–1204. [Google Scholar] [CrossRef] [Green Version]
- Aranda-Espinoza, H.; Chen, Y.; Dan, N.; Lubensky, T.C.; Nelson, P.; Ramos, L.; Weitz, D.A. Electrostatic Repulsion of Positively Charged Vesicles and Negatively Charged Objects. Science 1999, 285, 394–397. [Google Scholar] [CrossRef] [PubMed] [Green Version]
- Lavi, E.D.; Crivellari, F.; Gagnon, Z. Dielectrophoretic detection of electrical property changes of stored human red blood cells. Electrophoresis 2022, 43, 1297–1308. [Google Scholar] [CrossRef] [PubMed]
- Hernando-Pérez, M.; Cartagena-Rivera, A.X.; Lošdorfer Božič, A.; Carrillo, P.J.P.; San Martín, C.; Mateu, M.G.; Raman, A.; Podgornik, R.; de Pablo, P.J. Quantitative nanoscale electrostatics of viruses. Nanoscale 2015, 7, 17289–17298. [Google Scholar] [CrossRef] [PubMed] [Green Version]
- Bu, W.; David Vaknin, D.; Travesset, A. How Accurate Is Poisson−Boltzmann Theory for Monovalent Ions near Highly Charged Interfaces? Langmuir 2006, 22, 5673–5681. [Google Scholar] [CrossRef] [Green Version]
- Outhwaite, C.W. A modified Poisson-Boltzmann approach to homogeneous ionic solutions. Condens. Matter Phys. 2004, 7, 719–733. [Google Scholar] [CrossRef] [Green Version]
- Vold, R.D.; Vold, M.J. Colloid and Interface Chemistry; Addison-Wesley Publ. Co.: Reading, MA, USA, 1983; Chapter VII; pp. 224–238. [Google Scholar]
- Manning, G.S. Counterion Condensation on Charged Spheres, Cylinders and Planes. J. Phys. Chem. B 2007, 111, 8554–8559. [Google Scholar]
- Adamson, A.W. Physical Chemistry of Surfaces, Vth ed.; Wiley: New York, NY, USA, 1994. [Google Scholar]
- Evans, D.F.; Wennerstroem, H. The Colloidal Domain: Where Physics, Chemistry, Biology and Technology Meet; VCH: New York, NY, USA; Weinheim, Germany; Cambridge, UK, 1994; Chapter III; pp. 87–126. [Google Scholar]
- Gillespie, D.A.J.; Hallett, J.B.; Elujoba, O.; Hamzah, A.F.C.; Richardson, R.M.; Bartlett, P. Counterion Condensation on Spheres in the Salt-Free Limit. Soft Matter 2014, 10, 566–577. [Google Scholar] [PubMed]
- Leunissen, M.E.; Christova, C.G.; Hynninen, A.-P.; Royall, C.P.; Campbell, A.I.; Imhof, A.; Dijkstram, M.; van Roij, R.; van Blaaderen, A. Ionic colloidal crystals of oppositely charged particles. Nature 2005, 437, 235–240. [Google Scholar] [CrossRef] [Green Version]
- Bartlett, P.; Ottewill, R.H.; Pusey, P.N. Superlattice formation in binary mixtures of hard-sphere colloids. Phys. Rev. Lett. 1992, 68, 3801–3804. [Google Scholar] [CrossRef]
- Pieranski, P. Colloidal Crystals. Contemp. Phys. 1983, 24, 25–73. [Google Scholar] [CrossRef]
- Lumsdon, S.O.; Kaler, E.W.; Velev, O.D. Two-dimensional crystallization of microspheres by coplanar AC electric field. Langmuir 2004, 20, 2108–2116. [Google Scholar] [CrossRef]
- Bharti, B.; Findenegg, G.H.; Velev, O.D. Co-Assembly of Oppositely Charged Particles into Linear Clusters and Chains of Controllable Length. Sci. Rep. 2012, 2, 1004. [Google Scholar] [CrossRef] [PubMed] [Green Version]
- Gangwal, S.; Cayre, O.J.; Velev, O.D. Dielectrophoretic assembly of metallodielectric Janus particles in AC electric fields. Langmuir 2008, 24, 13312–31320. [Google Scholar] [CrossRef]
- Romio, M.; La Mesa, C. Hybrid nano-composites made of ss-DNA/wrapped carbon nanotubes and titania. Colloids Surf. B Biointerfaces 2017, 152, 12–17. [Google Scholar] [CrossRef]
- Ghofraniha, N.; Andreozzi, P.; Russo, J.; La Mesa, C.; Sciortino, F. Assembly Kinetics in Binary Mixtures of Strongly Attractive Colloids. J. Phys. Chem. B 2009, 113, 6775–6781. [Google Scholar] [CrossRef]
- Peppin, S.S.L.; Worster, M.G.; Wettlaufer, J.S. Morphological instability in freezing colloidal suspensions. Proc. R. Soc. A 2007, 463, 723–733. [Google Scholar] [CrossRef]
- Zerrouki, D.; Baudry, J.; Pine, D.; Chaikin, P.; Bibette, J. Chiral Colloidal clusters. Nature 2008, 455, 380–382. [Google Scholar] [CrossRef]
- Duisit, G.; Saleun, S.; Douthe, S.; Barsoum, J.; Chadeuf, G.; Moullier, P. Baculovirus vector requires electrostatic interactions including heparan sulfate for efficient gene transfer in mammalian cells. J. Gene Med. 1999, 1, 93–102. [Google Scholar] [CrossRef]
- Kwong, P.D.; Wyatt, R.; Sattentau, Q.J.; Sodroski, J.; Hendrickson, W.A. Oligomeric Modeling and Electrostatic Analysis of the gp120 Envelope Glycoprotein of Human Immunodeficiency Virus. J. Virol. 2000, 74, 1961–1972. [Google Scholar] [CrossRef] [PubMed] [Green Version]
- Rothman, J.E.; Kennedy, E.P. Asymmetrical distribution of phospholipids in the membrane of bacillus megaterium. J. Mol. Biol. 1977, 110, 603–618. [Google Scholar] [CrossRef]
- Ruigrok, R.W.H.; Barge, A.; Durrer, P.; Brunner, J.; Ma, K.; Whittaker, G.R. Membrane Interaction of Influenza Virus M1 Protein. Virology 2000, 267, 289–298. [Google Scholar] [CrossRef] [PubMed] [Green Version]
- Pucci, C.; Scipioni, A.; La Mesa, C. Albumin binding onto synthetic vesicles. Soft Matter 2012, 8, 9669–9675. [Google Scholar] [CrossRef]
- Bonincontro, A.; La Mesa, C.; Proietti, C.; Risuleo, G. A Biophysical Investigation on the Binding and Controlled DNA Release in a Cetyltrimethylammonium Bromide-Sodium Octyl Sulfate Cat-Anionic Vesicle System. Biomacromolecules 2007, 8, 1824–1829. [Google Scholar] [CrossRef]
- van Voorthuizen, E.M.; Ashbolt, N.J.; Schäfer, A.I. Role of hydrophobic and electrostatic interactions for initial enteric virus retention by MF membranes. J. Membr. Sci. 2001, 194, 69–79. [Google Scholar] [CrossRef] [Green Version]
- Letizia, C.; Andreozzi, P.; Scipioni, A.; La Mesa, C.; Bonincontro, A.; Spigone, E. Protein Binding onto Surfactant-Based Synthetic Vesicles. J. Phys. Chem. B 2007, 111, 898–908. [Google Scholar] [CrossRef]
- Verma, A.; Stellacci, F. Effect of Surface Properties on Nanoparticle-Cell Interactions. Small 2010, 6, 12–21. [Google Scholar] [CrossRef] [PubMed]
Figure 1.
Difference among |ψA| and |ψB| exponentials vs. |zeψ/KT|, if |ψA| = |ψB|, red, |ψA| = 1.5 |ψB|, blue, and |ψA| = 2.0 |ψB|, black, respectively. |zeψ/KT| is indicated as x, and k is +1.0, +1.5 or +2.0, respectively. The dotted red and blue lines put in evidence the asymmetric shape of the function.
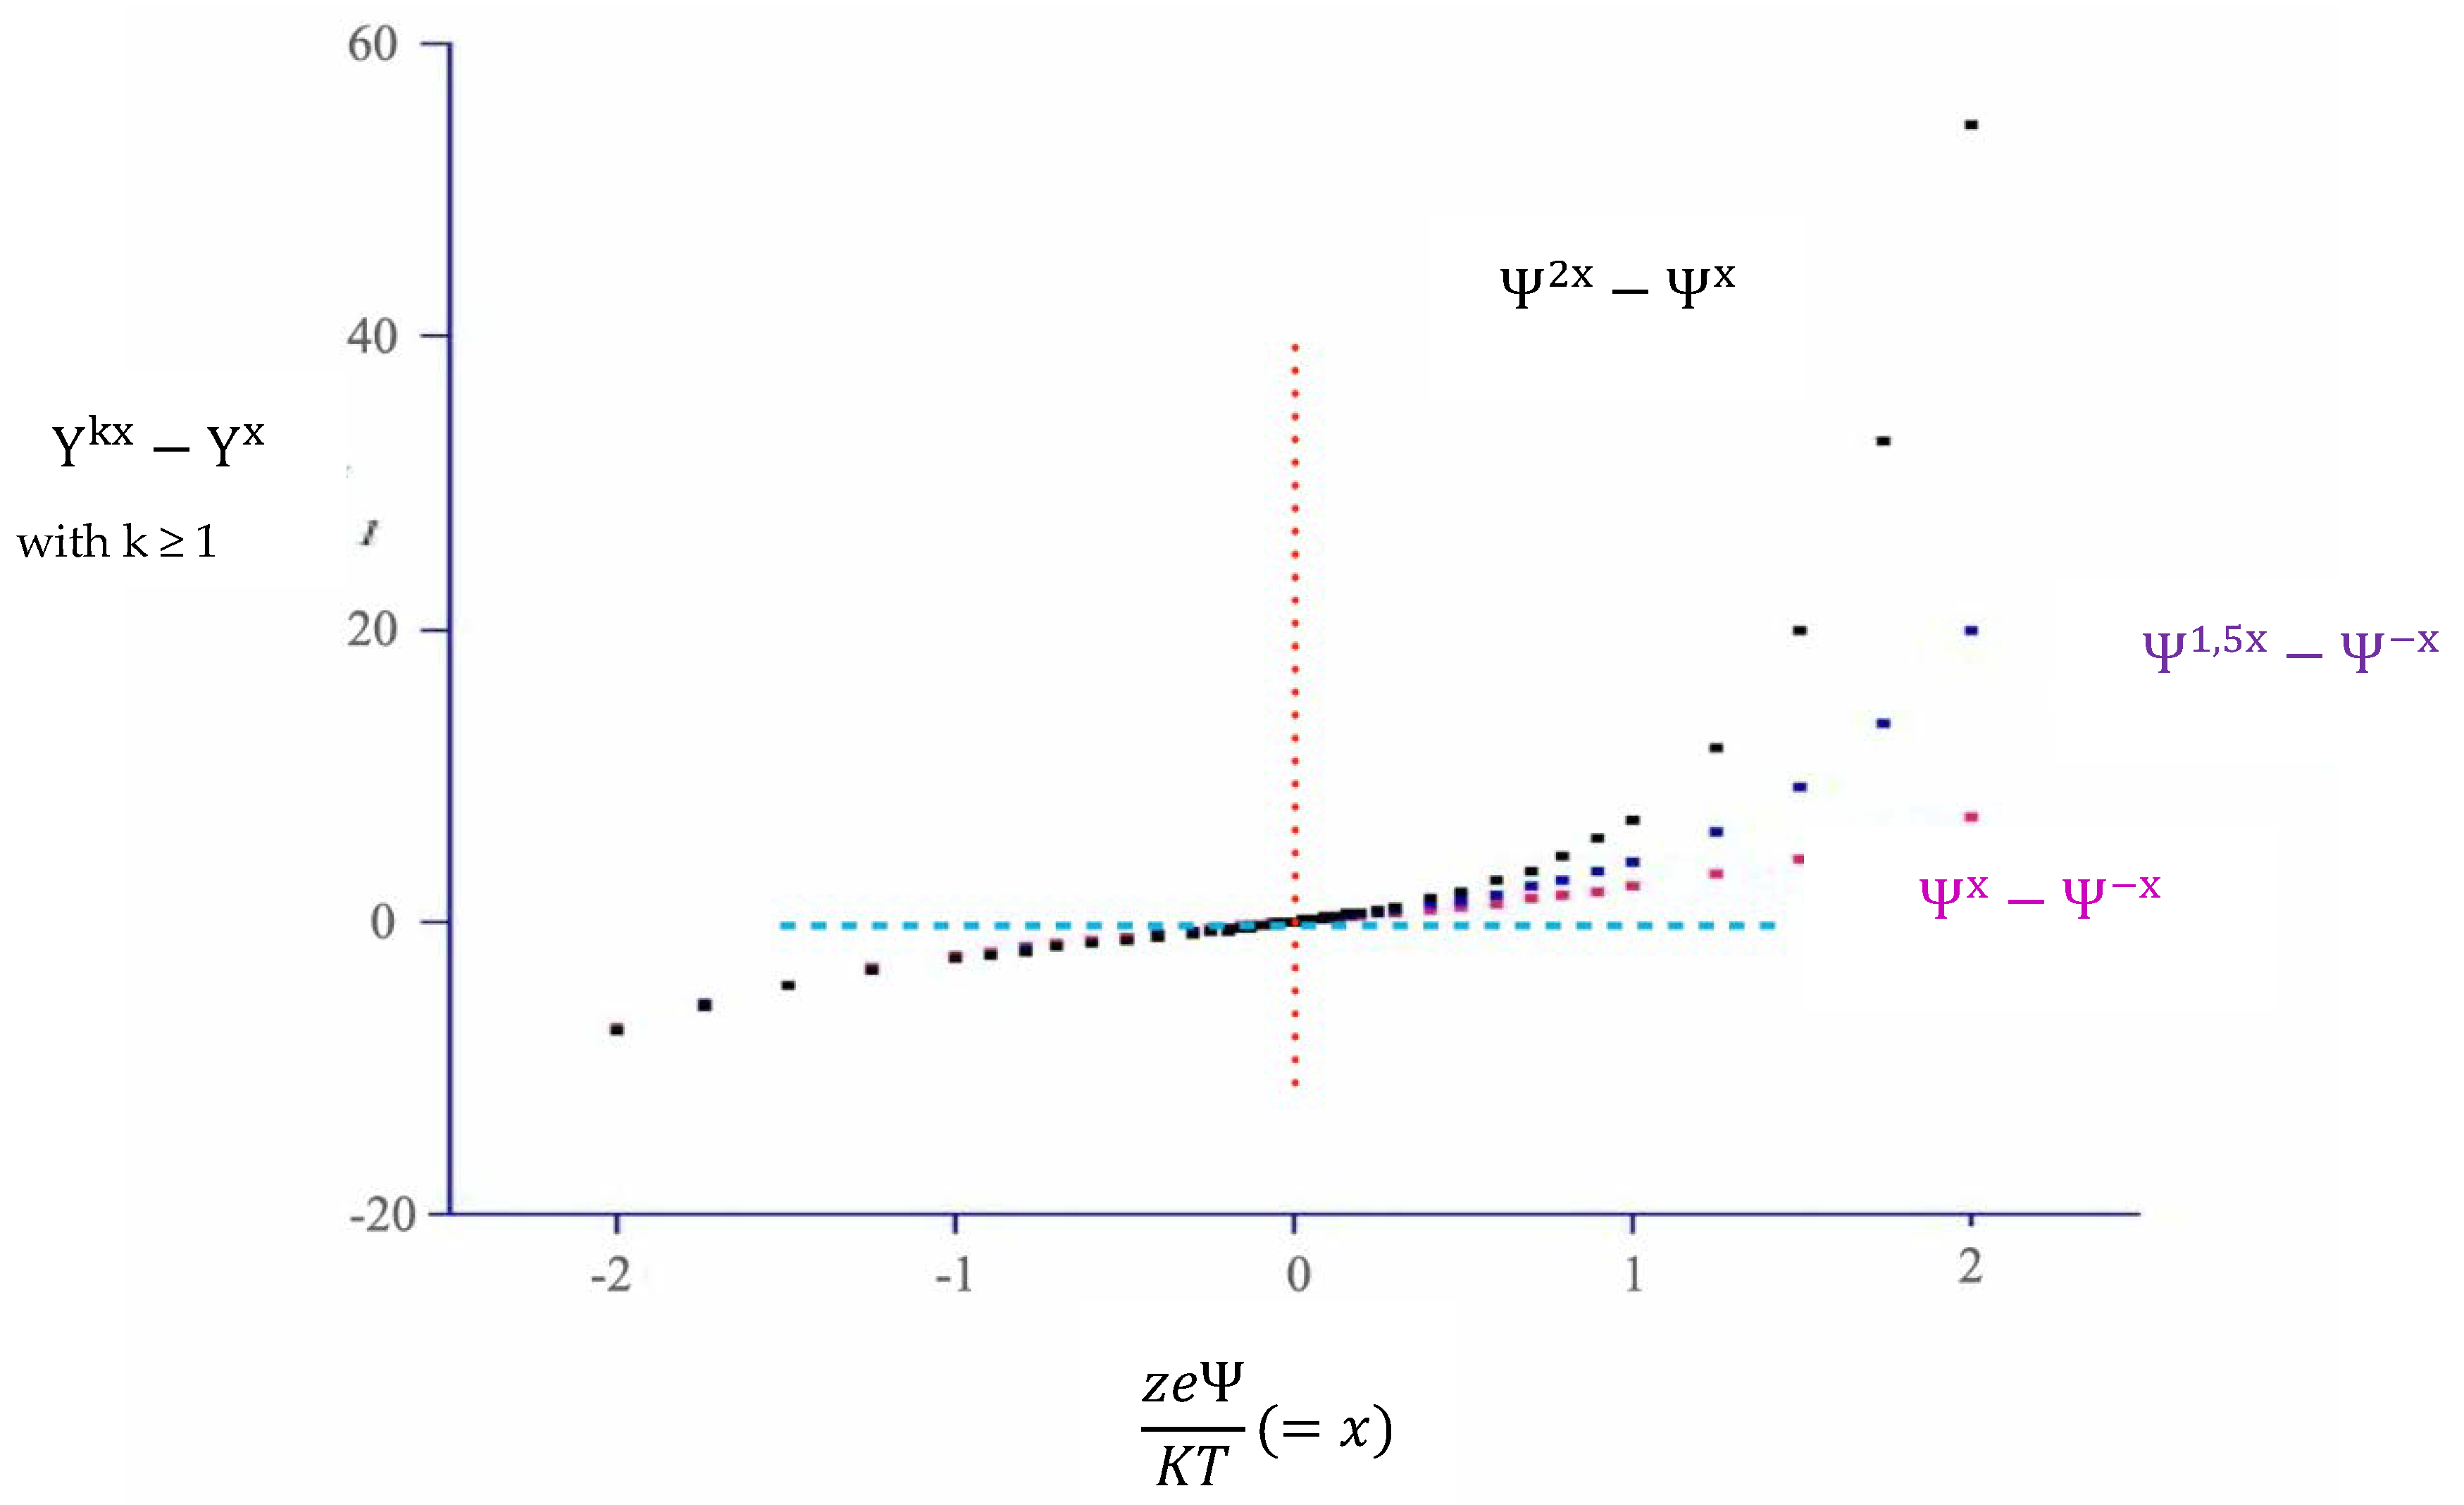
Figure 2.
The hyperbolic components of Equation (6) vs. α when zeψ/KT is 0.01, cyan, 0.02, blue, 0.05, dark green, 0.10, black, and 0.20, yellow. Data were calculated at 298.15 K, 78 Debye units and 5.00 mmol kg−1 ionic strength. The uncertainty on the single points is lower than the symbols’ size. In such regimes fits are linear.
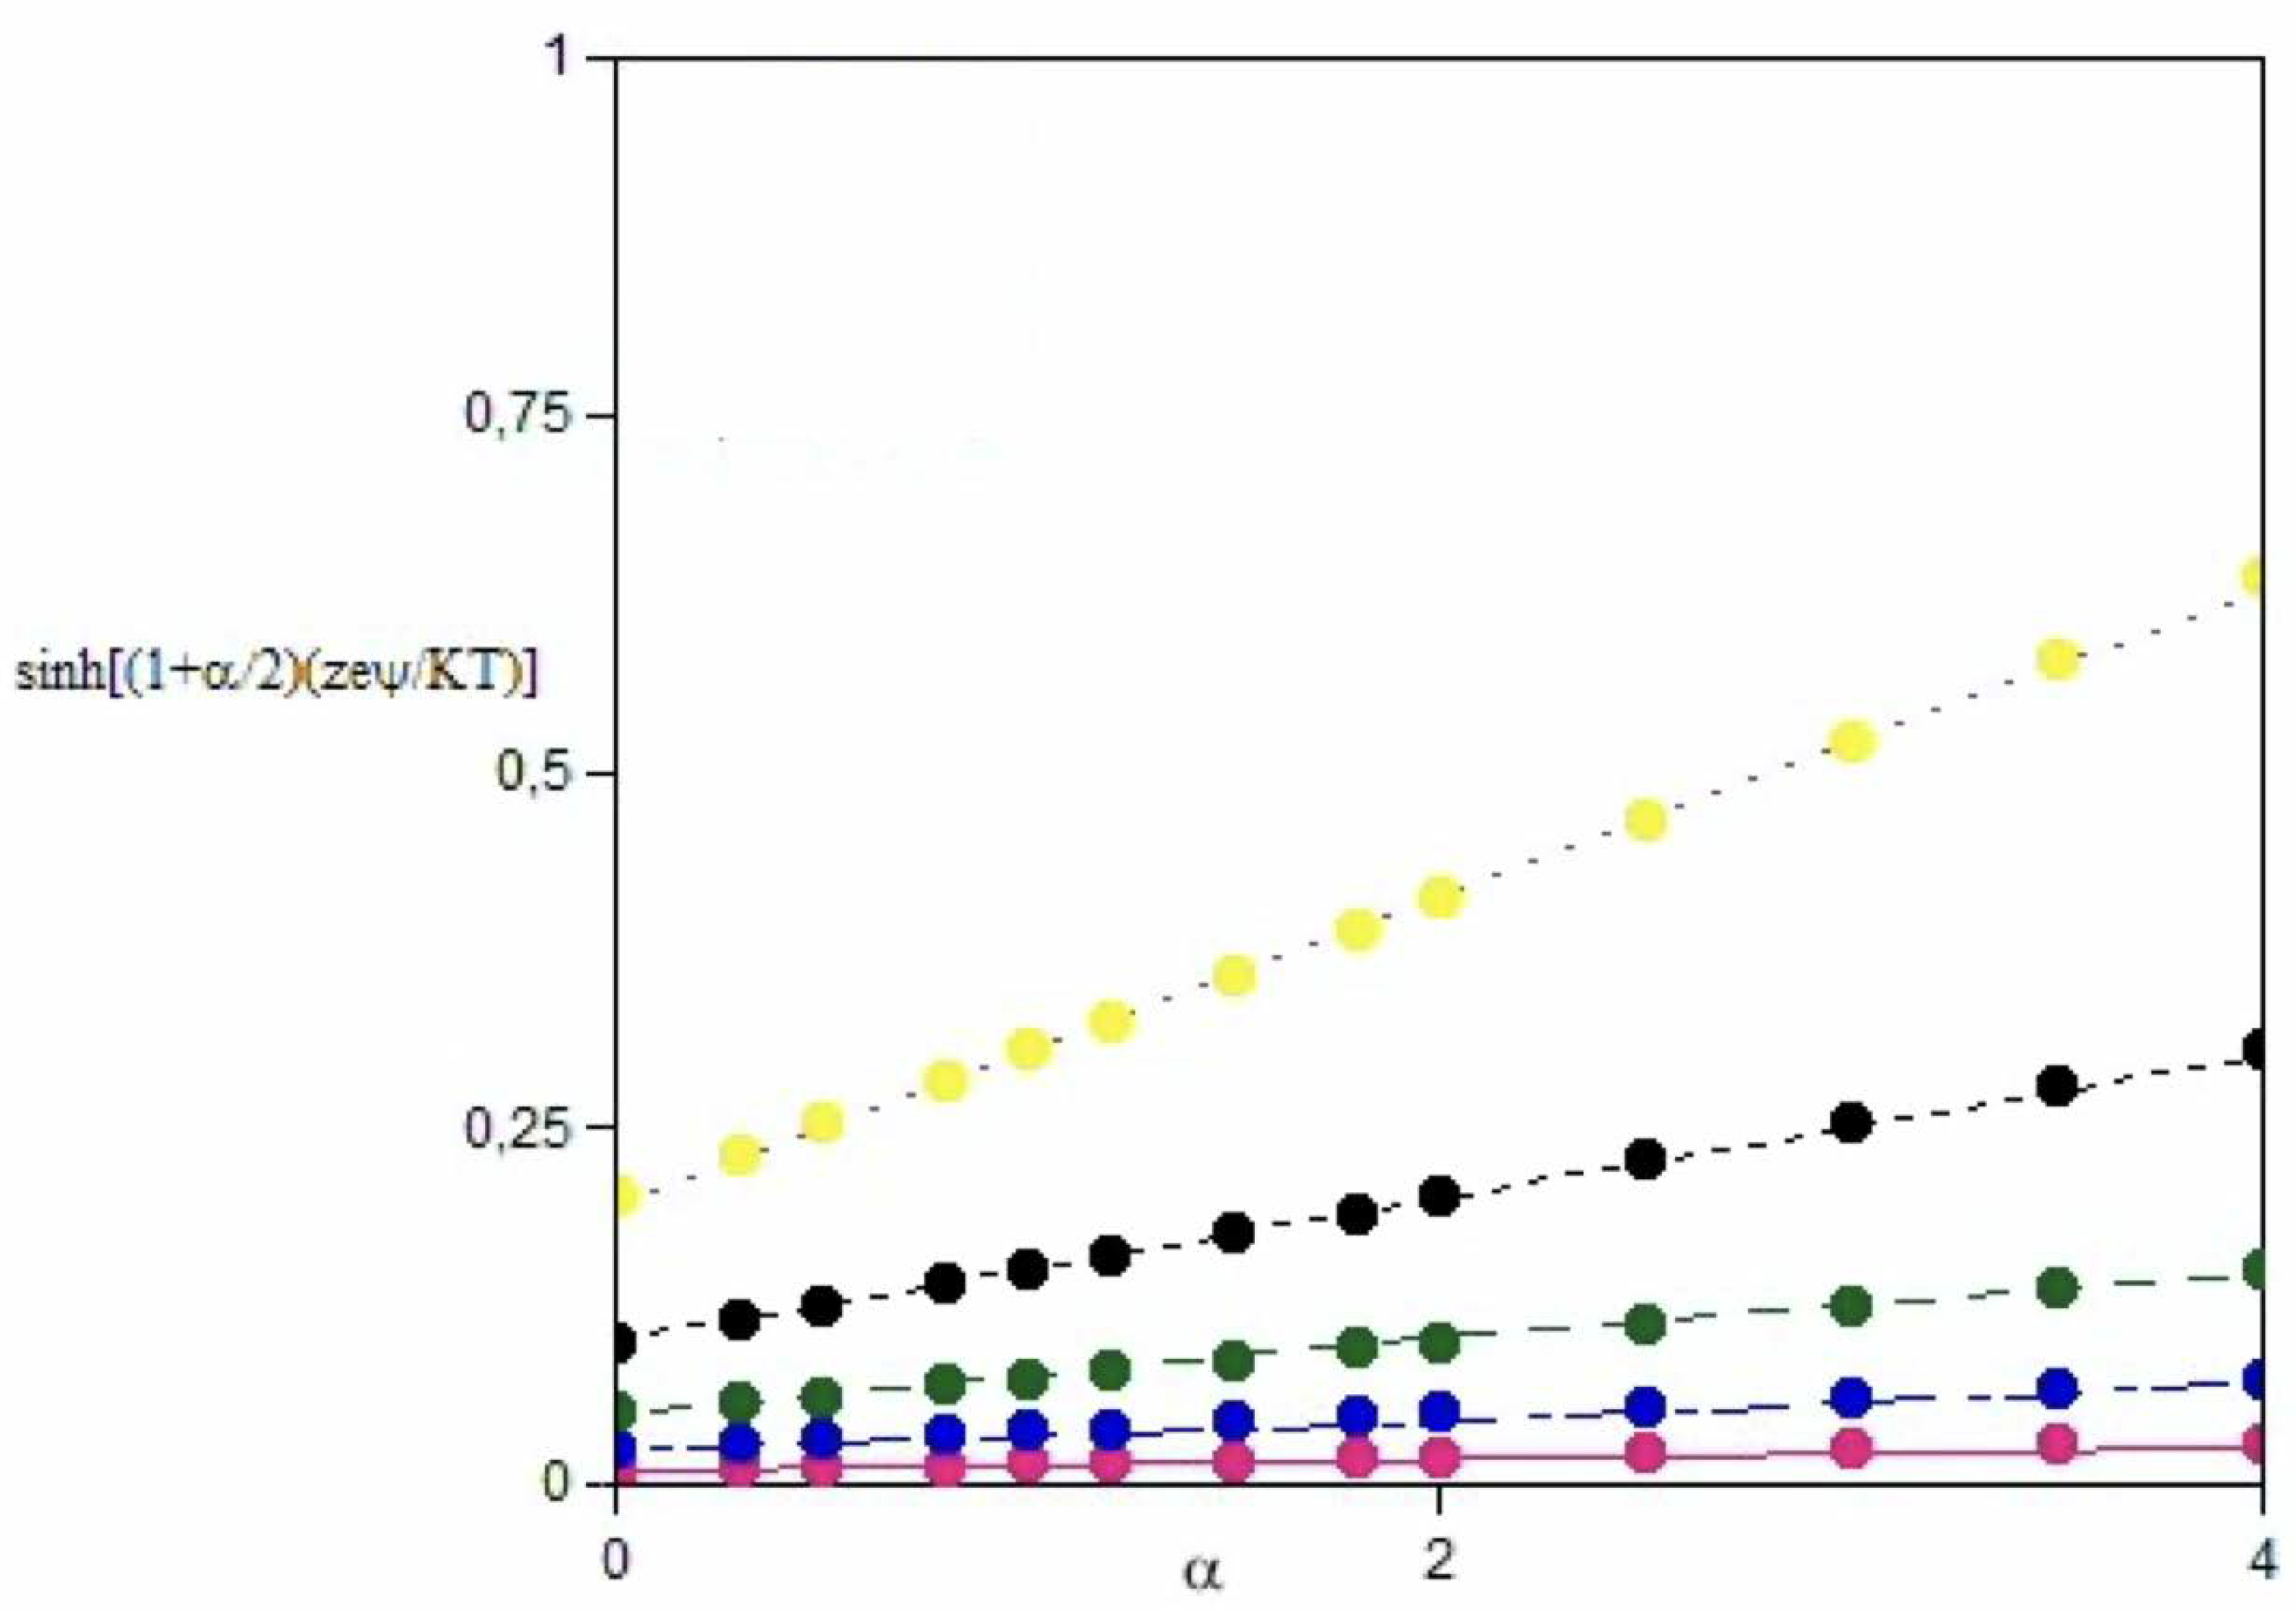
Figure 3.
The hyperbolic components of Equation (6) vs. α when (zeψ/KT) is 0.30, cyan, 0.50, blue, and 1.00, dark green, at 298.15 K. The uncertainty on values is lower than the symbols’ size. Lines are extrapolated from the lower limits of the functions. Arrows indicate the points above which departures from linearity start to occur.
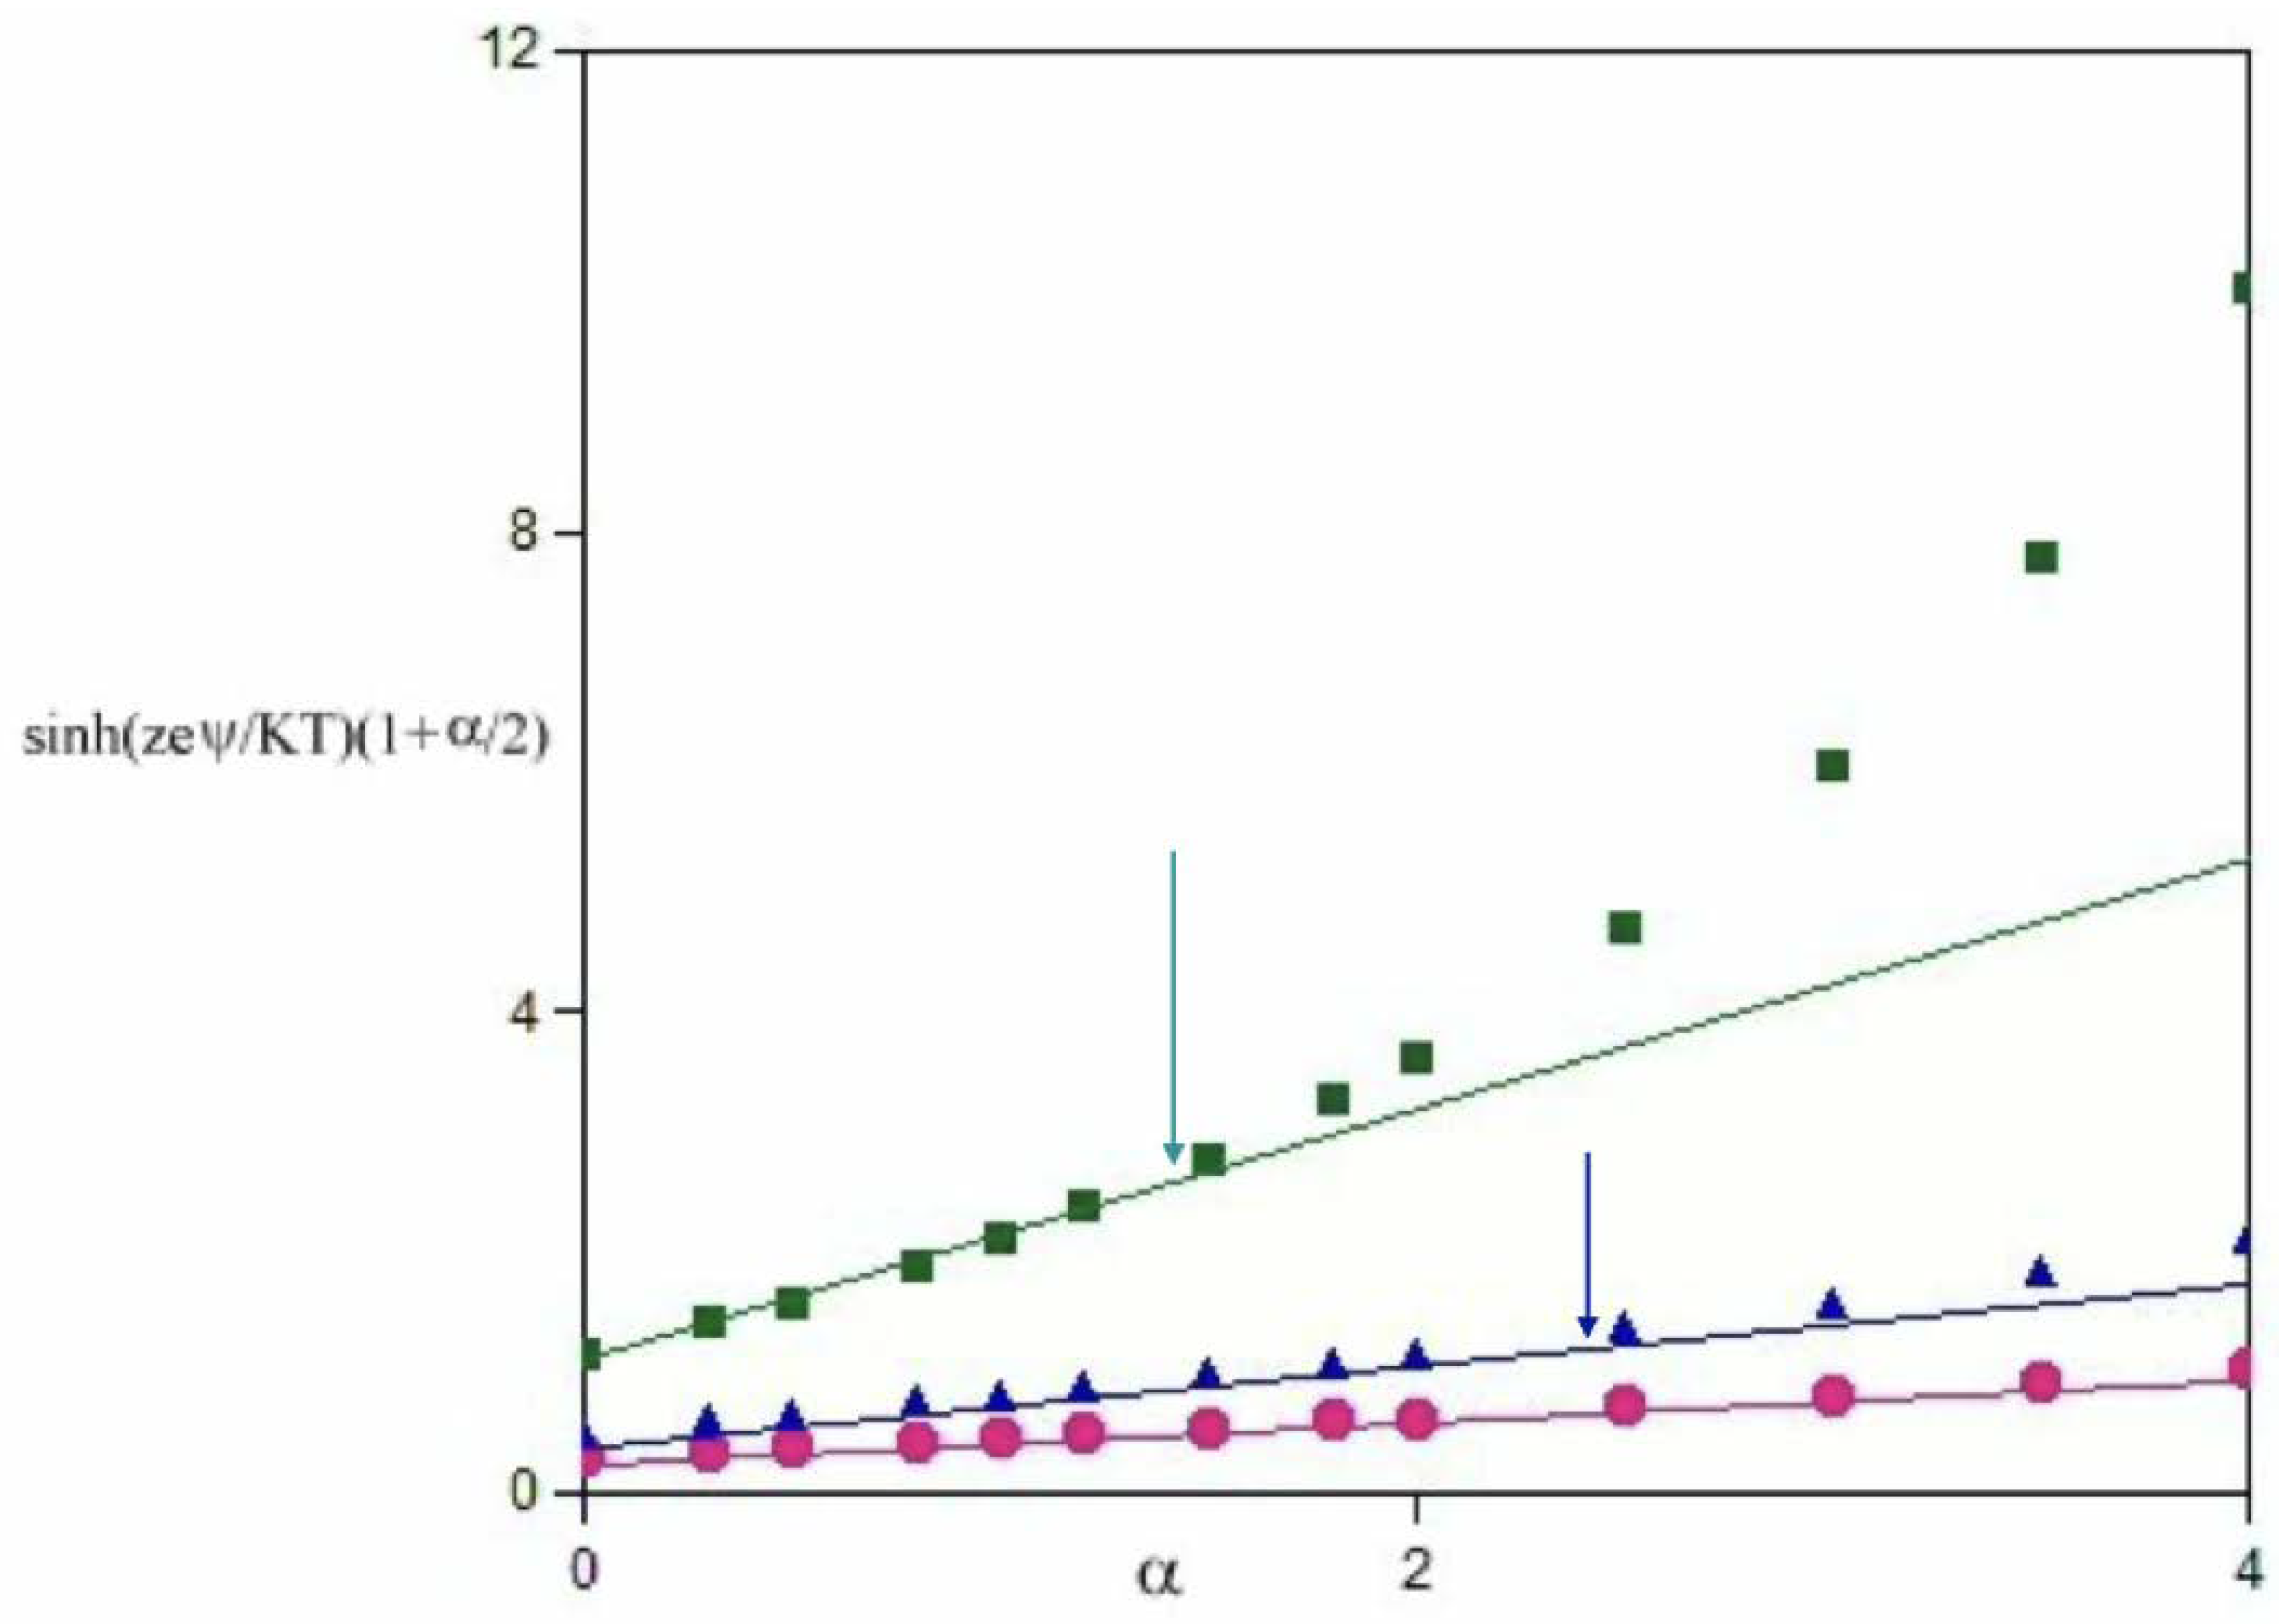
Figure 4.
Diagram of ΔGel (kJ mol−1) vs. α. Values are taken from Refs. [29,30,31,32,33]. The red labeled point refers to ss-DNA/CNT adducts interacting with CTAB-covered TiO2, taken from Ref. [35]. DNA/CNT adducts are rods of average size close to 2–300 nm in length and 40 ± 15 in width.
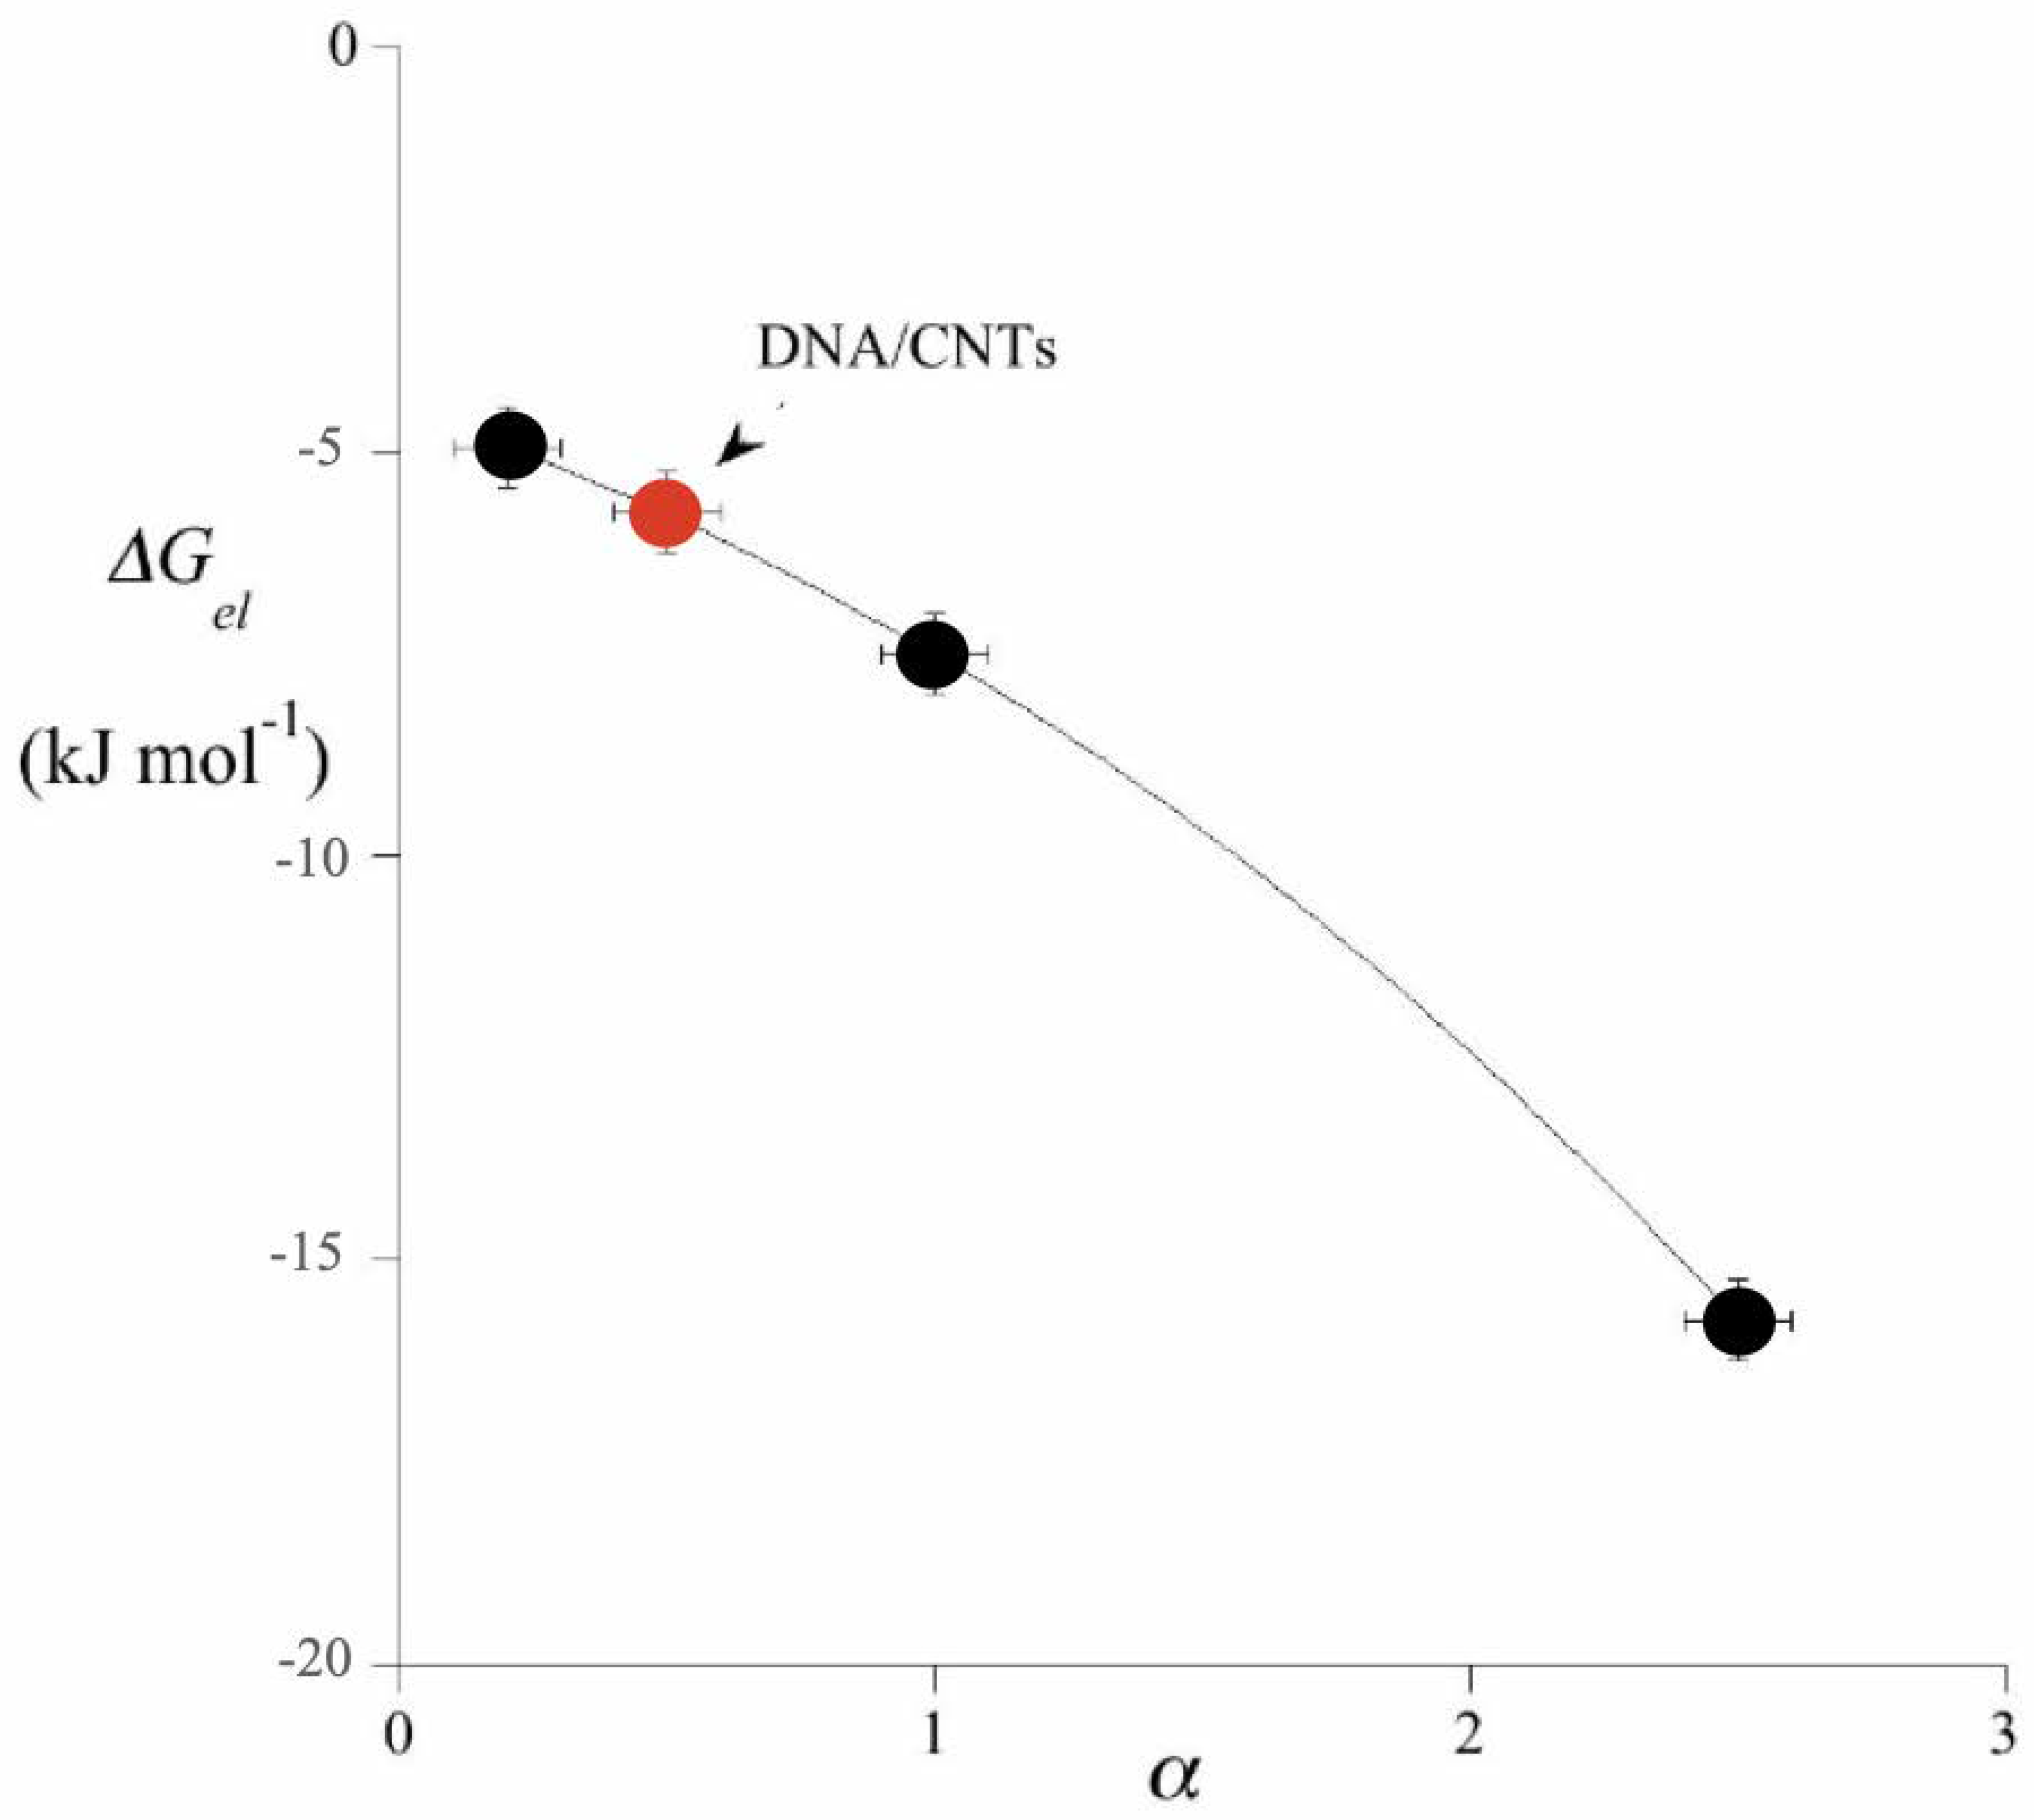
Figure 5.
Titration of a vesicular dispersion, made of a negatively charged 2/1 SDS-CTAB (sodium dodecylsulfate and cetyltrymethylammonium bromide) mixture, of overall content = 8.0 mmol kg−1, with Lysozyme. The process was investigated in spontaneous pH conditions. The ionic strength, I, is fixed. Data are reported as ζ potential (in mV) vs. Lysozyme content. On the left-hand part of the figure, the titration point is indicated, by plotting (dζ/dmmol) vs. the titrand molality. ζ potential changes with continuity in the titration region; the same holds for α values. Data are taken from Ref. [46].
Publisher’s Note: MDPI stays neutral with regard to jurisdictional claims in published maps and institutional affiliations. |
© 2022 by the author. Licensee MDPI, Basel, Switzerland. This article is an open access article distributed under the terms and conditions of the Creative Commons Attribution (CC BY) license (https://creativecommons.org/licenses/by/4.0/).
Share and Cite
MDPI and ACS Style
La Mesa, C. Surface Potentials of Mixtures Containing Oddly Charged Colloids. Coatings 2022, 12, 1715. https://doi.org/10.3390/coatings12111715
AMA Style
La Mesa C. Surface Potentials of Mixtures Containing Oddly Charged Colloids. Coatings. 2022; 12(11):1715. https://doi.org/10.3390/coatings12111715
Chicago/Turabian StyleLa Mesa, Camillo. 2022. "Surface Potentials of Mixtures Containing Oddly Charged Colloids" Coatings 12, no. 11: 1715. https://doi.org/10.3390/coatings12111715
Note that from the first issue of 2016, this journal uses article numbers instead of page numbers. See further details here.