Article

Stress Loss Analysis of a Geotechnical Prestressed Anchor under a Corrosive Environment in a Coastal Area

1
Faculty of Land Resources Engineering, Kunming University of Science and Technology, Kunming 650093, China
2
School of Geography and Land Engineering, Yuxi Normal University, Yuxi 653100, China
3
Key Laboratory of Geohazard Forecast and Geoecological Restoration in Platea Mountainous Area, Ministry of Natural Resources of the People’s Republic of China, Kunming 650093, China
*
Author to whom correspondence should be addressed.
Coatings 2022, 12(11), 1762; https://doi.org/10.3390/coatings12111762
Submission received: 22 September 2022 / Revised: 7 November 2022 / Accepted: 9 November 2022 / Published: 17 November 2022
(This article belongs to the Section Surface Characterization, Deposition and Modification)

Abstract

:
The corrosion of geotechnical prestressed anchor rods directly affects the safety of anchor structure engineering. To this end, an experimental device for measuring the stress loss of an anchor structure was developed, which was used to study the stress loss of a prestressed anchor structure under a corrosive environment, obtain the stress change curve of the anchor structure, and analyze the influence of a corrosive environment on the stress loss of a prestressed anchor structure in coastal areas. The final experimental results show that the degree of stress damage to bolts was determined by the cross effect of the environment and stress, and most of the stress damage occurred in the early stage after loading. The stress loss of the anchor structure resulted mainly from the bond degradation of the anchor section, and partly from the degradation of the elastic modulus of the rod body. Corrosion reduced the bonding force and bolt strength of the bolt–grouting body, and the influence of corrosion on the degradation of bonding strength of the bolt–grouting body was greater than that on the degradation of bolt strength. The maximum degree of axial stress corrosion influence on the rock–soil anchor was 11.6%. When the oxygen concentration was higher, the corrosion rate was greater. Therefore, accelerated corrosion indirectly increases the stress loss of anchor bolts.

1. Introduction

Since the 1960s, anchor bolts have been widely used in geotechnical engineering in China. After the 1970s, anchor cables began to develop. To date, the number of anchor structures has reached hundreds of millions. With the increase in anchor structure applications, the failure problem is becoming more prominent. In the past, in the design of prestressed anchorage structures, people believed that the prestressed anchorage structure was a one-time static system structure, and not much attention was directed toward the impact of durability on the service life of the structure [1].
The designed life of an anchorage structure refers to the ability of the structure to maintain stability and safety for a long time under normal working conditions without being damaged by the external environment. However, there are a large number of cases in which the structure fails before reaching its intended lifespan. During the long-term use of anchor bolt structures, the structure will be corroded due to the action of various complex factors, such as its own defects, environmental factors, and stress states. Due to corrosion expansion, the bonding capacity of the bolt–grouting interface is reduced, leading to the aging of the bolt material, and its ultimate bearing capacity will be reduced. With the synchronous development of bridge construction and highway construction, bolt support and other structures have been widely used [2]. However, some reinforced concrete anchor bolt structures in coastal areas are affected by the harsh marine climate environment and seawater corrosion, resulting in varying degrees of corrosion damage and failure to reach the intended service life. The maintenance, repair, and transformation of anchor bolt structures not only require a large amount of national investment, but also cause inconvenience to traffic and damage to the natural environment [3]. Therefore, the durability of supporting structures in coastal areas has become a focus in the field of bolt research as well as a technical problem of great concern to relevant departments in China.
The anchor bolt contains reinforcement and concrete structures, which are exposed to the open air are directly affected by the surrounding complex environment. The concrete in the anchor bolt will be carbonized. Affected by the salinity of the marine climate, the chlorine salt in the concrete and the sulfate in the marine climate will erode the anchor bolt. These influencing factors will seriously threaten the durability of the anchor bolt [4]. For a long time, people have mainly focused on improving the strength of the bolt concrete while ignoring the requirements for its durability, which results in material deterioration, premature failure, and the collapse of a considerable number of bolt-supporting structures. The analysis of the survey results showed that in addition to the problems in design and construction quality, another main reason for these phenomena is the lack of understanding of the severity of concrete deterioration and reinforcement corrosion caused by marine climate corrosion, which leads to ineffective protective measures, unreasonable technical index control of raw materials, and mixed proportion design. These negative factors greatly reduce the service performance and service life of bolt support. Therefore, it is particularly important to study the durability and mechanical properties of anchor bolts [5].
Research on the durability and mechanical properties of anchor bolts has been carried out for many years abroad, with durability research being an important topic in geotechnical anchorage. However, the research progress on the durability and mechanics of anchor bolts in China is relatively slow. In general, the design and evaluation criteria for the long-term performance of anchor structures have not been updated for a long time. The environment of anchorage structures is complex, and their durability is affected by many factors [6]. Corrosion of reinforcements is a common aging phenomenon in prestressed anchor cable structures that can damage the surface structure of reinforcements and reduce their mechanical properties. In addition, the volume of corrosion products will expand, destroying the bond between the bolt and the grouting body, seriously weakening the service life of the anchor structure [7]. At present, the prestress of some anchor cables exceeds 1000 tons, and there is a trend towards higher tonnage. Many Chinese scholars have performed relevant studies on this issue. Zhu et al. [8] carried out an accelerated corrosion test on reinforcements, and the corrosion results were in good agreement with the performance of the reinforcement after corrosion in practical engineering. The influence of the corrosion on the ductility and mechanical properties of the reinforcement was studied. It was pointed out that when the reinforcement was in a saline environment, the mechanical properties of the reinforcement declined to a level lower than the limit specified in the service code of the reinforced concrete. Wang et al. [9] found that uniform corrosion and uneven corrosion cause significantly different damages on the mortar protective layer. By constructing a model of a corrosion anchor structure, the stress characteristics of the anchor structure under the action of confining pressure, anchoring force, and rust expansion force were analyzed, and the effects of corrosion and corrosion position on the bonding force and bearing capacity of the anchor bolt were studied. Finite element analysis was carried out using ANSYS software. Targeting the shortcomings of the existing methods, a durability evaluation method for a corroded anchor based on a fuzzy equivalent relationship was established. Tian et al. [10] carried out an axial fatigue tension test under accelerated corrosion of reinforcement structures. Combining their findings with theoretical research, they found that the service life of the reinforcement was reduced under the joint action of fatigue and corrosion, and the relationship between stress and fatigue life was logarithmic. With the progress of corrosion, the attenuation of the fatigue curve can be divided into three stages: the rapid increase stage, slow increase stage, and sudden increase stage. Foreign scholars have also carried out significant research on this problem. Mokhtari et al. [11] studied the mechanism of steel-bar rust expansion force based on the knowledge of elasticity and put forward its calculation formula under the condition of uniform corrosion. At the same time, the influence of various influencing factors on rust expansion force was also analyzed. The degree of influence of the corrosion rate, concrete grade, and reinforcement diameter on the rust expansion force and the final value of the rust expansion force upon the expanding and cracking of the concrete cover was obtained. Takase [12] comprehensively studied the rust expansion fracture and crack development law of a reinforced concrete under the action of various influencing factors through an accelerated corrosion test. It was found that each factor had a different effect on the cracking time of rust expansion. The degree of influence was obtained, the specific influence mechanism of each factor was given, and the measures to improve the durability of the reinforced concrete structure were put forward. Kumar et al. [13] established a finite element model based on an extended finite element method and the finite element software ABAQUS. They simulated the rust expansion and cracking of concrete when the reinforcement was non-uniformly corroded. It was found that the adopted model could accurately simulate concrete cracking and crack propagation. The grade of concrete and the thickness of the protective layer had an impact on the occurrence of the rust expansion cracks. Increasing the grade of concrete and the thickness of the protective layer improved the durability of the structure.
For the above damage detection and evaluation methods for reinforced concrete structures, the damage to reinforced concrete structures is not taken into account when they are used in a corrosive environment. To this end, this paper presents a stress loss analysis of prestressed rock and soil anchors in a corrosive environment. In the experiment, a pultruded B-GFRP (B-Fiberglas Fiber Reinforced Plastic) steel bar with good tensile strength and a diameter of 28 mm produced by Guangdong Zhongshan Pumei Composite Materials Co., Ltd. (Zhongshan, China), was selected. In the sensor layout, seven pairs of fiber Bragg grating sensors were arranged symmetrically. The specimen load was applied in stages, and an over-tensioning method was innovatively used to compensate for the prestress loss. Before loading the anchor bolt, we ensured the anchor bolt system was completely straight and in close contact with each part to relieve the uneven stress on each part during the tensioning process. By changing the pH value of the immersion solution, an erosion environment mimicking coastal corrosion conditions was constructed. The contribution of this paper lies in the in-depth analysis of the influencing factors and the stress loss rules of a bolt, which provides a theoretical basis for the damage detection and evaluation of reinforced concrete structures in the future.

2. Materials and Methods

2.1. Anchor Rod Materials

The reinforcement used in this experiment was a pultrusion B-GFRP reinforcement with a diameter of 28 mm produced by Zhongshan Pumei composite material Co., Ltd., in Guangdong Province. Table 1 shows the material composition and basic mechanical parameters.

2.2. Experimental Instruments

The loading device used in this experiment was a hydraulic hollow jack. The load-measuring devices included an XYZ three-string anchor cable dynamometer produced by Dandong Qiangong Instrument Co., Ltd. (Dandong, China), and a vibrating string readout produced by Changzhou Golden Civil Engineering Instrument Co., Ltd. (Changzhou, China). The rod-strain-measuring device included a distributed fiber Bragg grating sensor produced by Shenzhen Changge photoelectric Co., Ltd. (Shenzhen, China) [14], and anSM125 fiber Bragg grating demodulator produced by MOI Co., Ltd. (Tokyo, Japan).

2.3. Sensor Layout

The anchor bolt surface was symmetrically grooved along the axis, forming a cross-section of 2 mm × 2 mm. There were7 pairs of fiber Bragg grating sensors. The notch of the solution tank was cleaned with alcohol and air-dried. The fiber Bragg grating was symmetrically arranged in three sections from the anchor head to the slot along the anchor rod, and the outside of both ends was bonded and fixed in the slot with 502 glue (produced by Beijing Chemical Works Co., Ltd., Beijing, China). The position of the grating sensor was calibrated in the bar body, with a slight pretension, and the entire tank was filled with anti-corrosion epoxy resin adhesive when the sensor strain was small. It took 24 h to fully cure the epoxy adhesive. To prevent the sensor from accidentally breaking or falling off, we did not move the test piece during curing [15].

2.4. Anchor Rod Test Sample and Anchorage

The experimental samples were divided into three groups, as shown in Figure 1.
Twenty-two common anchor bolts with equal strength were selectedand cut into 400 mm-long samples. To facilitate the experiment, the following processes were carried out. After installation of the fiber Bragg grating, AB glue (SIRNICE AB adhesive Epoxy structural produced by Guangdong Sirnice Industrial Co., Ltd., Guangdong Province, China) was used to bond the reinforcement with a positioning ring. Then, the anchor rod was extended into the steel casing andthe bonding reagents were mixed evenly with stirring and then poured into the steel casing from one end. Finally, a sealing ring was installed at the end, and apositioning die was added. In order to prevent the adhesive from affecting the performance of the reinforcement due to exothermic heat during curing, a wet cloth was wrapped outside the steel casing for cooling, followed by spraying water intermittently. The end positioning die was removed after curing for 24 h. The process of anchoring the other end of the anchor rod was the same. After the fabrication of the test piece, the test piece was cured indoors, and the curing time of the test piece was no less than 15 d.

2.5. Experimental Scheme

2.5.1. Simulation Test under Corrosion Environment

During the experiment, the test pieces were immersed in three solutions with different pHs to simulate marine climate corrosion. Neutral distilled water was used as the control group for test piece B; specimen C was a weak alkaline solution simulating conventional seawater, and specimen A was a NaOH solution with a hydroxyl ion concentration of 1 mol/L, which was used to simulate a strong alkaline solution, accelerating corrosion. The pH value of the solution was monitored by METTLER FE28 pH meter (METTLER is a bench-top acidity meter produced by Mettler-Toledo Technology (China) Co., Ltd. in Shanghai). The oxygen flowmeter was set to 1512 L/H. The Mettler desktop pH meter is compact in design and equipped with multiple transmission interfaces, being able to realize fast and accurate measurement of pH or conductivity. Table 2 lists the experimental specifications of each specimen.

2.5.2. Loading and Measuring Method

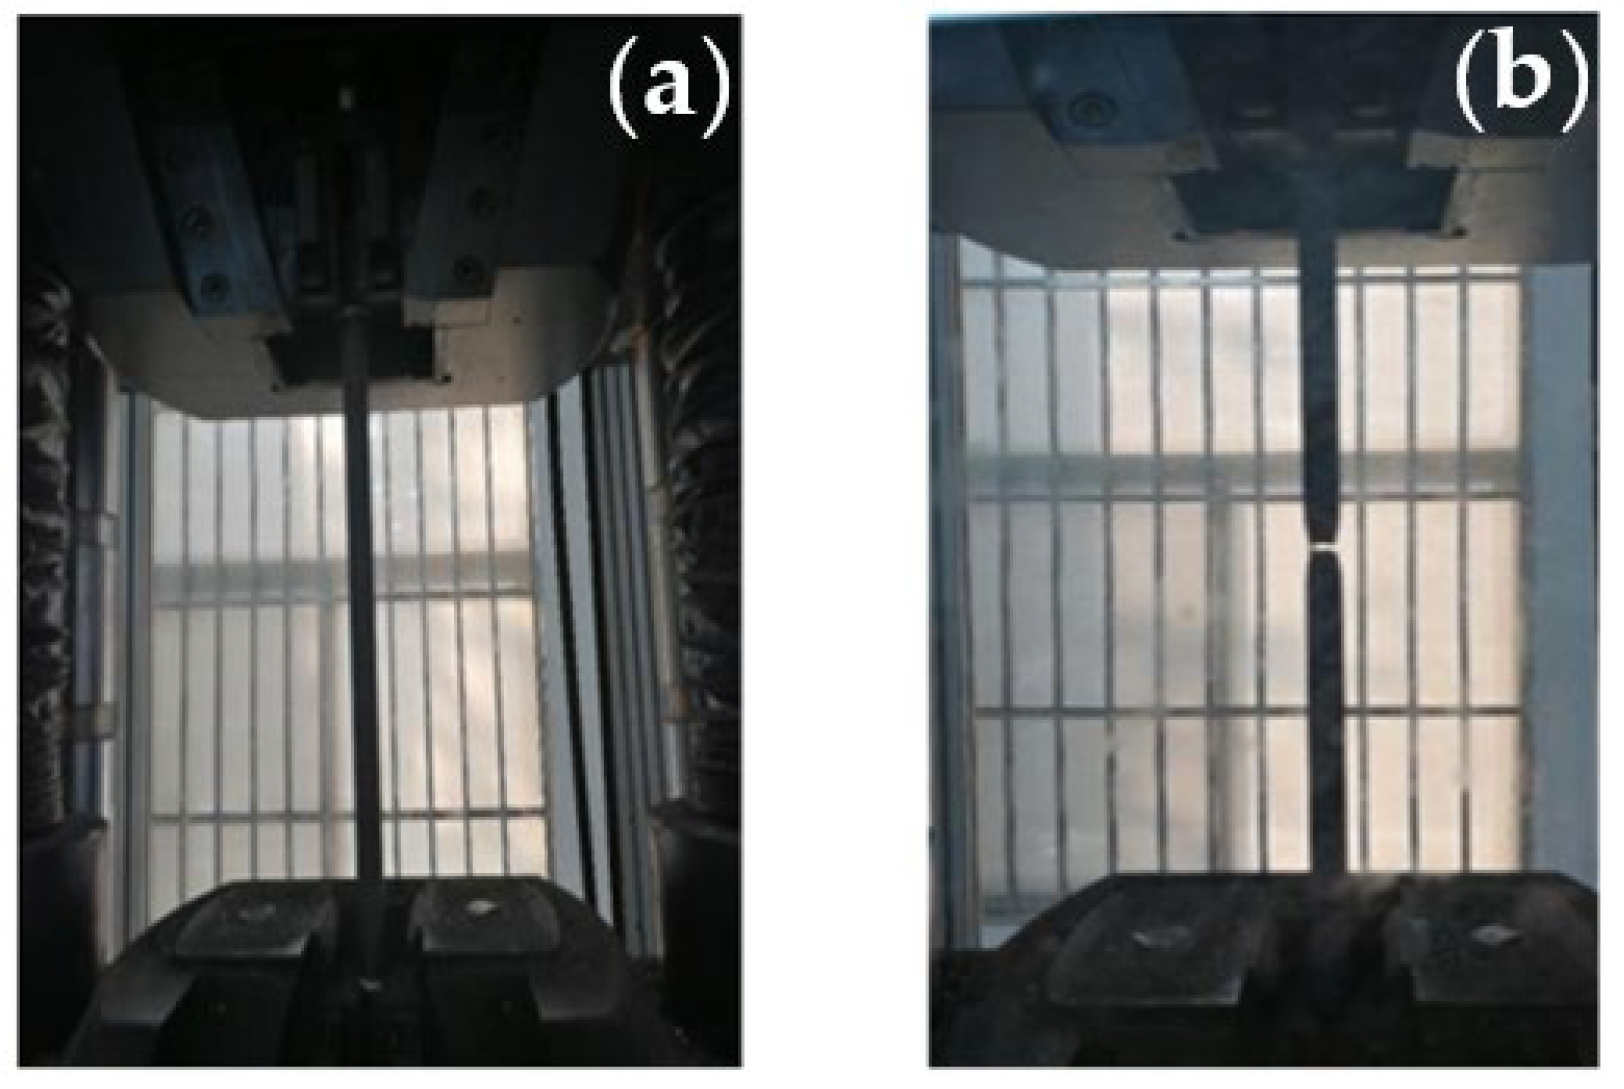
A specimen load was applied instages, and anover-tensioning method was used to compensate for the prestressed loss. The over-tensioning load in this experiment was 1.1 times that of the design load. The designed tensile value of the anchor boltswas 100 kN and 160 kN. According to the specification, the loading sequence was 0.1, 0.2, 0.4, 0.7, 1.0, and 1.1 times that of the design value. The stabilization time of each level of load was based on the standard that the change rate of the dynamometer reading was less than 2 kN/h. When it was less than this value, the reading of the anchor cable dynamometer and the grating wavelength under this level of load were measured and recorded before observing the experimental phenomenon and carrying out the next step of loading. The loading speed in the experiment was 50–100 kN/min. The tensile test process is shown in Figure 2.
Before the anchor bolt was loaded, the anchor bolt was pretensioned 1–2 times by applying a load that was 0.1–0.2 times that of the design value, so that the anchor bolt system was completely straight and all parts were in close contact, so as to alleviate the uneven stress onall parts in the tensioning process [16]. After the load was locked, when the change rate of the dynamometer reading was less than 2 kN/h, the anchor cable dynamometer’s numerical reading and fiber Bragg grating’s wavelength value were recorded, and data werecollected regularly. The measuring frequency was high in the early stage but low in the later stage.

2.5.3. Stress Loss Experiments of The GFRP Bolt Structure under Different Erosion Environment

By changing the pH value of the soaking solution, the erosion environment will bechanged. Through comparison, the degree of influence of different erosion environments on the stressloss of the prestressed anchor bolt structure was obtained. The stress loss rate is defined as the ratio of the stress attenuation value to the initial stress level at a certain time, which can becalculated according to Equation (1) [17]:
r = ( Δ σ ÷ σ p e ) × 100 %
where r represents the stress loss rate and Δ σ represents the initial stress level; σ p e represents the stress attenuation value at a certain time.

2.5.4. Stress Loss Experiments of Prestressed Anchor Structures under Different Load Levels in Alkaline Environment

In an alkaline environment, the influence law of load grade on the stress loss of the prestressed anchor structure wasobtained by changing the load grade.

2.5.5. The Influence of Corrosion Degree on Bolt Stress

C R was used to characterize the corrosion degree of the anchor, which is expressed by Equation (2):
C R = [ ( M 0 M ) m 0 l ] × 100 %
where M 0 is the mass of the anchor rod before corrosion, M is the mass of the anchor rod after removing corrosion products, m 0 is the mass of the anchor rod per unit length, and l is the anchorage bonding length.
The maximum axial stress change and corrosion influence degree of the anchor rod under different corrosion degrees are expressed as follows in Equation (3):
ω σ = [ ( σ max 0 σ max C R ) ÷ σ max 0 ] × 100 %
where σ max C R is the maximum axial stress on the anchor rod body when the corrosion degree is C R , and σ max 0 is the maximum axial stress on the anchor rod body when it is not corroded. From the experimental results, the relationship between the maximum axial stress on the geotechnical prestressed anchor and the corrosion degree is fitted: σ max = 0.948 e 0.028 C R , r 2 = 0.9927 . The maximum shearstress corrosion influence degree ω τ  is defined as follows in Equation (4):
ω τ = [ ( τ max 0 τ max C R ) ÷ τ max 0 ] × 100 %
where τ max C R is the maximum shear stress on the grouting body when the corrosion degree is C R , and τ max 0 is the maximum shear stress on the grouting body when it is not corroded. From the experimental results, the relationship between the maximum shear force and the corrosion degree of the geotechnical prestressed anchor is fitted: τ max = 14.16 e 0.0238 C R , r 2 = 0.9876 .

2.5.6. The Prestressed Anchor Cable Is Buried in the Rock and Soil

Due to the difference in thedegree of porosity and permeability of rock and soil, there weredifferent degrees of oxygen in the gaseous state and that dissolved in underground water. Moreover, due to the construction defects of the prestressed anchor structure, the anchor barwas in direct contact with the geotechnical environment, which easily led to serious local corrosion. Therefore, it is of great practical significance to study the influence of environmental oxygen concentration on corrosion. The influence of environmental oxygen concentration on corrosion was studied by setting the oxygen flow rate to 0, 0.05, 0.09, 0.13, and 0.17 L/min.

3. Results

3.1. Overall Stress Loss Characteristics of thePrestressed Anchor Rod

Table 3 shows the data at the main timenodes.The stress loss (unit: MPa) of the samples at 90 days and 360 days after load docking was selected for observation, and the test results wereanalyzed after the stress loss rate was calculated based on the initial value.
It can be seen from Table 3 that test piece A and test piece C were placed under alkaline environmental conditions. The initial stress ontest piece A was about twice that ontest piece C. Based on the total stress loss rate data in Table 3, the stress loss rate caused by the bond degradation of the rod body in the anchor head section of the anchor bolt was obtained. After 360 days of load locking, the stress loss rate of test piece A was greater than that of test piece C. Therefore, the higher the initial prestress level was, the greater the stress loss rate was. Table 3 also shows that the initial stress level of test piece A was slightly lower than that of test piece B, but there was a great difference in environmental conditions. After 360 days of load locking, the stress loss rate of test piece A was greater than that of test piece B. Therefore, with the change in environment conditions, the influence of the stress level on stress loss changed, resulting ina greater difference in the stress loss rate.
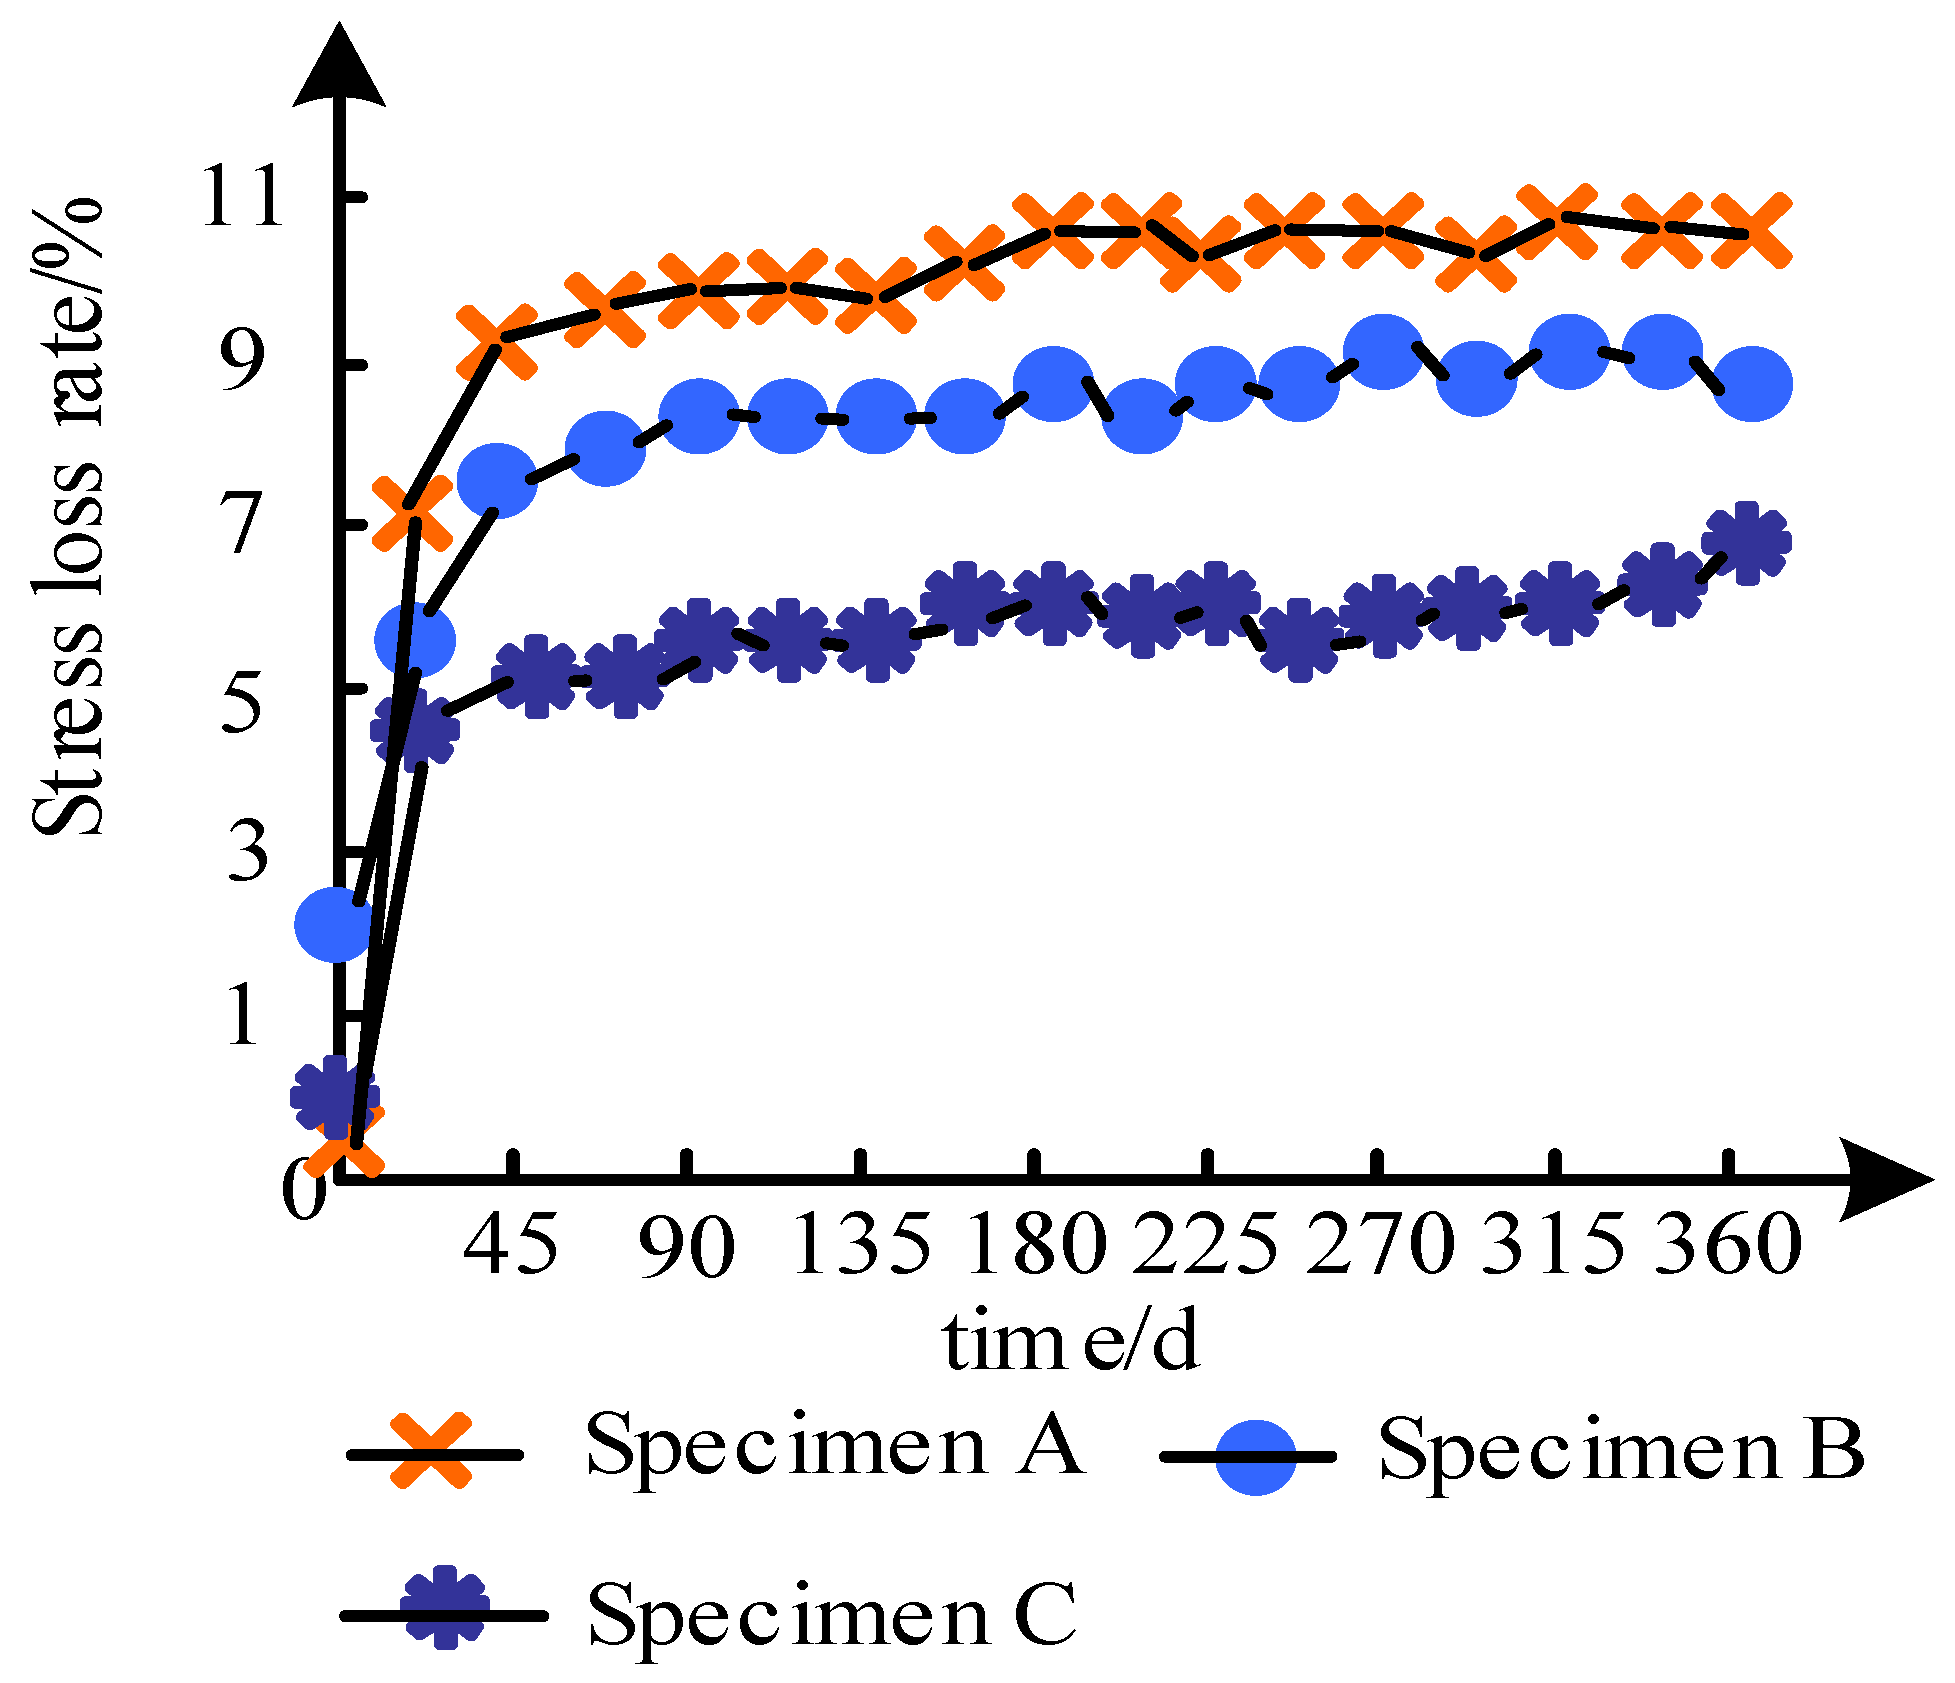
Figure 3 shows the time–history curve of the overall stress loss rate of the anchor structure.
Figure 3 shows that the stress loss rate tendedto be stable after 90 days. Under the same environmental conditions, the stress loss rate underthe high initial stress level was larger. Under the same load, the stress loss rate in the alkaline corrosion environment was larger.
To sum up, most of the stress loss of the bolt structure occurred within 90 d (early stage) after loading. Under the same alkaline corrosion environment, the greater the initial load was, the greater the stress loss was. Under the same load, the stress loss of the prestressed anchor structure in the alkaline corrosive environment was greater than that in the non-corrosive distilled water environment, and the corresponding stress loss rate was also greater. Compared with load, the corrosive environment hada greater effect on the stress loss of the bolt structure.

3.2. Variation inElastic Modulus of the Anchor Rod

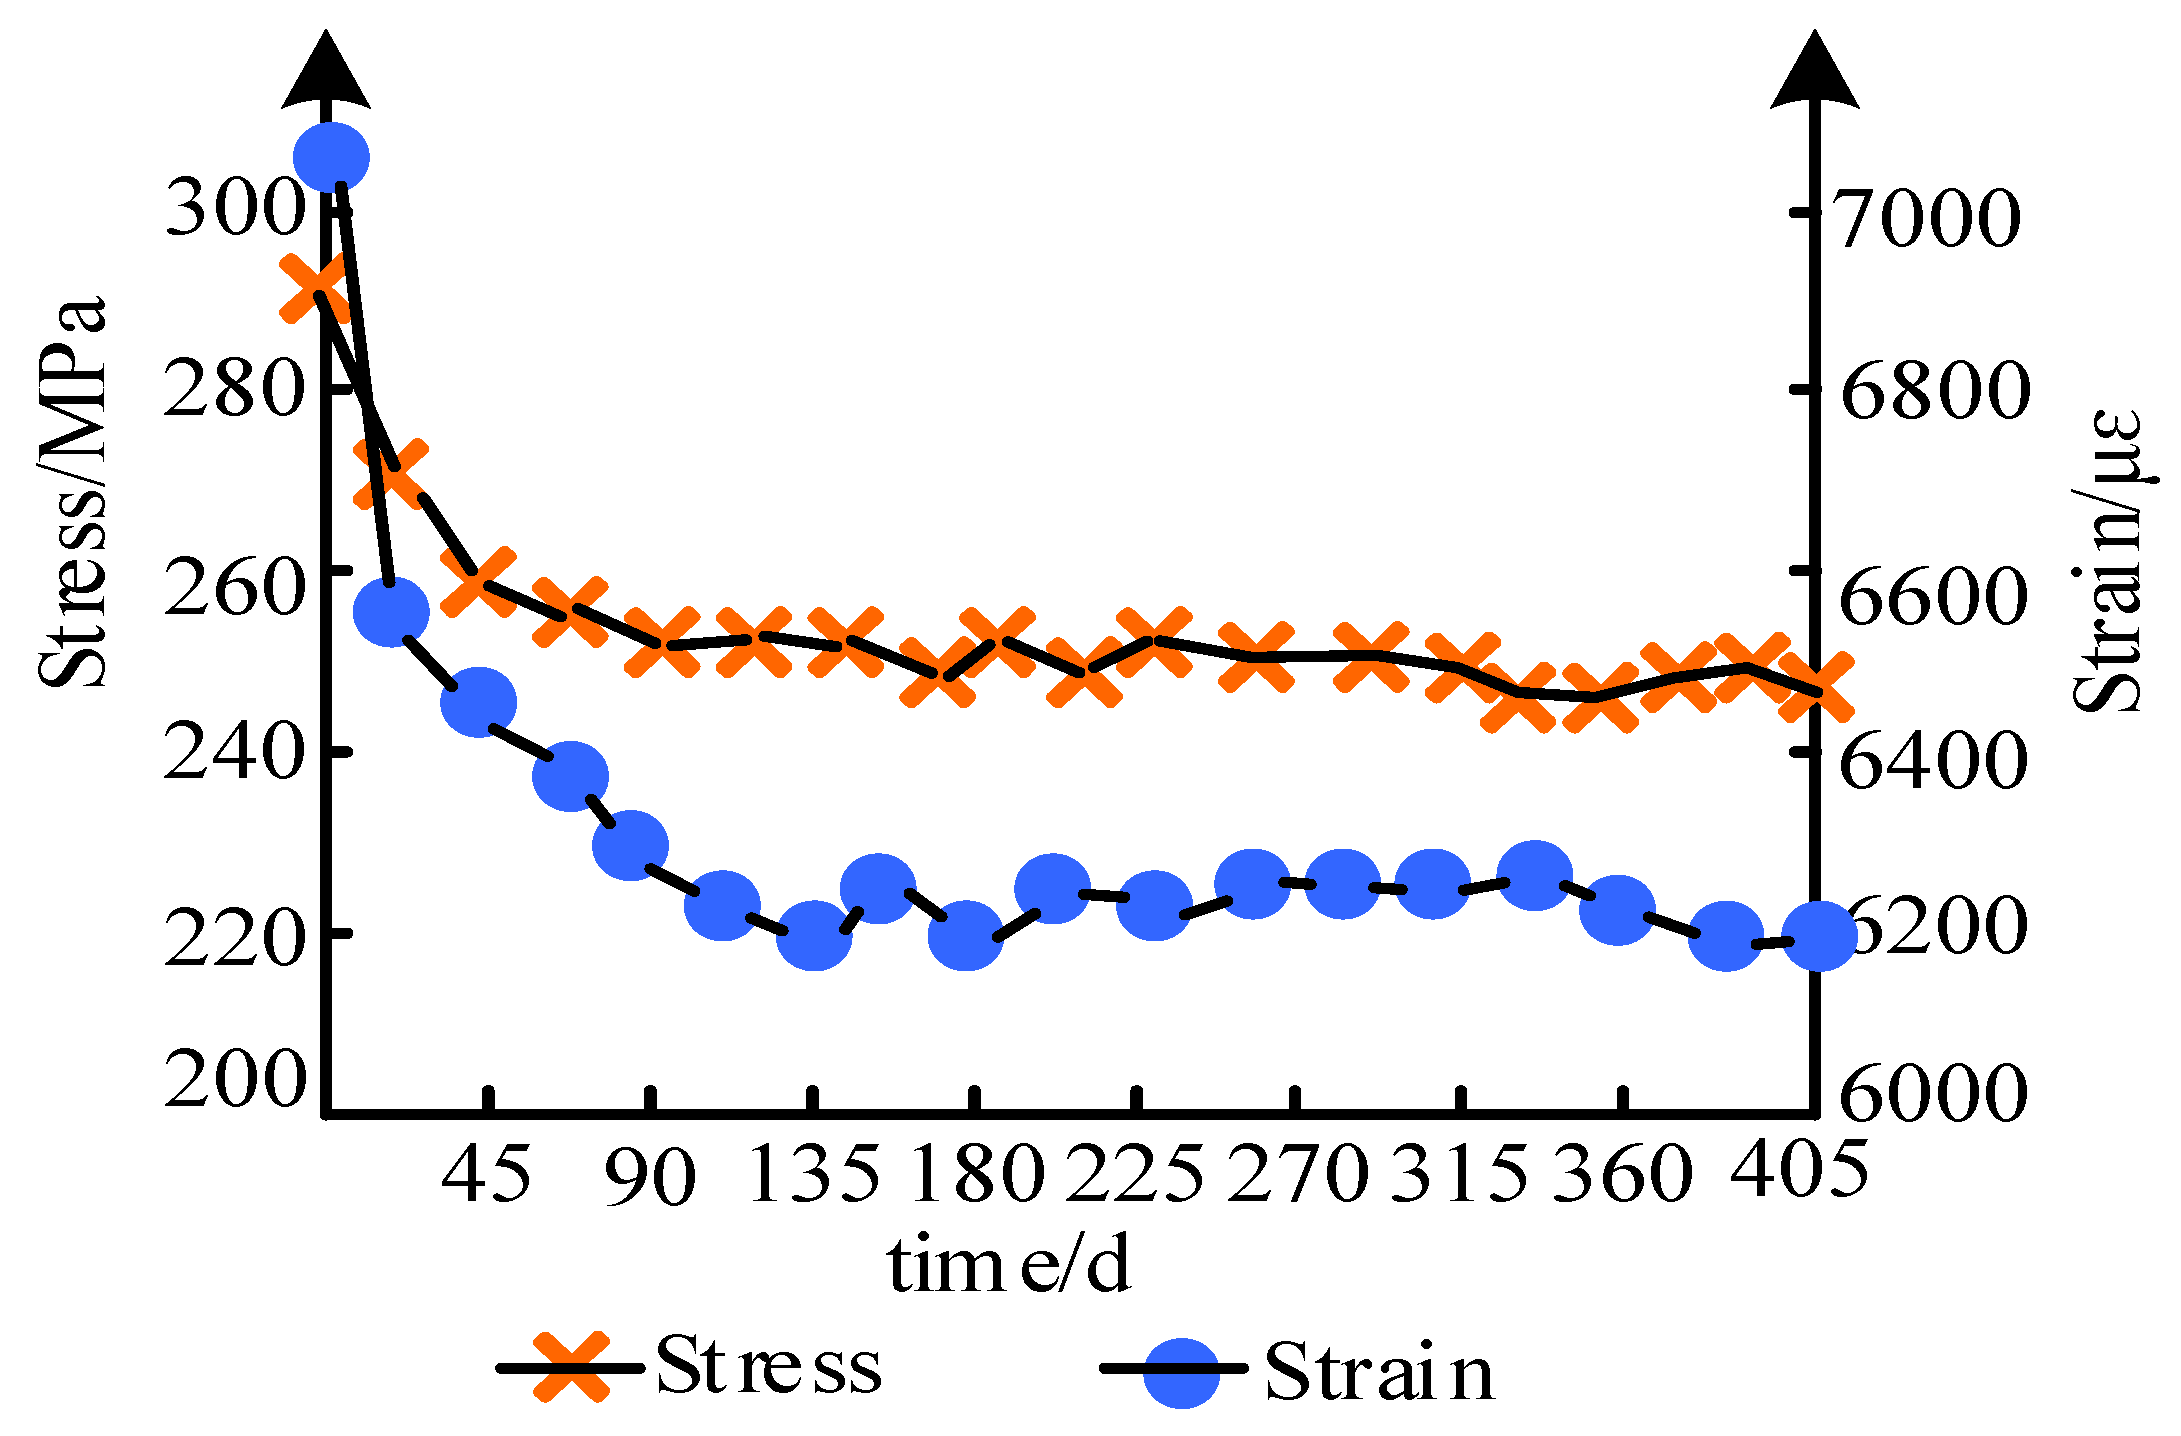
Figure 4 shows the time–history stress–strain curve of the prestressed anchor rod of sample A in the alkaline corrosion environment with pH = 14. Since the results forsample B and sample C are similar to those for sample A, they are not shown in this paper.
According to the changes instrain and stress in Figure 4, the stress–strain curve of the anchor rod body at anytime can beobtained. Figure 4 shows that the most effective duration of the strain attenuation process was 225 d. This is because the solution erosion affected the synchronization effect between the grating sensor and the rod body, and the strain data were distorted for a longer period of time. For the three specimens, the strain data of the anchor rod body in water exhibited a lower degree of distortion.
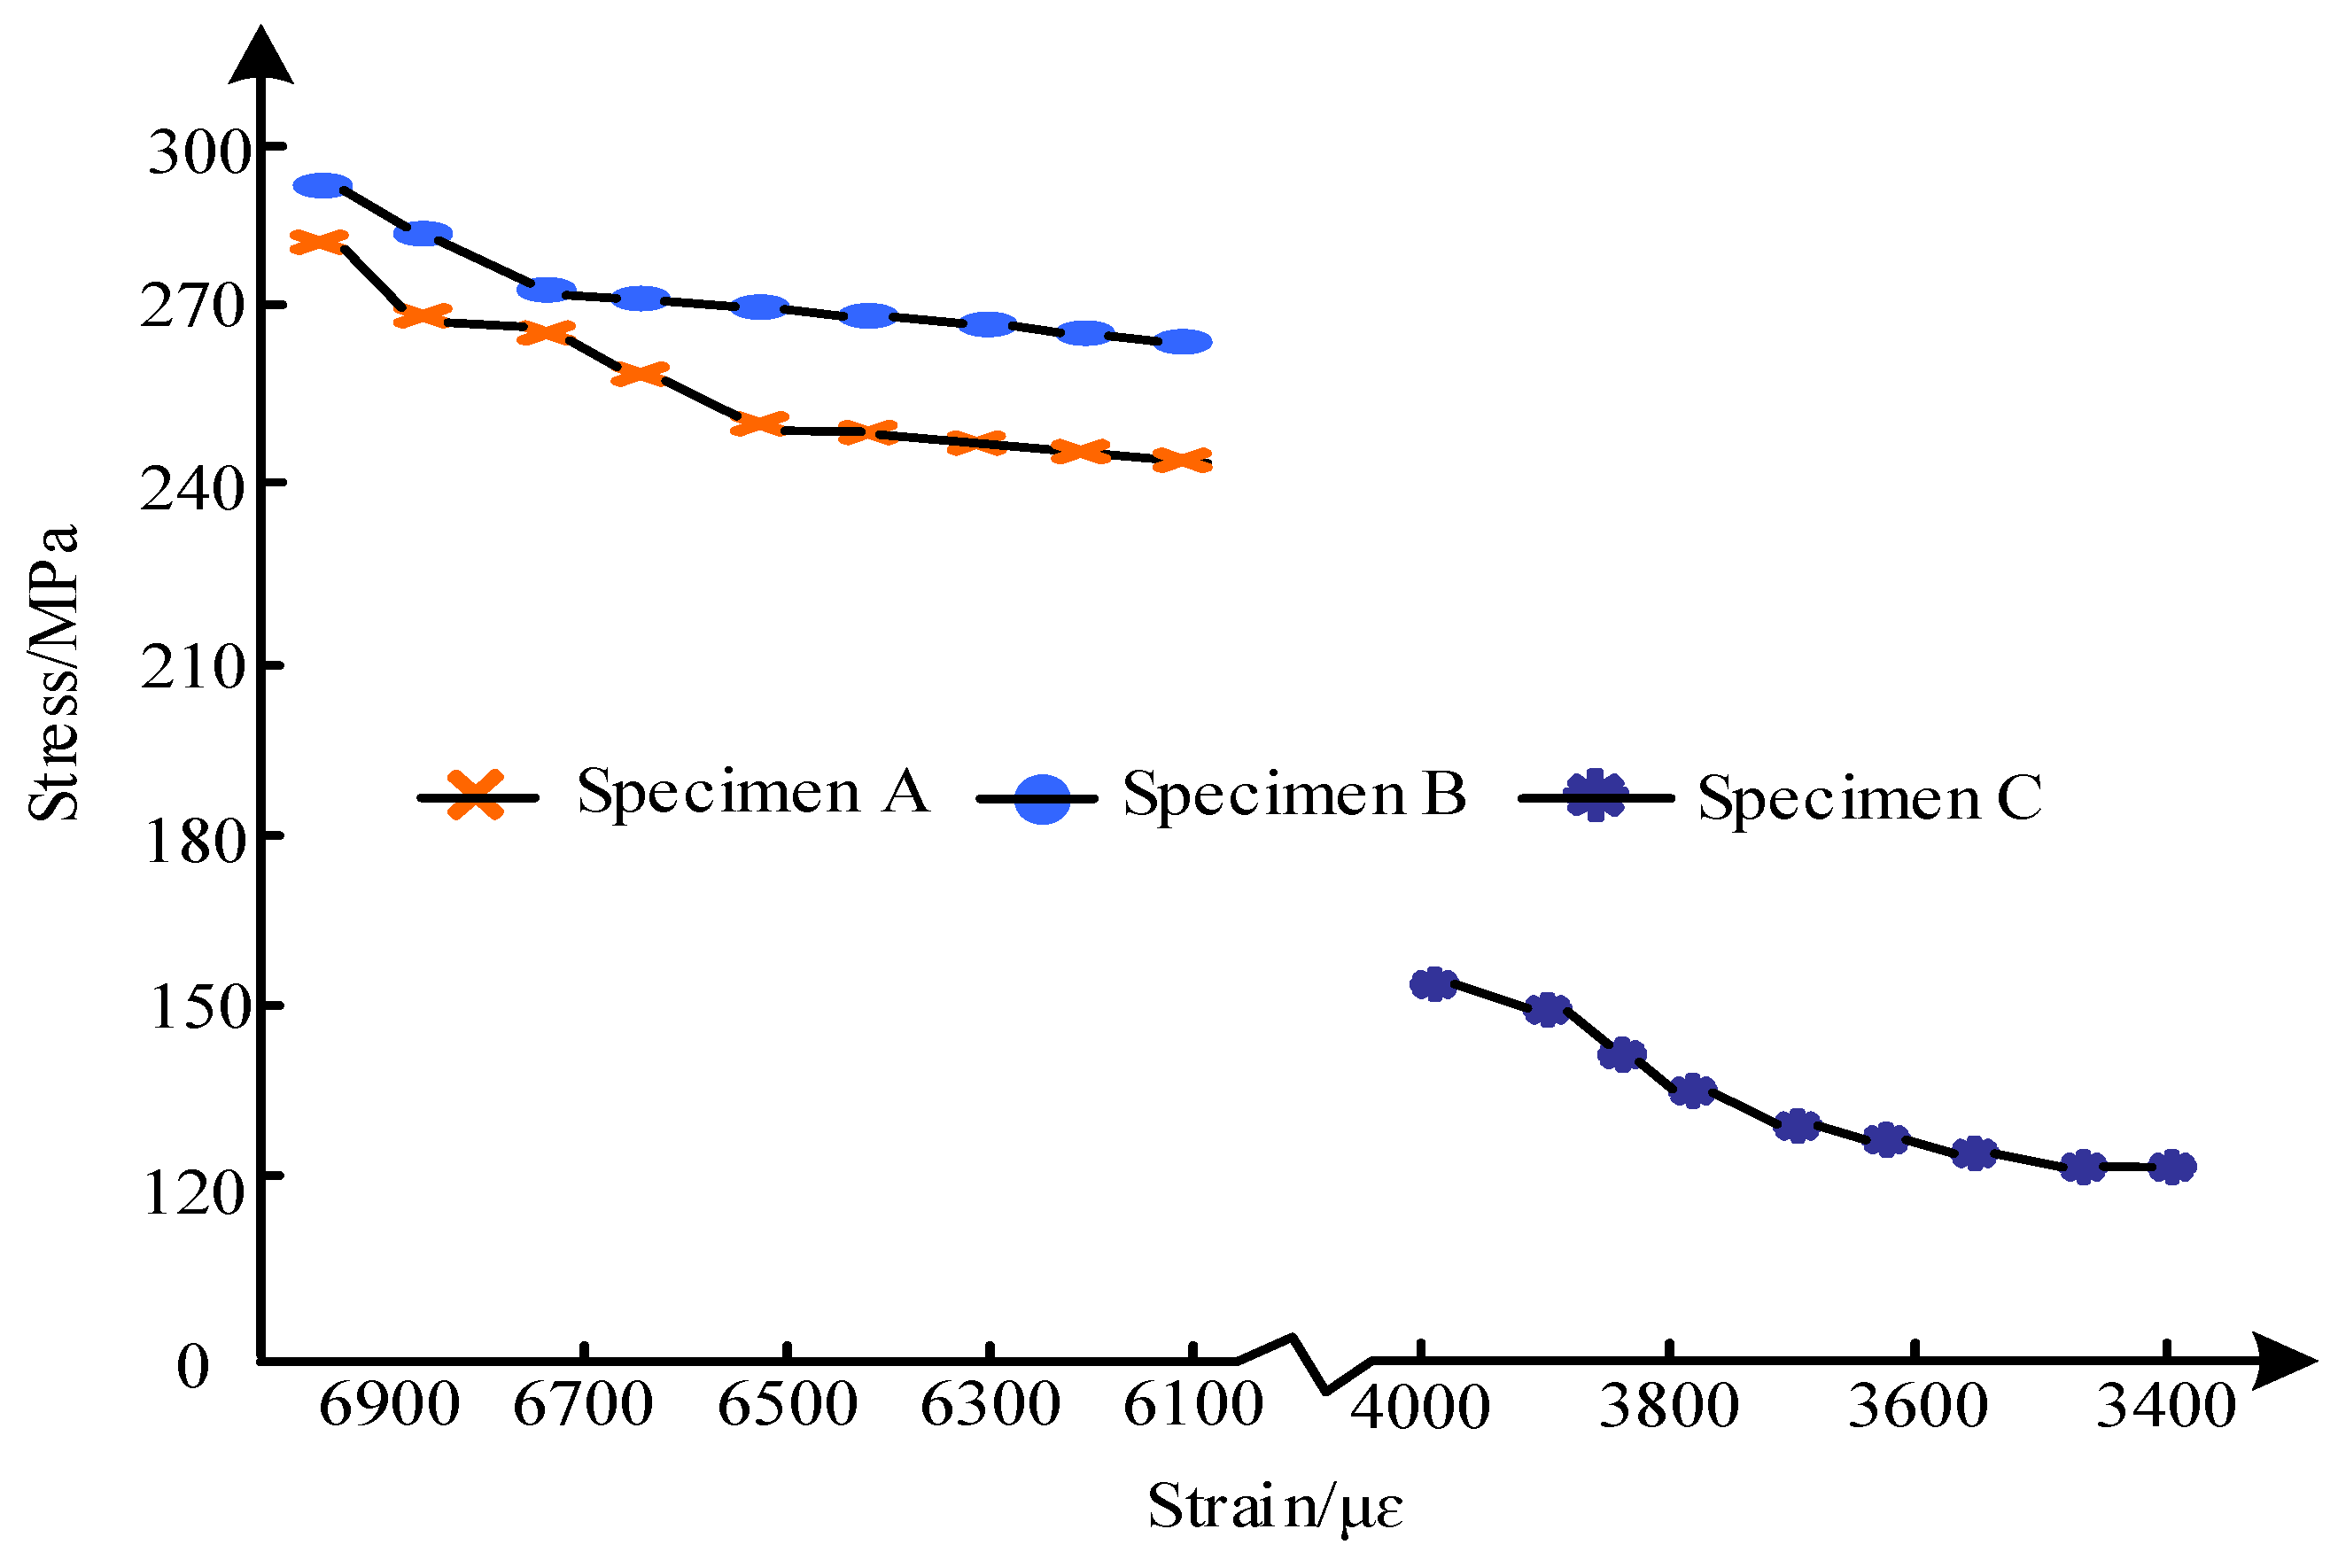
The stress–strain curve of the bolt specimen is shown in Figure 5.
Figure 5 shows that the stress–strain curve of the bolt specimen, that is, the elastic modulus of the rod, changed during the stress process. The stress–strain of specimen A and specimen B decreased to around 245 MPa, while that of sample C decreased to 126 MPa. The time–history curve of the elastic modulus is shown in Figure 6.
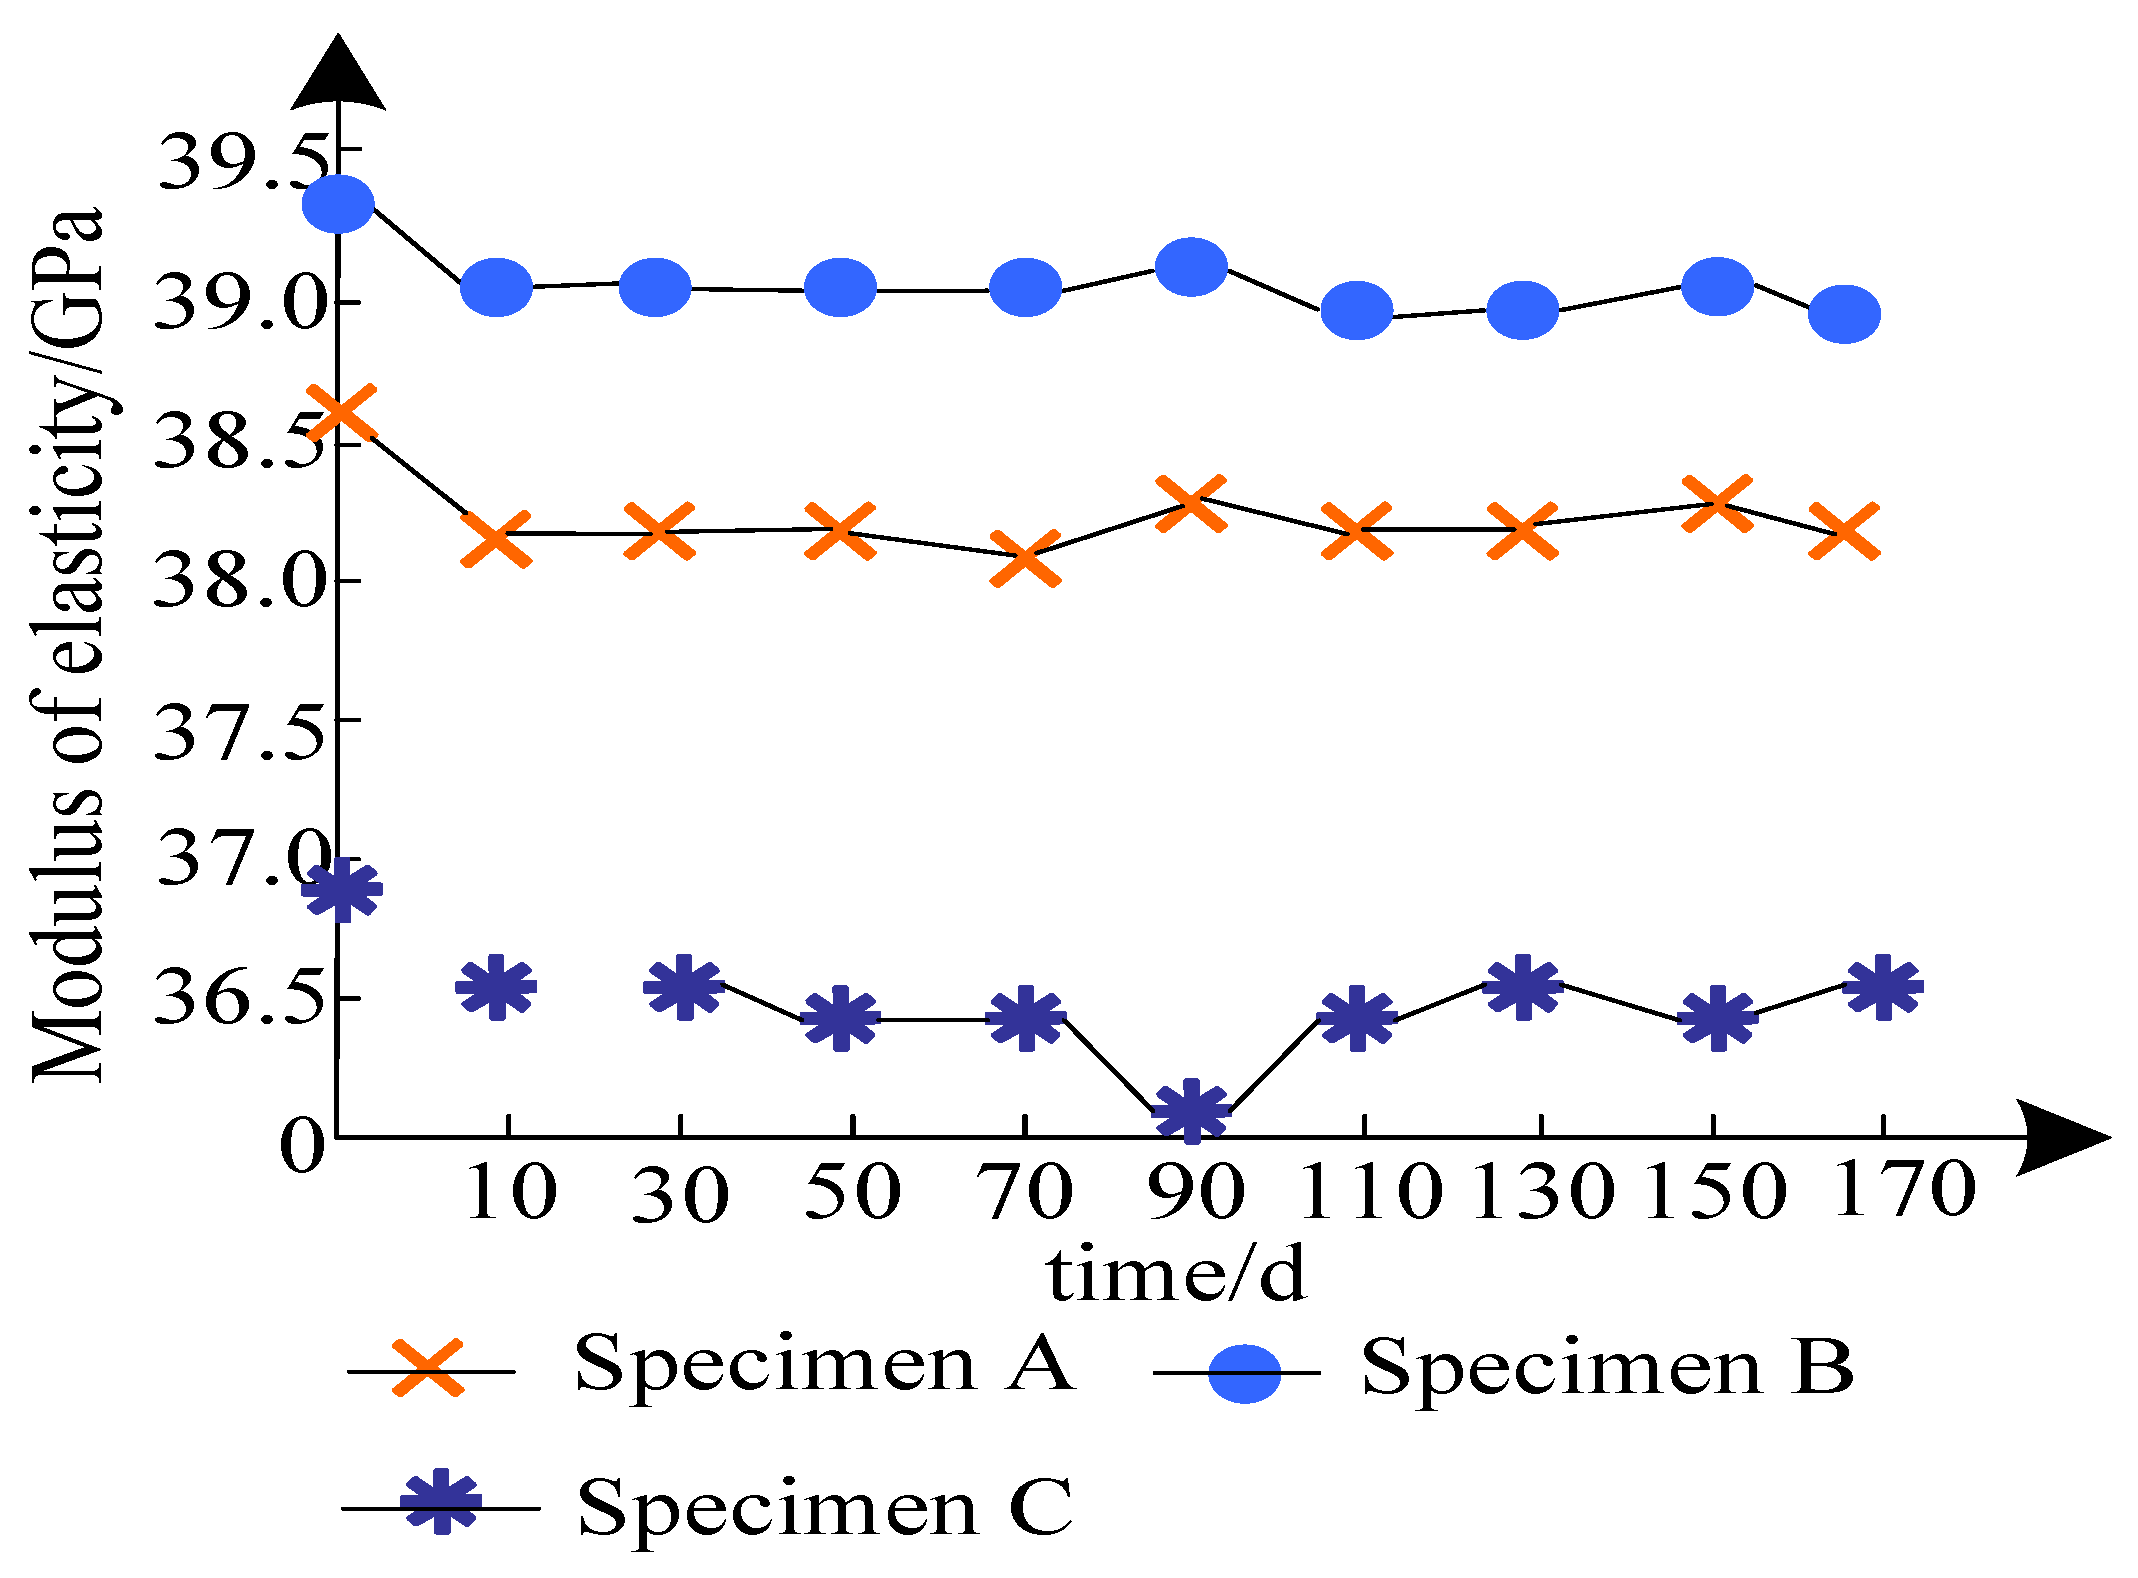
Figure 6 shows thetime–historychange inthe elastic modulus of the rod body in the free section of the three specimens. The elastic modulus of the anchor rod body decayed in a logarithmic relationship underpH = 14, and the attenuation process took longer in the alkaline environment than in the water environment. The time node values of the elastic modulus of each specimen are shown in Table 4.
The data in Table 4 show that the degree ofdegradation of the elastic modulus was about 1.5 GPaand1.0 GPa under pH = 14 and pH = 6.9, respectively. The stress loss caused by the degradation of the elastic modulus of the rod in the alkaline environment was greater. Under different alkaline environments (pH = 14/pH = 9), sample A and sample C hadgreater elastic modulus degradation and a greater stress loss rate under the high-stress state.
As shown in Table 4, the stress loss rate of the three specimens accountedfor about 63%, 74%, and 78% of the total stress loss rate. Therefore, the bond degradation of the anchor rod body was the main cause of stress loss. Under the same alkaline environment, the greater the load was, the greater the rod body degradation was. Under similar load conditions, the degradation of the bond between the rod and the body in water, which accounted for the rapid growth of rod body strain in the anchor head section in water.
In conclusion, the elastic modulus of the rod decreased during the stress loss process in a logarithmic law in the alkaline environment. Under the same load, the degradation effect under the alkaline environment wasgreater than that underthe distilled water environment. Under alkaline conditions, the rod with a large initial load degeneratedmore. Compared with the stress loss caused by anchor head bonding degradation, the stress loss caused by the attenuation of the elastic modulus of the rod was secondary. Under long-term erosion, it is difficult to ensure deformation synchronization.

3.3. Effect of Corrosion on the Stress on the Prestressed Anchor Rod

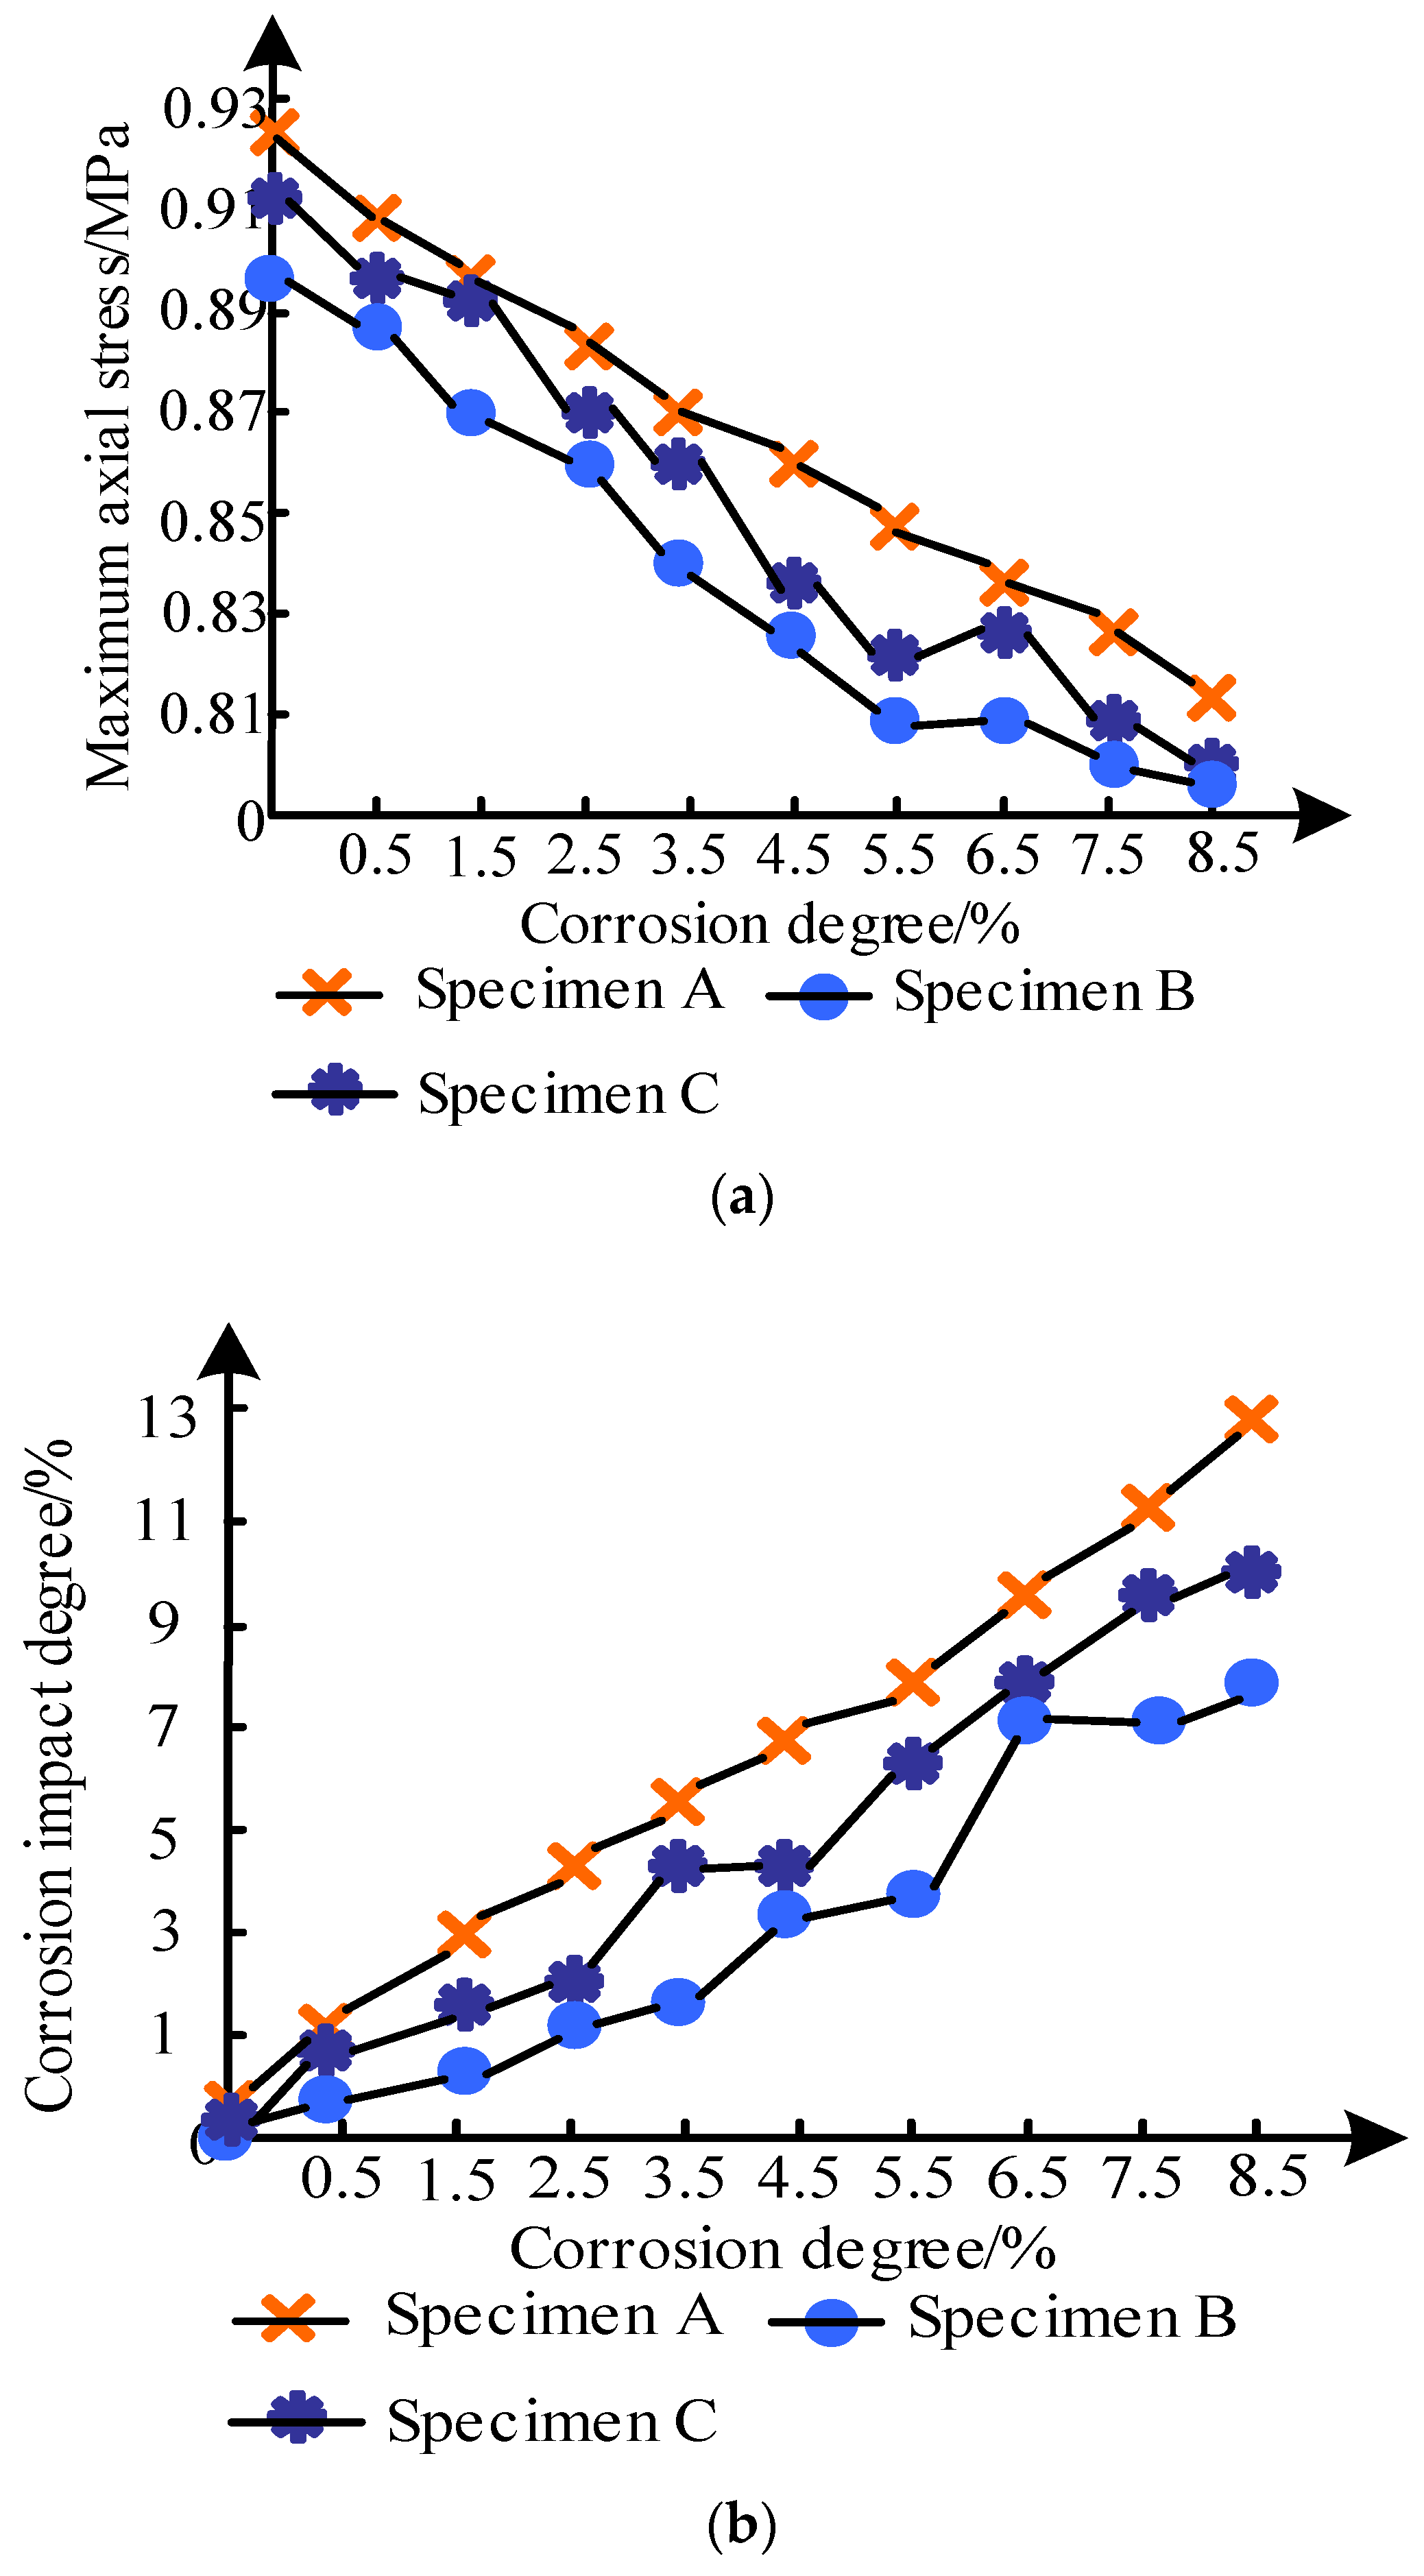
Figure 7 shows the relationship between the maximum axial stress on the prestressed anchor rod and the degree of corrosion influence under different corrosion degrees.
Figure 7 shows that with the increase in corrosion degree, the maximum axial stress on the anchor rod gradually decreased, indicating that corrosion decreasedthe anchoring force of the prestressed anchor rod. This indicates that the maximum axial stress on the bolt had a negative effect on the corrosion degree. As shown in Figure 7, when specimen A was not corroded, the maximum axial stress on the anchor rod was close to 0.93 MPa; when the corrosion degree reached 8.5%, the maximum axial stress on the anchor rod was about 0.82 MPa, and the maximum axial stress on the non-corroded prestressed anchor rod was 1.1 times that of the 8.5% corrosion degree. The influence of corrosion on the axial stress on the geotechnical prestressed anchor rod could reach 11.6%.

3.4. Effect of Corrosion on the Shear Stress on the Anchor Bolt–Grouting Body

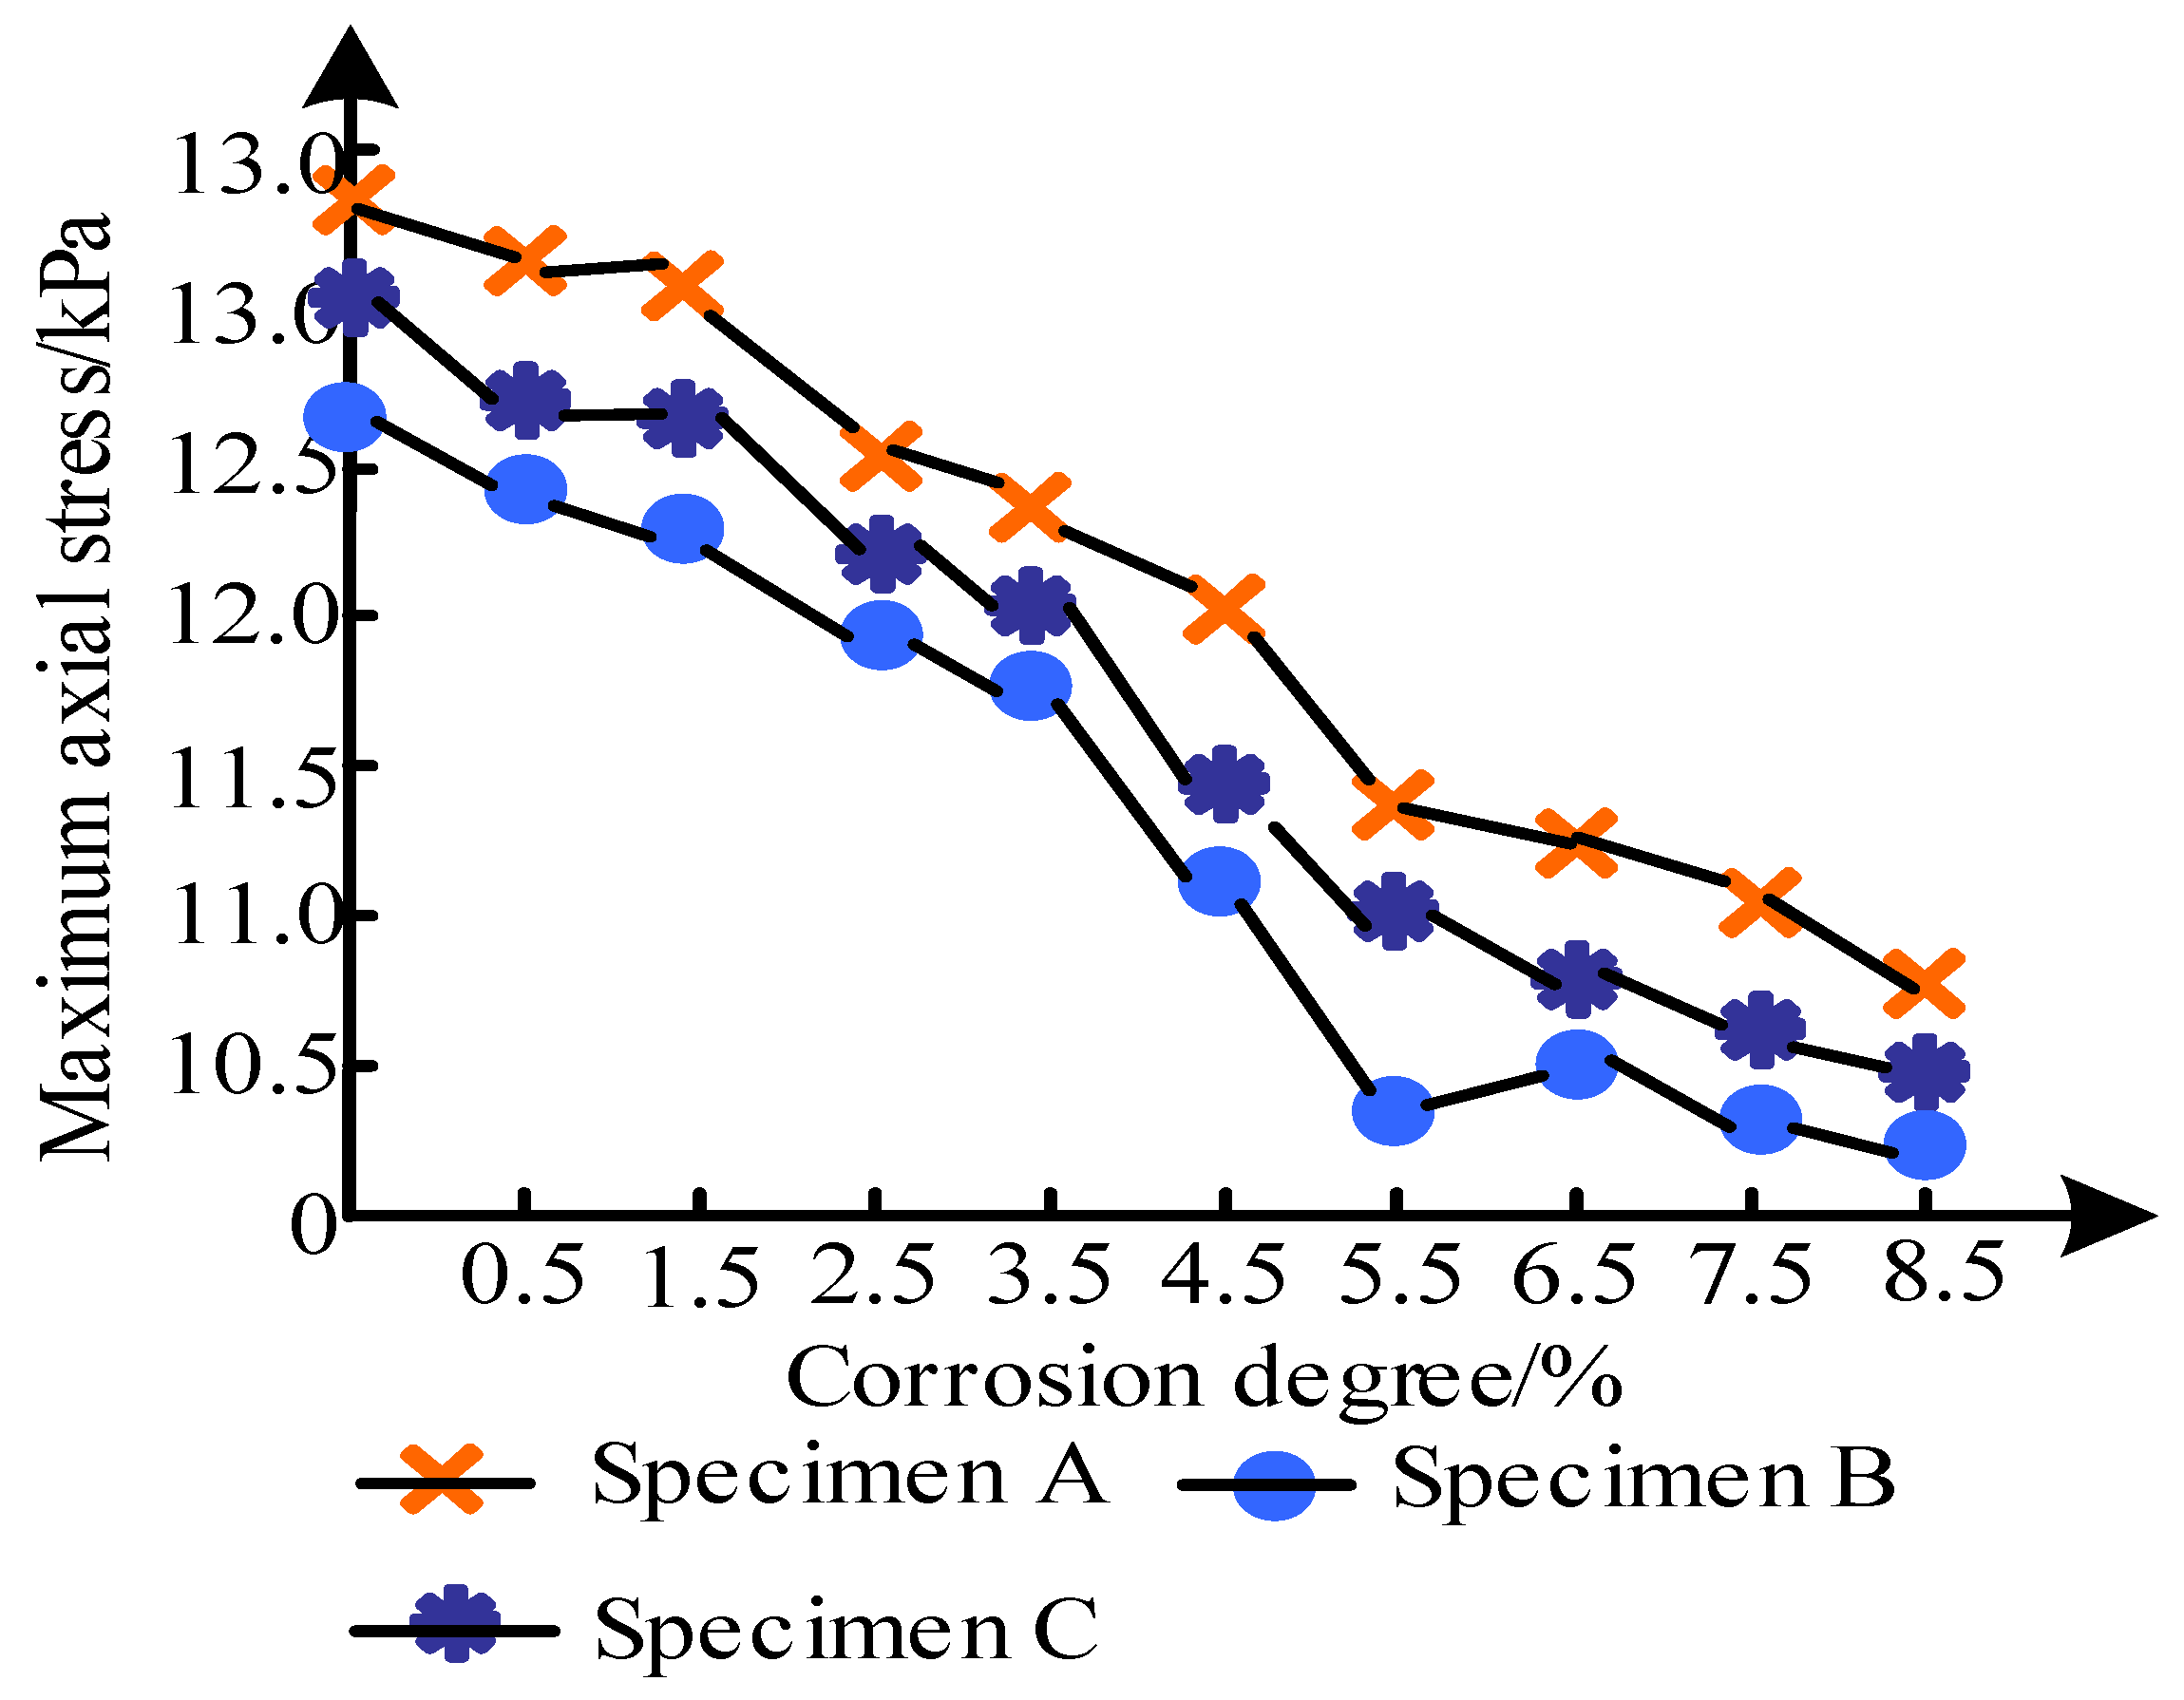
Figure 8 shows the maximum shear stress on the anchor bolt–grouting body under different corrosion degrees.
Figure 8 shows that the maximum shear stress on the anchor–grouting body gradually decreased with the increase in corrosion degree, indicating that the corrosion degree decreased the bonding force of the anchor–grouting body. As seen in Figure 6, when specimen A was not corroded, the maximum shear stress on the grouting body was 12.86 kPa; when the corrosion degree reached 8.5%, the maximum shear stress was about 11.05 kPa; when the geotechnical prestressed anchor rod wasnot corroded, the maximum shear stress was 1.23 times that when the corrosion degree reached 8.5%.

3.5. The Corrosion Morphology of the Prestressed Anchor Rod under Different pHValues

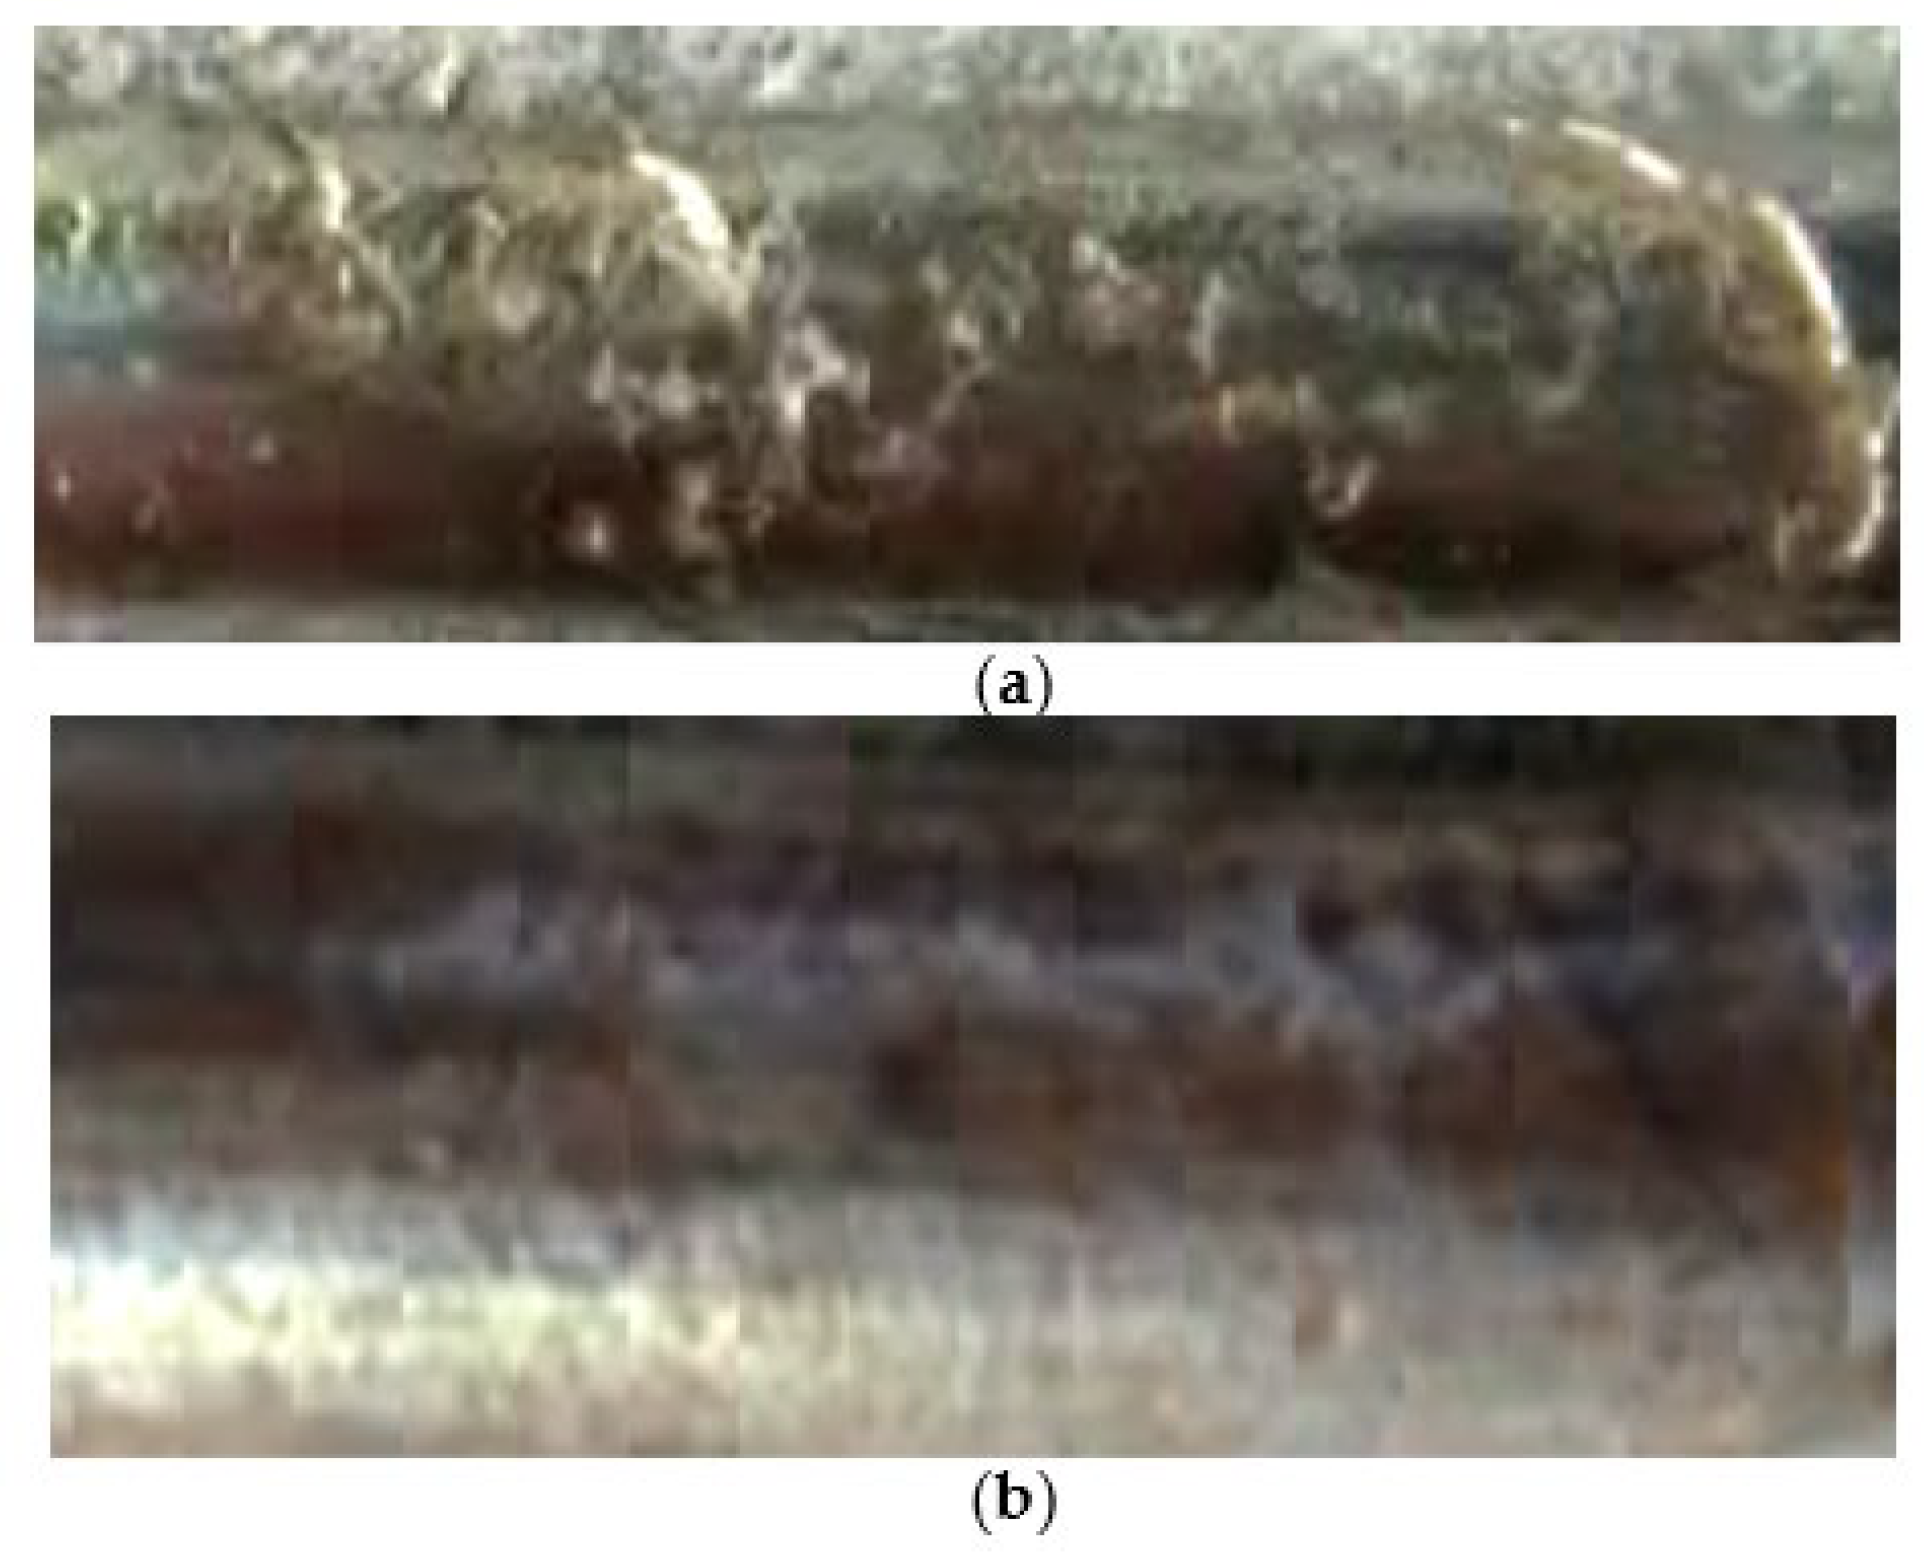
The three groups of specimens prepared in this paper were soaked in concentrated alkaline water, neutral distilled water, and weak alkaline water to accelerate the test progress. The morphology of the geotechnical prestressed anchor after corrosion is shown in Figure 9.
Figure 9 shows the corrosion morphology of the geotechnical prestressed anchor rod under the condition of pH = 7–14. When pH = 14, the anchor bar was seriously corroded, the pit corrosion was obvious, the corroded part lostthe surface metallic luster, and the corroded area was large. When pH = 9, the corrosion area of the anchor bar was large, with low pitting corrosion, and there was significant pitting corrosion in local positions. When pH = 7, the corrosion area of the anchor bar was small, and the corrosion degree was low. Most positions of the prestressed rock bolt showed metallic luster, and there were pit corrosions in local positions, most of which were uniform corrosions. It can be seen from Figure 7 that the alkaline environment, mimicking a marine climate, affected the structure of the test piece, indicating that the stress and other mechanical properties of the geotechnical prestressed anchor bolt declined due to corrosion.

3.6. Effect of Oxygen Concentration on the Stress Loss of the Prestressed Anchor Rod

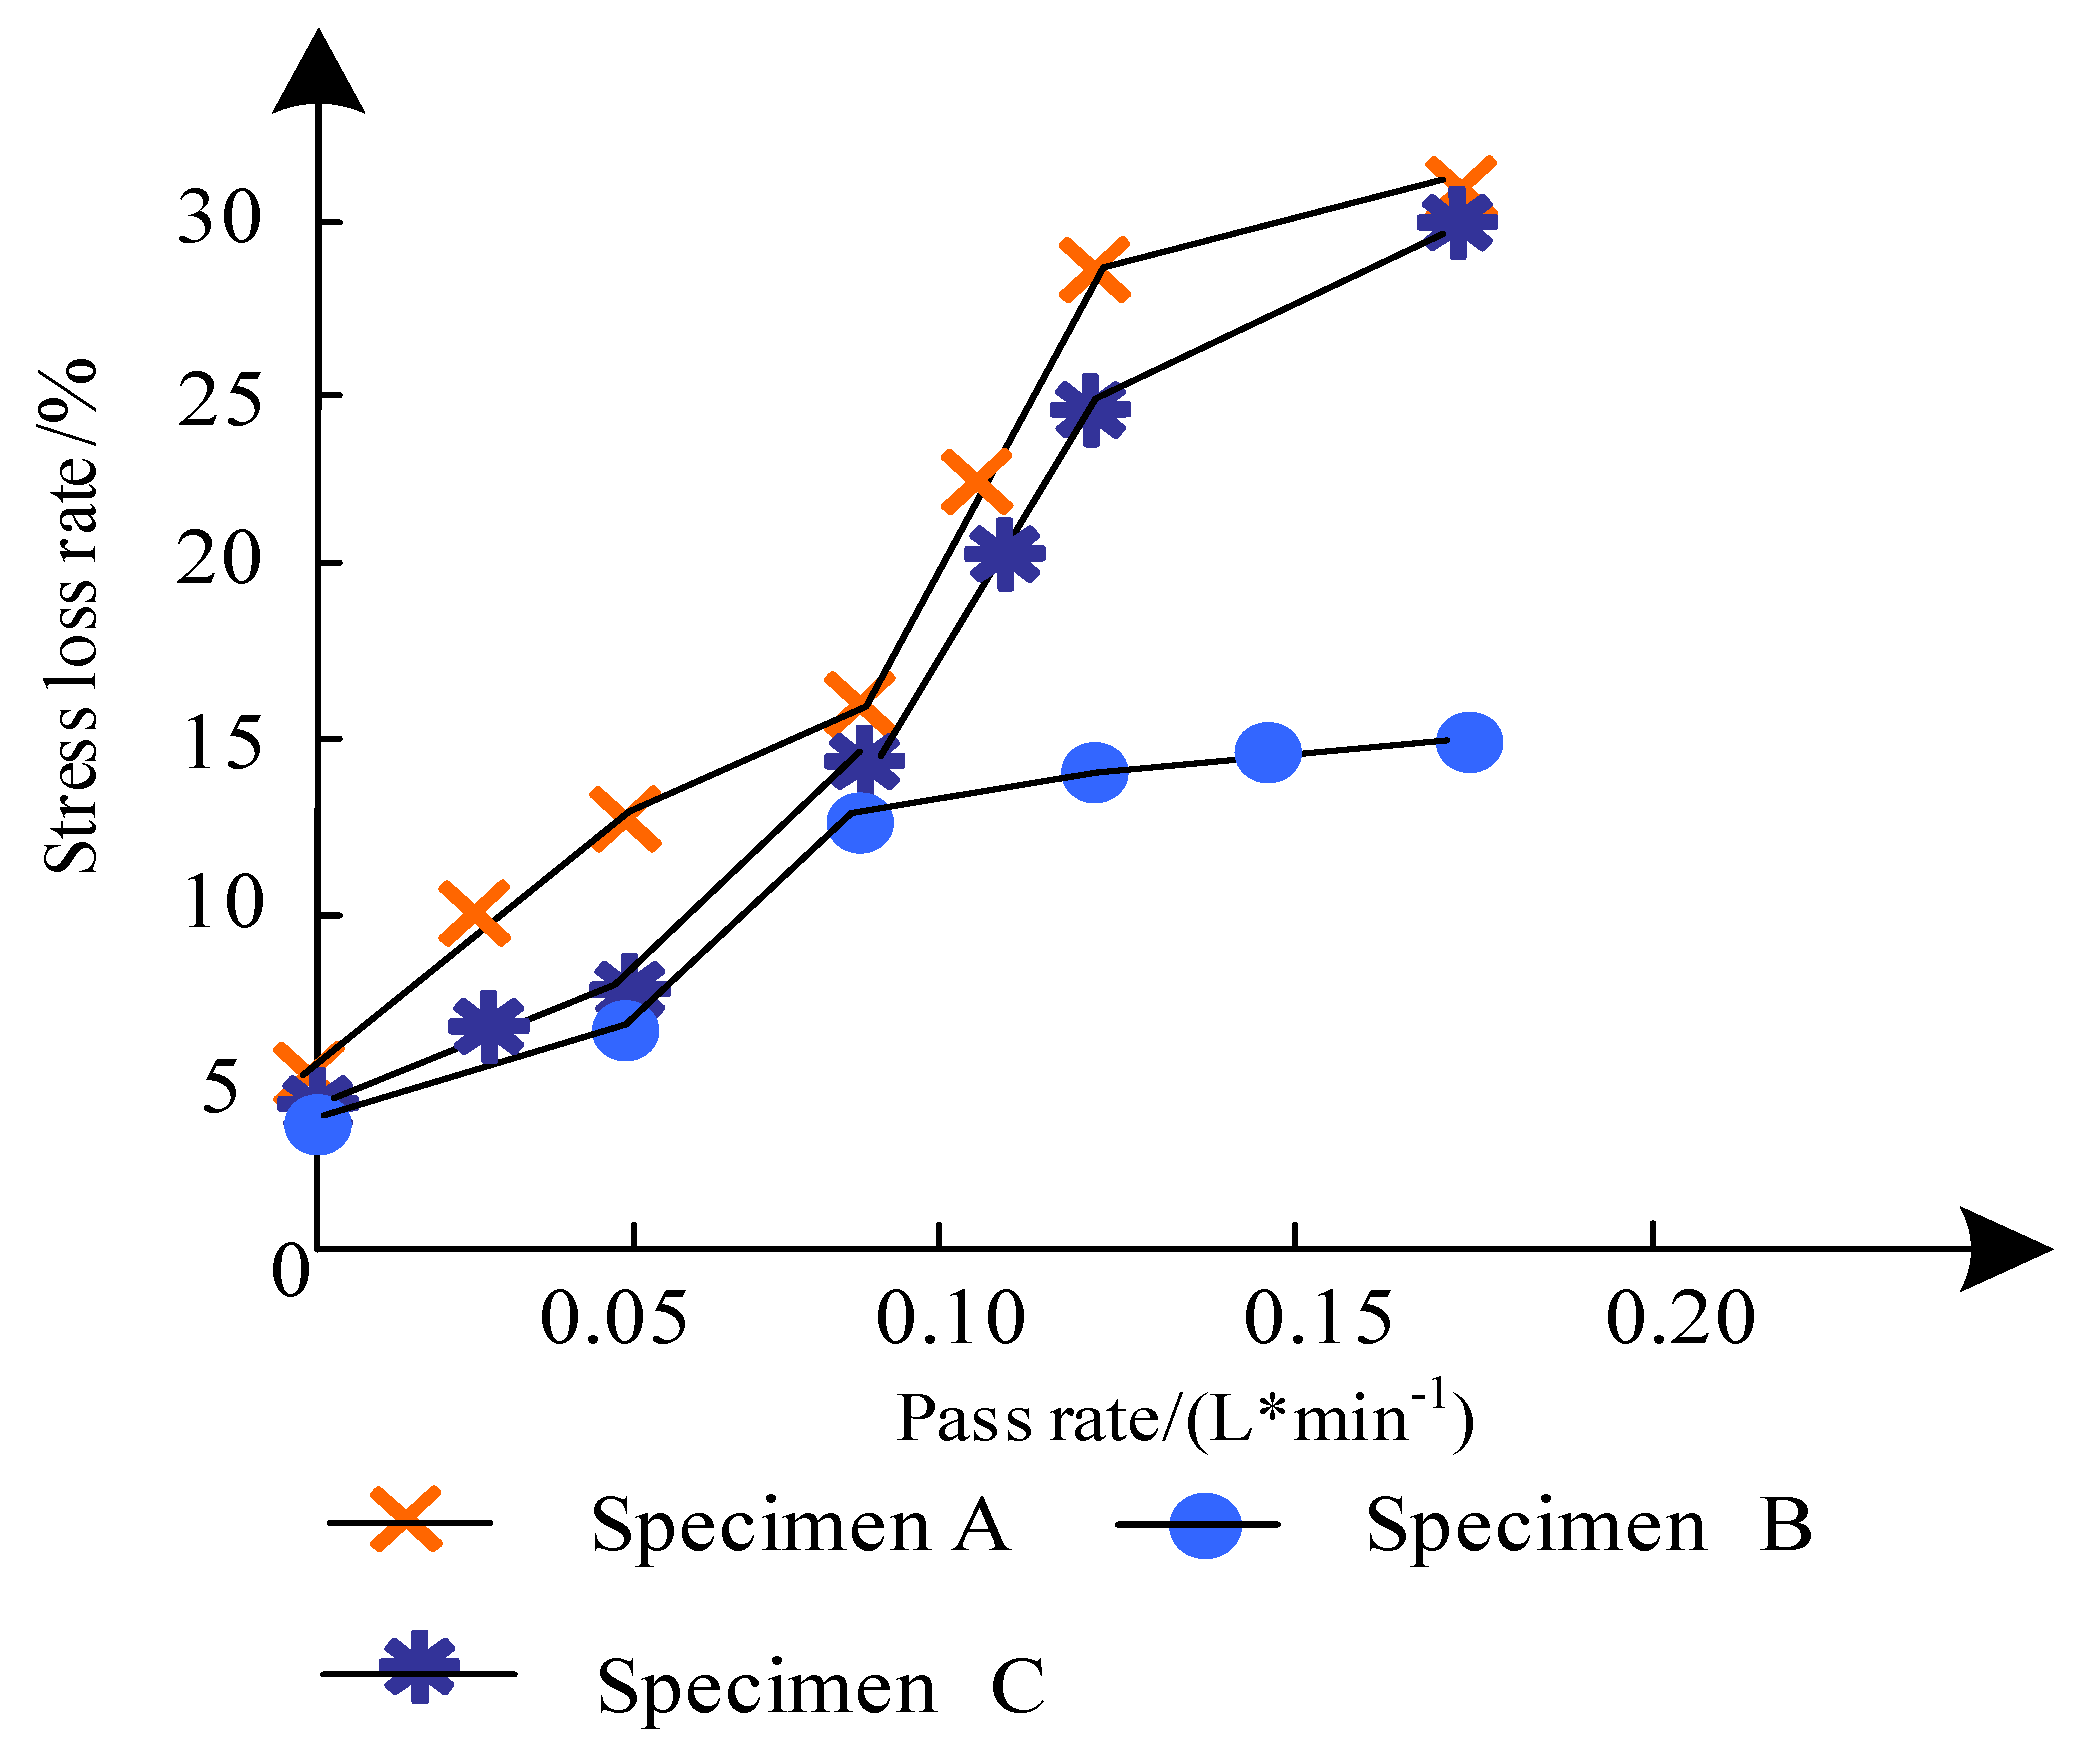
Table 5 shows the change law of the stress loss of each specimen under the influence of oxygen rate change.
Table 5 shows that the stress on each specimen decreased fast at first and then slowed down with the increase in ambient oxygen content. The oxygen flow rate decreased rapidly until reaching 0.05 L/min and changed slowly after exceeding 0.05 L/min. The stress loss of sample B decreased rapidly untilthe oxygen rate was 0.09 L/min, and the change rate of sample B was lower than that of sample A and sample C, and changed slowly after exceeding 0.09 L/min. When the oxygen rate was 0.05 L/min, the loss rate of ultimate elongation of the anchor bar of specimen A reached 12.77%, and the highest value was 27.58% at 0.17 L/min. It can be seen that the oxygen rate hada great impact on the stress loss of the prestressed anchor rod under strong alkaline corrosion. In contrast, the stress loss of specimen C underthe low-alkaline solution was lower than that of specimen A, indicating that the corrosion strength hada great influence on the stress loss of the geotechnical prestressed anchor rod. Figure 10 shows the change rule of the stress loss of the three samples under different oxygen flow rates.

4. Discussion

For a geotechnical prestressed anchor bolt, the distribution of bond stress on the anchor bolt is the focus, and the distribution of prestress is more uniform. On this basis, the bearing capacity is improved. To achieve a large bearing capacity in construction, a prestressed anchor bolt is the first choice. However, there are disadvantages in controlling the stress loss of the anchor bolt, especially in projects constructed incomplex geological environments where the water content of the stratum is high, and the creep of the soil layer after stress is strong. If equal load tensioning is adopted, the free sections with different lengths exhibit different degrees of deformation [18]. The recovery of elastic deformation after locking was directly offset by a steel strand with small deformation.
The elastic deformation during tensioning cannot be effectively restored, so the stress loss of the bolt is relatively increased. Through experimental analysis, this paper analyzes the influence law of a marine climate corrosion environment on a geotechnical prestressed anchor, and explores the influence of corrosion on the change in anchor prestress according to the actual situation. Through theoretical analysis and comparison with the reported tests, it shows that the present analysis is in line with the actual situation [19]. The theoretical analysis assumes that the influence of different corrosion conditions is different from the actual situation, which is more suitable when the free section of an anchor rod is relatively long. The following conclusions can be drawn from the above analysis:
(1)
Inthe early stage of corrosion, the stress loss of the prestressed anchor rod is large. The more serious the marine climate corrosion is, the more serious the prestress loss of the anchor rod is.
(2)
Stress loss leads to a decrease inthe single-line modulus. When the corrosion is more serious, the elastic modulus is relatively lower.
(3)
The increase in corrosion degree leads to the gradual decrease in stress on the prestressed anchor rod.
(4)
The influence of corrosion on the shear stress on the anchor–grouting body is similar to that in (3).
(5)
In the simulated marine climate environment, the higher the alkalinity of the solution is, the more serious the corrosion morphology of the prestressed anchor rod is. This is because there is residual acid liquid on the surface and internal microholes of the metal anchor material. The higher the alkalinity of the solution, the more likely the anchor rod is to undergo the second corrosion, thus reducing the surface adhesion of the specimen. The corrosion of the surface morphology of the anchor rod inevitably affects its overall performance.
(6)
In addition to the corrosion of the anchor rod caused by the alkaline solution, oxygen oxidation also leads to the corrosion of the anchor rod. Therefore, the influence of the oxygen rate on the stress loss of the prestressed anchor rod is verified.
In the current process of geotechnical prestressed bolt support engineering, the corrosion of the bolt can be roughly divided into three stages, namely the passivation period stage, the incubation period stage, and the corrosion acceleration stage. Generally, the first two stages take a long time, depending on the alkalinity reduction degree of the protective layer on the bolt and the depth and concentration of harmful ions [20,21]. Improving the thickness and compactness of the protective layer of the anchor rod is conducive to prolonging the durationof these two stages. If too much salt is mixed into the concrete of the anchor rod, the corrosion of the reinforcement in the anchor rod will be accelerated. The corrosion rate of the reinforcement is especially accelerated after the cracking of the concrete of the protective layer. Therefore, during maintenance procedures, timely repair measures should be taken to prevent the cracking of the protective layer and avoid accelerated corrosion of the internal reinforcement.
The stress loss of the prestressed anchor structure is affected by the interactingaction of environment and stress. Most stress loss occurs in the early stage after loading. Under the same load, the stress relaxation of the prestressed anchor structure in alkaline environments is greater than that in distilled water environments. Compared with the load, the environment has a greater effect on the stress loss of the prestressed anchor structure. The bond degradation of the anchorage section is the main reason for the stress loss of the prestressed anchor structure. As the bond degradation of between the rod and the body in the anchor head becomes increasingly significant, the strain at different positions of the anchor structure will increase compared with that in analkaline environment, the degradation rate of the bond at the bolt–body interface is greater in a water environment.

5. Conclusions

The stress loss of prestressed rock bolts in coastal areas under a corrosive environment was studied. Three rock–soil prestressed anchor bolt specimens were prepared and soaked in a simulated seawater environment with different concentrations. Different loads were applied, and the stress loss of each specimen under different conditions was observed. Various test results show that the more serious the corrosion was, the more serious the stress loss of the specimen was. The higher the alkalinity, the faster the stress loss of the specimen. That is to say, in an actual engineering environment, the long-term corrosion of anchor bolts in a coastal environment will seriously affect the durability of the anchor bolts.
The change in corrosion degree will affect the maximum axial stress on the anchor bolt and the shear stress on the grouting body. The pH value of a simulated seawater solution will also affect the shape and mechanical properties of anchor bolts. The higher the alkalinity, the more serious the bolt corrosion, and the greater the stress loss. At the same time, the oxygen consumption rate had a great influence on the stress loss of the prestressed anchor bolt. With the increase in environmental oxygen content, the stress increased fast at first and then slowed down. The oxygen rate dropped rapidly until reaching 0.05 L/min, and changed slowly after exceeding 0.05 L/min.

Author Contributions

D.L. and A.C. proposed method. D.L. analysed the data. D.L. and A.C. conducted the experiments and analysed the results. All authors discussed the results and wrote the manuscript. All authors have read and agreed to the published version of the manuscript.

Funding

The research wassupported by “Geological Engineering” Teaching Case Librar (no. 109920190024).

Institutional Review Board Statement

Not applicable.

Informed Consent Statement

Not applicable.

Data Availability Statement

Not applicable.

Conflicts of Interest

The authors declare no conflict of interest.

References

  1. Dias-Da-Costa, D.; Neves, L.; Gomes, S.; Hadigheh, S.A.; Fernandes, P. Time-dependent reliability analyses of prestressed concrete girders strengthened with cfrp laminates. Eng. Struct. 2019, 196, 109297.1–109297.11. [Google Scholar] [CrossRef]
  2. Lee, S.; Kim, Y.; Ko, M.; Lee, C. Assessment of thermal prestress loss with re-tensioning tests. ACI Struct. J. 2019, 116, 87–96. [Google Scholar] [CrossRef]
  3. Heydarinouri, H.; Motavalli, M.; Nussbaumer, A.; Ghafoori, E. Development of mechanical strengthening system for bridge connections using prestressed cfrp rods. J. Struct. Eng. 2021, 147, 04020351. [Google Scholar] [CrossRef]
  4. Shi, K.; Wu, X.; Liu, Z.; Dai, S. Coupled calculation model for anchoring force loss in a slope reinforced by a frame beam and anchor cables. Eng. Geol. 2019, 260, 105245. [Google Scholar] [CrossRef]
  5. Chen, Y.; Yan, J.; Sareh, P.; Feng, J. Feasible prestress modes for cable-strut structures with multiple self-stress states using particle swarm optimization. J. Comput. Civ. Eng. 2020, 34, 04020003. [Google Scholar] [CrossRef]
  6. Tong, T.; Hua, G.; Liu, Z.; Liu, X.; Xu, T. Localizing gradient damage model coupled to extended microprestress-solidification theory for long-term nonlinear time-dependent behaviors of concrete structures. Mech. Mater. 2020, 154, 103713. [Google Scholar] [CrossRef]
  7. Wang, S.R.; Wang, Y.H.; Gong, J.; Wang, Z.L.; Huang, Q.X.; Kong, F.L. Failure mechanism and constitutive relation for an anchorage segment of an anchor cable under pull-out loading. Acta Mech. 2020, 231, 3305–3317. [Google Scholar] [CrossRef]
  8. Zhu, B.; Li, Q.; Wu, Y.; Li, J. Analytical model for predicting stress distribution and load transfer of tension-type anchor cable with borehole deviation. Int. J. Geomech. 2020, 20, 04020085. [Google Scholar] [CrossRef]
  9. Wang, X.; Zhou, J.; Ding, L.; Song, J.; Wu, Z. Static behavior of circumferential stress-releasing anchor for large-capacity frp cable. J. Bridge Eng. 2020, 25, 04019114. [Google Scholar] [CrossRef]
  10. Tian, Z.C.; Peng, W.P.; Zhang, J.R.; Jiang, T.Y.; Deng, Y. Determination of initial cable force of cantilever casting concrete arch bridge using stress balance and influence matrix methods. J. Cent. South Univ. 2019, 26, 3140–3155. [Google Scholar] [CrossRef]
  11. Mokhtari, M.; Barkhordari, K.; Abbasi, S. Comparative study of the seismic response of soil-nailed walls under the effect of near-fault and far-fault ground. J. Geol. 2020, 13, 121–146. [Google Scholar]
  12. Takase, Y. Testing and modeling of dowel action for a post-installed anchor subjected to combined shear force and tensile force. Eng. Struct. 2019, 195, 551–558. [Google Scholar] [CrossRef]
  13. Kumar, V.K.; Ilamparuthi, K. Performance of anchor in sand with different forms of geosynthetic reinforcement. Geosynth. Int. 2020, 27, 1–68. [Google Scholar]
  14. Chen, J.; Guo, Y.; Zhang, L. A glass-fiber packaged fiber bragg grating strain sensor. Laser Optoelectron. Prog. 2020, 57, 54–59. [Google Scholar]
  15. Wang, S.; Zhu, Y.; Ma, W.; Wang, Z.; Li, G. Effects of rock block content and confining pressure on dynamic characteristics of soil-rock mixtures. Eng. Geol. 2021, 280, 105963. [Google Scholar] [CrossRef]
  16. Yang, Q.; Cong, B.; Wang, Z.; Yu, L. An analytical solution for the ultimate embedment depth and potential capacity of vertically loaded anchors with a bridle shank. Ocean Eng. 2019, 187, 106216.1–106216.17. [Google Scholar] [CrossRef]
  17. Liu, Z.; Xia, X.; Zhang, Y.; Jiang, J. Damage behavior of ultra-high performance concrete under load-temperature coupling. J. Chin. Ceram. Soc. 2021, 49, 1238–1246. [Google Scholar]
  18. Bujnak, J.; Mecar, J.; Bahleda, F. Tensile resistance of an anchor plate with supplementary reinforcement. Struct. Concr. 2019, 20, 164–170. [Google Scholar] [CrossRef] [Green Version]
  19. Wang, C.; Wang, X.; Chen, X.; Yu, G. Maximum vertical pullout force of torpedo anchors in cohesive seabeds at different steady pullout velocities. J. Coast. Res. 2020, 36, 1. [Google Scholar] [CrossRef]
  20. Lin, Y.L.; Lu, L.; Yang, G.L. Seismic behavior of a single-form lattice anchoring structure and a combined retaining structure supporting soil slope: A comparison. Environ. Earth Sci. 2020, 79, 78. [Google Scholar] [CrossRef]
  21. Zhe, Z.; Yang, Z.; Ping, Z. Flexural behavior of precast RC deck panels with cast-in-place UHPFRC connection. Coatings 2022, 12, 1183–1189. [Google Scholar]
Figure 1. Three groups of samples.
Coatings 12 01762 g001
Figure 2. Start and end of tensile test. (a) Start of tensile text. (b) End of tensile test.
Coatings 12 01762 g002
Figure 3. Time–history curve of stress loss rate of the prestressed bolt structure.
Coatings 12 01762 g003
Figure 4. Stress–strain progress of the bolt rod body of specimen A.
Coatings 12 01762 g004
Figure 5. Stress–straincurve of bolt specimen.
Coatings 12 01762 g005
Figure 6. Time–history curve of elastic modulus of specimens.
Coatings 12 01762 g006
Figure 7. Influence of different corrosion degrees on bolt. (a) Influence of different corrosion degrees on the maximum axial stress on the prestressed anchor bolt. (b) Influence of different corrosion degrees on bolt corrosion.
Coatings 12 01762 g007
Figure 8. Maximum shear stress onanchor under different corrosion degrees.
Coatings 12 01762 g008
Figure 9. Corrosion morphology of prestressed rock bolt at different pH values. (a) pH = 14; (b) pH = 6.9; (c) pH = 9.
Coatings 12 01762 g009aCoatings 12 01762 g009b
Figure 10. Change rule of stress loss of specimens under different oxygen flow rates.
Coatings 12 01762 g010
Table 1. Mechanical properties and material composition of the bolt bars.
ContentThe Numerical
The material compositionResin/%19
Glass fiber/%64
Basalt fiber/%10
Quartz sand/%7
Mechanical properties Tensile strength/kN547.31
Modulus of elasticity/GPa53.37
Elongation/%1.7
Table 2. Specifications of each specimen.
SpecimenSpecimen ASpecimen BSpecimen C
The solution pH146.99
The initial load value/kN170.2185.389.9
Table 3. Data at main time nodes.
Condition SettingSpecimen ASpecimen BSpecimen C
pH value of solution146.99
The initial load value/kN170.2185.389.9
The initial stress/MPa289.5297.9157.3
Percentage of initial load and ultimate strength/%32.6433.5917.67
Stress loss at 90 d/MPa26.522.0 13.6
Stress loss at 360 d/MPa28.525.814.4
Stress loss rate at 90 d/%9.237.755.23
Stress loss rate at 360 d/%9.958.726.21
Table 4. Time node values of elastic modulus of bolt body of each specimen.
SpecimenSpecimen ASpecimen BSpecimen C
The solution pH146.99
Load strength/ultimate strength/%32.6433.5917.67
Initial elastic modulus/GPa42.643.838.8
Loss of time/d752473
Modulus of elasticity after loss/GPa40.142.837.0
Bolt strain after loss/μɛ646165753728
The elastic modulus sharpens the stress loss rate/%3.762.362.01
Bond sharpening stress loss rate/%6.216.477.22
Table 5. Change rule of stress loss of specimen under different oxygen flow rates.
Pass Rate/(L·min−1)Stressloss Rate of Specimen A/%Stressloss Rate of Specimen B/%Stressloss Rate of Specimen C/%
0.005.513.484.48
0.0512.776.748.34
0.0916.4812.1714.57
0.1327.5813.5625.61
0.1729.2614.3528.42
Publisher’s Note: MDPI stays neutral with regard to jurisdictional claims in published maps and institutional affiliations.