Article

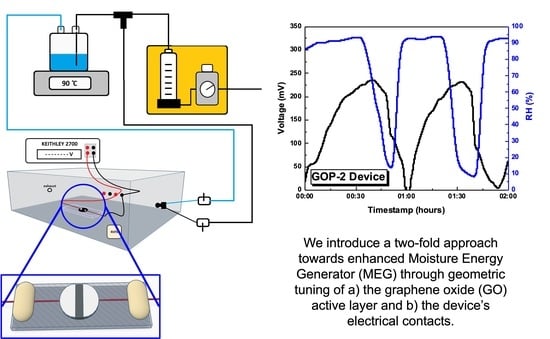
Geometric Tuning for Enhanced Moisture-Driven Electricity Generation Enabled by Graphene-Oxide Flakes

by
Katerina Anagnostou
1,†,
George Veisakis
1,†,
Ioannis Kalogerakis
1,
George Viskadouros
1,
Konstantinos Rogdakis
1,2,* and
Emmanuel Kymakis
1,2,*
1
Department of Electrical & Computer Engineering, Hellenic Mediterranean University (HMU), 71410 Heraklion, Greece
2
Institute of Emerging Technologies (i-EMERGE) of HMU Research Center, 71410 Heraklion, Greece
*
Authors to whom correspondence should be addressed.
These authors contributed equally to this work.
Coatings 2022, 12(12), 1970; https://doi.org/10.3390/coatings12121970
Submission received: 11 October 2022 / Revised: 7 December 2022 / Accepted: 10 December 2022 / Published: 15 December 2022

Abstract

:
In this work, we formulate water-based graphene oxide (GO) inks to fabricate moisture energy generators (MEGs) while a two-fold geometric tuning is proposed to encourage enhanced performance. Two GO-based structures with distinctly different thicknesses were prepared as the moisture absorbing layer: a GO-pellet (GOP) and a thinner GO-film (GOF). The effect of electrical contacts’ configuration on the MEG’s output voltage (Vo) was evaluated as a second geometric tunning approach by varying the surface area of the contacts and their orientation with respect to the GO plane, i.e., horizontal or vertical. GOF-based devices that employed a horizontal contacts’ configuration demonstrated champion Vo values (~350 mV) and the fastest response to humidity (3 min required to reach maximum Vo when the relative humidity, or RH, was increased). In GOP devices with horizontal point-like contacts, Vo is inversely related to the contacts’ distance, with a maximum Vo of ~205 mV achieved at a ~1 mm contacts’ distance. GOP-based MEGs with point-like contacts placed vertically to the GO-plane yielded a higher Vo value (~285 mV), while the humidity response time was 15 min. Replacing these contacts with large area electrodes in GOP devices resulted in devices with a slower response to humidity (~30 min) due to a smaller exposed GO surface area. These geometric tuning techniques allowed for the investigation of the optimum device configuration towards efficient moisture-based energy generation with a fast response.

Graphical Abstract

1. Introduction

Smart generators that convert ambient energy into electrical power are an innovative approach toward combating the growing global energy demands in ways that are environmentally friendly and waste-free. Several renewable energy technologies, such as photovoltaics, piezoelectric, and thermoelectric generators, have been developed not only to combat the energy crisis and growing pollution but also to advance the development of innovative self-powered micro-devices [1]. Water is abundant, covering more than 70% of our planet’s surface, and acts as a massive energy carrier through processes, such as water flow, evaporation, and moisture diffusion. Water-enabled power generation, or hydrovoltaics, is often associated with large-scale installations, such as hydroelectric power plants, that convert the large amounts of kinetic energy carried by flowing water into electricity via large-scale turbine-based generators. However, water energy is also stored in smaller scale processes, such as water droplet motion, dynamic tidal power, or osmotic effects in salinity gradients observed at river/ocean interfaces [2,3]. Water in the form of atmospheric moisture is a bountiful, omnipresent, and recyclable resource, making it an excellent source of clean, renewable, and cost-effective energy. Energy is generated obtained through the spontaneous absorption and evaporation cycle of atmospheric water molecules and can be exploited through moisture-energy-harvesting technologies [4,5,6]. Indeed, ambient moisture-enabled energy has been utilized for electricity generation and storage and the development of self-powered portable and wearable electronic devices, such as sensors, actuators, and microrobots [7,8,9,10].
Despite the developments in water energy generation, real applications based on this technology remain mostly untapped due to the lack of more advanced and efficient nanomaterials within these devices. Inorganic two-dimensional (2D) materials, such as graphene and graphene-related materials (GRMs), have been extensively investigated and utilized in renewable-energy-harvesting technologies, such as photovoltaics (PVs), with their application now expanding into multifunctional energy-harvesting systems beyond PVs, e.g., hydrovoltaics [1,11,12,13,14]. The chemical tunability of GRMs offers the ability to tailor their properties on demand. For example, the incorporation of functional organic or inorganic molecules between the 2D material layers can adjust and enhance the desired optoelectronic properties [15]. These versatile GRMs can be prepared by cost-effective solution-processing techniques, thus offering facile and up-scalable applications.
Moisture energy generators (MEGs) operate by converting chemical energy from ambient moisture into electric power. Water molecules are absorbed by hygroscopic nanomaterials via oxygen bonds, a phenomenon that releases mobilized ions and creates separate charges, thus generating electric power [16]. Due to its hydrophilic nature, low production cost, facile processability, and environmentally friendly chemical composition, graphene oxide (GO) has proven to be an excellent candidate as a moisture absorbing nanomaterial in MEG devices [17,18,19,20]. It is a 2D nanomaterial with a high water uptake and a high water absorption/desorption rate [21,22]. GO is decorated with oxygen-containing hydrophilic functional groups (e.g., -COOH, -OH) and has a high specific surface area; therefore, it attracts and absorbs water molecules very effectively and generates protons (H+) due to the hydration effect [23,24]. A gradient oxygen group content within the GO film creates an ionic gradient upon moisture absorption, triggering charge separation and inducing electric potential [25,26,27,28,29]. The water absorption process in GO is reversible, generating electric potential difference with every absorption/desorption cycle.
A notable way in which GO has been developed and tailored for MEGs is the fabrication of a gradient distribution of oxygen group content within the GO layer. This, in turn, creates a proton (H+) concentration gradient, thus enhancing the electric generation process [29]. Oxygen distribution gradient within GO can be achieved through methods, such as thermal annealing [27], electrochemical treatment [28], asymmetrical moisturizing [26], or laser irradiation [23]. H. Cheng et al. achieved this by creating a reduced Graphene Oxide (rGO)/GO/rGO trilayer from a pristine GO film [28]. Tuning the physical structure of the GO-based active layer can enhance its ability to adsorb and accommodate water molecules. Namely, GO foams have been utilized in lieu of GO films, as their porosity offers higher moisture-harvesting capacity and has been known to increase the GO-induced voltage seven-fold [19,25]. Apart from GO in its pristine form, GO-polymer nanocomposites have been developed and evaluated as enhanced moisture-harvesting hybrid materials [20,29]. GO-based MEGs have been improved not only by fine-tuning the chemical composition of GO itself but also by modifying the structure and configuration of the constructed MEG devices. For example, Y. Huang et al. enhanced their GO-based MEG voltage output (Vo) not only through oxygen gradient but also by inducing an inherent Schottky barrier at one of the contacts [30].
In this work, we developed MEGs that employ GO as the moisture absorbing layer. We conducted a two-fold investigation on how the geometric tuning of the device structure affects the overall performance. Firstly, we evaluated the effect of the GO layer thickness on device performance by employing either a thick, compact pellet (GOP) or a free-standing thin film (GOF). Secondly, we investigated the influence of the electrical contacts’ configuration by testing contacts placed horizontally and vertically with respect to the GO plane, as well as adjusting the distance and surface area of horizontal contacts. This structural tuning process offered insights into employing an overall device configuration that brings us closer to an optimum moisture energy conversion efficiency.

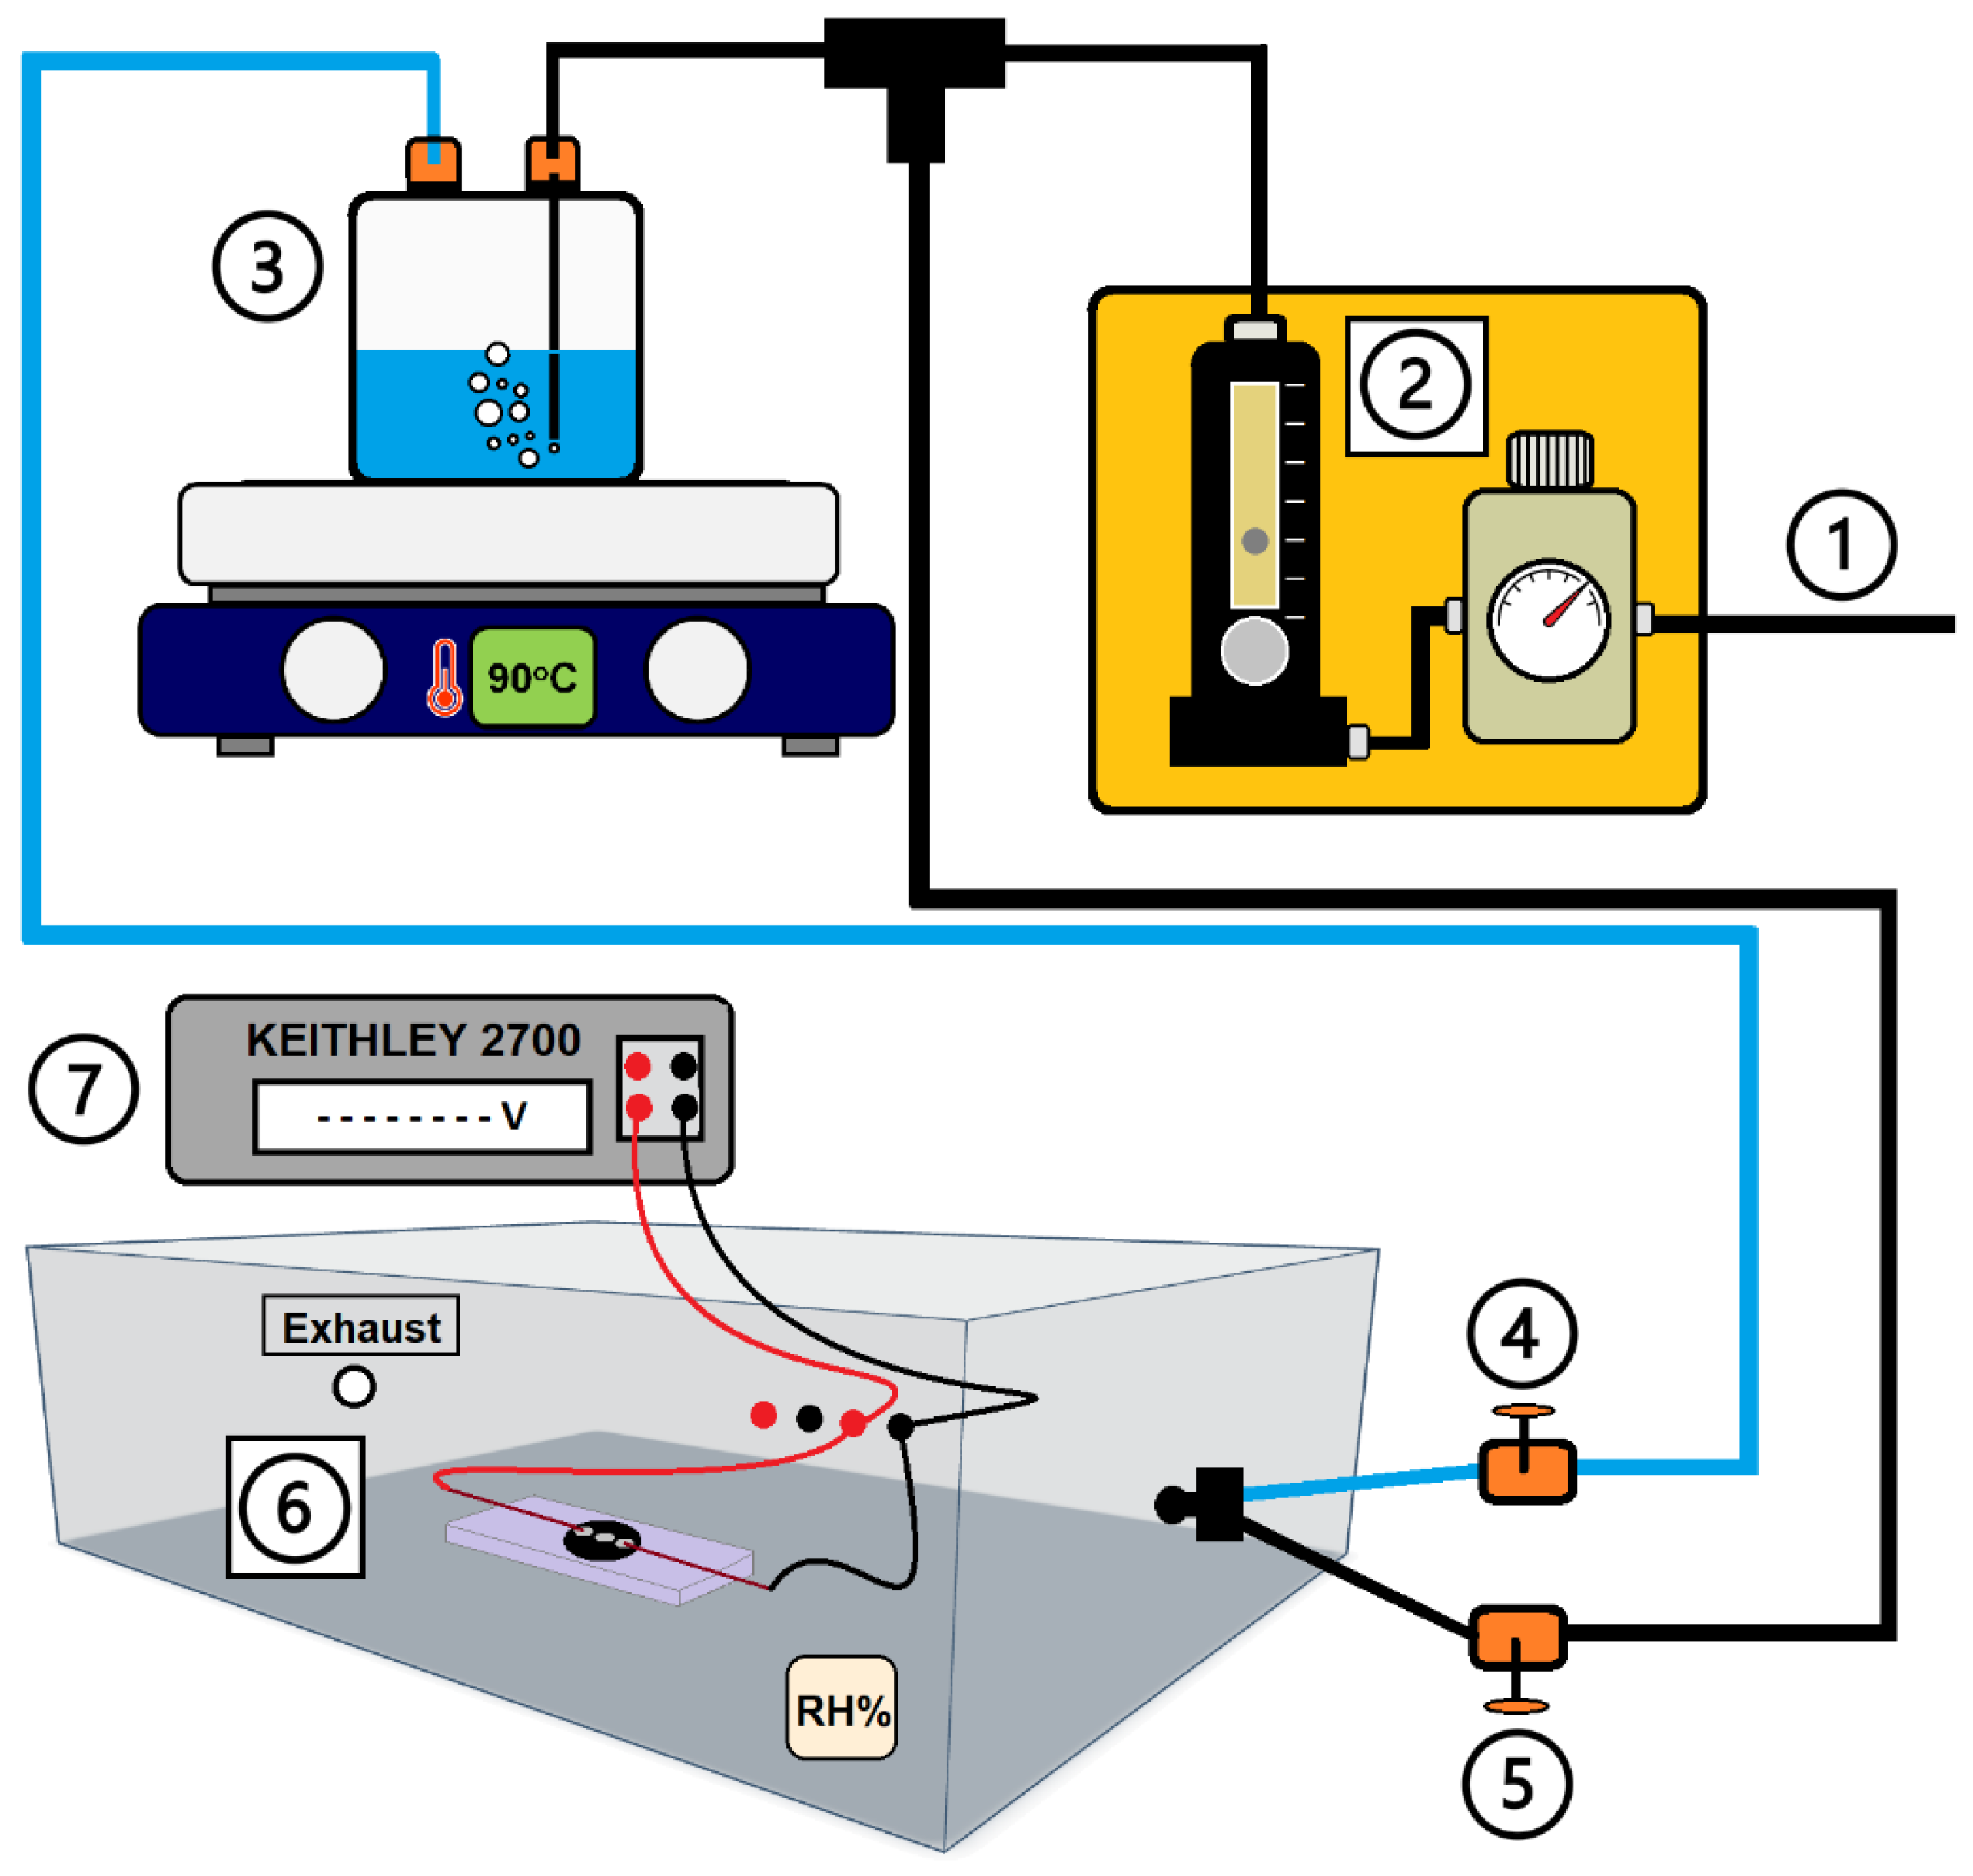
2. Materials and Methods

For the synthesis of graphite oxide powder, pure graphite powder (<20 μm), sodium nitrate, potassium permanganate, and hydrogen peroxide (30%) were purchased from Sigma-Aldrich while sulfuric acid (95%–97%) was purchased from Honeywell. For the preparation of GO dispersions, ultrapure water purchased from Honeywell was used. Centrifugations were carried out in a Hettich UNIVERSAL 320 centrifuge and liquid phase exfoliation (LPE) of graphite oxide was performed using a Hielscher UP200Ht (200 W, 26 kHz) ultrasonic probe. Attenuated total reflectance (ATR) infrared absorbance spectra were carried out with a Bruker Vertex 70v FT-IR vacuum spectrometer equipped with an A225/Q Platinum ATR unit with single reflection diamond crystal, which allows the infrared analysis of unevenly shaped solid samples and liquids through total reflection measurements, in a spectral range of 7500–380 cm−1. Raman spectra were obtained at room temperature using a modified LabRAM HR Raman Spectrometer (HORIBA Scientific, Kyoto, Japan). Raman excitation was achieved with a 532 nm central wavelength solid-state laser module with a maximum laser output power of 90 mW. The microscope is coupled with a 50× microscopic objective lens with 0.5 numerical aperture and 10.6 mm working distance (LMPlanFLN 50X/0.5, Olympus, Tokyo, Japan) that delivers the excitation light and collects the Raman signals. The laser spot size was approximately 1.7 μm laterally and about 2 μm axially. A 600 groves/mm grating was used, resulting in a Raman spectral resolution of ~2 cm−1. UV–vis absorption spectra were obtained with a Shimadzu UV-2401 PC Recording Spectrophotometer. The X-ray photoelectron spectroscopy (XPS) surface analysis measurements were performed in a UHV chamber (P~5 × 10⁻¹⁰ mbar) equipped with a SPECS Phoibos 100-1D-DLD hemispherical electron analyzer and a non-monochromatized dual-anode Mg/Al X-ray source for XPS (Berlin, Germany). The XP Spectra were recorded with MgKa at 1253.6 eV photon energy and an analyzer pass energy of 10 eV, giving a full width at half maximum (FWHM) of 0.85 eV for Ag3d5/2 line. The analyzed area was a spot with a 3 mm diameter. For spectra collection and treatment, including fitting, the commercial software SpecsLab Prodigy (by Specs GmbH, Berlin, Germany) was used. The XPS background was removed using the Shirley-type background subtraction. The atomic ratios were calculated from the intensity (peak area) of the XPS peaks, weighted with the corresponding relative sensitivity factors (RSF). All samples were in powder form and were pressed in foil for the XPS measurements.
Graphite oxide powder was prepared following an improved Hummers’ method [31]. More specifically, graphite powder (1 g) was added to sulfuric acid (H2SO4, 95%–98% 46 mL) and stirred in an ice bath for 20 min. Sodium nitrate (NaNO3, 1 g) was then added slowly and in small amounts at a time as the reaction is exothermic. The mixture was left stirring for 1 h. Potassium permanganate (KMnO4, 6 g) was added very slowly, and the mixture was left stirring for 24 h. The next day, the solution was stirred at 35 °C for 1 h and 40 min. The temperature was then increased to 90 °C, and deionized (DI) water (80 mL) was added very slowly. The mixture was left stirring at 90 °C for 40 min, after which it was removed from the hotplate and DI water (200 mL) was added slowly, followed by the careful addition of hydrogen peroxide solution (H2O2, 30%, 20 mL). The entire mixture was left stirring until it reached room temperature. Subsequently, the entire mixture was centrifugated (9000× g rpm or 9960× g for 5 min). The sediment was collected and washed firstly with warm DI water (200 mL, 65 °C), then with DI water at room temperature until the supernatant reached neutral pH. Finally, the sediment, which at this time consisted of pure and neutralized graphite oxide, was left to dry in a vacuum oven at 50 °C for 24 h. Once the product had dried, it was pulverized using a pestle and mortar to yield a fine graphite oxide powder.
Aqueous GO dispersions were prepared in ultrapure water (12 mg/mL) via LPE of the as-prepared graphite powder using an ultrasonication probe. Ultrasonication was carried out for 1.5 h under continuous operation at 26 kHz, 100% amplitude, 200 W inside an ice bath to avoid overheating. After the ultrasonic LPE process, the GO dispersion was subjected to mild centrifugation (1000× g rpm or 123× g for 5 min) to remove large aggregates. The resulting supernatant is the final GO dispersion used to prepare the moisture absorbing GO films. The concentration of this dispersion was determined via evaporation method to be 11.7 mg/mL.
Two different GO material geometries were created by a simple and facile drop-casting method: two GO pellets (GOPs) and a GO film (GOF). For the preparation of the GOP geometries, the as-prepared GO dispersion was deposited into custom-made 3D-printed circular molds (Ø = 1.5 cm). GOP-1 was prepared by depositing 1200 μL into the mold, while GOP-2 was prepared using 300 μL of GO dispersion. For each GOP, the mold was placed on a borosilicate glass Petri dish, which had previously undergone O2-plasma treatment (50 W, 5 min) to make the glass surface hydrophilic so that the aqueous dispersion can be deposited more evenly. The GO dispersion was deposited into the circular mold placed in an oven overnight so that the water evaporates under mild heating conditions (40 °C), leaving behind a solid pellet. To form the GOF geometry, the same GO dispersion (3 mL) was deposited into an O2-plasma-treated borosilicate glass Petri dish (Ø = 5 cm). The Petri dish was then placed in an oven overnight (40 °C), resulting in a thin, circular GO film. The GO film can be carefully peeled off the glass substrate, i.e., the Petri dish to yield free-standing GO films that can be divided into smaller pieces.
To evaluate the moisture absorption response and measure the moisture-induced voltage of the devices (Vo), we designed and constructed a three-element experimental set-up, comprising of (a) a custom-made humidity chamber designed and constructed in-house, (b) a humidity regulator, (c) software for data recording. The test chamber consisted of a transparent plastic box with an inlet valve through which it is filled with moisture carried by nitrogen (N2) gas and an exhaust outlet used to purge the box of humidity. Two pairs of banana clips, two positives (+) and two negatives (-), were inserted through one side of the box to be connected to each MEG device’s wires during measurements. The humidity circulation in the test chamber was produced by water that was heated inside a borosilicate gas bottle placed on a hotplate (up to 90 °C) and transferred into the chamber through N2 carrier gas. The RH within the humidity chamber was recorded using a digital hygrometer. The N2 gas source was also used to purge the humidity chamber, and thus remove moisture through the exhaust outlet via a different tube. The humidity was controlled by regulating the pressure and flow of the N2 gas using a pressure regulator and flow meter, respectively. This set-up was purpose-built to conveniently allow the switch between “humidifying mode” and “purge mode” with the use of a valve.
To prepare each MEG device, a GOP or a piece of GOF was placed on a glass substrate to ensure that the bottom side of the GO structure was partially sealed and that the top side was primarily available for moisture adsorption. This ensured asymmetrical moisturization of the GO structure to create the desired oxygen concentration and subsequent ionic gradient. The desired contacts were applied to the GOF or GOP surfaces using conductive silver paste. A copper wire was attached to each silver contact before the silver paste was left overnight to dry at room temperature.
To perform each measurement, the device was placed inside the humidity test chamber, which was then purged with N2 gas. The chamber was subsequently filled with water vapor carried by N2 gas at a rate of 4 L/min, which triggered the devices’ moisture absorption process. The chamber was continuously filled with water vapors until the sample reached its maximum Vo at approximately 90% RH. At this point, the valve was switched to “purge mode”, which filled the chamber with pure N2 gas at a rate of 25 L/min. This removed moisture from the chamber and allowed the device to undergo a moisture desorption process until it reached almost zero Vo. The output voltage data and two terminal electrical resistance were recorded using a Keithley 2700 Multimeter/Data Acquisition system driven by an in-house Matlab software data logging system. A Govee Bluetooth H5075 hygrometer/thermometer was used to record the RH.

3. Results

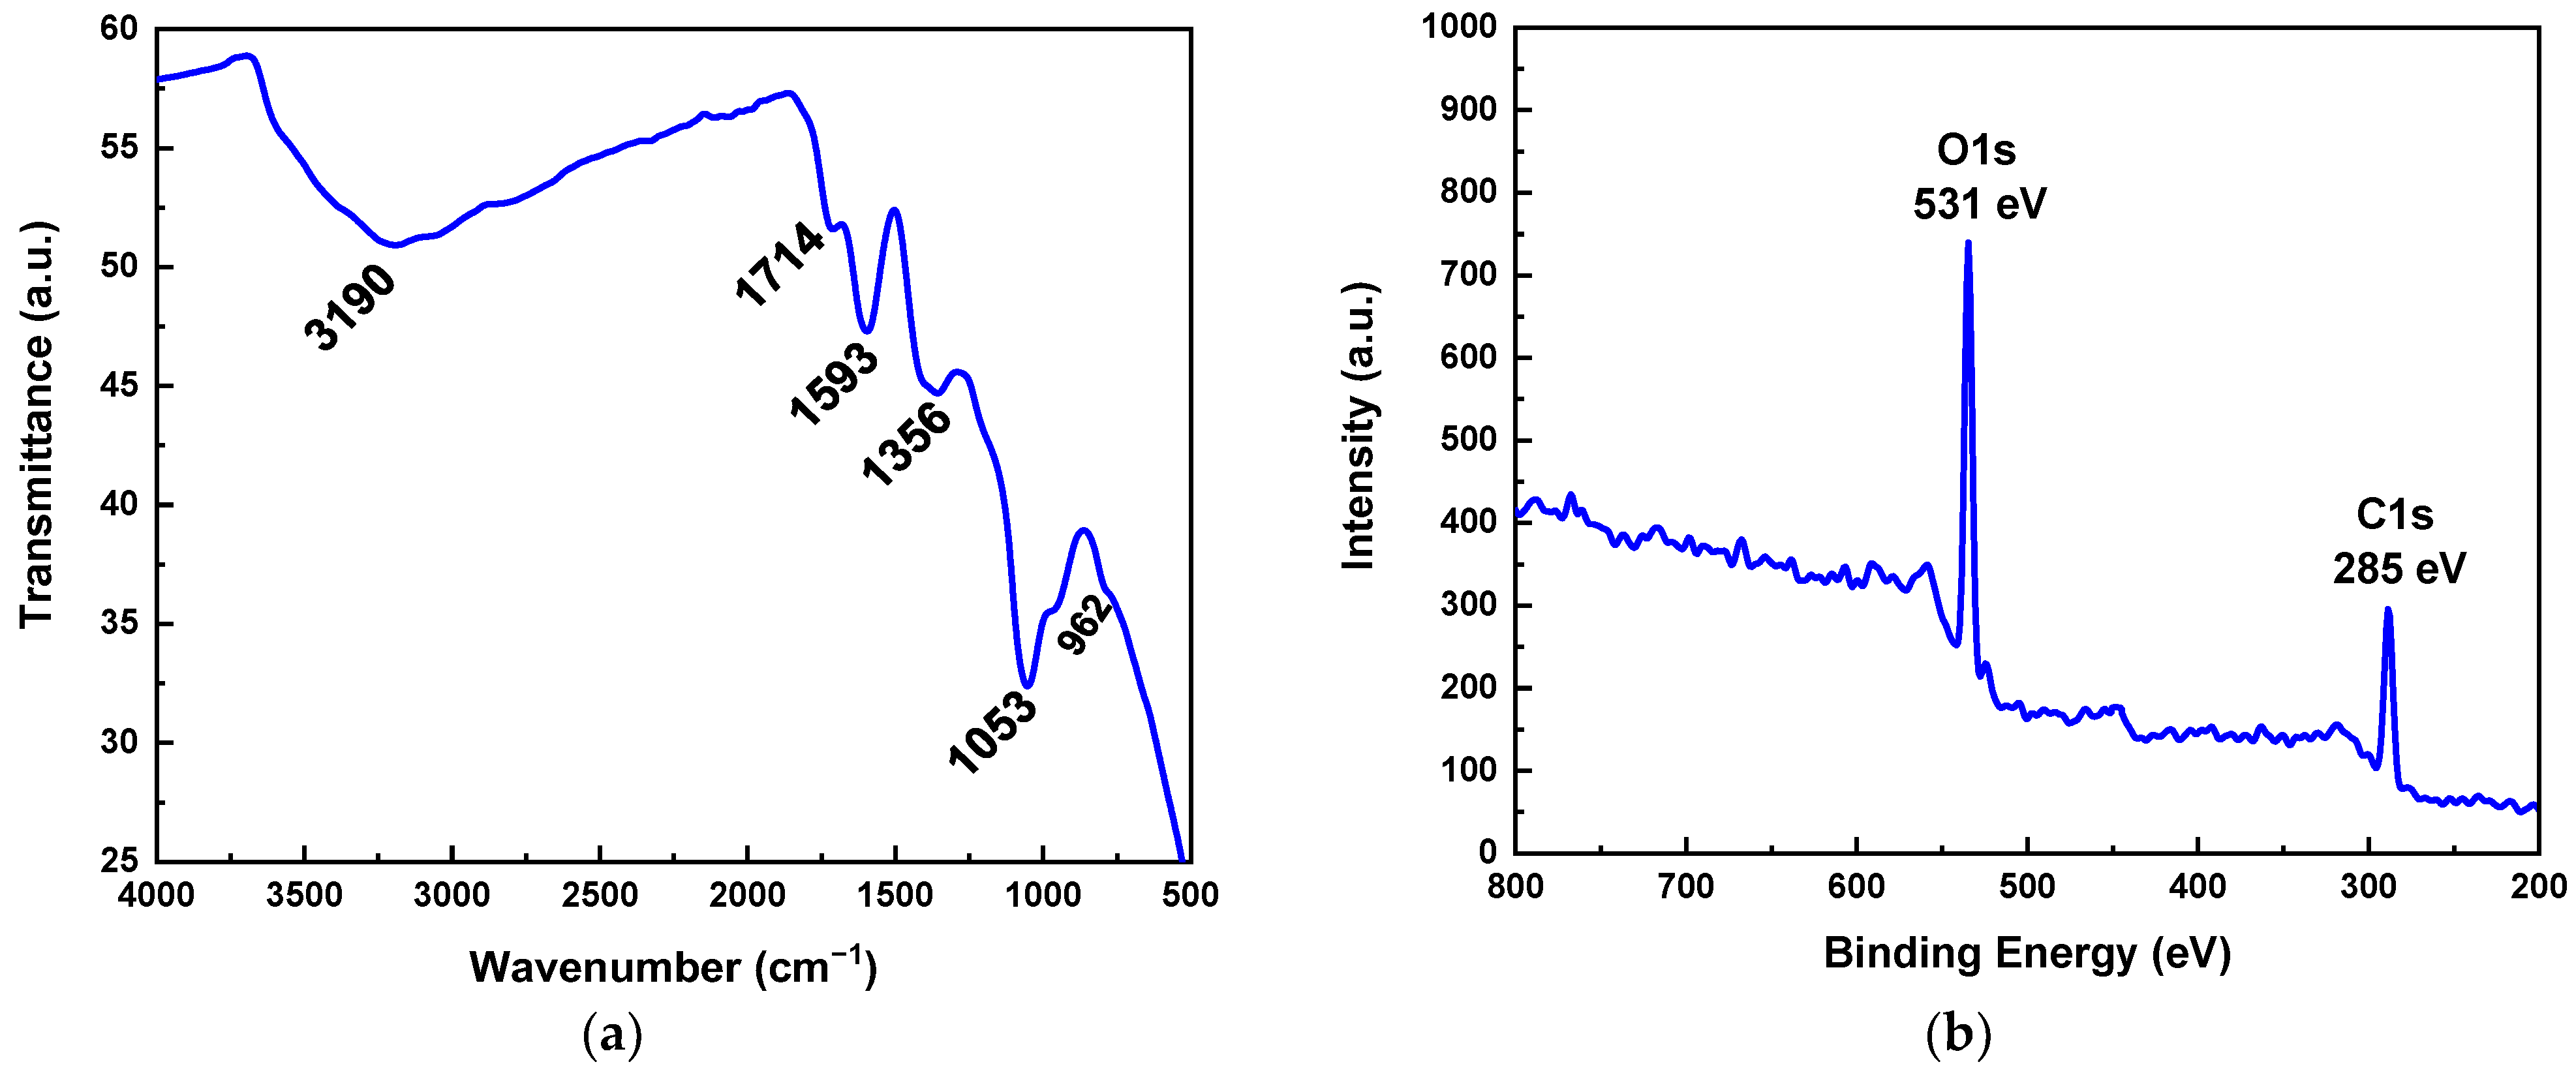
3.1. Characterisation of as-Prepared GO Powder

The chemical composition of the as-prepared graphite oxide powder was evaluated using attenuated total reflectance infrared Fourier transform (ATR FT-IR) spectroscopy and X-ray photoelectron spectroscopy (XPS). The resulting spectra are presented in Figure 1. The ATR-IR spectrum displays peaks at 1053 cm−1 (C-O stretching), 1356 cm−1 (O-H bending), 1593 cm−1 (aromatic C=C stretching), 1714 cm−1 (C=O stretching), and a broad shoulder positioned at ~3190 cm−1 (O-H stretching) [31,32,33,34,35]. The XPS spectrum displays the C1s peak at 258 eV and the O1s at 531 eV for the as-prepared graphite powder. The % atomic concentration of carbon (60.8 %) and oxygen (39.2%) was calculated from the peak areas of C1s and O1s, respectively (Figure S1). The C1s peak consists of the following five components: C-C sp2 bonds (284.5 eV), defective C-C sp3 bonds (285.4 eV), hydroxyls (C-O-H) or epoxides (C-O-C) (286.6 eV), carbonyls (C=O) (288.1 eV), and carboxyls (O=C-O-H) (289.1 eV) [36,37,38]. Table 1 lists the % concentration of each carbon component within the graphite oxide structure, as derived from the C1s peak deconvolution. We also performed Raman spectroscopy to complete the characterization of the graphite powder; the results of which are available in the Supporting Information (Figure S2).

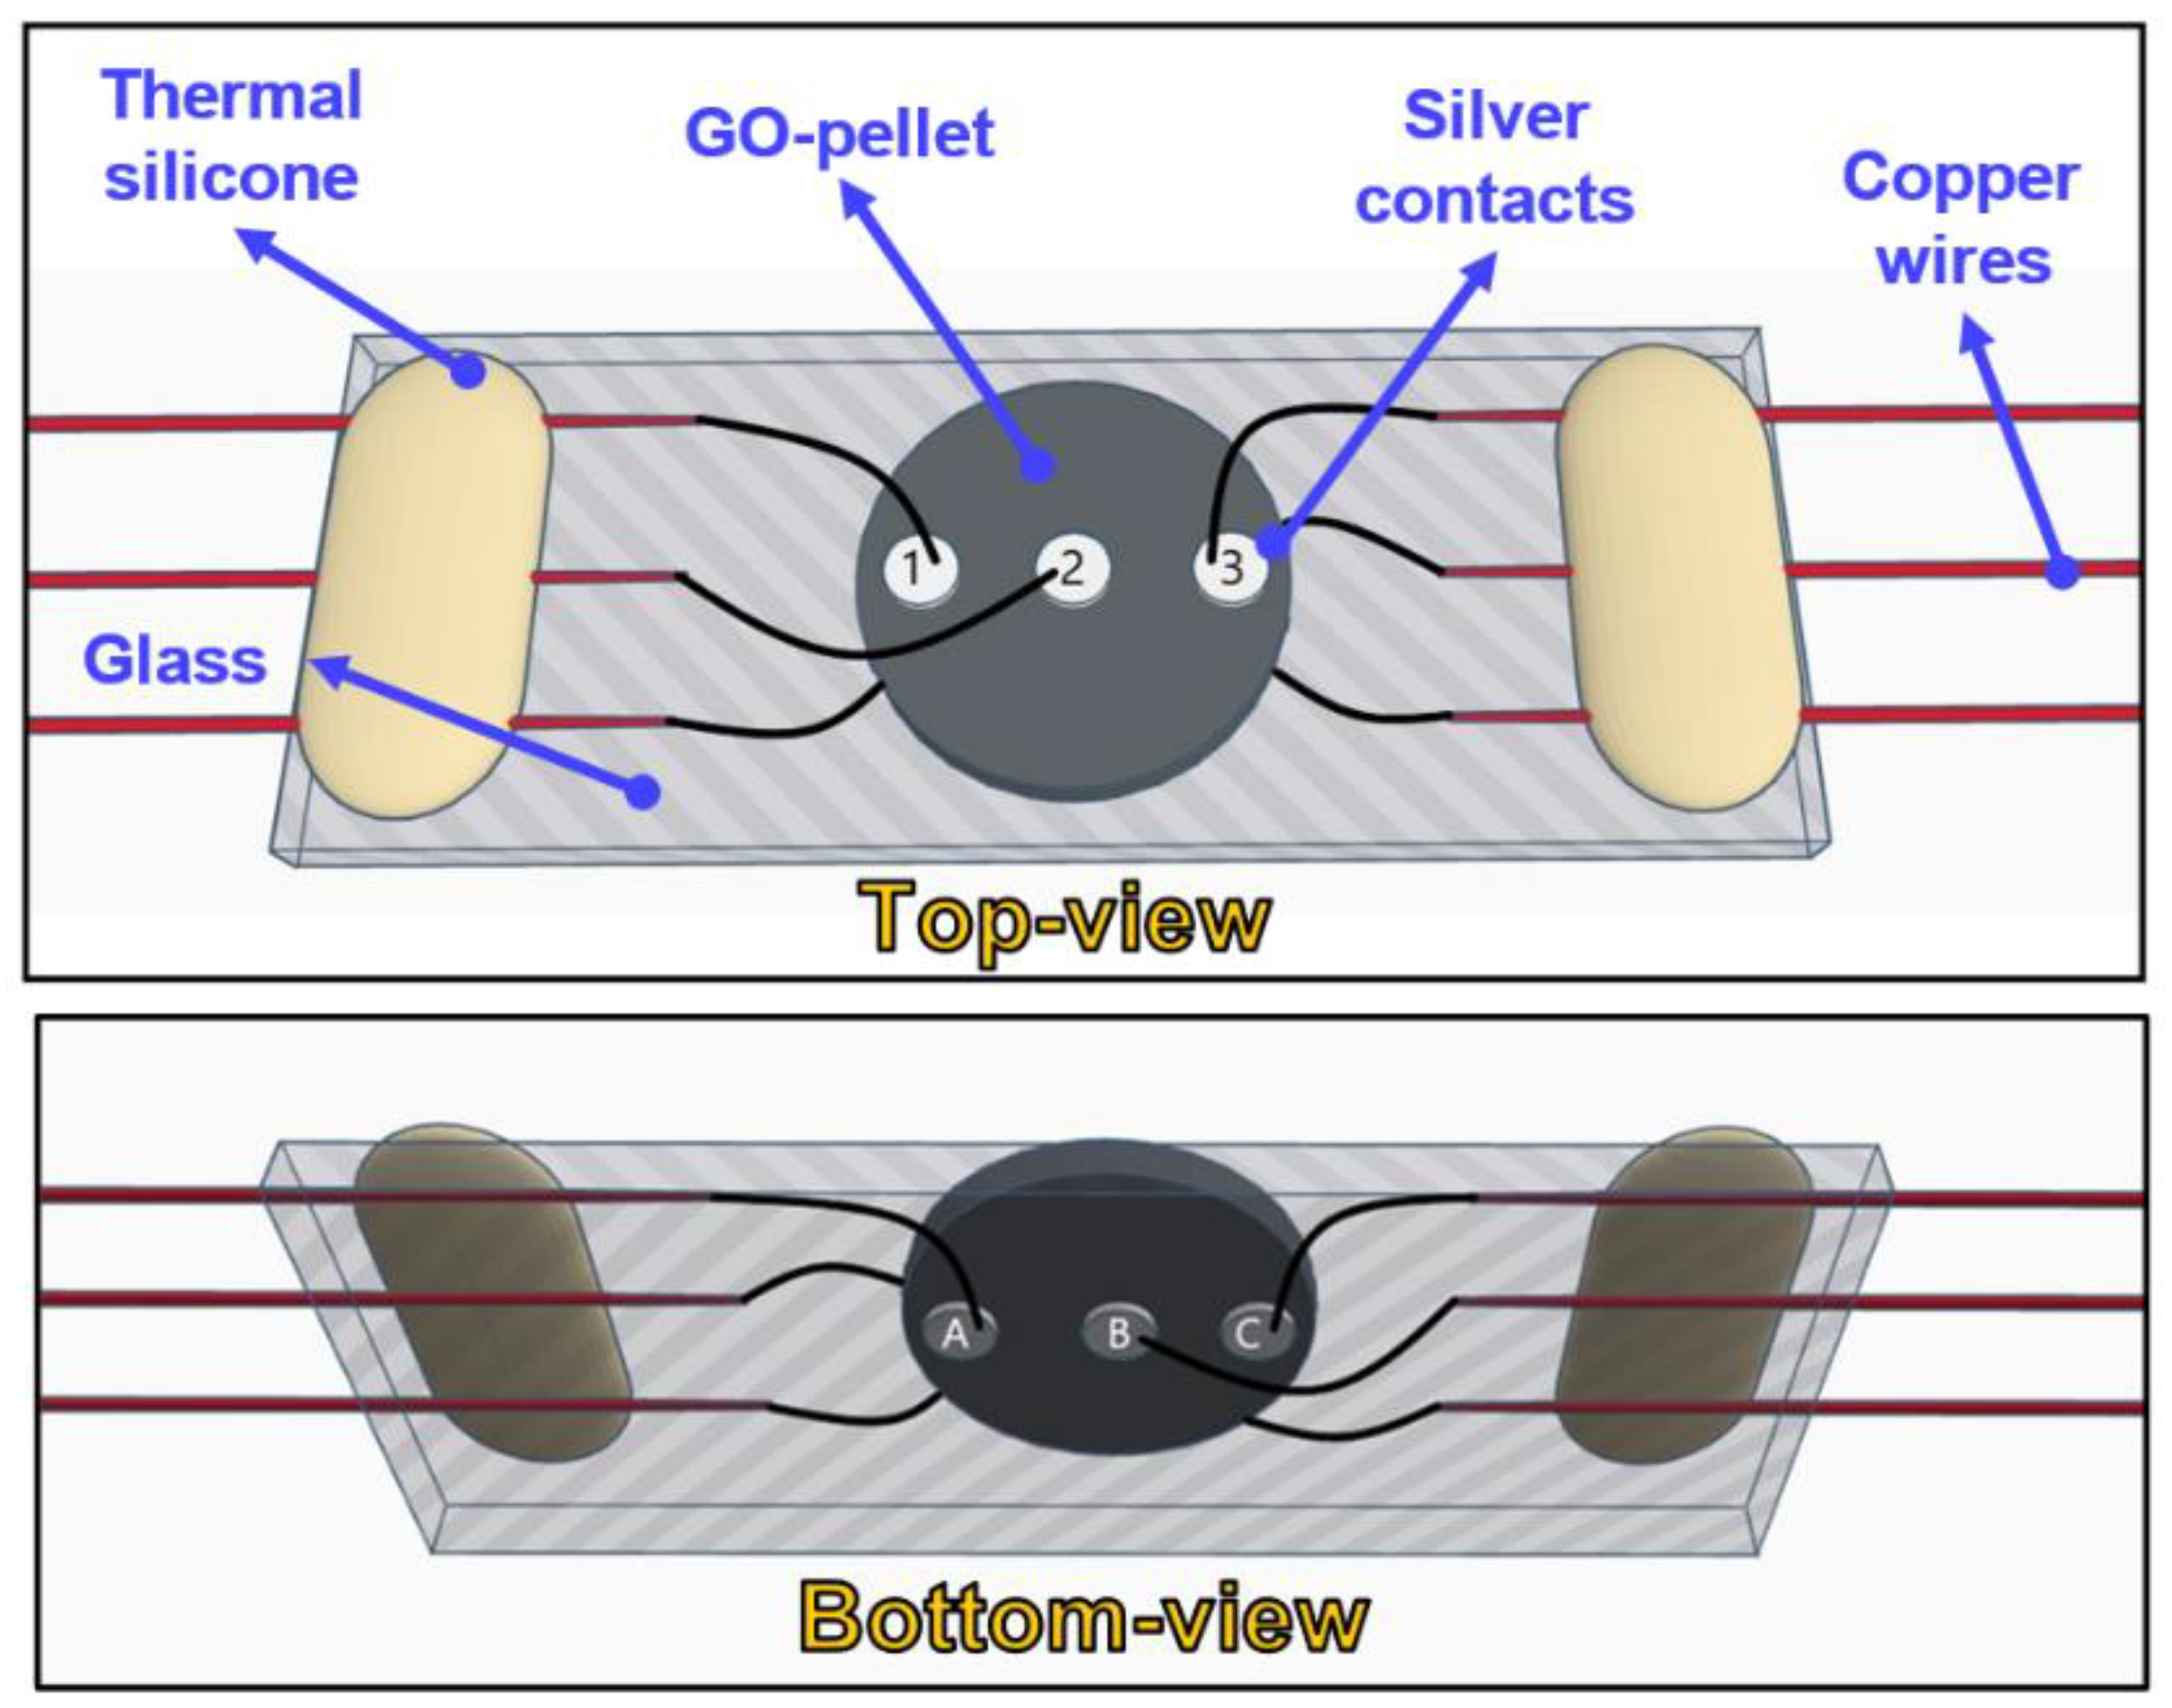
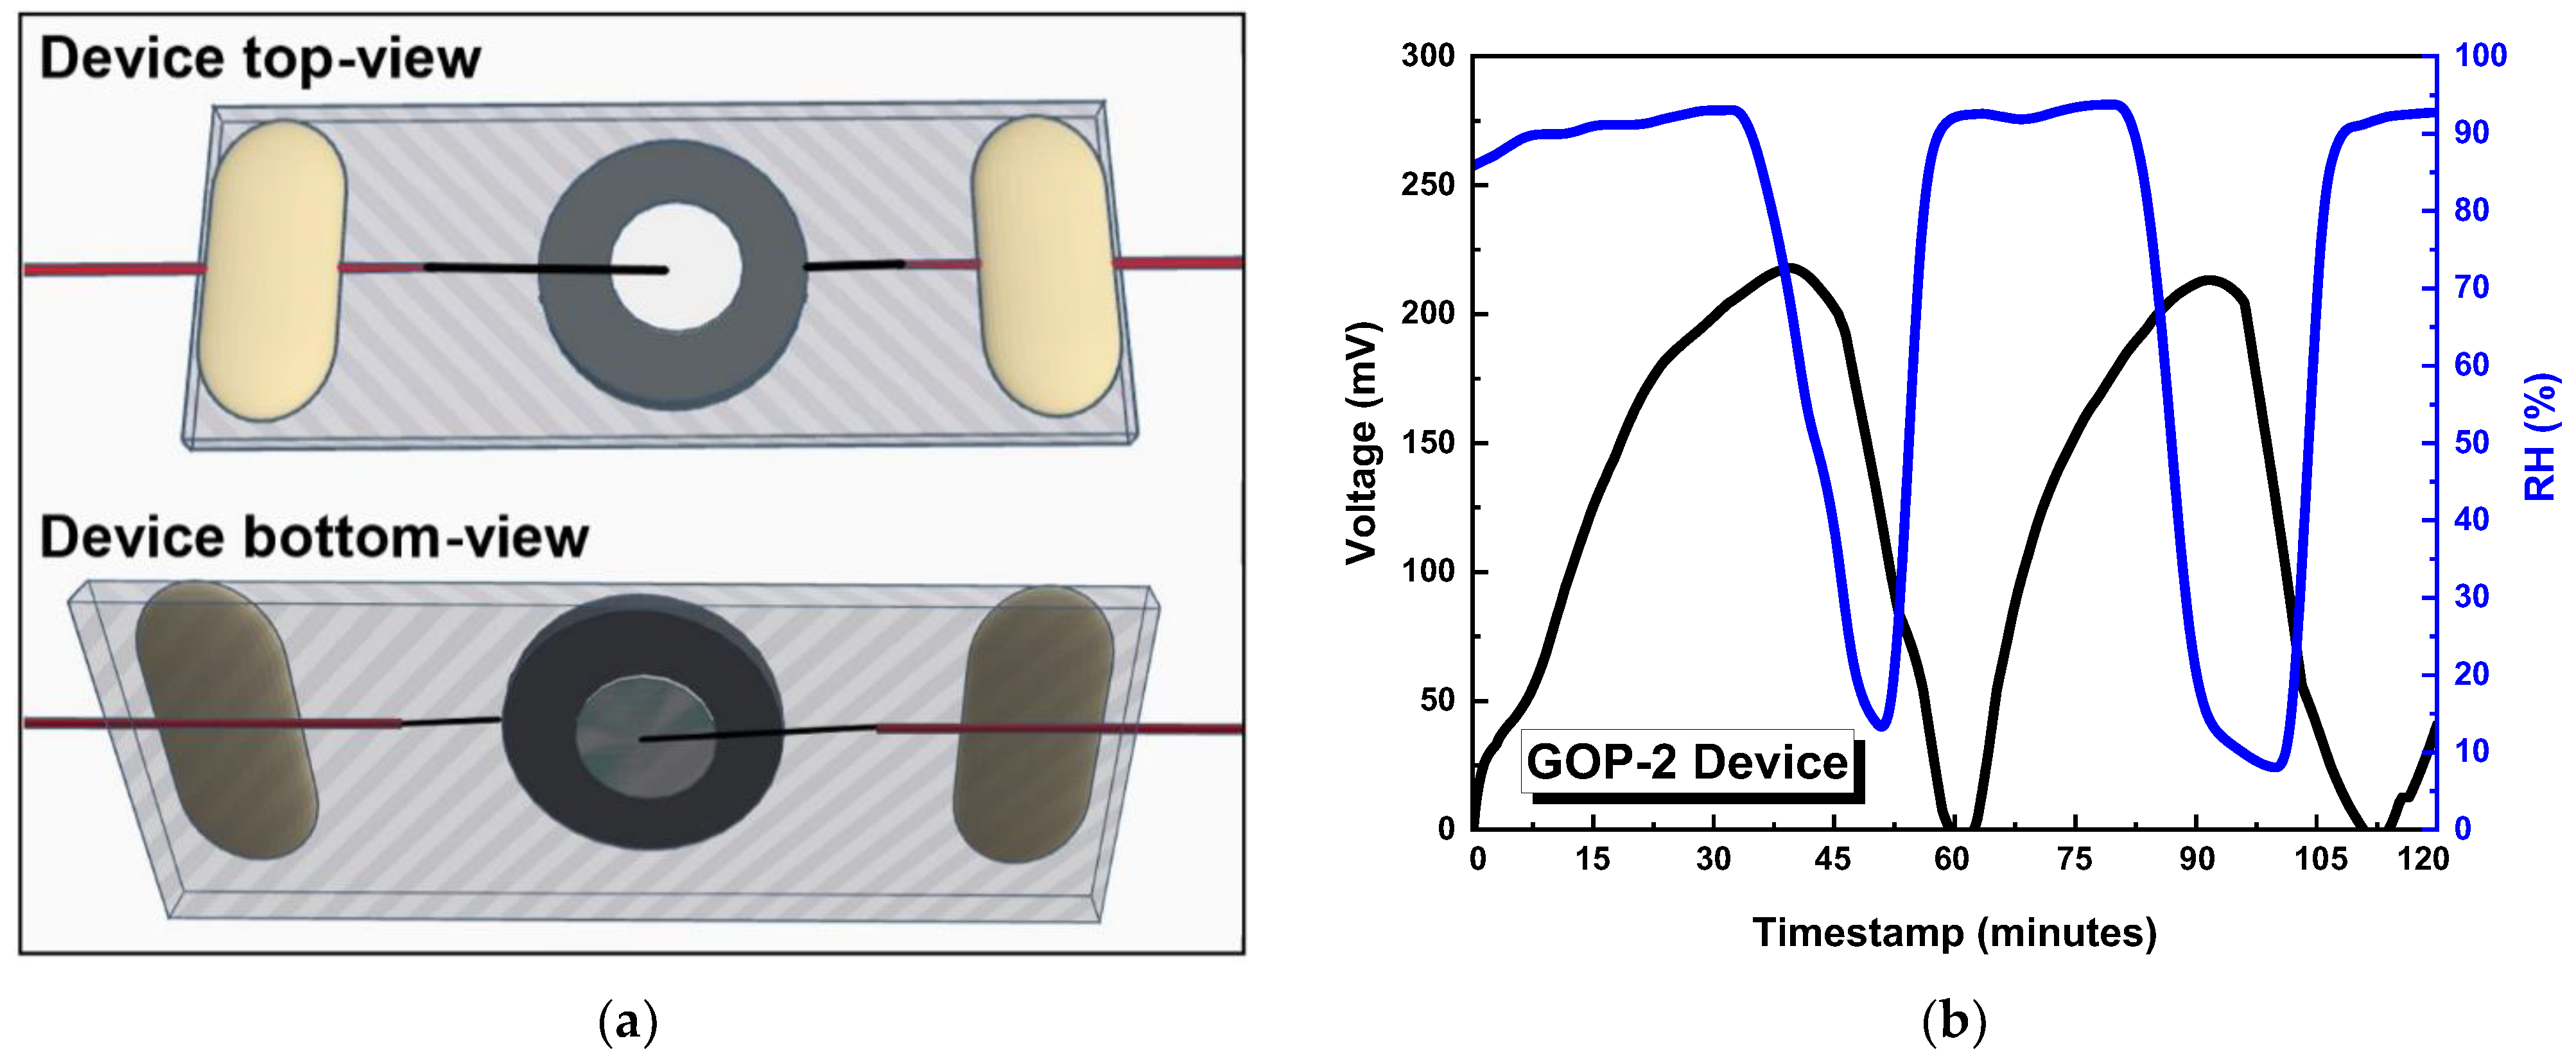
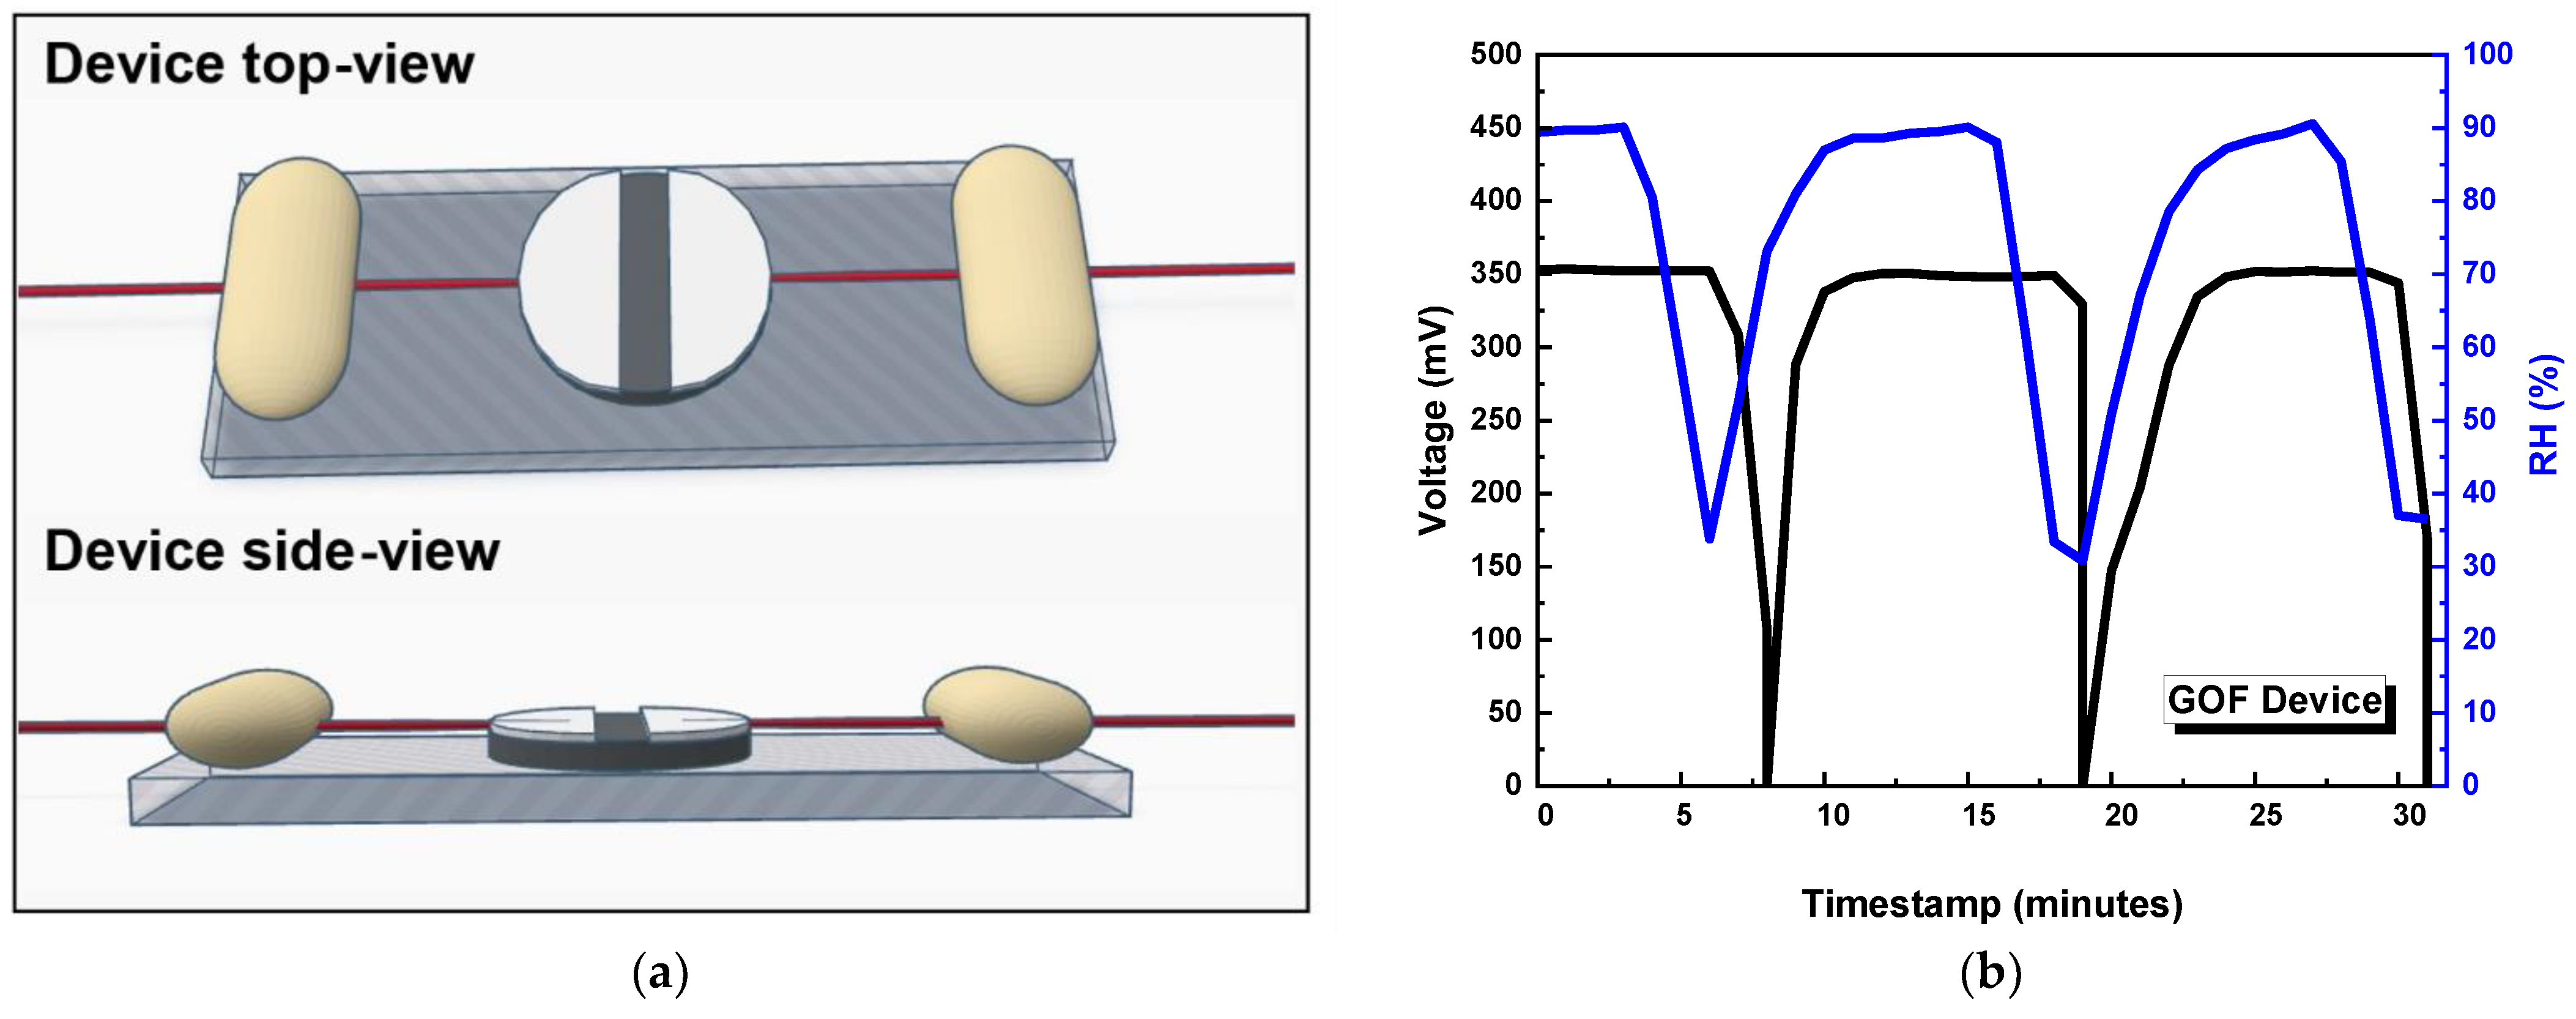
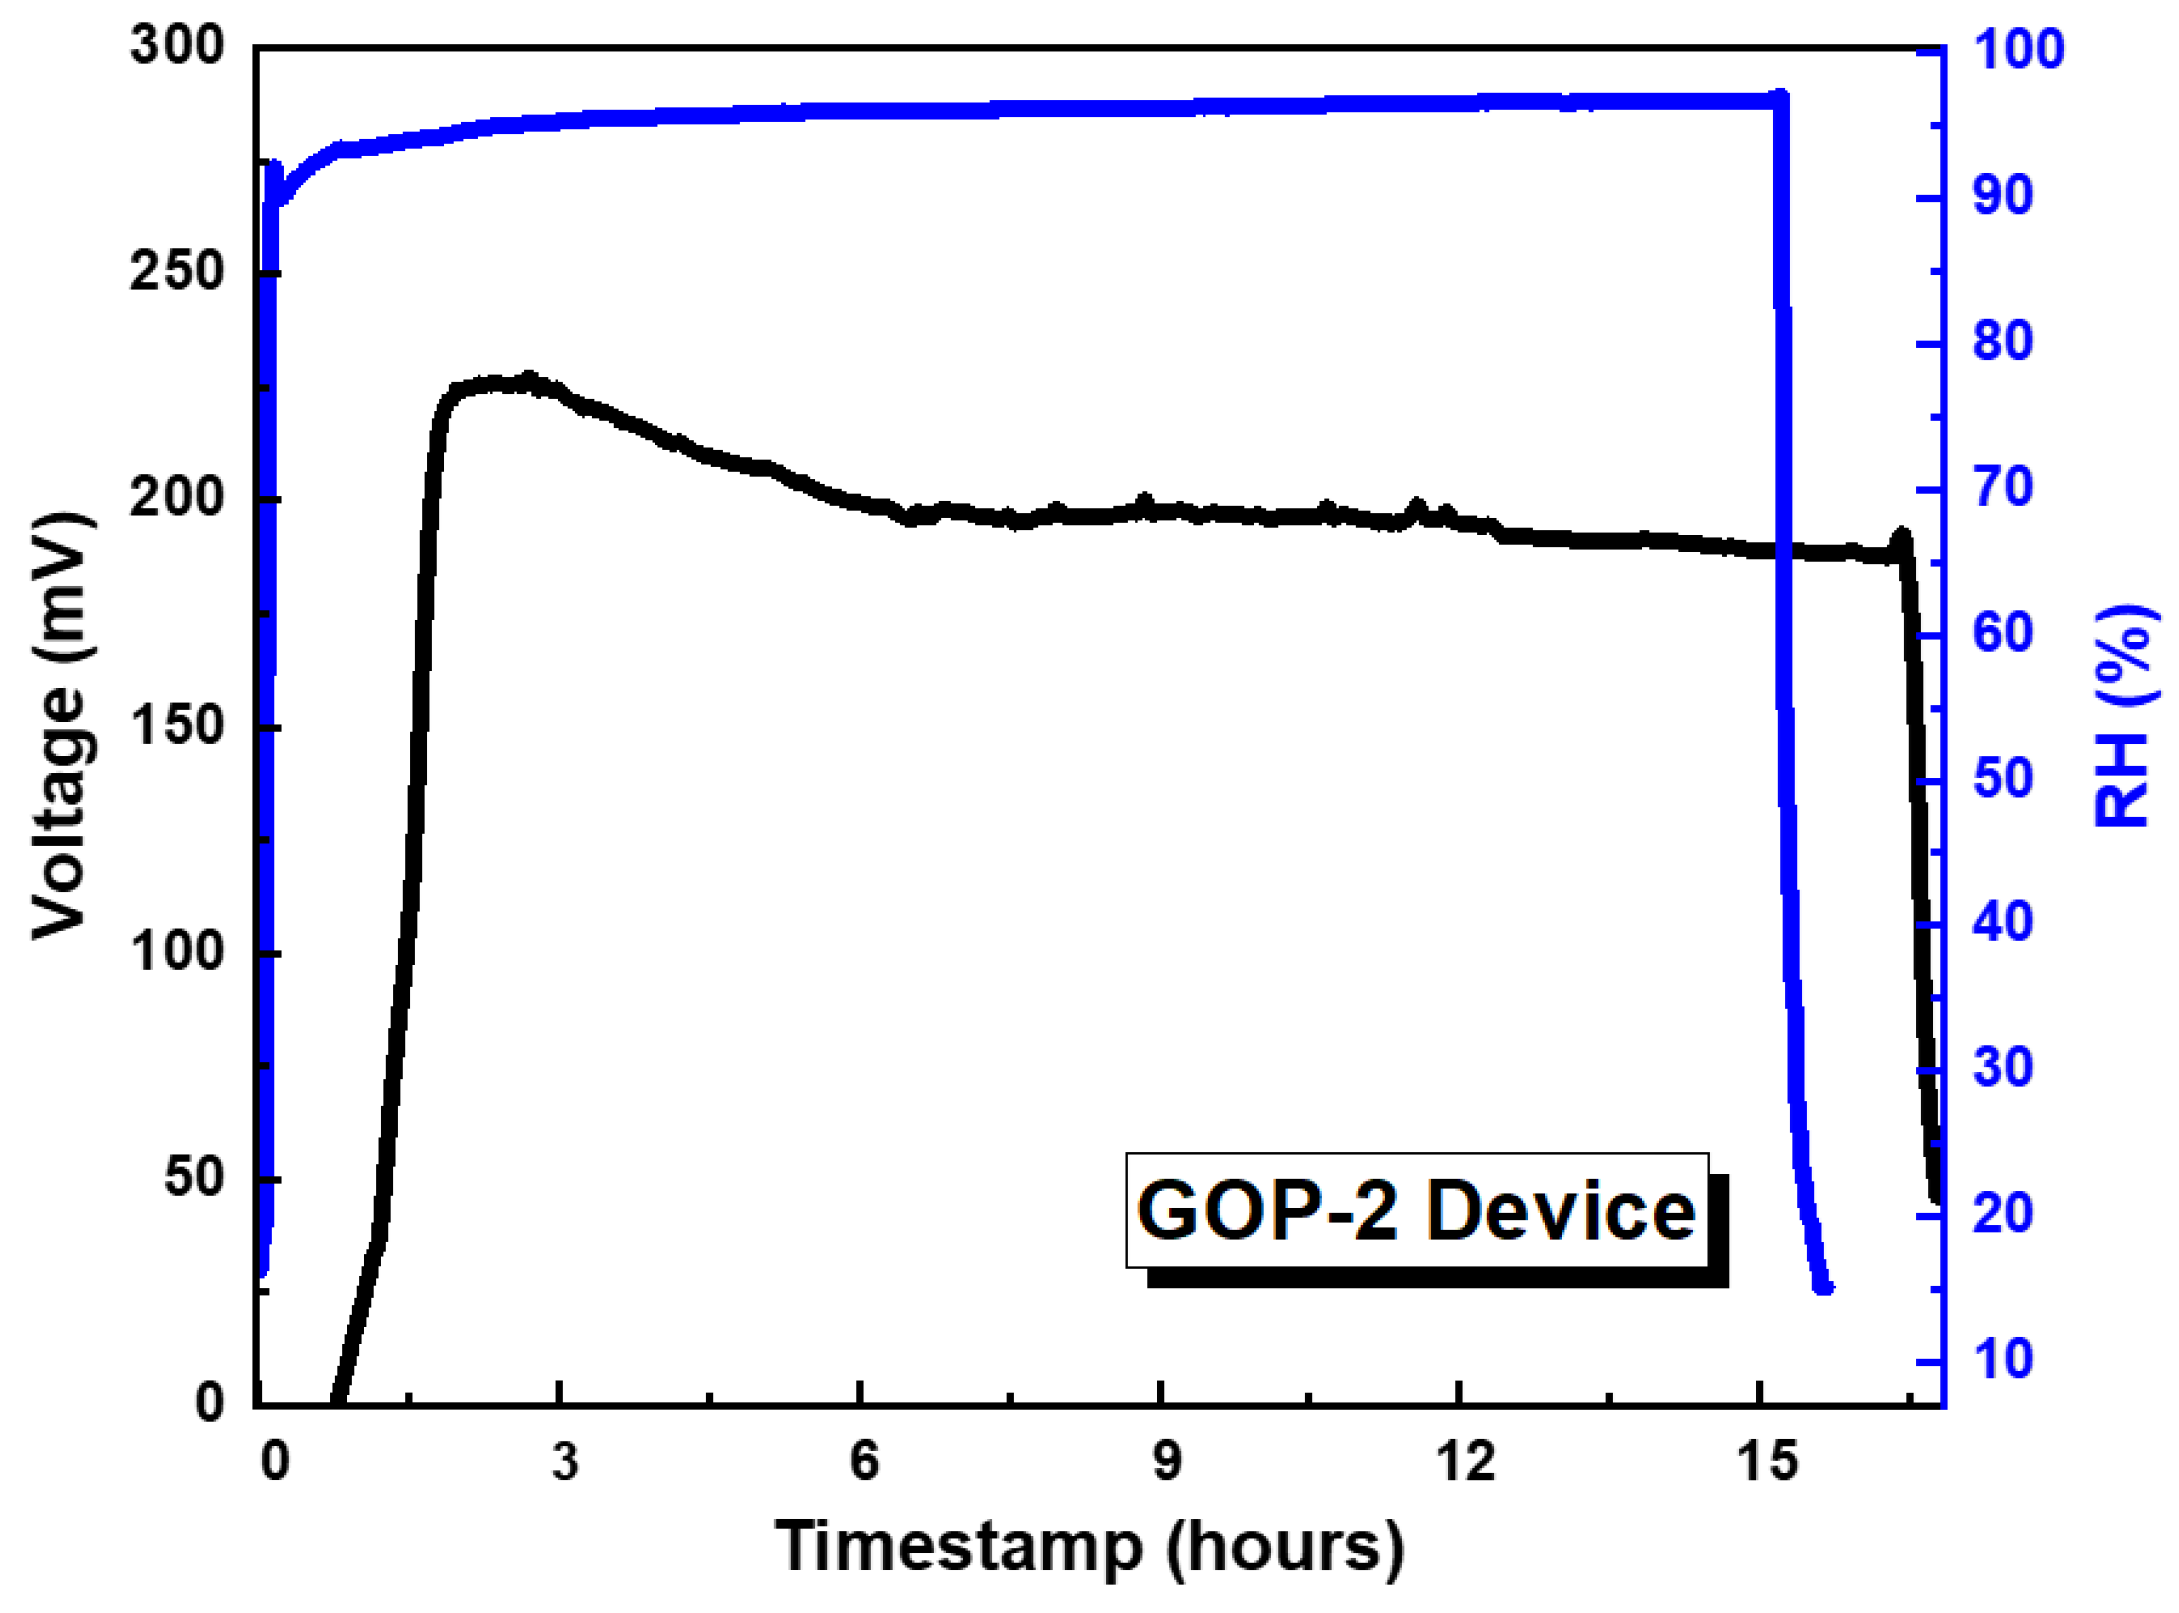
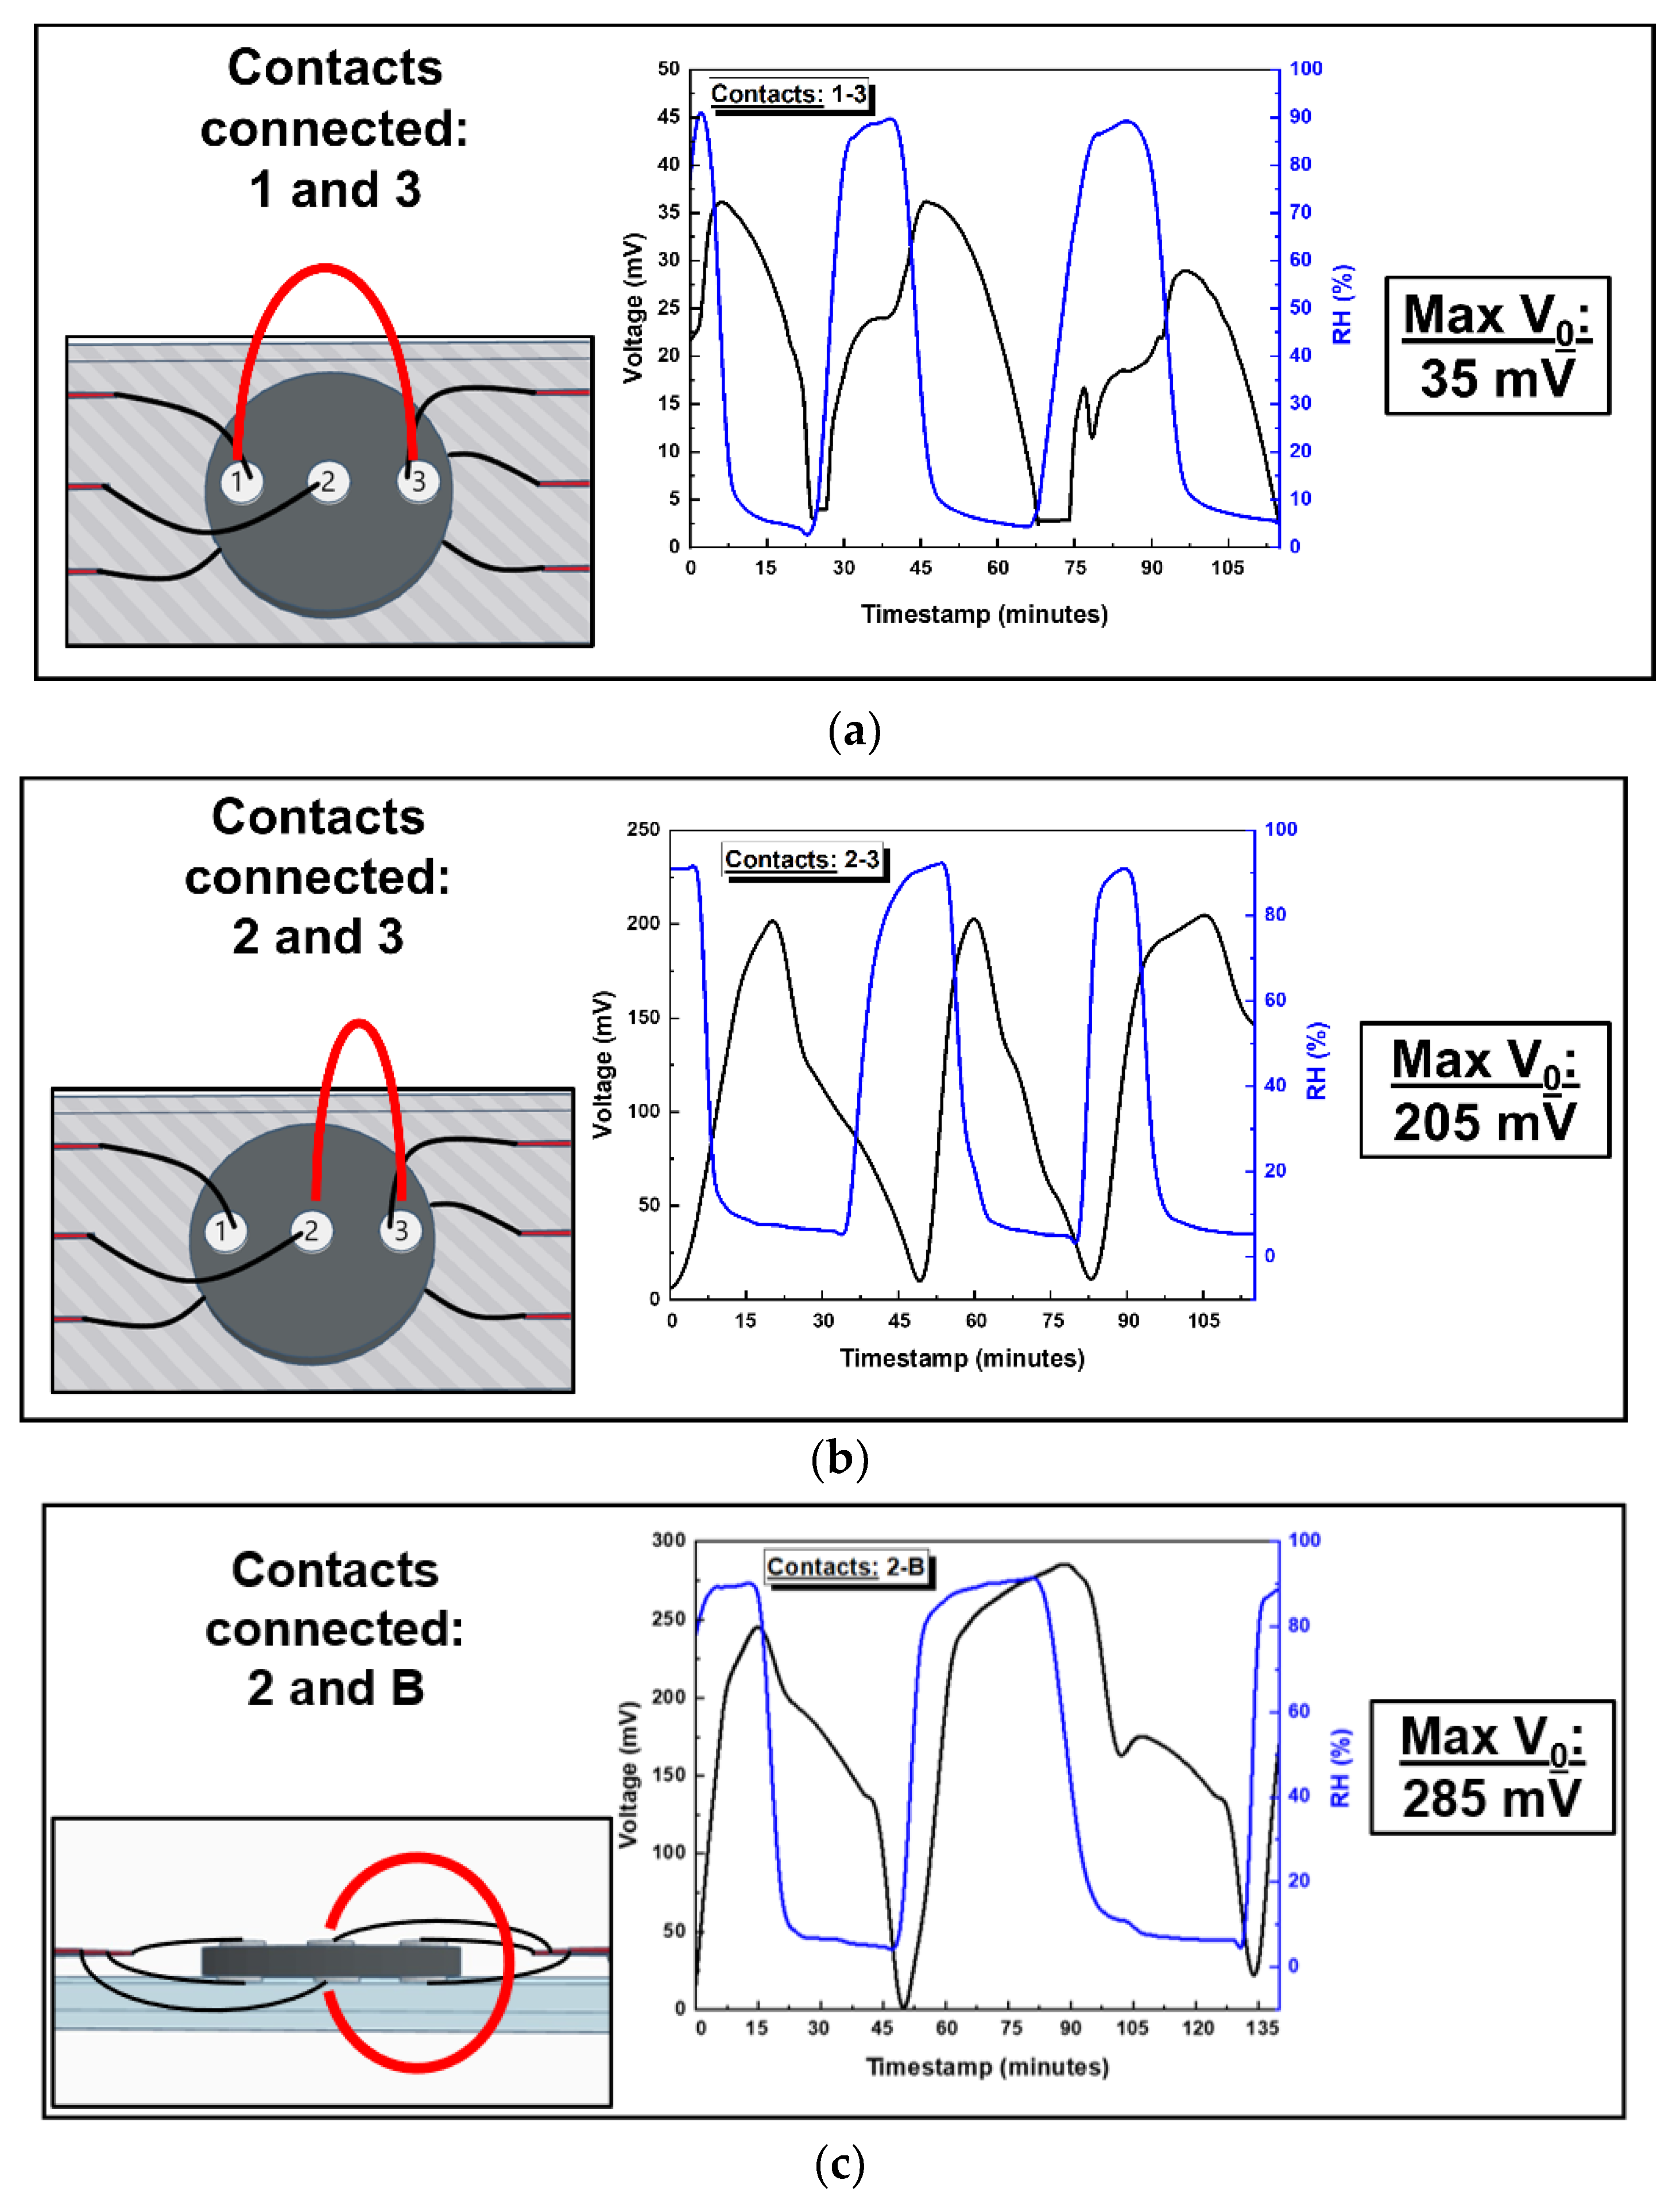
3.2. Characterisation of GO-Based MEGs Devices

A schematic representation of the custom experimental set-up built for moisture-induced voltage measurements is depicted in Figure 2, while digital photographs are presented in Figure S3. Initially, we assessed the effect of the contacts’ geometry by fabricating a GOP-based MEG device with multiple point-like contacts (GOP-1 device), as depicted in Figure 3. A digital photograph of this device is presented in Figure S4. A total number of six point-like contacts were applied to the sample, three distributed on the top surface (labelled as 1, 2, and 3) and three on the bottom side (labelled as A, B, and C). This multi-contact configuration aims to evaluate the effect of contacts’ configuration on the total Vo amplitude. More specifically the effects of contact distance (i.e., 1–2 (~1 mm) versus 1–3 electrode connection (~4 mm)), as well as the horizontal (i.e., 1–2 or A–B) versus the vertical (i.e., 2-B) plane orientation, with respect to GO were investigated. Figure 4 depicts the Vo generated by GOP-1 as a function of the relative humidity (RH) in the test chamber for variable contact configurations (the left axis reports Vo, while the right axis the RH). At least three cycles of RH variation from 90% to almost zero values are presented for all tested configurations, demonstrating the reproducibility of the results. Corresponding resistance versus RH plots are also recorded, with a typical example depicted in Figure S5.
Initial Vo values of pristine samples were varied between 5–20, independently from the contacts’ configurations. We identified two different pathways of achieving an enhanced Vo, either a) by performing multiple RH cycles until the sample exhibits a sudden Vo increase or b) by applying a DC bias to GO in high humidity environments (5 V for 120 s in 90% RH), which is in agreement with previous literature reports [39]. The mechanism behind this performance improvement is attributed to the emergence of a desirable gradient of oxygen-containing groups across the GO samples upon the application of a high electric field at high humidity conditions [40]. Throughout the rest of the manuscript, we depict the maximum achievable Vo values for each sample, unless otherwise stated.
The maximum Vo value extracted by contacts 1–3, which are placed ~4 mm apart, is approximately 35 mV, while the average Vo (Vave) was 33 ± 4 mV (Figure 4a). Contacts 2–3, however, which are ~1 mm apart, demonstrate a maximum Vo of approximately 205 mV (Vave = 203 ± 3 mV) (Figure 4b), indicating an inversely proportional relation to the contacts’ distance. Vo was also measured for contacts A–C, which are concealed between the glass substrate and GOP’s bottom surface, with the respective Vo/RH plot presented in Figure S6. Indeed, the Vo recorded was very suppressed (maximum Vo = 12 mV), as expected when measuring electrical contacts that are buried beneath the GO sample and have limited exposure to humidity. Regarding the time response of the GOP-based MEG, a period of approximately 15 min is required for the sample to reach the maximum Vo value during the increase in RH, while 30 min are required for the Vo to drop to a value of around zero during the decrease in RH. Figure 4c depicts corresponding results when electrodes have a vertical orientation, with respect to the GOP surface. The 2-B contacts’ configuration demonstrates a higher maximum Vo value reaching ~285 mV (Vave = 265 ± 25 mV).
An additional GOP-based MEG (GOP-2 device) was fabricated with a similar thickness to GOP-1, where large electrical contacts (instead of point-like contacts) were applied in a vertical orientation, with respect to the GO plane—a configuration that resembles a capacitor structure. A typical device schematic for this GOP-based MEG and a Vo response are presented in Figure 5, while a respective digital photograph of this MEG is shown in Figure S7a. The initial Vo value of the pristine sample was approximately 14 mV (Figure S7b). After Vo enhancement under suitable processing, a maximum Vo value of 220 mV is achieved. This MEG configuration also exhibits a slower response to RH variations, requiring more than 30 min in a high RH environment to reach its maximum Vo value during the moisture adsorption process, as shown in Figure 5b. During the desorption process, the time required for the Vo to go from the maximum value to about zero is also 30 min.
MEGs using GOF samples were also fabricated using broad silver contacts with a horizontal configuration, which is depicted along with a typical Vo response in Figure 6. A digital photograph of the device is depicted in Figure S8. Compared to the previous GOP-based devices, the GOF-based MEG exhibits a much faster response to RH increase (Figure 6b), namely ~3 min of exposure to high RH is sufficient for Vo to reach a maximum value of 350 mV (Vave = 350 ± 2 mV). Moreover, the sample exhibits a fast response to the reverse process of decreasing the RH, again requiring ~3 min for Vo to decrease from ~350 mV to almost zero.
Finally, the Vo stability under prolonged exposure to extreme humidity conditions was evaluated. A typical stability test involves exposing the device to an RH of 95% overnight (~15 h) and recording the Vo output. For instance, the results of the overnight stability test for the GOP-2 device are presented in Figure 7. The device reaches a maximum Vo of 225 mV. After 6 h of exposure to high RH, the Vo drops to 196 mV and finally to 187 mV when a total of 15 h has elapsed. This corresponds to a 12.8% and 16.8% decrease in voltage, respectively, compared to the initial Vo values, which was typical for all the MEG devices tested.

4. Discussion

Electricity generation from ambient moisture is a recently developed technology; therefore, a fully detailed interpretation of the mechanisms behind their operation is still under discussion. In the case of GO, the mechanism of electricity generation upon moisture absorption has been reported to be a chemical process based on ion, namely H+, generation and diffusion due to a gradient in oxygen concentration within GO [16,23,29]. When GO absorbs water molecules, the surface functional groups dissociate, thus releasing mobile H+. These protons then migrate due to the oxygen concentration gradient while the surface groups remain immobile. This results in the generation of an electric field and a voltage difference between the applied electrodes. As mentioned previously, the oxygen concentration gradient for our fabricated devices is created through asymmetrical moisturization by concealing the surface of the GO structure and allowing only the top surface to interact with the generated humidity.
Since oxygen content is a crucial factor, the first characterizations performed in this work aim to ensure sufficient and successful oxidation of graphite by assessing the chemical makeup of the modified Hummers’ reaction product. The obtained ATR-IR FT-IR and XPS spectra for the as-prepared graphite oxide powder confirm extensive decoration of the graphitic lattice upon the chemical oxidation of graphite powder via improved Hummers’ method (Figure 1). The obtained spectra reveal that the synthesized graphite oxide powder is rich in oxygen atoms, primarily in the form of hydroxyl (-OH) and epoxide (C-O-C) groups. The concentration (%) of each carbon component within the graphite oxide structure, as derived from the C1s peak deconvolution (Figure S1), reveals that the main oxygen-containing components are the C-O-H or C-O-C groups (45.5%), while the -C=O and -COOH content is much lower (9.8% and 3.6%, respectively) (Table 1). A high oxygen content within the GO structure is crucial for its effective performance as the moisture absorbing layer. Firstly, the presence of oxygen functional groups is what makes GO hydrophilic and, therefore, able to attract ambient water molecules. Secondly, the mechanism of electricity generation is dependent on the release of H+ moieties from GOs carboxyl groups. From the overall Raman spectrum, which is presented in Figure S2, it is evident that the as-prepared graphite oxide has a highly disordered structure due to the presence of many functional groups and the disruption of the sp2-hybridised carbon system. Further analysis of the Raman spectrum is available in the Supporting Information for this article.
We first investigate the effect of different point-like contacts’ configurations on the GOP-1 based MEG device. When comparing the Vo/RH plots presented in Figure 4, a time delay between RH values measured by the chamber’s RH sensor, and the actual Vo value recorded for the sample is observed. This is expected as, firstly, the sample is not directly adjacent to the sensor, and, secondly, there is an inherent time delay in the ions’ activation and diffusion because humidity absorption is not an instantaneous process. These circumstances lead to the observed time offset between the reported Vo and RH values. Resistance versus RH measurements reveal that the devices’ resistance is suppressed when the RH value increases. For example, in Figure S5, under low RH conditions, resistance exceeds values of 100 ΜΩ, whereas under high RH conditions the device’s resistance is reduced to a few MΩ.
We examined the effect of the distance between two point-like contacts when they are in a horizontal configuration. Connecting contacts 1–3 (Figure 4a), which are placed ~4 mm apart, yielded maximum of 35 mV, whereas contacts 2–3, which are closer to each other at ~1 mm apart, generated ~205 mV (Figure 4b). These results indicate that the distance between the contact probes is a crucial parameter in achieving high Vo values following an inverse scaling law. The dependence of Vo on the contacts’ distance can be interpreted using the gradient-induced ion diffusion mechanism, which was previously used to explain the device’s principle of operation. The electrical output is dependent not only on the density of generated ions but also on their sufficient migration [20,26]. This practically means that the larger distance between the two probe contacts translates to a larger distance the generated ions must travel, leading to lower ion capture due to losses, and thus lower reported Vo values. In the case of the A-C contacts connection (Figure 4, the contacts are practically concealed between the glass substrate and the GOP-1 sample. This makes the bottom surface exposure to humidity very limited, meaning there is little-to-no ionic gradient created within the GO surface due to a lack of asymmetrical moisturization, which, in turn, suppresses the Vo output (Figure S6) [41]. Regarding the humidity response time of the GOP-1 device, we report that approximately 15 min elapse before the sample reaches its maximum Vo value, while 30 min are required for moisture desorption and, by extension, decrease in the Vo to approximately zero (Figure 4).
The Vo generated when electrodes have a vertical orientation (i.e., 2-B), with respect to the GOP surface (Figure 4c) reaches a higher value (285 mV), compared to the in-plane contacts 1–3 (35 mV) and 2–3 (205 mV). In this configuration, the generated ions’ conduction is oriented vertically to the GO plane and not along the in-plane direction, which is favorable to the diffusion of generated ions, since this is the direction that the asymmetrical moisturization of GO takes place. Despite this, enhanced Vo values are recorded. We estimate that this is likely due to the smaller ion diffusion pathways between contacts 2-B, defined by the thickness of GOP-1, which is a few micrometers, versus the much larger diffusion pathways in the case of contacts 1–3 (~1 mm) or contacts 2–3 (~4 mm)
Next, we discuss the effects of the metallic contacts surface area on the MEG device performance. For this purpose, we compare the GOP-1 device with a point-like vertical contact connection (Figure 4c) and the GOP-2 device with larger contacts in a vertical configuration (Figure 4a). GOP-2 exhibits a slightly inferior Vo (maximum 220 mV) when compared to the value reported for the 2-B contacts’ configuration (maximum 285 mV). Furthermore, the GOP-2 device exhibits a slower humidity response, requiring more than 30 min in a high RH environment to reach its maximum Vo value during the moisture adsorption process, in contrast to samples with point-like contacts, which require ~15 min. This is most likely due to the smaller GO surface area available for exposure to humidity due to the broader silver pads. During the desorption process, on the other hand, both device geometries require ~30 min for the Vo to go from the maximum value to about zero. This phenomenon suggests that moisture desorption is a slower process compared to moisture adsorption and is not limited by the samples’ free surface area.
The GOF-based device exhibits a much faster humidity response as only 3 min of exposure to high RH is sufficient to reach a maximum Vo of 350 mV (Figure 6b). This fast response is also observed during the moisture desorption process, again requiring 3 min for Vo to decrease from ~350 mV to practically zero. These humidity response results are attributed to the smaller GOF sample thickness, in accordance with the literature [42]. Specifically, the smaller thickness allows the humidity variation to have a more direct effect on the GO resistance. In thick GOP samples, however, the moisture-induced protons activation is limited initially to the top surface of the GOP, and, over time, deeper humidity penetration takes place. We report, moreover, that typically the fabricated MEG devices exhibited good stability when tested overnight under very high humidity conditions (RH = 95%), with a decrease in Vo of less than 17% after 15 h (Figure 7). This prolonged Vo output can be attributed to a strong ionic gradient within the GO structure, due to the oxygen functional group gradient caused by asymmetrical moisturization [26]. The abundant proton density generated from the oxygen groups upon interaction with moisture is sufficient to maintain a prolonged electric field and, therefore, potential difference, i.e., Vo.
Finally, we would like to point out that both the GOF and GOP geometries are formed by simple and facile deposition methods of GO inks that are compatible with industrial-scale printing techniques, such as spray coating. Therefore, we present the prospect of upscaling the GO-based MEGs demonstrated in this work by employing spray coating or other large-area deposition methods towards a more facile device manufacturing. Furthermore, the in-series connection of multiple MEG devices, even in 3D configurations, would allow for the maximization of the generated voltage.

5. Conclusions

In this work, we fabricate and evaluate GO-based moisture energy generators (MEG) devices, which generate electrical current via a chemical mechanism, which involves the generation and diffusion of protons upon water molecule absorption. During our investigation, we demonstrated the effect of (a) the thickness of a GO-based moisture absorbing material structure and (b) the configuration of the electrical contacts on the voltage (Vo) generated by the fabricated MEG in response to relative humidity (RH) variations. We found that for thick, robust GO pellets (GOP), smaller distances between two horizontal contacts result in an increase in the maximum achievable Vo (from 35 to 205 mV). Switching to vertical contact configuration elicits increases from 205 to 285 mV. Additionally, we observed that replacing point contacts with larger area contacts results in a slightly increased Vo (from 205 to 220 mV) but a longer moisture absorption response time (from ~15 to ~30 min). For MEG devices, which employed a thinner GO film (GOF), we report a higher maximum Vo (~350 mV) and a much more rapid response to moisture adsorption and desorption (~3 min), which we attribute to shorter pathways for the generated H+ ions. Overall, this MEG structure tuning process allowed for the investigation of the optimum configuration towards achieving efficient moisture-based energy generation.

Supplementary Materials

The following supporting information can be downloaded at: https://www.mdpi.com/article/10.3390/coatings12121970/s1, Figure S1: (a) Deconvoluted XPS C1s peak; and (b) XPS O1s peak of graphite oxide powder synthesised via improved Hummers’ method; Figure S2: Raman spectrum of graphite oxide powder synthesised via improved Hummers’ method; Figure S3: Digital photographs of custom experimental set-up built for moisture-induced voltage measurements (a) entire set-up which consists of the humidity test chamber, MEG device, humidity production, and regulation components and data acquisition equipment; (b) humidity is produced by mildly heated water and regulated using a pressure regulator and a flow meter; (c) Close-up view of the interior of the test chamber; Figure S4: Digital photograph of fabricated GOP-1 device for evaluation of multiple contact configurations; Figure S5: Resistance (ΜΩ) of GOF device as a function of RH (%).; Figure S6: Voltage output as a function of RH when measuring contacts A-C of GOP-1 device. Since contacts A-C are practically concealed between the glass substrate and the GOP-1 sample, the bottom surface exposure to humidity is very limited, leading to suppressed Vo values.; Figure S7: (a) Digital photograph of MEG device constructed using a GOP-2 as the moisture-absorbing layer and large surface-area contacts in a vertical configuration (b) Moisture induced voltage (Vo) generated by the pristine GOP-2 device, i.e. without Vo enhancement by performing multiple RH cycles or by applying a DC bias in high humidity environments.; Figure S8: Digital photograph of MEG device constructed using GOF as the moisture-absorbing layer and large surface area contacts in the horizontal configuration. Cite the references from [43,44,45,46,47,48,49,50,51,52,53].

Author Contributions

Conceptualization, K.R. and E.K.; methodology, K.A., G.V. (George Veisakis) and K.R.; software, I.K. and G.V. (George Viskadouros); validation, K.A., G.V. (George Veisakis), and K.R.; formal analysis, K.A. and K.R.; investigation, K.A., K.R. and E.K.; resources, E.K.; data curation, K.A., G.V. (George Veisakis), I.K. and G.V. (George Viskadouros); writing—original draft preparation, K.A.; writing—review and editing, K.A., G.V. (George Veisakis) and K.R.; visualization, G.V. (George Veisakis) and K.A.; supervision, K.R. and E.K.; funding acquisition, K.R. and E.K. All authors have read and agreed to the published version of the manuscript.

Funding

The work has been supported by the European Union’s Horizon 2020 research and innovation program under project EMERGE. The EMERGE project has received funding under grant agreement No. 101008701.

Institutional Review Board Statement

Not applicable.

Informed Consent Statement

Not applicable.

Data Availability Statement

Not applicable.

Conflicts of Interest

The authors declare no conflict of interest.

References

  1. Rogdakis, K.; Karakostas, N.; Kymakis, E. Up-Scalable Emerging Energy Conversion Technologies Enabled by 2D Materials: From Miniature Power Harvesters towards Grid-Connected Energy Systems. Energy Environ. Sci. 2021, 14, 3352–3392. [Google Scholar] [CrossRef]
  2. Grosjean, B.; Bocquet, M.-L.; Vuilleumier, R. Versatile Electrification of Two-Dimensional Nanomaterials in Water. Nat. Commun. 2019, 10, 1656. [Google Scholar] [CrossRef] [PubMed] [Green Version]
  3. Zhang, Z.; Li, X.; Yin, J.; Xu, Y.; Fei, W.; Xue, M.; Wang, Q.; Zhou, J.; Guo, W. Emerging Hydrovoltaic Technology. Nat. Nanotechnol. 2018, 13, 1109–1119. [Google Scholar] [CrossRef] [PubMed]
  4. Zhang, G.; Duan, Z.; Qi, X.; Xu, Y.; Li, L.; Ma, W.; Zhang, H.; Liu, C.; Yao, W. Harvesting Environment Energy from Water-Evaporation over Free-Standing Graphene Oxide Sponges. Carbon 2019, 148, 1–8. [Google Scholar] [CrossRef]
  5. Yin, J.; Zhou, J.; Fang, S.; Guo, W. Hydrovoltaic Energy on the Way. Joule 2020, 4, 1852–1855. [Google Scholar] [CrossRef]
  6. Long, Y.; He, P.; Shao, Z.; Li, Z.; Kim, H.; Yao, A.M.; Peng, Y.; Xu, R.; Ahn, C.H.; Lee, S.-W.; et al. Moisture-Induced Autonomous Surface Potential Oscillations for Energy Harvesting. Nat. Commun. 2021, 12, 5287. [Google Scholar] [CrossRef]
  7. Shen, D.; Xiao, M.; Xiao, Y.; Zou, G.; Hu, L.; Zhao, B.; Liu, L.; Duley, W.W.; Zhou, Y.N. Self-Powered, Rapid-Response, and Highly Flexible Humidity Sensors Based on Moisture-Dependent Voltage Generation. ACS Appl. Mater. Interfaces 2019, 11, 14249–14255. [Google Scholar] [CrossRef]
  8. Zhang, Y.; Guo, S.; Yu, Z.G.; Qu, H.; Sun, W.; Yang, J.; Suresh, L.; Zhang, X.; Koh, J.J.; Tan, S.C. An Asymmetric Hygroscopic Structure for Moisture-Driven Hygro-Ionic Electricity Generation and Storage. Adv. Mater. 2022, 34, 2201228. [Google Scholar] [CrossRef]
  9. Cheng, H.; Liu, J.; Zhao, Y.; Hu, C.; Zhang, Z.; Chen, N.; Jiang, L.; Qu, L. Graphene Fibers with Predetermined Deformation as Moisture-Triggered Actuators and Robots. Angew. Chem. Int. Ed. 2013, 52, 10482–10486. [Google Scholar] [CrossRef]
  10. Liu, Y.-Q.; Chen, Z.-D.; Han, D.-D.; Mao, J.-W.; Ma, J.-N.; Zhang, Y.-L.; Sun, H.-B. Bioinspired Soft Robots Based on the Moisture-Responsive Graphene Oxide. Adv. Sci. 2021, 8, 2002464. [Google Scholar] [CrossRef]
  11. Pescetelli, S.; Agresti, A.; Viskadouros, G.; Razza, S.; Rogdakis, K.; Kalogerakis, I.; Spiliarotis, E.; Leonardi, E.; Mariani, P.; Sorbello, L.; et al. Integration of Two-Dimensional Materials-Based Perovskite Solar Panels into a Stand-Alone Solar Farm. Nat. Energy 2022, 7, 597–607. [Google Scholar] [CrossRef]
  12. Chatzimanolis, K.; Rogdakis, K.; Tsikritzis, D.; Tzoganakis, N.; Tountas, M.; Krassas, M.; Bellani, S.; Najafi, L.; Martín-García, B.; Oropesa-Nuñez, R.; et al. Inverted Perovskite Solar Cells with Enhanced Lifetime and Thermal Stability Enabled by a Metallic Tantalum Disulfide Buffer Layer. Nanoscale Adv. 2021, 3, 3124–3135. [Google Scholar] [CrossRef]
  13. Petrović, M.; Rogdakis, K.; Kymakis, E. Beneficial Impact of Materials with Reduced Dimensionality on the Stability of Perovskite-Based Photovoltaics. J. Phys. Energy 2019, 1, 044001. [Google Scholar] [CrossRef] [Green Version]
  14. Jiao, S.; Li, Y.; Li, J.; Abrha, H.; Liu, M.; Cui, J.; Wang, J.; Dai, Y.; Liu, X. Graphene Oxide as a Versatile Platform for Emerging Hydrovoltaic Technology. J. Mater. Chem. A 2022, 10, 18451–18469. [Google Scholar] [CrossRef]
  15. Wen, X.; Foller, T.; Jin, X.; Musso, T.; Kumar, P.; Joshi, R. Understanding Water Transport through Graphene-Based Nanochannels via Experimental Control of Slip Length. Nat. Commun. 2022, 13, 5690. [Google Scholar] [CrossRef]
  16. Zhu, R.; Zhu, Y.; Chen, F.; Patterson, R.; Zhou, Y.; Wan, T.; Hu, L.; Wu, T.; Joshi, R.; Li, M.; et al. Boosting Moisture Induced Electricity Generation from Graphene Oxide through Engineering Oxygen-Based Functional Groups. Nano Energy 2022, 94, 106942. [Google Scholar] [CrossRef]
  17. Medhekar, N.V.; Ramasubramaniam, A.; Ruoff, R.S.; Shenoy, V.B. Hydrogen Bond Networks in Graphene Oxide Composite Paper: Structure and Mechanical Properties. ACS Nano 2010, 4, 2300–2306. [Google Scholar] [CrossRef]
  18. Paredes, J.I.; Villar-Rodil, S.; Martínez-Alonso, A.; Tascón, J.M.D. Graphene Oxide Dispersions in Organic Solvents. Langmuir 2008, 24, 10560–10564. [Google Scholar] [CrossRef]
  19. Huang, Y.; Wang, C.; Shao, C.; Wang, B.; Chen, N.; Jin, H.; Cheng, H.; Qu, L. Graphene Oxide Assemblies for Sustainable Clean-Water Harvesting and Green-Electricity Generation. Acc. Mater. Res. 2021, 2, 97–107. [Google Scholar] [CrossRef]
  20. Shen, D.; Duley, W.W.; Peng, P.; Xiao, M.; Feng, J.; Liu, L.; Zou, G.; Zhou, Y.N. Moisture-Enabled Electricity Generation: From Physics and Materials to Self-Powered Applications. Adv. Mater. 2020, 32, 2003722. [Google Scholar] [CrossRef]
  21. Liu, R.; Gong, T.; Zhang, K.; Lee, C. Graphene Oxide Papers with High Water Adsorption Capacity for Air Dehumidification. Sci. Rep. 2017, 7, 9761. [Google Scholar] [CrossRef] [PubMed] [Green Version]
  22. Lian, B.; De Luca, S.; You, Y.; Alwarappan, S.; Yoshimura, M.; Sahajwalla, V.; Smith, S.C.; Leslie, G.; Joshi, R.K. Extraordinary Water Adsorption Characteristics of Graphene Oxide. Chem. Sci. 2018, 9, 5106–5111. [Google Scholar] [CrossRef] [PubMed] [Green Version]
  23. Yang, C.; Huang, Y.; Cheng, H.; Jiang, L.; Qu, L. Rollable, Stretchable, and Reconfigurable Graphene Hygroelectric Generators. Adv. Mater. 2019, 31, 1805705. [Google Scholar] [CrossRef] [PubMed]
  24. Zhao, F.; Wang, L.; Zhao, Y.; Qu, L.; Dai, L. Graphene Oxide Nanoribbon Assembly toward Moisture-Powered Information Storage. Adv. Mater. 2017, 29, 1604972. [Google Scholar] [CrossRef] [PubMed]
  25. Zhao, F.; Liang, Y.; Cheng, H.; Jiang, L.; Qu, L. Highly Efficient Moisture-Enabled Electricity Generation from Graphene Oxide Frameworks. Energy Environ. Sci. 2016, 9, 912–916. [Google Scholar] [CrossRef]
  26. Liang, Y.; Zhao, F.; Cheng, Z.; Deng, Y.; Xiao, Y.; Cheng, H.; Zhang, P.; Huang, Y.; Shao, H.; Qu, L. Electric Power Generation via Asymmetric Moisturizing of Graphene Oxide for Flexible, Printable and Portable Electronics. Energy Environ. Sci. 2018, 11, 1730–1735. [Google Scholar] [CrossRef]
  27. Zhao, F.; Cheng, H.; Zhang, Z.; Jiang, L.; Qu, L. Direct Power Generation from a Graphene Oxide Film under Moisture. Adv. Mater. 2015, 27, 4351–4357. [Google Scholar] [CrossRef]
  28. Cheng, H.; Huang, Y.; Zhao, F.; Yang, C.; Zhang, P.; Jiang, L.; Shi, G.; Qu, L. Spontaneous Power Source in Ambient Air of a Well-Directionally Reduced Graphene Oxide Bulk. Energy Environ. Sci. 2018, 11, 2839–2845. [Google Scholar] [CrossRef]
  29. Huang, Y.; Cheng, H.; Yang, C.; Yao, H.; Li, C.; Qu, L. All-Region-Applicable, Continuous Power Supply of Graphene Oxide Composite. Energy Environ. Sci. 2019, 12, 1848–1856. [Google Scholar] [CrossRef]
  30. Huang, Y.; Cheng, H.; Yang, C.; Zhang, P.; Liao, Q.; Yao, H.; Shi, G.; Qu, L. Interface-Mediated Hygroelectric Generator with an Output Voltage Approaching 1.5 Volts. Nat. Commun. 2018, 9, 4166. [Google Scholar] [CrossRef]
  31. Anagnostou, K.; Stylianakis, M.M.; Atsalakis, G.; Kosmidis, D.M.; Skouras, A.; Stavrou, I.J.; Petridis, K.; Kymakis, E. An Extensive Case Study on the Dispersion Parameters of HI-Assisted Reduced Graphene Oxide and Its Graphene Oxide Precursor. J. Colloid Interface Sci. 2020, 580, 332–344. [Google Scholar] [CrossRef] [PubMed]
  32. Konios, D.; Stylianakis, M.M.; Stratakis, E.; Kymakis, E. Dispersion Behaviour of Graphene Oxide and Reduced Graphene Oxide. J. Colloid Interface Sci. 2014, 430, 108–112. [Google Scholar] [CrossRef] [PubMed]
  33. He, D.; Peng, Z.; Gong, W.; Luo, Y.; Zhao, P.; Kong, L. Mechanism of a Green Graphene Oxide Reduction with Reusable Potassium Carbonate. RSC Adv. 2015, 5, 11966–11972. [Google Scholar] [CrossRef]
  34. Seol, Y.G.; Trung, T.Q.; Yoon, O.-J.; Sohn, I.-Y.; Lee, N.-E. Nanocomposites of Reduced Graphene Oxide Nanosheets and Conducting Polymer for Stretchable Transparent Conducting Electrodes. J. Mater. Chem. 2012, 22, 23759. [Google Scholar] [CrossRef]
  35. Savchenko, I.A.; Berezhnytska, A.S.; Mishchenko, A. New Nanosized Systems of Polymer Metal Complexes Based β-Diketones and Lanthanides for Electroluminescent Devices. In Nanoplasmonics, Nano-Optics, Nanocomposites, and Surface Studies; Fesenko, O., Yatsenko, L., Eds.; Springer Proceedings in Physics; Springer International Publishing: Cham, Switzerland, 2015; Volume 167, pp. 433–443. [Google Scholar]
  36. Sygellou, L.; Paterakis, G.; Galiotis, C.; Tasis, D. Work Function Tuning of Reduced Graphene Oxide Thin Films. J. Phys. Chem. C 2016, 120, 281–290. [Google Scholar] [CrossRef]
  37. Carbon Spectra—Graphene Oxide. Available online: https://xps-database.com/carbon-spectra-graphene-oxide/ (accessed on 25 August 2022).
  38. Sundaram, M.M.; Appadoob, D. Electrolyte with Binary Metal Oxide for Symmetric Supercapacitors: Capacitive vs. Faradaic. Dalton Trans. 2020, 49, 11743–11755. [Google Scholar] [CrossRef]
  39. Liang, Y.; Zhao, F.; Cheng, Z.; Zhou, Q.; Shao, H.; Jiang, L.; Qu, L. Self-Powered Wearable Graphene Fiber for Information Expression. Nano Energy 2017, 32, 329–335. [Google Scholar] [CrossRef]
  40. Wang, X.; Lin, F.; Wang, X.; Fang, S.; Tan, J.; Chu, W.; Rong, R.; Yin, J.; Zhang, Z.; Liu, Y.; et al. Hydrovoltaic Technology: From Mechanism to Applications. Chem. Soc. Rev. 2022, 51, 4902–4927. [Google Scholar] [CrossRef]
  41. Liu, X.; Gao, H.; Ward, J.E.; Liu, X.; Yin, B.; Fu, T.; Chen, J.; Lovley, D.R.; Yao, J. Power Generation from Ambient Humidity Using Protein Nanowires. Nature 2020, 578, 550–554. [Google Scholar] [CrossRef]
  42. Beniwal, A.; Ganguly, P.; Aliyana, A.K.; Khandelwal, G.; Dahiya, R. Screen-Printed Graphene-Carbon Ink Based Disposable Humidity Sensor with Wireless Communication. Sens. Actuators B Chem. 2023, 374, 132731. [Google Scholar] [CrossRef]
  43. Eigler, S.; Enzelberger-Heim, M.; Grimm, S.; Hofmann, P.; Kroener, W.; Geworski, A.; Dotzer, C.; Röckert, M.; Xiao, J.; Papp, C.; et al. Wet Chemical Synthesis of Graphene. Adv. Mater. 2013, 25, 3583–3587. [Google Scholar] [CrossRef] [PubMed]
  44. Su, W.; Kumar, N.; Krayev, A.; Chaigneau, M. In Situ Topographical Chemical and Electrical Imaging of Carboxyl Graphene Oxide at the Nanoscale. Nat. Commun. 2018, 9, 2891. [Google Scholar] [CrossRef] [PubMed] [Green Version]
  45. Childres, I.; Jauregui, L.A.; Park, W.; Cao, H.; Chen, Y.P. Raman Spectroscopy of Graphene and Related Materials; Nova Science Publishers: Hauppauge, NY, USA, 2013; pp. 1–20. [Google Scholar]
  46. Khenfouch, M.; Buttner, U.; Baïtoul, M.; Maaza, M. Synthesis and Characterization of Mass Produced High Quality Few Layered Graphene Sheets via a Chemical Method. Graphene 2014, 3, 7–13. [Google Scholar] [CrossRef] [Green Version]
  47. Cançado, L.G.; Jorio, A.; Ferreira, E.H.M.; Stavale, F.; Achete, C.A.; Capaz, R.B.; Moutinho, M.V.O.; Lombardo, A.; Kulmala, T.S.; Ferrari, A.C. Quantifying Defects in Graphene via Raman Spectroscopy at Different Excitation Energies. Nano Lett. 2011, 11, 3190–3196. [Google Scholar] [CrossRef] [PubMed] [Green Version]
  48. Vidano, R.P.; Fischbach, D.B.; Willis, L.J.; Loehr, T.M. Observation of Raman Band Shifting with Excitation Wavelength for Carbons and Graphites. Solid State Commun. 1981, 39, 341–344. [Google Scholar] [CrossRef]
  49. Muhammad Hafiz, S.; Ritikos, R.; Whitcher, T.J.; Md. Razib, N.; Bien, D.C.S.; Chanlek, N.; Nakajima, H.; Saisopa, T.; Songsiriritthigul, P.; Huang, N.M.; et al. A Practical Carbon Dioxide Gas Sensor Using Room-Temperature Hydrogen Plasma Reduced Graphene Oxide. Sens. Actuators B Chem. 2014, 193, 692–700. [Google Scholar] [CrossRef]
  50. López-Díaz, D.; López Holgado, M.; García-Fierro, J.L.; Velázquez, M.M. Evolution of the Raman Spectrum with the Chemical Composition of Graphene Oxide. J. Phys. Chem. C 2017, 121, 20489–20497. [Google Scholar] [CrossRef]
  51. Kaniyoor, A.; Ramaprabhu, S. A Raman Spectroscopic Investigation of Graphite Oxide Derived Graphene. AIP Adv. 2012, 2, 032183. [Google Scholar] [CrossRef] [Green Version]
  52. Wu, J.-B.; Lin, M.-L.; Cong, X.; Liu, H.-N.; Tan, P.-H. Raman Spectroscopy of Graphene-Based Materials and Its Applications in Related Devices. Chem. Soc. Rev. 2018, 47, 1822–1873. [Google Scholar] [CrossRef] [Green Version]
  53. Kim, N.H.; Kuila, T.; Lee, J.H. Simultaneous Reduction, Functionalization and Stitching of Graphene Oxide with Ethylenediamine for Composites Application. J. Mater. Chem. A 2012, 1, 1349–1358. [Google Scholar] [CrossRef]
Figure 1. (a) ATR-IR FT-IR spectrum; and (b) XPS spectrum of graphite oxide powder synthesized via improved Hummers’ method.
Coatings 12 01970 g001
Figure 2. Schematic representation of custom experimental set-up built for moisture-induced voltage measurements. The components are ① N2 gas inlet, ② pressure regulator and flow meter, ③ water heating on a hotplate (90 °C) for moisture production, ④ moisture inlet valve for humidification of the chamber, ⑤ N2 gas inlet valve for purging and dehumidification of chamber, ⑥ MEG device within the humidity test chamber, and ⑦ data recording equipment.
Coatings 12 01970 g002
Figure 3. Schematic representation of MEG device constructed using GOP-1 as the absorbing material for evaluation of multiple contact configurations. Device top-view: three contacts labelled 1, 2, and 3. Device bottom-view: contacts labelled A, B, and C.
Coatings 12 01970 g003
Figure 4. Moisture-induced voltage (Vo) generated by the GOP-1 device as a function of the relative humidity (RH) within the test chamber for (a) horizontal configuration 1–3; (b) horizontal configuration 2–3; (c) vertical configuration 2-B.
Coatings 12 01970 g004
Figure 5. (a) Schematic representation of MEG device constructed using a GOP-2 as the moisture absorbing material and large sur-face-area contacts in a vertical configuration; (b) Moisture-induced voltage (Vo) generated by GOP-2 device as a function of RH (%).
Coatings 12 01970 g005
Figure 6. (a) Schematic representation of MEG device constructed using GOF as the moisture absorbing material and large surface area contacts in the horizontal configuration; (b) Moisture-induced voltage (Vo) generated by GOF device after applying high bias at 90% humidity for 30 min.
Coatings 12 01970 g006
Figure 7. Evaluation of Vo stability under prolonged exposure to high RH conditions (95%) for GOP-2 device.
Coatings 12 01970 g007
Table 1. % Concentration of carbon components present within the structure of graphite oxide derived from the C1s peaks deconvolution.
% Carbon Components Concentration
C-C sp2C-C sp3C-OHC=OCOOH
37.53.745.59.83.6
Publisher’s Note: MDPI stays neutral with regard to jurisdictional claims in published maps and institutional affiliations.

