Article

Laser Ablation of Copper Alloy under Varying Environmental Conditions to Achieve Purpose-Built Surface Structures

1
Centre for Advanced Studies in Physics (CASP), Government College University, Lahore 54000, Pakistan
2
Department of Physics, National Excellence Institute University, Islamabad 04524, Pakistan
3
Department of Industrial Engineering, College of Engineering and Architecture, Al Yamamah University, Riyadh 11512, Saudi Arabia
4
Dipartimento Interateneo di Fisica, Università degli studi di Bari Aldo Moro, I-70126 Bari, Italy
5
Department of Physics, Women University Swabi, Swabi 23430, Pakistan
*
Authors to whom correspondence should be addressed.
Coatings 2022, 12(12), 1972; https://doi.org/10.3390/coatings12121972
Submission received: 15 November 2022 / Revised: 11 December 2022 / Accepted: 12 December 2022 / Published: 15 December 2022

Abstract

:
In the manufacturing industry, surface structures and surface topographies present at functional areas of the mechanical parts play a vital role in various performance characteristics, such as corrosion resistance, weldability, and wear behaviors, etc. Copper–zinc alloys are extensively used in the manufacturing industry. Laser ablation has the potential to create a variety of surface structures on the ablated substrate. The size and geometry of such structures largely depend on the selection of process parameters and the ablation environment. In the present study, a copper–zinc alloy (95% Cu and 5% Zn) has been laser ablated under different gaseous and magnetic environments to realize a variety of micro-structuring at the ablation surfaces. The effect of plasma plume pressure on the geometry of the structures is deeply investigated through optical emission spectroscopy (OES) and scanning electron microscopy (SEM). By analytically evaluating thermal beta (βt), directional beta (βd), and containment radii (Rs) for the plasma of the Cu–Zinc alloy, the validity of magnetic confinement has been proven. In general, five types of microstructures are produced: micro-sized spherical cones, mounted ablated networks, cavities, pores, ridges, and ablation channels with uplifted cones. Moreover, it has been found that, under a magnetic environment, the geometry of the structures is distinct and well-defined compared to those structures achieved when the ablation is carried out without applying a magnetic field.

1. Introduction

Laser ablation offers a diverse range of uses, including thin-film manufacturing [1,2], micro fabrication [3,4], and medical applications [5,6], wherein the knowledge of the amount of mass eliminated as a function of experimental factors (including laser energy, atmospheric conditions, laser wavelength, and sample type) is essential for controlling and modelling the process. Laser-produced plasma is transitory in nature, with distinctive properties that change rapidly and are highly dependent on irradiation circumstances such as incoming laser intensity and pulse width, laser beam wavelength, irradiation spot size, and ambient gas composition and pressure [7,8,9,10]. The many processes involved in a laser ablation procedure, including laser absorption, evaporation, transient gas dynamics, radiation transport, condensation, ionization, and recombination, are rather complicated and require additional research [11]. For analyzing laser-produced plasma, numerous diagnostic methods are available, notably mass spectroscopy [12], Langmuir probe [13], microwave and laser interferometry [14,15], laser-induced fluorescence [16], Thomson scattering [17], photothermal beam deflection [18] and optical emission spectroscopy [8,19,20].
LIBS (laser-induced breakdown spectroscopy) is powerful an optical emission spectroscopy (OES) analytical technique capable of sampling solids, liquids, and gases for research and industrial applications [21,22,23,24]. A pulsed laser source is used to vaporize and excite a sample, resulting in the formation of a transitory plasma or plume that extends away from the sample surface. The optical emission resulting from the relaxation of excited species inside plasma provides information on the composition of the substance being examined. LIBS was initially a qualitative approach, but in recent years, it has evolved into a pseudo-quantitative micro-analysis tool for solids, liquids, and gases that can determine their elemental composition [25,26,27].
This study investigates plasma expansion in TMF to understand plasma dynamics [11], plume species spectrum intensity, plume refinement [28,29,30], and plasma instabilities [31]. EUV lithographic sources, debris reduction, thin film-deposition, nanoparticle synthesis, surface alterations, and LIBS detection-limits enhancement are key applications [32,33,34]. Externally applied TMF may influence plasma characteristics (optical spectrum intensity, Te and ne) and micro/nano surface structure.
Laser-produced plasma (LPP) has been proven to be confined in the presence of a TMF in many papers [28,29,30,35]. Patel et al. [36] studied brass plasma development in a non-uniform MF at low ambient pressures and atmospheric air pressures. MF divided the brass plume and intensified Cu (I) at 510.5 nm at low ambient gas pressures. Raju et al. [37] examined TMF’s effect on Ba’s LPP. Spectral intensity, Te, and ne were examined at various fluences (temporal variation). TMF improved LPP features. Rai et al. [38] examined how laser timespan affects LIBS performance in an external magnetic field and compact cavity. When laser-induced plasma is decelerated in a narrow cavity or by a continuous magnetic field, the LIBS signal increases. Magnetic fields doubled the LIBS signal. Theoretical research of decelerated plasma matched actual results, they said. Plasma confinement and laser duration affect LIBS signal growth. The plasma plume dynamics, electron–ion collision frequency, and LIBS signal saturation increase with laser intensity.
Corsi et al. [39] examined how crater depth influences plasma properties and LIBS emission. Despite plasmas being spatially and temporally resolved, they investigated plasma generation at the sample surface and at the bottom of the craters of the Cu sample. They measured plasma electron temperature and number density while studying LIBS emission. The craters’ confinement effect increased laser-induced plasma LIBS signals. They also observed that crater walls limit plasmas. This confinement effect significantly affects laser-induced plasma characteristics and LIBS analysis outcomes. Rai et al. [40] examined how a transverse magnetic field (TMF) affected the LIBS of Mn, Mg, Cr, and Ti in aqueous solution. Line emission intensified 1.5-fold in TMF. They also found a significant rise in plasma emission between gate delays in TMF. After cooling the plasma, magnetic confinement increased plasma density and recombination rate, increasing emission. Magnetic confinement did not increase optical line emission in hot plasmas with strong background emission. Mg and Mn had half the LOD in the presence of a TMF.
Neogi et al. [31] examined carbon’s LPP in vacuum and low ambient pressures with non-uniform TMF. They examined Te and ne under varied temporal and pressure conditions. TMFs raise all LPP properties temporally and at varying ambient pressures. Magnetic confinement, the J × B effect, Joule heating, and adiabatic compression raise LPP parameters. Abbasi et al. [17] used magnetic-field-aided LIBS and found an increase in optical emission from a palladium (Pd) sample. Plasma emission increased even at low laser fluence (12.6 J/cm2). The magnetic field also enhanced the LPP parameters Te and ne.
Hussain et al. [41] investigated how an applied TMF affected LIBS emission with different air pressures and time delays of an Al sample. The 0.5 T magnetic field enhanced Al atomic lines at low pressure and shorter delay periods, whereas the Al (I) 396.1 nm spectral line signal rose 2-fold at 100 Pa and 100 ns. Electron impact excitation and recombination increased signal intensity with magnetic confinement. They examined plasma properties, including electron temperature and density. TMF increased compared to the field-free situation. Ping et al. [42] examined Al–Li LIBS at varying pressures and magnetic field intensity. A steady 1.1 T magnetic field increased Al I and Li I spectrum emission strength by 1.5–3 times. A fast ICCD camera captured time-resolved images of the laser-produced plume in their experiment. A magnetic field brightened plasma, persisted, and split the plume into two lobes. They also found that the magnetic confinement effect may increase excited atoms and high-energy species. Magnetically limited LIBS increased Te and ne.
Wang et al. [43] examined the use of a laser to generate artificial protrusions on metal surfaces. Stainless particles were melted using a diode-pumped solid-state laser system to create micron-sized protrusions on metal surfaces. They found that the strength and detachability of joints were significantly affected by the manufactured protrusions’ shape and their adherence to the metal substrate. The joint’s strength is diminished, however, if the huge protrusion damages the carbon fibers that are implanted in the polymer plate. They reported that, by manipulating the surface structures designed for that purpose, they might alter the surface morphology and produce a material surface suitable for the mechanical interlocking required to reinforce the metal/polymer junction.
Min et al. [44] reviewed the principle of laser ablation and its effect on the physicochemical properties of metallic materials. They described the application of purpose-built surface structures in order to modify their physicochemical properties and improve both the strength and durability of adhesive-bonded joints. They reported the mechanism accounting for the improved bonding strength and corrosion resistance of the adhesive-bonded joints fabricated from laser-ablated metallic materials. They discovered that the bonding strength of laser-ablated adhesively bonded joints increased as the roughness and wettability of the metallic adherend surface increased and that surface roughness contributed to improved joint strength only when the adhesive was capable of sufficiently wetting the laser-ablated surface to form mechanical interlocking at the bonding interfaces. Although laser-ablated surfaces were more active with lower polarization resistances and higher corrosion current, the increased roughness by laser ablation improved the corrosion resistance of laser-ablated adhesively bonded joints by retarding corrosive solution diffusion. As a result of their research, they reported that, among the several surface treatment options, laser ablation offers the most benefits in terms of efficiency, environmental friendliness, and ease of industrialization
Cu is a popular metal for plasma creation and laser ablation owing to its strong electrical conductivity and ductility. Copper plasma generated by a laser is also utilized to synthesize nanoparticles for usage in solar cells, sensors, LEDs, catalysts, antifungals, and anti-bacterial [45]. Cu–Zn alloy (Cu: 95% and Zn: 5%) is used for a variety of applications, including the coatings of slugs, the driving groups on certain artillery rounds, and the identification of enamelled and other jewels [45]. Typically, the sheet is used to manufacture metals by hammering. It is also utilized in silversmithing, notably as a low-cost preparation material [46]. Pure Cu metal has been extensively researched for LIBS, as well as for laser-induced structures, but little work has been provided on Cu-alloy, which is a very valuable industrial material [46].
The present work examines the impact of TMF on the plasma properties of laser-induced Cu-alloy at varying pressures of Ar, Ne, and He, and a link between surface structuring and plasma parameters is being created to improve their industrial uses. A 0.6 Tesla TMF is created using two permanent magnets. LIBS is utilized in the first series of experiments to explore the LPP of Cu in diverse ambient environments of Ar, Ne, and He at pressures ranging from 1 torr to 200 torr with a fixed optimum laser irradiance of 3.8 GW/cm2.

2. Experimentation

2.1. Sample Preparation

We have chosen Cu–Zn alloy (Cu: 95% & Zn: 5%) purchased from Alpha Aesar for experimentation. Disk shaped samples were cut using CNC wire cutting. All targets were ultrasonically polished and cleaned before being mounted on a mechanical motorized translational stage under ultrahigh vacuum (UHV) conditions.

2.2. Measurements

Figure 1 shows a schematic depiction of the experimental setup. For material ablation and plasma formation, a Q-switch 1064 nm, 10 ns Nd: YAG laser (CFR200; Big Sky Laser Technologies, Quantel, France) is used. This laser has a 200 mJ pulse energy and a 10 Hz repletion rate.
To create plasma, a lens with a focal length of 50 cm is used to focus the laser beam. Demtroder’s formula is used to figure out that the size of the focused spot is 75 µm [47]. ω f = λ f π   ω o = 1064 nm × 50   cm 3.14 ×   0.452 2 cm = 75   μ m ,   where λ, f, ωo represent the laser wavelength, focal length of the lens, and the beam radius without focusing, respectively. M2 = θ λ π ω o = 1.5 (approximately) is the beam quality factor. Therefore ωf = 1.5 × 75 μm = 112.5 μm. The spot area by using the relation A= π × ω f 2 is 3.97 × 10⁻⁴ cm2. The spot area measured by SEM analysis is 3.94 × 10⁻³ cm2. The target holder was progressively rotated with the assistance of a mechanical rotor to expose a fresh surface to each laser pulse. This is necessary to prevent the uneven pitting and cratering caused by each laser pulse. Targets were mounted in the vacuum chamber whose inner diameter was 24 cm, while the chamber’s height was 18 cm. The chamber was evacuated at a rate of 300 L per second. After obtaining the needed vacuum, the system remained at that level for a minimum of one hour before being filled with the necessary gas. To examine the impact of the nature and pressure dependency of shield gases on the LIBS and surface morphology of laser-ablated Cu-alloy, the UHV chamber was filled with a variety of gases (Ar, Ne, and He). After the first refill, these ambient gases were flushed out of the chamber. Their pressure is precisely regulated with mbar accuracy.
The 0.6 Tesla TMF is created by using two disk-shaped (2 cm × 1 cm) permanent neodymium magnets. A Gauss meter (GM07 HIRST, Magnetic Instruments Ltd., Falmouth, UK) was used to quantify the magnetic field’s intensity. TMF was implemented by positioning magnets 3 cm apart such that magnetic forces were perpendicular to the longitudinal plane of the LPP. The targets were then exposed to radiation in a variety of environmental conditions. Using a single cleaning shot, the LIBS surface was rendered contaminant-free. From a window set at 90 degrees to the direction of plasma expansion, we could see the bright plasma emission. In this case, a LIBS2500 plus spectrometer from Ocean Optics was used to capture the plasma’s emission spectrum. For an investigation across a wide range of wavelengths, from 200 to 980 nm, this system uses a LIBS-fiber bundle equipped with seven linear silicon CCD array detectors, yielding an optical resolution of 0.1 nm.
Data from each spectrometer was collected in real time and saved on a computer using OOILIBS software (LIBS2500, Ocean Optics, Dunedin, Florida, USA, 200–980 nm, 2.1 ms) so that a comprehensive spectrum analysis could be generated. For this experiment, LIBS2500 triggered the Nd: YAG laser’s Q-switch, while OOILBS controlled the laser’s power output. All measurements had the same 1.25 µs delay between laser trigger and data collection. Plasma created by a single pulse decays or cools and produces light at various wavelengths for each element. A lens with a 5 cm focal length and a fiber-optic probe were used to capture the emission. After that, the signal was delivered to the spectrometer system.
Two sets of experiments were conducted.
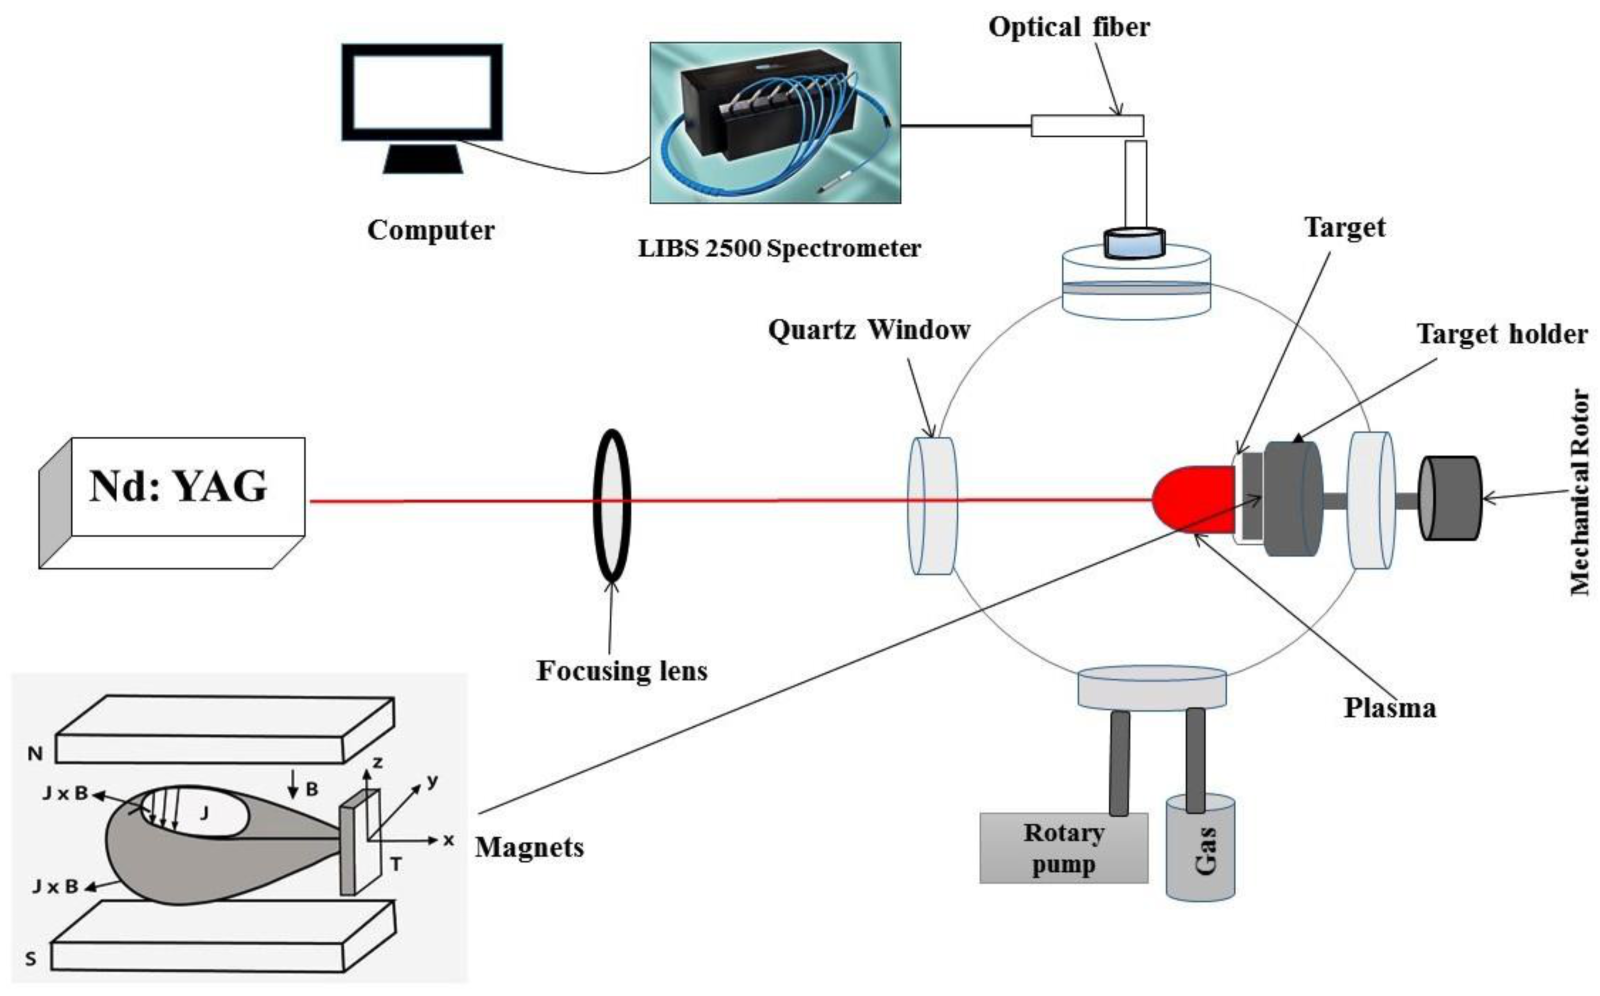
  • Ar, Ne, and He were employed as background gases in the first set of experiments. Twenty pressures (1, 2, 3, 4, 5, 10, 20, 30, 40, 50, 60, 70, 80, 90, 100, 120, 140, 160, 180, and 200 torr) of inert gases were supplied for the experiment. These data were collected by exposing a Cu-alloy target to a single 150 mJ laser pulse at an intensity of 3.8 GW/cm2 for 1.25 µs, then recording the resulting plasma emissions both without and with TMF.
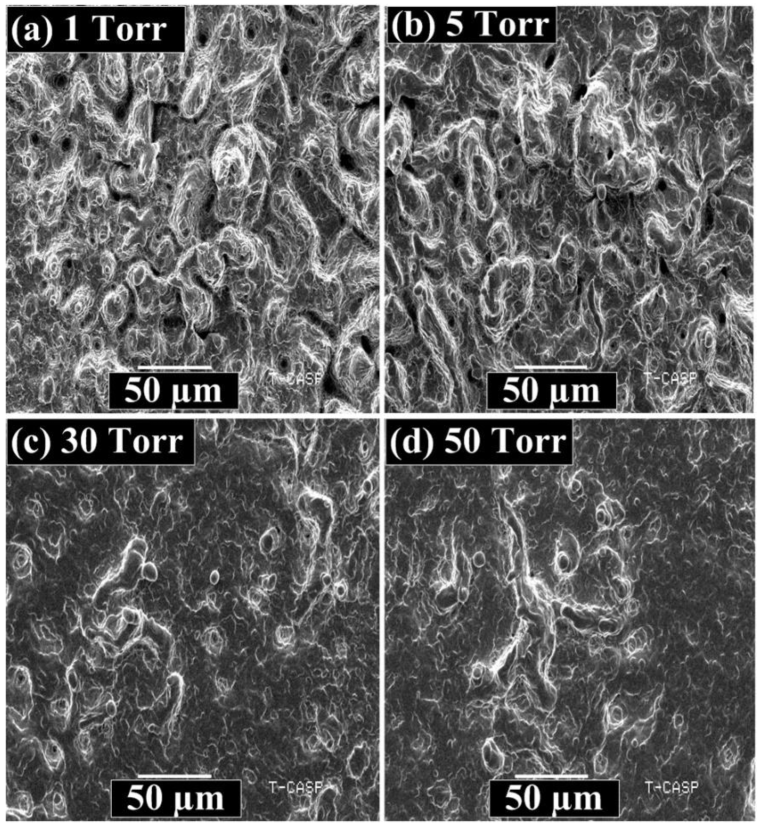
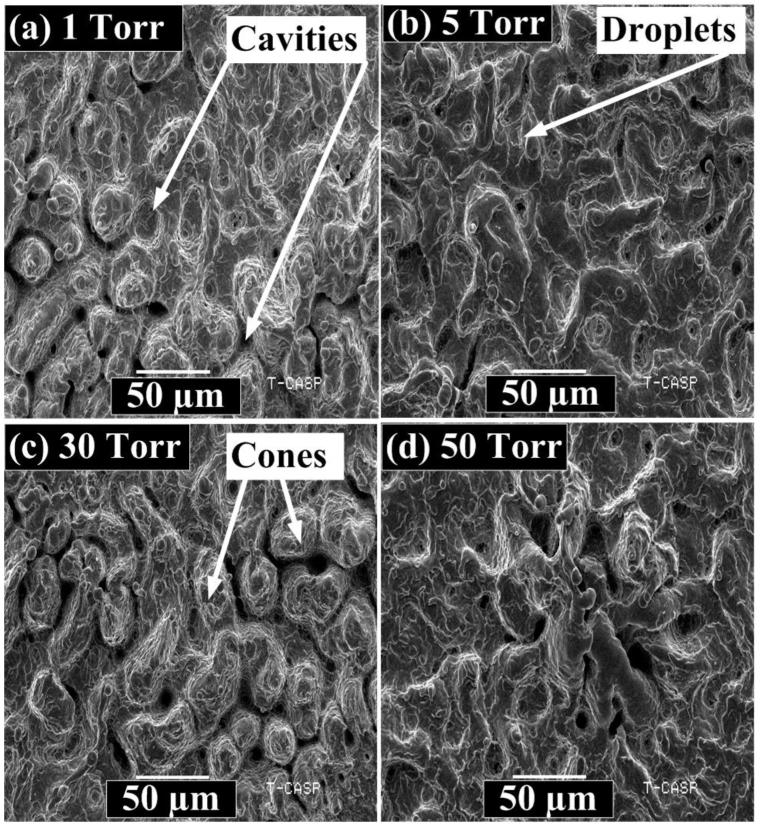
  • A second series of studies were conducted to establish a relationship between the LPP parameters and the growth of surface structures. The Cu alloy target in this set was irradiated by 200 laser shots at 3.8 GW/cm2 in a variety of environments, including Ar, Ne, and He at 1, 5, 30, and 50 torr pressure. The surface structures of laser-irradiated Mg alloy have been investigated using SEM examination. A scanning electron microscope (JEOL JSM 6490-A, Tokyo, Japan) was utilized for this analysis.
The LPP of Cu is defined by two plasma parameters, Te and ne. The Te value is measured using the Boltzmann plot technique, whereas the ne value is measured using the Stark broadening method. A second series of experiments was carried out for SEM analysis. An analytical computation of the plasma confinement characteristics, including thermal beta, directional beta, and containment radii, was performed in order to confirm that magnetic confinement works in the presence of 0.6 Tesla TMF.

3. Results

3.1. Effect of a Transverse Magnetic Field on LPP of Cu-Alloy

Figure 2 depicts the emission intensity of Cu (II) lines in the presence of the TMF (solid) and in the absence of the TMF (dashed) across the spectral range of 300 to 600 nm at an irradiation of 3.8 GW/cm2 under Ar, Ne, and He at a pressure of 30 torr. In order to evaluate the LPP parameters, we chose four prominent Cu spectral lines at 324.52 nm, 327.21 nm, 447.99 nm, and 521.54 nm.

3.1.1. Investigation of Optical Emission Spectra of LPP of Cu-Alloy

Figure 3a,c,e show the variation in the spectral intensities of selected lines of Cu-alloy in the absence of TMF, whereas Figure 3b,d,f shows the variation in the spectral intensities of selected lines of Cu-alloy in the presence of TMF. All of the measurements were obtained at an intensity of 3.8 GW/cm2 at a range of pressures in different environments with Ar (a and b), Ne (c and d), and He (e and f). In the field-free case, the spectral intensity increases until it peaks at 30 torr, drops to 100 torr, and finally saturates at higher pressures. Further, the presence of TMF significantly reduces the emission intensity compared to the field-free case. This is true in all cases. Ar has the highest emission intensity, followed by Ne, and then He. Furthermore, it is discovered that the presence of a TMF significantly reduces the emission spectrum intensity of Cu-alloy in comparison to the field-free scenario. All of the gases in the atmosphere behave this way. Several research groups have observed this, and they ascribe the slowdown to radiation recombination enhancement and/or deceleration [48,49,50,51,52,53,54].
The drop in spectral intensity is attributable to the decrease in the life time of higher states, which is a result of strong magnetic confinement effects [52]. Recombination lifetime is drastically reduced when TMF limits the plasma and prevents it from freely expanding. Consequently, there is a decrease in the spectrum intensity [53,55]. The decrease in radiative recombination and the rise in three-body radiative recombination [56] are both major contributors to the reduction in the Cu lines’ spectral intensity. After the laser pulse terminates, the rapid fall in Te favors three-body recombination over radiative and/or dielectronic processes. With TMF present, the spectral intensity drops lower than in the field-free scenario because the life time for recombination falls dramatically as the plasma grows [51,55].

3.1.2. Investigation of Electron Temperature of Cu-Alloy Plasma

The Boltzmann plot technique has been used on spectroscopic data to calculate the Te of Cu plasma [52]. Assuming that the laser-induced plasma (LIP) is in a state of local thermodynamic equilibrium (LTE), using spectroscopic data, Te was calculated using a Boltzmann plot ( ln λ mn   I mn g mA mn = E m KT e + ln N T U T ) , with the parameters λmn, Imn, gm, Amn describing the wavelength, intensity of the higher energy state, statistical weight, and transition probability, respectively. Higher-state energy (Em), Boltzmann constant (k), electron temperature (Te), total number density (N (T), and partition function (U (T)) are shown on the right. Figure 4 displays the Boltzmann plot of selected Cu-plasma lines. Table 1 displays the spectroscopic parameters required for Te analysis, which are retrieved from the NIST database [57] and the atomic line list [58]. Figure 5a without TMF and 5b with TMF show the change in Te for different ambient gases when the pressure is varied from 1 to 200 torr while the irradiance is held constant at 3.8 GW/cm2.
The Te of the LPP of Cu-alloy ranges from 6513 K to 11,915 K for Ar, 6278 K to 10,605 K for Ne, and 5449 K to 9404 K for He in the absence of TMF. Ar has Te values between 8653 K and 13,864 K, Ne between 7577 K and 12,427 K, and He between 6750 K and 11,760 K when a TMF is applied. Te increases monotonically up to a maximum at 30 torr, regardless of the presence or absence of TMF. After that, we see a drop in Texc from 40 to 200 torr. In both the absence and presence of TMF, the Te value of Cu plasma is greatest when associated with Ar, compared to Ne and He.

3.1.3. Investigation of Electron Number Density of Cu-Alloy Plasma

Cu LPP’s time-integrated ne is evaluated using the Stark-broadening ( Δ λ 1 2 = 2 ω N e 10 16 + 3.5 A N e 10 16 1 4 1 1.2 N D 1 3 × ω N e 10 16 ) technique [59]. Lorentzian fitting is used on the Cu (II) spectral line at 327.26 nm to determine the ne of Cu-alloy plasma (Figure 6).
In Figure 7a,b, we depicted the ne of laser-produced Cu-alloy plasma variation in the absence (left) and presence (right) of TMF at 3.8 GW/cm2 irradiation and in the Ar, Ne, and He environments, respectively.
Cu plasma’s ne fluctuates from 1.0 × 1018 cm−3 to 1.78 × 1018 cm−3 for Ar, 0.81 × 1018 cm−3 to 1.58 × 1018 cm−3 for Ne, and 0.69 × 1018 cm−3 to 1.41 × 1018 cm−3 for He in a field-free scenario. For TMF, the values of ne for Ar are between 1.23 × 1018 cm−3 to 2.19 × 1018 cm−3; for Ne, they range from 1.12 × 1018 cm−3 to 1.85 × 1018 cm−3, and for He, they vary from 0.82 × 1018 cm−3 to 1.62 × 1018 cm−3. After a linear increase from 1 to 20 torr, the ne of Cu plasma plateaus at 30 torr. As pressure is increased from 40 torr to 200 torr, ne is found to be decreasing. Every single environmental gas follows this pattern (Ar, Ne, and He). However, Ar has a higher ne of Cu in laser-induced plasma than Ne and He. Similarly, ne is enhanced in TMF under all environmental conditions.

4. Discussion

It has been reported by a large number of research groups [60] that the characteristics of LPP are strongly reliant on the type and pressure of the surrounding gases. The findings obtained from the LIBS demonstrate that the emission intensity, electron temperature, and density are highly impacted not only by the ambient environment but also by the pressure change of that atmosphere.
Emission intensity, electron temperature, and electron density are all found to be greatest for Ar, next for Ne, and finally for He, where they are at their lowest. When pressure is increased, the temperature and density of the gas’s electrons both rise to a maximum, whereupon they then begin to fall monotonically with subsequent increases in pressure. Both the temperature and the electron density are found to be at their highest at 30 torr, regardless of the surrounding pressure. At pressures up to 30 torr for Ar, Ne, and He, an increasing trend in Te and ne of Cu plasma was seen (Figure 5 and Figure 7), which was ascribed to a diminished shielding effect of the ambient gas plasma as a result of a decreased gas particle density at lower pressures. In a low-pressure environment, plasma spreads easily into that area, reducing the density of species inside the plasma.
As a consequence, the target surface is less shielded from the laser pulse and experiences less absorption through inverse bremsstrahlung. When the pressure is high enough, the collision frequencies of plasma particles increase, leading to a greater amount of momentum transfer [61] and a more rapid expansion of electron cascades. The surrounding gas plasma also serves as a kind of energy buffer, imparting some of its own heat to the plasma of the surrounding substance. Therefore, more energy is focused on the surface, yielding a bigger quantity of ablated material and thus raising the electron density and temperature [62,63].
Maximum electron density and temperature are seen when pressure is raised up to 30 torr in all ambient circumstances; this is due to the confinement effect of plasmas [64]. In conclusion, our findings suggest that the spectrochemical features of laser-induced plasmas may be enhanced by using Ar, Ne, or He as the ambient gas at certain filled pressures. When the pressure is raised from 40 to 200 torr, the plasma is confined even closer to the surface of the target, which shields the target surface. A large portion of the pulse is absorbed by the plasma, leading to significant shielding that lowers the amount of mass ablated from the target [65]. The plasma (the first ablated material) absorbs more of the laser pulse energy, yet at that pressure, the measured plasma temperature and electron density are lower. This may be explained as follows: as the ambient pressure is raised, the number of times an electron collides with an atom in the background gas rises elastically. Since the rate of increase in the energy of free electrons through inverse bremsstrahlung is larger than the rate at which the cascade condition is preferred, the temperature is lower at greater pressure [64,66].
The reason that Ar has greater Te and ne values than Ne and He is because of cascade development and elastic collisions, as given by Q Δ t = 2 m e M B σ ea n B 5 KT e π m e 1 2 [62], where nB is the density of atoms in the background gas, MB is the mass of the background gas, and σea is the elastic scattering cross section of electron atoms. The relation states that the rate of cooling of LPP is proportional to the inverse of the mass of MB. Inferred from this is the fact that gases with a lower density cool more rapidly than those with a higher density. As MB grows, the efficiency with which particles transmit their energy to one another via collision decreases, extending the lifetime of LPP. The LPP cools down more quickly, reducing the plasma’s lifetime, if the thermal conductivity is high [67]. The presence of TMF reduces the emission intensity of all ambient gases compared to when TMF is absent.
In light of Rumbsy and Paul’s relation, we may understand why there is a decrease in emission strength when TMF is present. Their relation 3 × 10 19 T e 3.75 Z   m 3 shows that three-body recombination would predominate over radiative recombination if the predicted ne is larger than 3 × 10 19 T e 3.75 Z   m 3 .
The analytical assessment of Cu-plasma puts its ne in the region of 1019 m−3, whereas our experimental determination places it in the 1024 m−3 range. These results provide more evidence for the veracity of three-body recombination and provide credence to the claim that spectral intensity decreases once TMF is utilized. Te and ne values for Cu-alloy in TMF are higher than in the field-free scenario in all ambient gases. In TMF, the expansion of plasma is accompanied by a separation of plasma species due to the Lorentz force operating perpendicular to the direction of plume growth. This implies that LPP may spread in both axial and radial directions. The LPP plasma front slows down in both directions, even though its radial velocity is lower than its axial velocity.
We assessed certain analytical indicators, including thermal beta, directed beta, and confinement radius, to verify the reliability of the implemented TMF. The thermal β t is a critical factor when expanding into a magnetic field. β t of the plasma is given as β t = 8 π n e K T e B 2 [52], where B is the magnetic field (G), ne is the density in cm−3, k is the Boltzmann constant, and Te is the temperature in eV. When the LPP pressure is equal to the plasma pressure, the plume will cease expanding ( β t = 1). If β t > 1, magnetic confinement does not occur, whereas if β t < 1, magnetic confinement does occur. As the plasma’s kinetic pressure increases relative to the magnetic fields, the LPP will eventually break through the field’s core. The plume’s internal pressure drops because the magnetic field penetrates deeper into the plasma and slows its expansion. If the field exerts a pressure equal to that of the kinetic pressure, then the LPP will be compressed and confined.
In Table 2, Table 3 and Table 4, we can see how β t shifts in response to varying pressures for Ar, Ne, and He. Figure 8 is a diagrammatic representation of the aforementioned values, showing how β t varies with pressure. At a pressure of 30 torr, when the Te and ne of Cu-plasma are both at their highest, the maximum value of β t is attained.
According to the published research [51], using a magnetic field to slow down a plume’s progression does not prevent it from progressing at all. Thus, βt is not the sole relevant parameter; directional βd is also crucial in describing plasma confinement [68]. Once thermal energy has been transformed into directed energy, βd may be calculated using the relation β d = 4 π n e 3 K B T e B 2 [68]. We calculate the directed βd for a range of ne and Te in Cu-alloy plasma at different pressures of different ambient circumstances. Magnetic confinement is validated by the fact that magnetic pressure is always greater than plasma pressure. Table 2, Table 3 and Table 4 show the resulting changes in βd of Cu plasma when pressure is varied in Ar, Ne, and He ambient conditions, respectively. Figure 9 provides a visual representation of these values, showing how βd varies with the pressure of the surrounding gases.
Expanding plasma has a βd of the order of a few hundred at the outset, indicating that the LIP of Cu-alloy is in the diamagnetic domain [69]. The diamagnetic cavity of the LPP becomes larger, and the magnetic energy is equalized with the total energy of the plasma. This LPP will be slowed by the combined impact of magnetic pressure and the pressure applied by the surrounding gas. If we assume that the plasma grows spherically, we may calculate the radius within which the magnetic field is confining the plasma. Using the relation [45], R b = 3 F l a A l 2 π B 2 2 μ o + P a i r 1 3 where Fla is the absorbed laser fluence, we may calculate the confinement radius. When we use a wavelength of 1064 nm and a laser fluence of 44.4 J/cm2, the resulting Fla is 1.3 J/cm2, and the corresponding value for the confinement radius is 13 mm. It uses the fact that plasma will be greatly slowed down up to a distance of 13 mm at a pressure of 30 torr and a laser irradiation of 3.8 GW/cm2.
It is important to note that the nature of the surrounding gases may have a significant impact on plasma values. Since Iida et al. [66] established the necessary conditions for cascade growth, this trend may also be understood in that context. According to their study, the E/M (charge/mass) ratio is the sole factor that matters for calculating the energy dissipated during cascade growth. The values for Ar, Ne, and He are 0.53, 1.08, and 6.04, respectively. This proves that Ar is preferable than Ne and He in terms of cascade growth. Therefore, it is clear why the emission intensity, Te, and ne of Cu-alloy plasma in Ar is greater than that of Ne and He plasma.

4.1. Investigation of Surface Analysis of Laser-Irradiated Cu Alloy

SEM analysis is used to investigate how exposure to a magnetic field affects the surface changes of laser-irradiated Cu-alloy. As such, the Cu targets were subjected to 200 laser pulses at a fixed laser energy of 150 mJ, equivalent to a laser irradiance of 3.8 GW/cm2, in three distinct environments of Ar, Ne, and He at varied pressures (1 torr, 5 torr, 30 torr, and 50 torr).

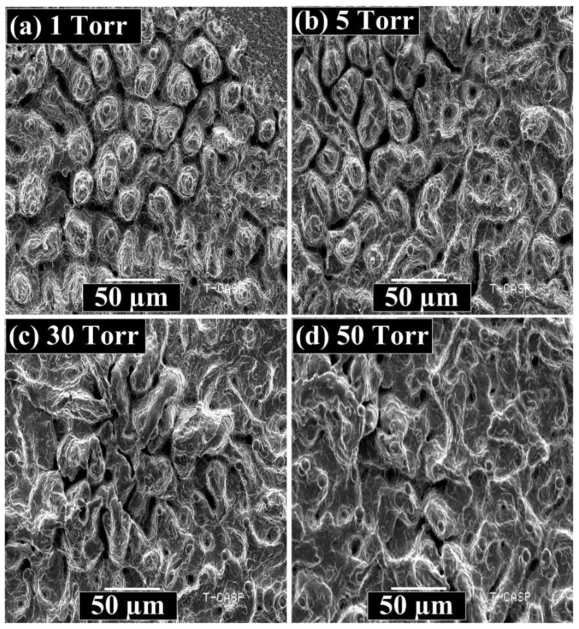
4.1.1. Surface Morphology of Cu-Alloy under Ar Environment without TMF

SEM images of Figure 10a–d exhibit the surface morphology of the laser ablated area of Cu-metal without a magnetic field under Ar environment at different pressures of 1, 5, 30, and 50 torr.
The diffusive cones, cavities, droplets, and non-uniform melting are prominent features of all pressures. For the lowest pressure of 1 torr, the non-uniform spherical-top-headed cones and cavities are observed in Figure 10a. The number of cones and their size decrease at 5 torr in Figure 10b. By increasing the pressure, the cones and cavities vanished. The molten material and droplets are seen and decrease by increasing the pressure. Turbulent melt flow is also seen between the periodic ridges. The excessive laser energy interaction to the target surface material detaches the material in the form of droplets [70]. The temperature gradients and pressure gradients are produced due to the laser-induced heating and vaporization on the target surface, which is responsible for the expansion of molten material that can account for droplets formation [52].

4.1.2. Surface Morphology of Cu-Alloy under Ar Environment with TMF

SEM micrographs of Figure 11a–d exhibits the modified laser-ablated area of Cu-metal with a magnetic field under Ar environment after irradiation at different pressure of 1, 5, 30, and 50 torr.
The distinct uplifted micro-sized cones, cavities, ridges, and non-uniform melting are prominent features for all pressures. For the lowest pressure of 1 torr, the large-scale melting, micro-sized spherical cones, and cavities are seen in Figure 11a. The micro-sized conical structures are formed in three steps. In the first step, the precursor sites are formed, i.e., roughness present on the target surface and surface defects before the laser matter interaction and laser induced micro/nano structures. In the second step, the laser light scattering from these precursor sites results in the increased laser energy and excessive ablation in the valleys between these precursor sites and finally the evolution of these sites into micro-sized conical structures on the target surface. In the third step, the growth and merging of cones occur [71,72].
Another possible reason for the growth of micro-sized spherical cones is that stresses and depressions are generated on the target surface due to incoming laser light. Relaxation of these stresses and depressions finally evolves into cones when laser pulse is finished, also accounted for cone formation [52,73,74].
In the underlying pores, the gases are absorbed due to the rapid volume expansion and heating of the subsurface layer which is responsible for cavity formation [75]. Under the superficial layer, the relaxation of mechanical stresses may be another possible reason for cavity formation [76,77,78]. The different sizes of cavities are due to the contaminations, inclusions, and small pits on the target surface [79,80,81]. Increasing the pressure from 1 torr to 5 torr, the non-uniform melting diffusive cones are ridges formed and visible in Figure 11b. Ridges are formed due to the abrupt expulsion of molten material towards the boundary by the recoil pressure of plasma [82].
In Figure 11c, the uplifted micro-sized cones and cavities are seen. The number of cones increase by increasing the pressure. The non-uniform molten material is seen, and cones are vanished in Figure 11d at a final pressure of 50 torr.

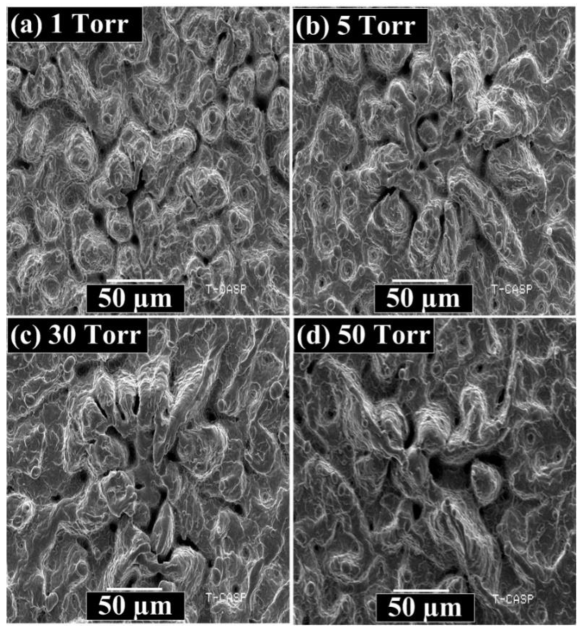
4.1.3. Surface Morphology of Cu-Alloy under Ne Environment without TMF

SEM micrographs of Figure 12a–d show the laser-ablated area of Cu-metal without a magnetic field under a Ne ambient gas environment at different pressures of 1, 5, 30, and 50 torr. For all pressures, the irregular cones and splashed molten material are prominent features. In Figure 12a, at the lowest pressure of 1 torr, the regular diffusive spherical cones are seen at the center. At the outer edges, tiny droplets are observed. In Figure 12b, the size of cones and density of cones is increased, along with the formation of cavities and droplets. The size and density of cones is decreased in Figure 12c. The droplets are more prominent. As the pressure increased from 30 torr to 50 torr the flower structure is seen. The cones in the flower structure are diffusive and irregular. At the outer edges, the large-size cones are visible.

4.1.4. Surface Morphology of Cu-Alloy under Ne Environment with TMF

SEM micrographs of Figure 13a–d represent the modified laser-irradiated area of Cu-metal with a magnetic field under Ne environment at different pressures of 1, 5, 30, and 50 torr. For all pressures, the spherical cones, cavities, and droplets are dominant structures. In Figure 13a, for the lowest pressure, uniform spherical-top-head cones are observed. The droplets at the top head of the spherical cones are seen.
The non-uniform cavities between the cones are observed. For a pressure of 5 torr, the uniformity of spherical-top-head cones is decreased. The laser-induced molten material and groove-like cavities are seen. In Figure 13c, the irregular flower structure can be seen. The non-uniform cones are observed, and, at the outer edges of the flower, the molten material is seen. In Figure 13d, the flower structure has vanished and transformed into irregular cones with an extended top head on the droplets. The irregular cavities are also prominent at the highest pressure, 50 torr.

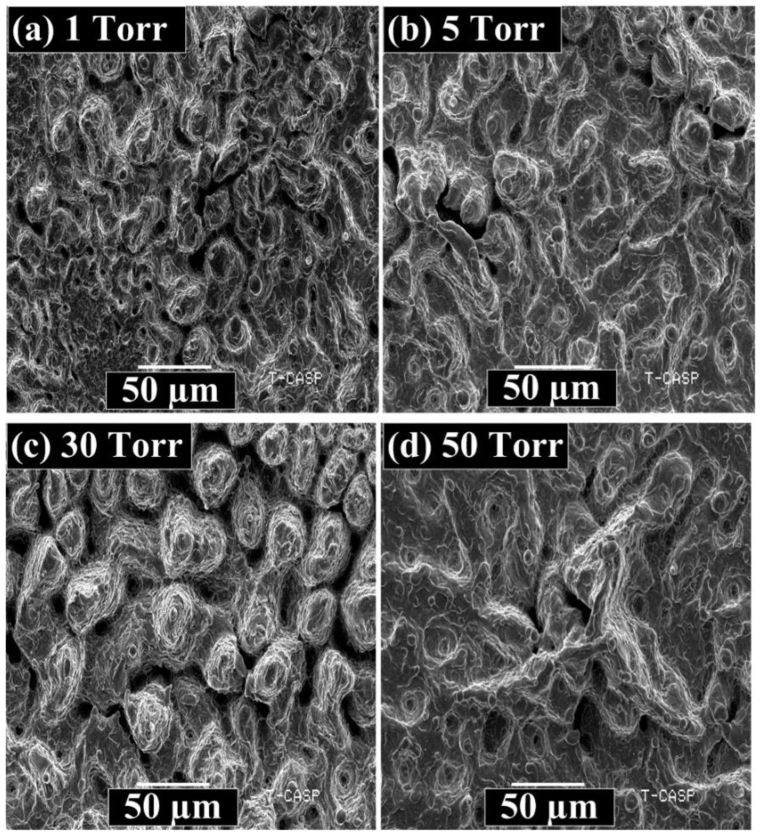
4.1.5. Surface Morphology of Cu-Alloy under He Environment without TMF

SEM images of Figure 14a–d reveal the laser-irradiated area of Cu-metal without a magnetic field under He environment at different pressures of 1, 5, 30, and 50 torr. The spherical cones, uplifted droplets, and cavities are dominant features at all pressures. For the lowest pressure of 1 torr, irregular cones with cavities and turbulent melt flow between the cones are seen in Figure 14a. In Figure 14b, a flower-like structure is seen. The spherical-top-headed cones of wider bases are the boundary of the flower structure.
At the outer edge of the flower structure, the cones have vanished, and cavities are observed. By increasing the further pressure from 5 torr to 30 and 50 torr, the uniformity of the flower structure decreased. A more irregular and non-uniform flower structure is seen. The density of cones in the flower structure decreased. The cavities’ size and the non-uniform melting of the material increased by increasing the pressure.

4.1.6. Surface Morphology of Cu-Alloy under He Environment with TMF

The SEM images in Figure 15a–d represent the surface-modified laser-ablated area of the Cu metal with a magnetic field under He ambient gas environment at different pressures of 1, 5, 30, and 50 torr. The large uplifted spherical cones, cavities, and droplets are main features for all pressures. In Figure 15a, irregular micro-sized cones and non-uniform micro-sized cavities are observed. In Figure 15b, the size of cones is increased, and density decreased at 5 torr pressure. For a pressure of 30 torr, uniform spherical-top-head cones are observed in Figure 15c. The size of the cones increased while density decreased. Large micro-sized cavities between the cones are also observed. For the highest pressure, 50 torr, spherical-top-headed cones have vanished. The non-uniform molten material and turbulent flow are seen. Few cavities are seen with depth.
The applied TMF strongly influences the laser-induced micro/nano structuring. Distinct and regular structures are formed in the case of magnetic field, while diffusive and irregular structures are seen in the absence of a magnetic field. The ambient gas nature and pressure also play a decisive role for uniform and distinct structure formation. The ambient environment properties like E/M ratio, atomic mass, ionization potential, cohesive energy, and thermal conductivity affect the plasma formation on the target surface, which in turn controls the micro and nano structuring on the target material surface. The graphs of Figure 5 and Figure 7 revealed that the electron temperature and electron number density follow the order Ar > He > Ne and reach the maximum at 30 torr pressure. So the applied TMF and ambient environment with suitable pressure where the highest electron temperature and electron number density are achieved are highly desirable for distinct and uniform micro/nano structuring on the target surface.
While comparing the SEM micrographs of Cu-metal without a magnetic field under all environmental gases of Ar, Ne, and He, it has been observed that more diffusive and small-scale structures have been formed in the case of Ar than in Ne and He. The diameter and number density of these cones and cavities are also smallest in the presence of Ar. Overall, the maximum diameter and number density of these cones and cavities have been observed in the presence of He compared to Ar and Ne in the field-free case. The averaged number density of cones and cavities for Ar are (11.21 × 103 cm−2 & 11.59 × 103 cm−2), for Ne (21.32 × 103 cm−2 and 19.47 × 103 cm−2), and for He are (22.12 × 103 cm−2 and 24.40 × 103 cm−2), whereas, in the presence of TMF, these conical structures are more distinct and well-defined, with higher maximum number densities in the case of Ne than Ar and He. The averaged number density of cones and cavities for Ar are (8.60 × 103 cm−2 and 16.86 × 103 cm−2), for Ne are (57.61 × 103 cm−2 and 40.52 × 103 cm−2), and for He are (32.40 × 103 cm−2 and 21.41 × 103 cm−2). Averaged cavities and cone densities and their averaged diameter at different pressures of Ar, Ne, and He in the presence and absence of TMF is displayed in Table 5.
Laser-induced plasma is an excellent tool for developing micro-scale structures that are well-associated with plasma-induced plasma effects and recoil pressure, and it is also one of the greatest sources for thin-layer deposition and the surface structuring of materials in a range of conditions. These structures become purpose-built as their nature, size, and geometry actually influences the surface properties, like optical, electrical, mechanical, and frictional, as well as field emissions, and defines their direct applications in different fields. In present studies, the micro-sized spherical cones are beneficial surface structures that have been considered favorable [43,44,83] for field convergence and as good field and thermionic emitters. Similarly, other structures, such as cavities, pores, and ridges, act as defects and enhance corrosion resistance, the water-repellent property, and strain relief, as well as the adhesive properties [84,85] of a surface, by either reducing or increasing the contact angle between a liquid droplet and the material surface [44]. These features can also enhance the tribological performance of surfaces due to increased surface roughness. In this way, by controlling plasma parameters, it is possible to control surface structuring, coating by plasma, and coating by ion implantation on different materials.

5. Conclusions

In this research, an investigation has been carried out into the impact of a TMF on the pressure dependence of Cu LPP characteristics in three different atmospheres: Ar, Ne, and He. The laser intensity has been kept at a constant level. It was discovered that, regardless of pressure or surrounding conditions, the presence of a magnetic field significantly increases the values of all Cu plasma parameters compared to the field-free scenario. The rise in LPP may be attributed to the synergistic effects of magnetic confinement, Joule’s heating, and adiabatic compression. Based on the results, discussion, scanning electron microscopes, and other analysis, the following conclusions may be inferred:
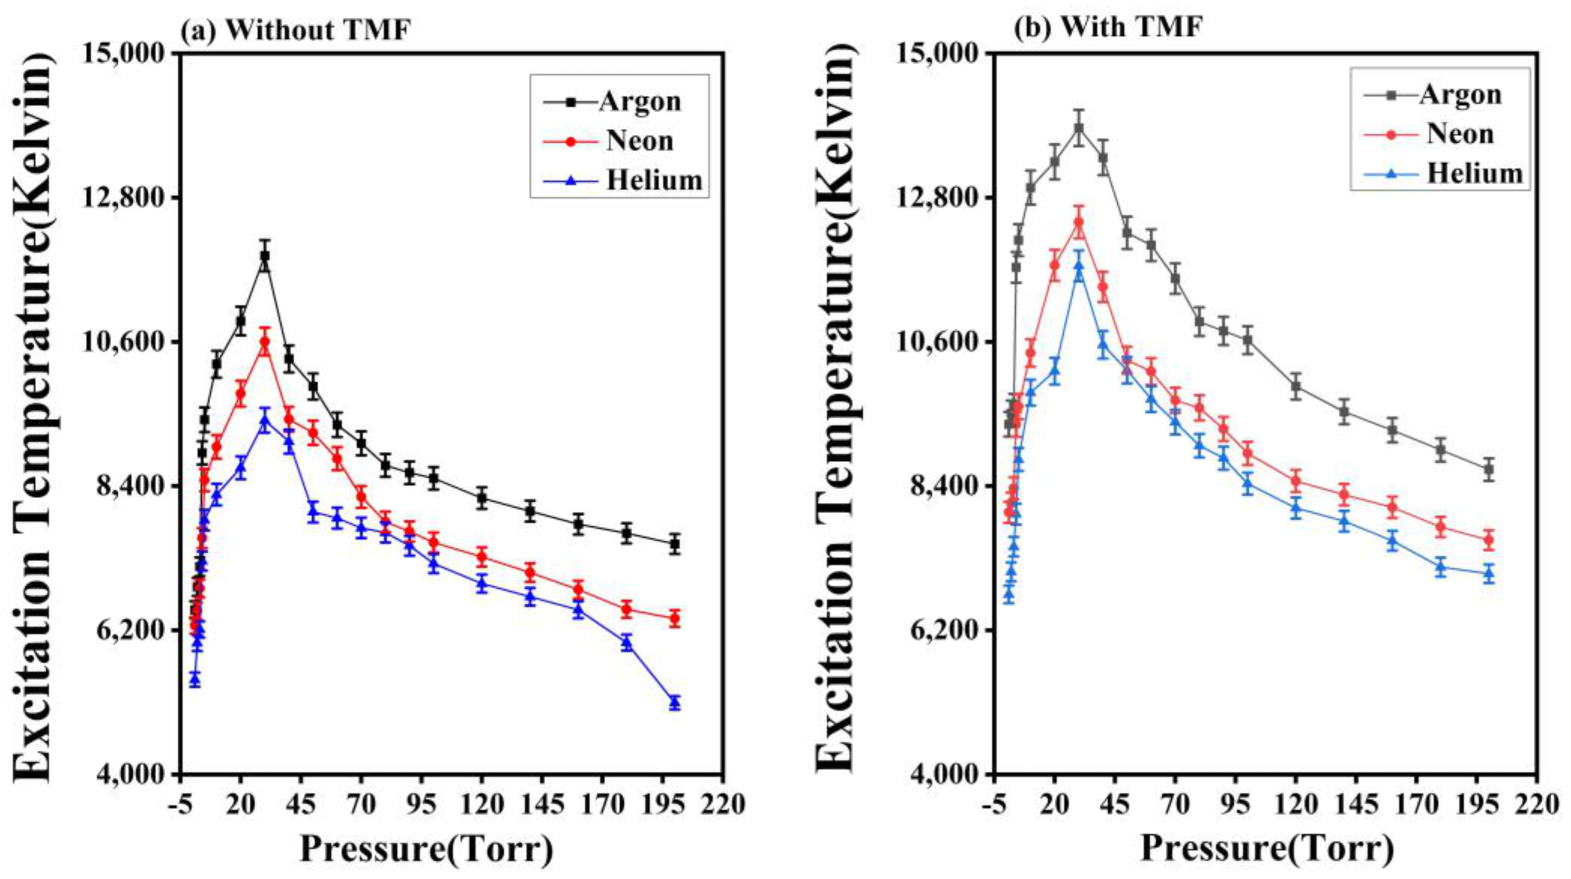
  • Cu plasmas are found to be pressure-dependent in terms of emission intensity, Te, and ne initially; by increasing pressure, all of these parameters increase, and, after reaching their maximums, the electron temperature and electron number density values begin to drop or become saturated as pressure continues to rise. This holds true regardless of the surrounding conditions. Te and ne exhibit the same tendencies in the presence of TMF as they do in the absence of a field over a wide range of environmental variables.
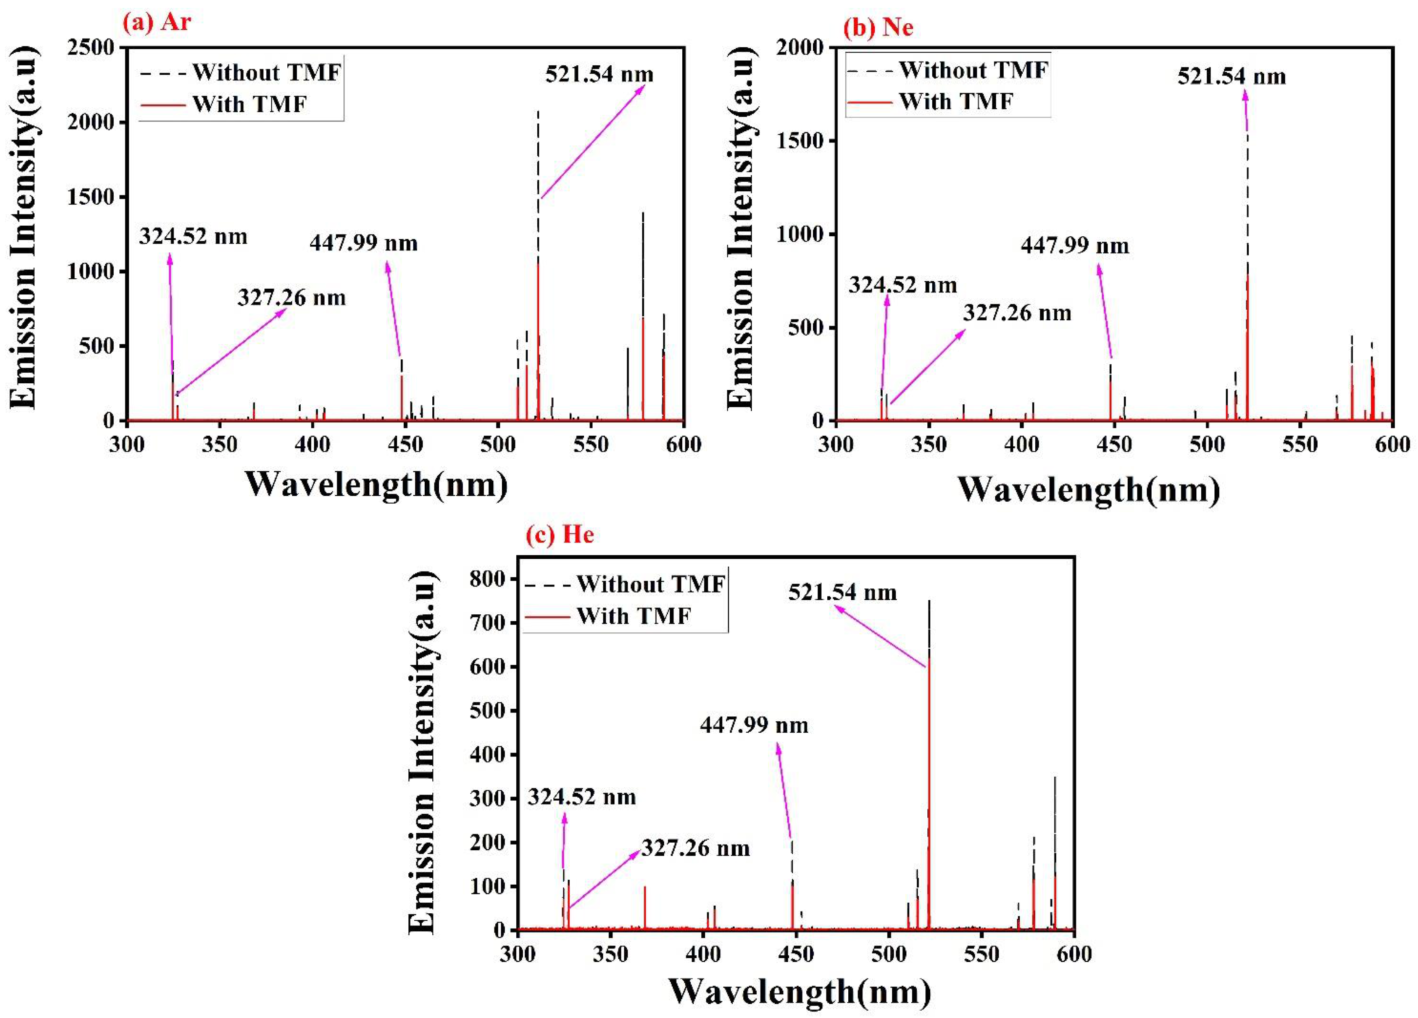
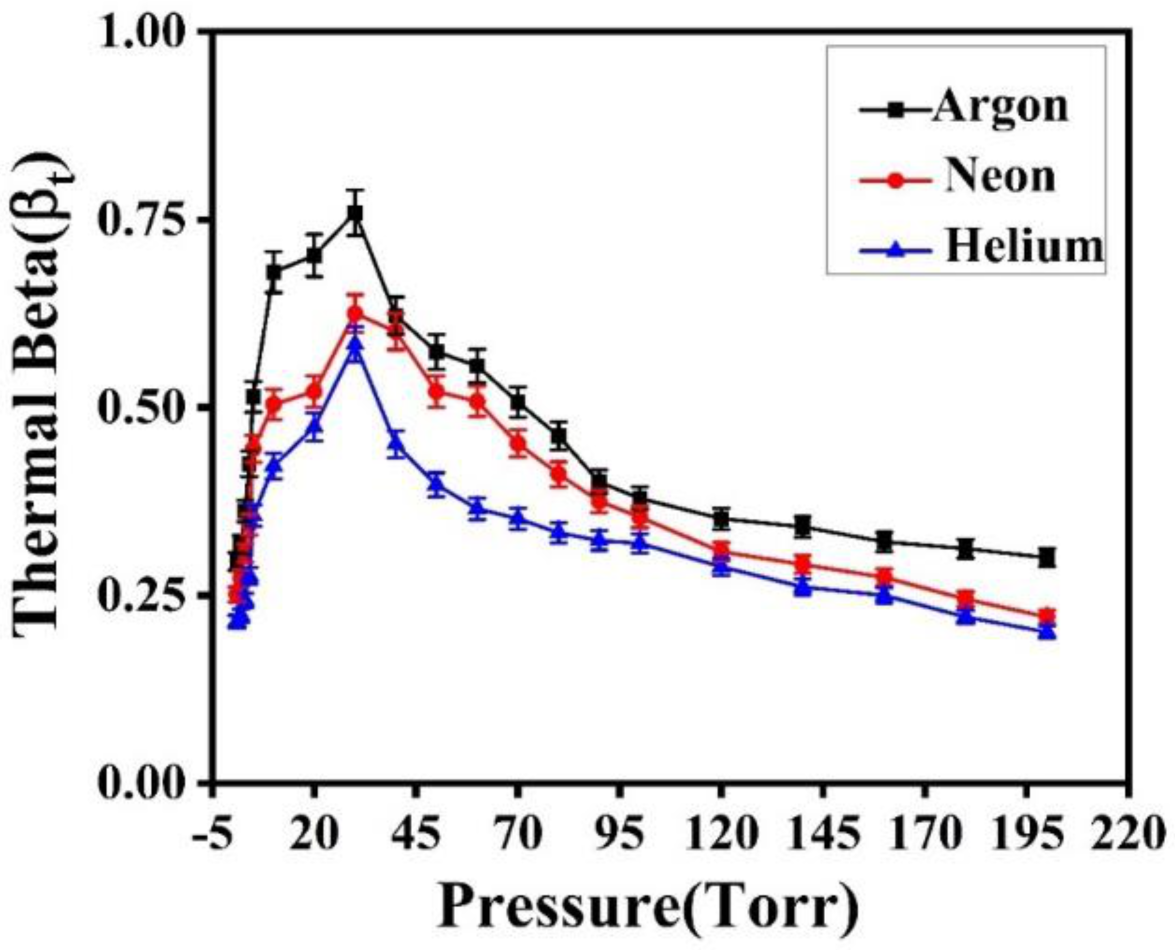
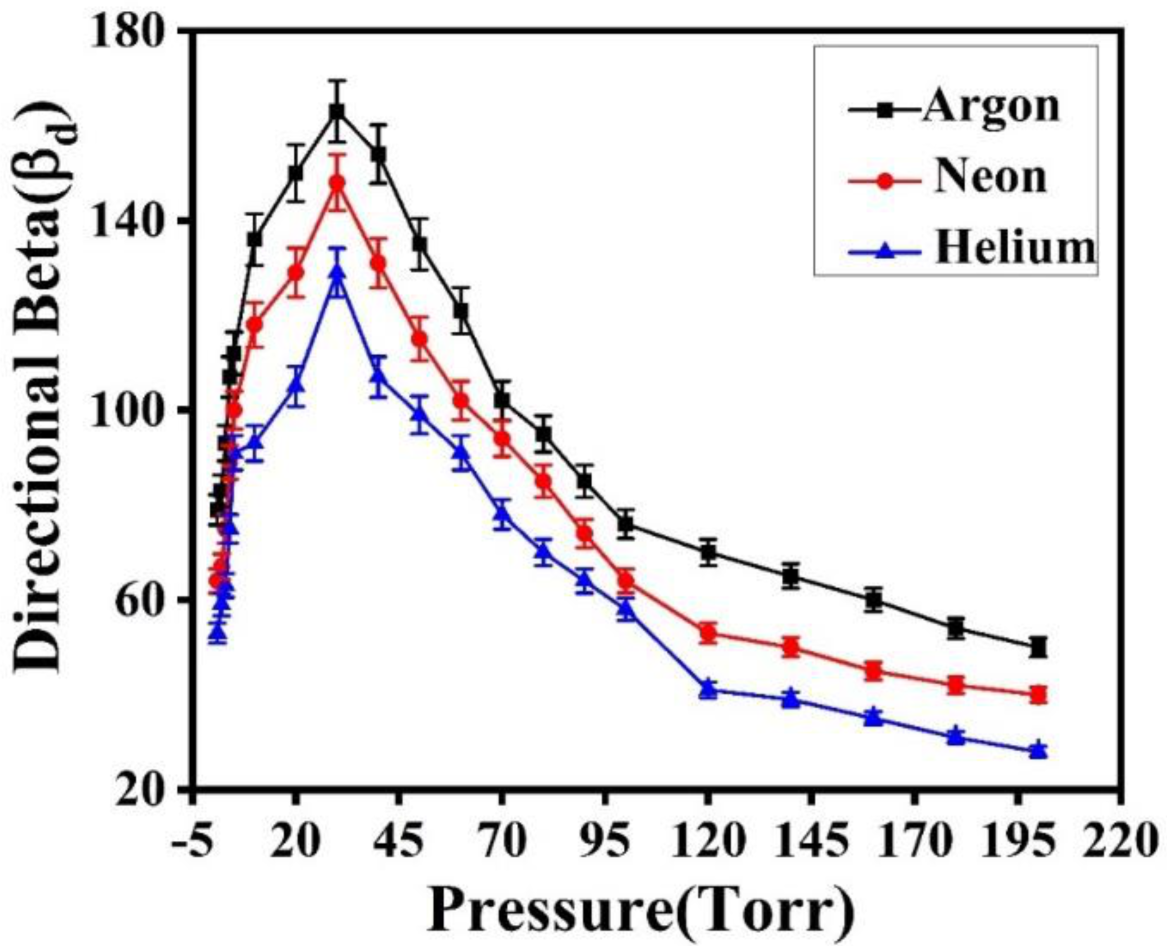
  • The ambient Ar environment has higher Te and ne spectral intensities than the Ne and He environments under all conditions. Ar has a faster rate of cascade formation and lower thermal conductivity, E/M ratio, and ionization potentials than Ne and He, which explains these results. The confinement of Cu plasma under a 0.6 T TMF is confirmed by analytical assessments, including thermal beta (βt), directional beta (βd), and containment radii (Rs) for different ambient gas pressures.
  • In the absence of TMF, the formation of less distinct surface structures, such as diffusive cones, cavities, droplets, and non-uniform melting and ridges, is observed on Cu-alloy, whereas, for Cu-alloy in TMF, distinct and well-defined structuring is observed, viz., the large-scale melting, micro-sized spherical cones and cavities, pores, and organized ridges.
  • Improved Te and ne from a plasma that has been magnetically contained may make it a more useful ion source for ion implantation, thin-film deposition, and coating applications.

Author Contributions

Conceptualization, A.D., S.B., N.A. and A.H.; methodology A.D., S.B., A.H. and N.A.; experimentation, A.D., S.B. and A.H.; validation of data, A.D., S.B., A.H., S.M.A.S., A.A. and N.A.; formal analysis, A.D., S.B., A.H., S.M.A.S.; investigation, A.D., S.B., A.H., S.M.A.S. and N.A.; resources, A.D., S.B., A.H., A.A. and N.A.; writing—original draft preparation, A.D. and S.M.A.S.; writing—review and editing, A.D., S.B., A.H., N.A. and S.M.A.S.; supervision, S.B., A.H. and N.A.; project administration, A.D., S.B., A.H., A.A. and N.A.; All authors have read and agreed to the published version of the manuscript.

Funding

This research received no external funding.

Institutional Review Board Statement

Not applicable.

Informed Consent Statement

Not applicable.

Data Availability Statement

Not applicable.

Conflicts of Interest

The authors declare no conflict of interest.

References

  1. Inam, A.; Hegde, M.; Wu, X.; Venkatesan, T.; England, P.; Miceli, P.; Chase, E.; Chang, C.; Tarascon, J.; Wachtman, J. As-deposited high Tc and Jc superconducting thin films made at low temperatures. Appl. Phys. Lett. 1988, 53, 908–910. [Google Scholar] [CrossRef]
  2. Mao, X.; Russo, R.E.; Liu, H.; Ho, J. As-deposited Sb-doped Bi-Pb-Sr-Ca-Cu-O thin films prepared by pulsed laser deposition. Appl. Phys. Lett. 1990, 57, 2591–2593. [Google Scholar] [CrossRef]
  3. Sugioka, K.; Toyoda, K. Self-aligned microfabrication of metal-semiconductor contacts by projection-patterned excimer laser doping. Jpn. J. Appl. Phys. 1990, 29, 2255. [Google Scholar] [CrossRef]
  4. Sternitzke, K.D.; McCreery, R.L. Laser microfabrication and activation of graphite and glassy carbon electrodes. Anal. Chem. 1990, 62, 1339–1344. [Google Scholar] [CrossRef]
  5. Anderson, R.R.; Parrish, J.A. Selective photothermolysis: Precise microsurgery by selective absorption of pulsed radiation. Science 1983, 220, 524–527. [Google Scholar] [CrossRef] [Green Version]
  6. Khalid, A.; Bashir, S.; Akram, M.; Hayat, A. Laser-induced breakdown spectroscopy analysis of human deciduous teeth samples. Lasers Med. Sci. 2015, 30, 2233–2238. [Google Scholar] [CrossRef]
  7. Bulatov, V.; Xu, L.; Schechter, I. Spectroscopic imaging of laser-induced plasma. Anal. Chem. 1996, 68, 2966–2973. [Google Scholar] [CrossRef]
  8. Amoruso, S.; Bruzzese, R.; Spinelli, N.; Velotta, R. Characterization of laser-ablation plasmas. J. Phys. B At. Mol. Opt. Phys. 1999, 32, R131. [Google Scholar] [CrossRef]
  9. De Giacomo, A.; Dell’Aglio, M.; Gaudiuso, R.; Amoruso, S.; De Pascale, O. Effects of the background environment on formation, evolution and emission spectra of laser-induced plasmas. Spectrochim. Acta Part B At. Spectrosc. 2012, 78, 1–19. [Google Scholar] [CrossRef]
  10. Dyer, P.; Issa, A.; Key, P. Dynamics of excimer laser ablation of superconductors in an oxygen environment. Appl. Phys. Lett. 1990, 57, 186–188. [Google Scholar] [CrossRef]
  11. Harilal, S.S.; Bindhu, C.V.; Tillack, M.S.; Najmabadi, F.; Gaeris, A.C. Internal structure and expansion dynamics of laser ablation plumes into ambient gases. J. Appl. Phys. 2003, 93, 2380–2388. [Google Scholar] [CrossRef] [Green Version]
  12. Park, S.M.; Moon, J.Y. Laser ablation of graphite in an oxygen jet. J. Chem. Phys. 1998, 109, 8124–8129. [Google Scholar] [CrossRef]
  13. Mayo, R.; Newman, J.; Sharma, A.; Yamagata, Y.; Narayan, J. Electrostatic measurement of plasma plume characteristics in pulsed laser evaporated carbon. J. Appl. Phys. A 1999, 86, 2865–2871. [Google Scholar] [CrossRef]
  14. Kim, D.; Park, H.K.; Grigoropoulos, C.P. Interferometric probing of rapid vaporization at a solid–liquid interface induced by pulsed-laser irradiation. Int. J. Heat Mass Transf. 2001, 44, 3843–3853. [Google Scholar] [CrossRef]
  15. Masubuchi, T.; Tada, T.; Nomura, E.; Hatanaka, K.; Fukumura, H.; Masuhara, H. Laser-induced decomposition and ablation dynamics studied by nanosecond interferometry. 4. A polyimide film. J. Phys. Chem. A 2002, 106, 2180–2186. [Google Scholar] [CrossRef]
  16. Laube, S.; Voevodin, A. In situ time of flight laser induced florescence spectroscopy of carbon by pulsed laser deposition. Surf. Coat. Technol. 1998, 105, 125–129. [Google Scholar] [CrossRef]
  17. Glenzer, S.; Fournier, K.; Decker, C.; Hammel, B.; Lee, R.; Lours, L.; MacGowan, B.; Osterheld, A. Accuracy of K-shell spectra modeling in high-density plasmas. Phys. Rev. E 2000, 62, 2728. [Google Scholar] [CrossRef]
  18. Hayat, A.; Bashir, S.; Rafique, M.S.; Ahmed, R.; Akram, M.; Mahmood, K.; Zaheer, A.; Hussain, T.; Dawood, A. Spatial confinement effects employed by metallic blocker and Ar gas pressures on laser-induced breakdown spectroscopy and surface modifications of laser-irradiated Mg. Laser Part. Beams 2017, 35, 313–325. [Google Scholar] [CrossRef]
  19. Voevodin, A.; Jones, J.; Zabinski, J. Characterization of ZrO2/Y2O3 laser ablation plasma in vacuum, oxygen, and argon environments. J. Appl. Phys. 2000, 88, 1088–1096. [Google Scholar] [CrossRef]
  20. Harilal, S. Expansion dynamics of laser ablated carbon plasma plume in helium ambient. Appl. Surf. Sci. 2001, 172, 103–109. [Google Scholar] [CrossRef]
  21. Cremers, D.A.; Radziemski, L.J. Handbook of Laser-Induced Breakdown Spectroscopy; John Wiley & Sons: Hoboken, NJ, USA, 2013. [Google Scholar]
  22. Amin, S.; Bashir, S.; Anjum, S.; Akram, M.; Hayat, A.; Waheed, S.; Iftikhar, H.; Dawood, A.; Mahmood, K. Optical emission spectroscopy of magnetically confined laser induced vanadium pentoxide (V2O5) plasma. Phys. Plasmas 2017, 24, 083112. [Google Scholar] [CrossRef]
  23. Dawood, M.; Margot, J. Effect of ambient gas pressure and nature on the temporal evolution of aluminum laser-induced plasmas. AIP Adv. 2014, 4, 037111. [Google Scholar] [CrossRef]
  24. Russo, R.; Mao, X.; Liu, C.; Gonzalez, J. Laser assisted plasma spectrochemistry: Laser ablation. J. Anal. At. Spectrom. 2004, 19, 1084–1089. [Google Scholar] [CrossRef]
  25. Akram, M.; Bashir, S.; Hayat, A.; Mahmood, K.; Ahmad, R.; Rahman, M.K. Effect of laser irradiance on the surface morphology and laser Induced plasma parameters of zinc. Laser Part. Beams 2014, 32, 119–128. [Google Scholar] [CrossRef] [Green Version]
  26. Akram, M.; Bashir, S.; Rafique, M.S.; Hayat, A.; Mahmood, K. Laser induced surface morphology of molybdenum correlated with breakdown spectroscopy. Plasma Chem. Plasma Process. 2017, 37, 287–304. [Google Scholar] [CrossRef]
  27. Arshad, A.; Bashir, S.; Hayat, A.; Akram, M.; Khalid, A.; Yaseen, N.; Ahmad, Q.S. Effect of magnetic field on laser-induced breakdown spectroscopy of graphite plasma. Appl. Phys. B 2016, 122, 63. [Google Scholar] [CrossRef]
  28. Neogi, A.; Thareja, R. Dynamics of laser produced carbon plasma expanding in a nonuniform magnetic field. J. Appl. Phys. 1999, 85, 1131–1136. [Google Scholar] [CrossRef]
  29. Hussain, A.; Qi, L.; Zuoqiang, H.; Xun, G.; Jingquan, L. The Effect of an External Magnetic Field on the Plume Expansion Dynamics of Laser-Induced Aluminum Plasma. Plasma Sci. Technol. 2015, 17, 693. [Google Scholar] [CrossRef] [Green Version]
  30. Winske, D. Development of flute modes on expanding plasma clouds. Phys. Fluids 1989, 1, 1900–1910. [Google Scholar] [CrossRef]
  31. Neogi, A.; Thareja, R.K. Laser-produced carbon plasma expanding in vacuum, low pressure ambient gas and nonuniform magnetic field. Phys. Plasmas 1999, 6, 365–371. [Google Scholar] [CrossRef]
  32. Gekelman, W.; Van Zeeland, M.; Vincena, S.; Pribyl, P. Laboratory experiments on Alfvén waves caused by rapidly expanding plasmas and their relationship to space phenomena. J. Geophys. Res. Space Phys. 2003, 108, 1281. [Google Scholar] [CrossRef] [Green Version]
  33. Kawasaki, H.; Doi, K.; Hiraishi, S.; Suda, Y. Effects of cross-magnetic field on thin film preparation by pulsed Nd/YAG laser deposition. Thin Solid Film. 2000, 374, 278–281. [Google Scholar] [CrossRef]
  34. Harilal, S.; O’Shay, B.; Tillack, M.S. Debris mitigation in a laser-produced tin plume using a magnetic field. J. Appl. Phys. 2005, 98, 036102. [Google Scholar] [CrossRef] [Green Version]
  35. Cowpe, J.; Pilkington, R.; Astin, J.; Hill, A. The effect of ambient pressure on laser-induced silicon plasma temperature, density and morphology. J. Phys. D Appl. Phys 2009, 42, 165202. [Google Scholar] [CrossRef] [Green Version]
  36. Patel, D.; Pandey, P.K.; Thareja, R.K. Brass plasmoid in external magnetic field at different air pressures. Phys. Plasmas 2013, 20, 103503. [Google Scholar] [CrossRef]
  37. Raju, M.S.; Singh, R.; Gopinath, P.; Kumar, A. Influence of magnetic field on laser-produced barium plasmas: Spectral and dynamic behaviour of neutral and ionic species. J. Appl. Phys. 2014, 116, 153301. [Google Scholar] [CrossRef]
  38. Rai, V.; Singh, J.P. Effect of laser intensity and dynamics of plasma on laser induced breakdown spectroscopy. arXiv 2014, arXiv:1406.7703. [Google Scholar]
  39. Corsi, M.; Cristoforetti, G.; Hidalgo, M.; Iriarte, D.; Legnaioli, S.; Palleschi, V.; Salvetti, A.; Tognoni, E. Effect of laser-induced crater depth in laser-induced breakdown spectroscopy emission features. Appl. Spect. 2005, 59, 853–860. [Google Scholar] [CrossRef]
  40. Rai, V.N.; Zhang, H.; Yueh, F.Y.; Singh, J.P.; Kumar, A. Effect of steady magnetic field on laser-induced breakdown spectroscopy. Appl. Opt. 2003, 42, 3662–3669. [Google Scholar] [CrossRef]
  41. Hussain, A.; Asghar, H.; Iqbal, T.; Ishfaq, M.; Shahbaz, R.M.; Riaz, Q. Improving the spectral intensity of aluminum plasma by applied-magnetic field in laser-induced breakdown spectroscopy. Optik 2021, 251, 168220. [Google Scholar] [CrossRef]
  42. Liu, P.; Hai, R.; Wu, D.; Xiao, Q.; Sun, L.; Ding, H. The enhanced effect of optical emission from laser induced breakdown spectroscopy of an Al-Li alloy in the presence of magnetic field confinement. Plasma Sci. Technol. 2015, 17, 687. [Google Scholar] [CrossRef]
  43. Wang, T.; Yasuda, K.; Nishikawa, H. Fabrication of micron-sized protrusions on metal surface for metal/polymer easy-disassembly joining by selective laser melting technology. Mater. Des. 2022, 220, 110873. [Google Scholar] [CrossRef]
  44. Min, J.; Wan, H.; Carlson, B.E.; Lin, J.; Sun, C. Application of laser ablation in adhesive bonding of metallic materials: A review. Opt. Laser Technol. 2020, 128, 106188. [Google Scholar] [CrossRef]
  45. Singh, K.S.; Sharma, A.K. Time-integrated optical emission studies on laser-produced copper plasma in the presence of magnetic field in air ambient at atmospheric pressure. Appl. Phys. A 2017, 123, 325. [Google Scholar] [CrossRef]
  46. WikiPedia. Available online: https://en.wikipedia.org/wiki/Gilding_metal (accessed on 10 December 2022).
  47. Demtröder, W. Laser Spectroscopy: Basic Concepts and Instrumentation; Springer Science & Business Media: Berlin/Heidelberg, Germany, 2013. [Google Scholar]
  48. List, I.A. Atomic Line List v3.00b4. Available online: http://www.pa.uky.edu/~peter/newpage/ (accessed on 18 August 2021).
  49. Reader, J.; Corliss, C.H.; Wiese, W.; Martin, G. Wavelengths and Transition Probabilities for Atoms and Atomic Ions: Part 1. Wavelengths, Part 2. Transition Probabilities; NSRDS-NBS.; National Institute of Standards and Technology: Gaithersburg, MD, USA, 1980; Volume 68, p. 409. [Google Scholar]
  50. Singh, K.S.; Sharma, A.K. Multi-structured temporal behavior of neutral copper transitions in laser-produced plasma in the presence of variable transverse static magnetic field. Phys. Plasmas 2016, 23, 013304. [Google Scholar] [CrossRef]
  51. Li, Y.; Hu, C.; Zhang, H.; Jiang, Z.; Li, Z. Optical emission enhancement of laser-produced copper plasma under a steady magnetic field. App. Opt. 2009, 48, B105–B110. [Google Scholar] [CrossRef]
  52. Cheng, L.; Xun, G.; Qi, L.; Chao, S.; Jingquan, L. Spectral enhancement of laser-induced breakdown spectroscopy in external magnetic field. Plasma Sci. Technol. 2015, 17, 919–922. [Google Scholar]
  53. Harilal, S.; Tillack, M.; O’shay, B.; Bindhu, C.; Najmabadi, F. Confinement and dynamics of laser-produced plasma expanding across a transverse magnetic field. Phys. Rev. E 2004, 69, 026413. [Google Scholar] [CrossRef] [Green Version]
  54. Iftikhar, H.; Bashir, S.; Dawood, A.; Akram, M.; Hayat, A.; Mahmood, K.; Zaheer, A.; Amin, S.; Murtaza, F. Magnetic field effect on laser-induced breakdown spectroscopy and surface modifications of germanium at various fluences. Laser Part. Beams 2017, 35, 159–169. [Google Scholar] [CrossRef]
  55. Joshi, H.; Kumar, A.; Singh, R.; Prahlad, V. Effect of a transverse magnetic field on the plume emission in laser-produced plasma: An atomic analysis. Spectrochim. Acta B 2010, 65, 415–419. [Google Scholar] [CrossRef]
  56. Kim, T.H.; Nam, S.H.; Park, H.S.; Song, J.K.; Park, S.M. Effects of transverse magnetic field on a laser-produced Zn plasma plume and ZnO films grown by pulsed laser deposition. Appl. Surf. Sci 2007, 253, 8054–8058. [Google Scholar] [CrossRef]
  57. Shen, X.; Lu, Y.; Gebre, T.; Ling, H.; Han, Y. Optical emission in magnetically confined laser-induced breakdown spectroscopy. J. Appl Phys. 2006, 100, 053303. [Google Scholar] [CrossRef]
  58. Harilal, S.; Sizyuk, T.; Hassanein, A.; Campos, D.; Hough, P.; Sizyuk, V. The effect of excitation wavelength on dynamics of laser-produced tin plasma. J. Appl. Phys. 2011, 109, 063306. [Google Scholar] [CrossRef]
  59. Nakimana, A.; Tao, H.; Camino, A.; Gao, X.; Hao, Z.; Lin, J. Effect of ambient pressure on femtosecond laserinduced breakdown spectroscopy of Al in Argon. In Proceedings of the International Conference on Optoelectronics and Microelectronics (ICOM), Changchun, Jilin, 23–25 August 2012; pp. 146–150. [Google Scholar]
  60. Luo, W.; Zhao, X.; Sun, Q.; Gao, C.; Tang, J.; Wang, H.; Zhao, W. Characteristics of the aluminum alloy plasma produced by a 1064 nm Nd: YAG laser with different irradiances. Pramana 2010, 74, 945–959. [Google Scholar] [CrossRef]
  61. Radziemski, L.J.; Cremers, D.A. Laser-Induced Plasmas and Applications; CRC Press: Boca Raton, FL, USA, 1989. [Google Scholar]
  62. Farid, N.; Bashir, S.; Mehmood, K. Effect of ambient gas conditions on laser-induced copper plasma and surface morphology. Phys. Scr. 2012, 85, 015702. [Google Scholar] [CrossRef]
  63. Farid, N.; Harilal, S.S.; Ding, H.; Hassanein, A. Emission features and expansion dynamics of nanosecond laser ablation plumes at different ambient pressures. J. Appl. Phys. 2014, 115, 033107. [Google Scholar] [CrossRef]
  64. Harilal, S.S.; Bindhu, C.V.; Nampoori, V.P.N.; Vallabhan, C.P.G. Influence of ambient gas on the temperature and density of laser produced carbon plasma. Appl. Phys. Lett. 1998, 72, 167–169. [Google Scholar] [CrossRef] [Green Version]
  65. Knight, A.K.; Scherbarth, N.L.; Cremers, D.A.; Ferris, M. Characterization of laser-induced breakdown spectroscopy (LIBS) for application to space exploration. Appl. Spectrosc. 2000, 54, 331–340. [Google Scholar] [CrossRef]
  66. Iida, Y. Effects of atmosphere on laser vaporization and excitation processes of solid samples. Spectrochim. Acta B 1990, 45, 1353–1367. [Google Scholar] [CrossRef]
  67. Effenberger, A.J.; Scott, J.R. Effect of atmospheric conditions on LIBS spectra. Sensors 2010, 10, 4907–4925. [Google Scholar] [CrossRef] [Green Version]
  68. Boyd, T.J.M.; Sanderson, J.J. The Physics of Plasmas; Cambridge University Press: Cambridge, UK, 2003. [Google Scholar]
  69. Peyser, T.; Manka, C.; Ripin, B.; Ganguli, G. Electron–ion hybrid instability in laser-produced plasma expansions across magnetic fields. Phys. Fluids B 1992, 4, 2448–2458. [Google Scholar] [CrossRef]
  70. Bleiner, D.; Bogaerts, A. Multiplicity and contiguity of ablation mechanisms in laser-assisted analytical micro-sampling. Spectrochim. Acta B 2006, 61, 421–432. [Google Scholar] [CrossRef]
  71. Zuhlke, C.A.; Anderson, T.P.; Alexander, D.R. Formation of multiscale surface structures on nickel via above surface growth and below surface growth mechanisms using femtosecond laser pulses. Opt. Express 2013, 21, 8460–8473. [Google Scholar] [CrossRef] [PubMed] [Green Version]
  72. Bashir, S.; Khurshid, S.; Akram, M.; Ali, N.; Ahmad, S.; Yousaf, D. Pulsed laser ablation of Ni in vacuum and N2 atmosphere at various fluences. Quantum Electron. 2015, 45, 640–647. [Google Scholar] [CrossRef]
  73. Mansour, N.; Jamshidi-Ghaleh, K.; Ashkenasi, D. Formation of conical microstructures of silicon with picosecond laser pulses in air. JLMN 2006, 1, 12–16. [Google Scholar] [CrossRef] [Green Version]
  74. Sarfraz, S.M.A.; Bashir, S.; Mahmood, K.; Khaliq, A.; Rizvi, R. Fluence-dependent sputtering yield measurement, surface morphology, crater depth, and hardness of laser-irradiated Zr in N2 and Ne environments. J. Opt. Soc. Am. B 2019, 36, 1945–1957. [Google Scholar] [CrossRef]
  75. Körner, C.; Mayerhofer, R.; Hartmann, M.; Bergmann, H.W. Physical and material aspects in using visible laser pulses of nanosecond duration for ablation. J. Appl. Phys. A 1996, 63, 123–131. [Google Scholar] [CrossRef]
  76. Tokarev, V. Viscous liquid expulsion in nanosecond UV laser ablation: From “clean” ablation to nanostructures. Laser Phys. 2006, 16, 1291–1307. [Google Scholar] [CrossRef]
  77. Lappalainen, J.; Frantti, J.; Lantto, V. Particulate formation in PZT thin films during pulsed laser ablation deposition. Korean Phys. Soc. 1998, 32, S1183–S1186. [Google Scholar]
  78. Aristov, Y.I.; Tokarev, M.M.; Freni, A.; Glaznev, I.S.; Restuccia, G. Kinetics of water adsorption on silica Fuji Davison RD. Microporous Mesoporous Mater. 2006, 96, 65–71. [Google Scholar] [CrossRef]
  79. Yousaf, D.; Bashir, S.; Akram, M.; Kalsoom, U.-I.; Ali, N. Laser irradiation effects on the surface, structural and mechanical properties of Al–Cu alloy 2024. Radiat. Eff. Defects Solids 2014, 169, 144–156. [Google Scholar] [CrossRef]
  80. Dauscher, A.; Feregotto, V.; Cordier, P.; Thomy, A. Laser induced periodic surface structures on iron. Appl. Surf. Sci. 1996, 96, 410–414. [Google Scholar] [CrossRef]
  81. Barmina, E.V.; Barberoglu, M.; Zorba, V.; Simakin, A.V.; Stratakis, E.; Fotakis, K.; Shafeev, G.A. Surface nanotexturing of tantalum by laser ablation in water. Quantum Electron. 2009, 39, 89. [Google Scholar] [CrossRef]
  82. Ko, S.H.; Pan, H.; Hwang, D.J.; Chung, J.; Ryu, S.; Grigoropoulos, C.P.; Poulikakos, D. High resolution selective multilayer laser processing by nanosecond laser ablation of metal nanoparticle films. J. Appl. Phys. 2007, 102, 093102. [Google Scholar] [CrossRef] [Green Version]
  83. Obilor, A.F.; Pacella, M.; Wilson, A.; Silberschmidt, V.V. Micro-texturing of polymer surfaces using lasers: A review. J. Adv. Manuf. Technol. 2022, 120, 103–135. [Google Scholar] [CrossRef]
  84. Tofil, S.; Barbucha, R.; Kocik, M.; Kozera, R.; Tański, M.; Arivazhagan, N.; Yao, J.; Zrak, A. Adhesive Joints with Laser Shaped Surface Microstructures. Materials 2021, 14, 7548. [Google Scholar] [CrossRef]
  85. Rudawska, A. Adhesive properties of metals and metal alloys. In Surface Energy; Aliofkhazraei, M., Ed.; InTech: Rijeka, Croatia, 2015; pp. 85–121. [Google Scholar]
Figure 1. An experimental setup for studying the effect of TMF on the LIBS of Cu-alloy plasma generated with a Nd: YAG laser.
Coatings 12 01972 g001
Figure 2. The optical emission spectra of selected Cu lines under 30 torr pressure of Ar, Ne, and He gas at 3.8 GW/cm2 irradiance with and without TMF in the spectral range from 300 nm to 600 nm.
Coatings 12 01972 g002
Figure 3. The spectral intensity variation of laser-induced Cu-alloy plasma under several pressure levels of the inert gases Ar (a,b), Ne (c,d), and He (e,f) at 3.8 GW/cm2 irradiance.
Coatings 12 01972 g003
Figure 4. The slope of Boltzmann plot obtained by using spectroscopic data of laser-ablated Cu.
Coatings 12 01972 g004
Figure 5. The change in Te of laser-induced Cu-alloy plasma at different pressures in Ar, Ne, and He environments at 3.8 GW/cm2 ns laser irradiance in the absence (a) and presence (b) of TMF.
Coatings 12 01972 g005
Figure 6. A Lorentzian fit of 327.26 nm line used for calculation of electron number density of Cu-plasma.
Coatings 12 01972 g006
Figure 7. The variation in ne of laser-induced Cu-alloy plasma at various pressures under Ar, Ne, and He environments at an irradiance of 3.8 GW/cm2 in the absence (a) and presence (b) of TMF.
Coatings 12 01972 g007
Figure 8. The variation in thermal beta of laser-induced Cu alloy plasma at various pressures under Ar, Ne, and He environments at ns laser irradiance of 3.8 GW/cm2.
Coatings 12 01972 g008
Figure 9. The fluctuation in directional beta of laser-induced Cu alloy plasma at different pressures in Ar, Ne, and He environments at 3.8 GW/cm2 ns laser irradiation.
Coatings 12 01972 g009
Figure 10. SEM micrographs illustrating surface morphological variations in an Ar ambient environment at various pressures, respectively (a) 1 torr, (b) 5 torr, (c) 30 torr, and (d) 50 torr, with a laser irradiation of 3.8 GW/cm2 in the field-free condition.
Coatings 12 01972 g010
Figure 11. Surface morphological modifications in an Ar ambient environment at different pressures, (a) 1 torr, (b) 5 torr, (c) 30 torr, and (d) 50 torr, with a laser irradiation of 3.8 GW/cm2 in the TMF.
Coatings 12 01972 g011
Figure 12. SEM micrographs exhibiting the variation in surface morphology under an ambient environment of Ne at different pressures, viz., (a) 1 torr, (b) 5 torr, (c) 30 torr, and (d) 50 torr, with a laser irradiance of 3.8 GW/cm2 in the field-free case.
Coatings 12 01972 g012
Figure 13. Surface morphological modifications in a Ne ambient environment at different pressures, (a) 1 torr, (b) 5 torr, (c) 30 torr, and (d) 50 torr, with a laser irradiation of 3.8 GW/cm2 in the TMF.
Coatings 12 01972 g013
Figure 14. SEM micrographs demonstrating surface morphological changes in a He ambient environment at (a) 1 torr, (b) 5 torr, (c) 30 torr, and (d) 50 torr with 3.8 GW/cm2 laser irradiation in the field-free condition.
Coatings 12 01972 g014
Figure 15. Surface morphological modifications in a He ambient environment at different pressures, (a) 1 torr, (b) 5 torr, (c) 30 torr, and (d) 50 torr, with a laser irradiation of 3.8 GW/cm2 in the TMF.
Coatings 12 01972 g015
Table 1. Spectroscopic parameters of Cu II lines obtained by NIST database and literature [57,58].
Spectroscopic Data
Wavelength
(nm)
TransitionsEnergy of Upper Level
Em (cm−1)
Statistical Weight gmTransition Probabilities
(108S−1)
324.523d9.5p–3d9.7d153,821.9455.95 × 10−3
327.263d8.(3F).4s.4p.(3Po)–3d9.(2D<3/2>).7s146,936.3252.00 × 10−4
447.993d9.4d–3d9.6p138,401.9572.16 × 10−4
521.543d10.9p⇾3d9.4s.(3D).7s134,742.8595.41 × 10−4
Table 2. Evaluated Te, ne, βt, and βd values for laser-irradiated Cu-alloy plasma at various Ar pressures in the presence and absence of TMF.
Argon
PressureTe (Kelvin)ne (1018) (cm−3)Analytical Parameters
Without TMFWith TMFWithout TMFWith TMFThermal BetaDirected Beta
1651393441.191.230.3079
2686495151.241.280.3283
3717196161.301.360.3693
4890711,7371.381.480.43107
5941312,1521.421.590.51112
1010,25912,9541.521.660.68136
2010,91913,3461.611.720.70150
3011,91513,8641.782.190.76163
4010,34113,4111.721.990.62154
50992212,2641.711.940.58135
60933612,0751.651.900.56121
70905311,5671.621.790.51102
80871510,9091.581.750.4695
90860310,7671.461.700.4085
100851910,6271.391.650.3876
120821899221.31.640.3570
140801995361.281.600.3465
160781992531.241.590.3260
180768189531.111.540.3154
200751986531.001.500.3050
Table 3. Evaluated Te, ne, βt, and βd values for laser-irradiated Cu-alloy plasma at various Ne pressures in the presence and absence of TMF.
Neon
PressureTe (Kelvin)ne (1018) (cm−3)Analytical Parameters
Without TMFWith TMFWithout TMFWith TMFThermal BetaDirected Beta
1627880000.981.120.2564
2649681391.111.130.2767
3684183681.151.190.3175
4760993401.191.260.3489
5849196161.251.320.45100
10900010,4321.281.420.50118
20981011,7681.421.600.52129
3010,60512,4271.581.850.63148
40942111,4401.471.830.60131
50921410,3221.411.780.52115
60882010,1491.361.730.51102
70823697091.311.690.4594
80785595951.231.550.4185
90770892721.171.480.3874
100754189001.081.420.3564
120732084771.011.400.3153
140708082700.991.300.2950
160682080770.911.250.2745
180652077770.861.200.2542
200638075770.811.190.2240
Table 4. Evaluated Te, ne, βt, and βd values for laser-irradiated Cu-alloy plasma at various He pressures in the presence and absence of TMF.
Helium
PressureTe (Kelvin)ne (1018) (cm−3)Analytical Parameters
Without TMFWith TMFWithout TMFWith TMFThermal BetaDirected Beta
1544967500.750.900.2253
2600670930.890.950.2359
3621374760.991.010.2463
4725779741.071.240.2875
5788188061.121.290.3691
10827198271.181.360.4293
20868110,1541.281.490.47105
30940411,7601.411.620.58129
40908010,5551.331.520.45107
50800610,1701.221.440.4099
60791397271.121.410.3791
70776293781.011.230.3578
80769390170.991.160.3370
90749088270.951.060.3264
100721884380.921.000.3158
120691380660.870.990.2941
140671378660.810.980.2639
160651375660.750.910.2535
180601371660.710.890.2231
200509370660.690.820.2028
Table 5. Averaged cavities and cone densities and their averaged diameter at different pressures of Ar, Ne, and He in the presence and absence of TMF.
Argon
Without TMFWith TMF
PressureCavities (103)/cm2Cones (103)/cm2Avg. Cone Dia. (µm)PressureCavities (103)/cm2Cones (103)/cm2Avg. Cone Dia. (µm)
121.74620.75728.2114.448.433
518.5412.2114.75123.212.1
306.19.7817302413.535.4
5002.10.950179.318.7
Average11.596511.2117515.2Average16.868.624.8
Neon
Without TMFWith TMF
PressureCavities (103)/cm2Cones (103)/cm2Avg. Cone Dia. (µm)PressureCavities (103)/cm2Cones (103)/cm2Avg. Cone Dia. (µm)
128.6515.28725.7137.180.324.2
519.942822.7564.976.3524.2
3010.216.56223031.226.8718.2
5019.125.47275028.946.9328.75
Average19.472521.3292524.35Average40.52557.612523.8375
Helium
Without TMFWith TMF
PressureCavities (103)/cm2Cones (103)/cm2Avg. Cone Dia. (µm)PressureCavities (103)/cm2Cones (103)/cm2Avg. Cone Dia. (µm)
131.231.930115.8928.3725.3
521.221.929.4512.7155.630.4
3023.122.625.73045.9433.3535.4
5022.112.126.65012.312.323.8
Average24.422.12527.925Average21.7132.40528.725
Publisher’s Note: MDPI stays neutral with regard to jurisdictional claims in published maps and institutional affiliations.

