Article

Synthesis of a Hydroxyl-Containing Corrosion Inhibitor and Its Inhibitory Performance on N80 Steel in Hydrochloric Acid Solution

1
Petroleum Engineering College, Yangtze University, Wuhan 430100, China
2
Key Laboratory of CNPC for Oil and Gas Production, Yangtze University Branch, Wuhan 430100, China
3
Key Laboratory of Drilling and Production Engineering for Oil and Gas, Wuhan 430100, China
4
Petro China Petrochemical Research Institute, Beijing 102206, China
5
School of Petroleum and Chemical Engineering, Jingzhou University, Jingzhou 434023, China
*
Author to whom correspondence should be addressed.
Coatings 2022, 12(12), 1975; https://doi.org/10.3390/coatings12121975
Submission received: 17 October 2022 / Revised: 8 December 2022 / Accepted: 13 December 2022 / Published: 16 December 2022

Abstract

:
In the process of petroleum exploitation, in order to effectively inhibit the corrosion damage of acid to metal equipment. Mannich base corrosion inhibitors are generally added to inhibit the corrosion damage of acid. In order to enhance the solubility of Mannich base corrosion inhibitor. This paper intends to introduce hydrophilic groups to enhance the solubility of the Mannich base corrosion inhibitor. In this paper, two efficient corrosion inhibitors 3-(2-hydroxyethylamino)-1-phenylpropan-1-one (MY1) and 3-(2-aminoethylamino)-1-phenylpropan-1-one (MY2), were synthesized based on the Mannich reaction, using formaldehyde, acetophenone and ethanolamine/ethylenediamine as reaction raw materials. The corrosion inhibition performance of the inhibitor on N80 steel in 15% (mass fraction) hydrochloric acid solution was studied by means of the static weight loss method, electrochemical test and optical contact angle analysis. It could be seen from the static weight loss method that the corrosion rate in the hydrochloric acid solution before and after adding 0.7% (mass fraction) corrosion inhibitor concentration decreased from 129.39 g·m−2·h−1 to 1.45 g·m−2·h−1 and 2.79 g·m−2·h−1, respectively. The corrosion inhibition rate could reach 98%, indicating that both inhibitors had good corrosion inhibition performance, and the corrosion inhibition effect of MY1 was better than that of MY2. It was found from the electrochemical tests that the two inhibitors were mixed corrosion inhibitors mainly inhibiting the anodic reaction, and both inhibitors belonged to spontaneous adsorption, and their adsorption behaviors followed the Langmuir adsorption isotherm. In addition, the surface of N80 steel was characterized by SEM, EDS elemental mapping and contact angle measurement. The results show that a dense hydrophobic film is formed on the surface of the steel sheet after the addition of a corrosion inhibitor, which prevents corrosion.

1. Introduction

At present, with the continuous exploitation of oil, tight oil reservoirs have become the main object of oil exploitation. Improving the recovery factor of tight oil reservoirs can effectively alleviate energy problems such as insufficient energy supply. Acidification is one of the important measures for oil well stimulation [1,2]. However, the acid used in acidification usually contains strong corrosiveness, which will destroy the oxide film on the metal surface and increase the probability of pitting corrosion on the metal surface, seriously damaging tubing and mechanical equipment, thus prolonging the workover period and increasing the economic cost [3], and may also lead to downhole safety accidents. At the same time, when the acid liquid corrodes metal equipment, a large amount of Fe3+ will be produced, and the existence of Fe3+ will cause irreversible reservoir damage to the oil layer. Therefore, in order to avoid serious damage to downhole metal pipes, mechanical equipment and oil layers caused by acidizing fluid, adding a corrosion inhibitor to acidizing fluid has been one of the common methods for oilfields to prevent corrosion failure [4]. Physical or chemical interaction between a corrosion inhibitor and a metal surface in the acid forms an effective protective film. It prevents contact between metal and acid and thus plays a role in corrosion inhibition [5].
So far, many scholars have performed much research on acid corrosion inhibitors. Traditional inorganic compound corrosion inhibitors have limited their use due to their biological toxicity and high price. Therefore, organic corrosion inhibitors have become one of the effective strategies for reducing corrosion in acidic environments. Among the organic corrosion inhibitors, Mannich base corrosion inhibitors have been widely used in oilfield anticorrosion due to their excellent corrosion inhibition performance, simple synthesis steps and low cost. Ayeni A O et al. [6] synthesized an excellent Mannich base corrosion inhibitor with piperazine, formaldehyde and m-cresol and found that the presence of N atoms is conducive to the adsorption of inhibitor molecules on the surface of carbon steel, and the corrosion inhibition rate reaches 93%. B.I et al. [7] studied benzoin-(4-phenylthiosemicarbazone) and benzil-(4-phenylthiosemicarbazone) and found that the solubility of corrosion inhibitor molecules in the corrosion medium will affect the corrosion rate. If the solubility is better, the corrosion inhibitor molecules will be more easily adsorbed on the carbon steel surface, and the formed adsorption film will be denser. Ahmed Y et al. [8] found through quantum chemistry that the effect of organic corrosion inhibitor compounds on metal corrosion inhibition in an acidic solution is directly related to its adsorption performance. The stronger the adsorption performance, the better the corrosion inhibition effect. When organic compounds contain aromatic rings, multiple chemical bonds, and heteroatoms (such as N, O and S atoms), which can contribute lone pairs of electrons and heterocycles, they are considered potential adsorption sites for bonding with metal surfaces. Through these adsorption sites, corrosion inhibitor molecules can form a dense adsorption film to protect the metal surface from being corroded.
In this paper, the inhibition performance of two corrosion inhibitors with different configurations and the influence of the water solubility of the inhibitor itself on the inhibition performance is mainly studied. Two Mannich base corrosion inhibitors, MY1 and MY2, were synthesized by Mannich reaction using formaldehyde, acetophenone and ethanolamine/ethylenediamine as raw materials. Characterized by the static weight loss method and electrochemical measurements, we explore the corrosion inhibition performance of two corrosion inhibitors in 15% (mass fraction%, the same as below) hydrochloric acid medium and use a scanning electron microscope (SEM) to observe the corrosion morphology of the metal surface and, through the optical contact angle test and EDS elemental mapping, explore its corrosion inhibition mechanism.

2. Experimental Part

2.1. Synthesis of Target Corrosion Inhibitors

Synthetic equation, see Formula (1)
Coatings 12 01975 i001
Ethanolamine and ethylenediamine were purchased from Aladdin Company and used without further purification. Analytical grade ethanol, acetophenone, formaldehyde and GR grade 37% HCl were acquired from Sinopharm Chemical Reagent Co., Ltd. (Shanghai, China).
MY1 and MY2 are mainly synthesized according to the Mannich amine methylation reaction mechanism. We added 8.2 g of formaldehyde and 6.2 g of ethanolamine (6 g of ethylenediamine) into a 250 mL three-necked flask with a reflux condenser, a constant pressure drip funnel and a magnetic stirrer. Subsequently, we added a small amount of absolute ethanol as the reaction solvent. We mixed formaldehyde, ethanolamine (ethylenediamine) and absolute ethanol evenly, then added a small amount of hydrochloric acid as the catalyst. The temperature was adjusted to 40 °C, and reacted at a constant temperature for 1 h. Next, the pH value was adjusted to be acidic by hydrochloric acid, and add 12 g of acetophenone. The temperature was raised to 90 °C, and the reaction was maintained at this temperature for several hours. Subsequently, the excess solvent was evaporated using a rotary evaporator, and reddish-brown/light yellow solids were obtained after purification, namely 3-(2-hydroxyethylamino)-1-phenylpropan-1-one (MY1) and 3-(2-aminoethylamino)-1-phenylpropan-1-one (MY2). The structures of the synthesized compounds have been confirmed by FTIR (BRUKER TENSOR II) and LCMS (AB SCIEX Triple Quad 5500). MY1:FTIR (KBr, cm−1) 3411 (-OH), 1681(C=O). LCMS (m/z): 193.08 (M+). MY2:FTIR (KBr, cm−1) 3443 (-NH2),1681(C=O). LCMS (m/z): 192.12 (M+). There was no characteristic absorption peak of saturated aldehyde in the FTIR of MY1 and MY2. In line with the target product characteristics.

2.2. Static Weight Loss Test

In this paper, N80 steel is used as the experimental steel, and the corrosion immersion sample is processed into 50 mm × 10 mm × 3 mm (length × width × height), and its main components (mass fraction) are 0.32%C, 0.209%Si, 1.65%Mn, 0.18%P, 0.09%S, 0.014%Als, 0.118%V, and the balance is Fe. Before the experiment, the N80 steel was ground, cleaned and dried with cold air. The polished N80 specimens were accurately weighed by an analytical balance with a precision of 0.1 mg before the tests. Three coupons were used to obtain the average weight loss. The corrosive medium solution used is 15% hydrochloric acid solution containing different concentrations of corrosion inhibitors, the soaking temperature is 60 °C, and the soaking time is 4 h. After soaking, ultrasonic waves are used to remove corrosion impurities attached to the metal surface, and the weight after corrosion is recorded. The calculation formulas for corrosion rate and corrosion inhibition rate are as follows (2) and (3)
v = m 0 m l S × t
V—Corrosion rate of steel samples, g/(m2·h);
m0—Quality of steel samples before immersion, g;
ml—Quality of steel samples after immersion, g;
S—Surface area of the test sample, m2
t—Soaking time, h.
η = V 0 V l V 0 × 100 %
η—Corrosion Inhibition Efficiency, %
V0—Corrosion rate without corrosion inhibitor, g/(m2·h);
V1—Corrosion rate with corrosion inhibitor added, g/(m2·h).

2.3. Electrochemical Measurements

The working electrode is made of N80 steel, the working area of the sample is 1 cm2, and the copper wire is welded on the non-working surface, then encapsulated with epoxy resin. All test samples were polished step by step with 100–1200 sandpaper silicon paper until bright and visible [9], washed with acetone and anhydrous ethanol in turn, and dried with cold air. The instrument used for the electrochemical test is CS310M electrochemical workstation (CORRTEST, Wuhan, China), the test temperature is 30 °C, and the test solution is 15% hydrochloric acid solution containing different concentrations of corrosion inhibitors. The test adopts a three-electrode system, the reference electrode is a saturated calomel electrode (SCE), and the auxiliary electrode is a platinum electrode. The scanning range of potentiodynamic polarization tests was −300~300 mV (relative open circuit potential), and the scanning rate was 1 mV/s. The impedance measurements were taken using AC sine wave voltage of peak-to-peak 5 mV amplitude at the open circuit potential in the frequency range of 10−2 Hz~105 Hz. All potentials herein are relative to SCE.

2.4. Surface Analysis

The N80 samples were immersed in 15% hydrochloric acid solution containing different concentrations of corrosion inhibitors, the immersion temperature was 60 °C, and the immersion time was 4 h. The corrosion morphology of the metal surface after immersion corrosion was observed by ZEISS MELIN Compact scanning electron microscope (SEM, ZEISS, Oberkochen Germany) [10]. Moreover, using the DSA255 optical contact angle tester (Kruss, Hamburg, Germany), the change of the corrosion inhibitor on the surface hydrophobicity of the N80 sample can be observed by measuring the change of the contact angle of the steel surface [11].

3. Results and Discussion

3.1. Characterization of Target Corrosion Inhibitors

It can be seen from Figure 1a that MY1 and MY2 have carbonyl absorption peaks at 1681 cm−1 and 1675 cm−1, respectively, indicating that the synthetic substance has carbonyl groups; MY1 and MY2 have bending double vibration peaks of benzene ring at 689 cm−1 and 756 cm−1 and 693 cm−1 and 750 cm−1, respectively, and the skeleton vibration absorption peak of benzene ring appears at 1680–1440 cm−1 [12], indicating the existence of the benzene ring structure. MY1 has a hydroxyl characteristic absorption peak at 3411 cm−1, indicating that the synthesized product has hydroxyl groups. The amino characteristic absorption peak of MY2 at 3443 cm−1 indicated the presence of an amino group in the synthesized product. The characteristic peaks of C-N stretching vibration appeared in MY1 and MY2 at 1262 cm−1 and 1228 cm−1, respectively, indicating that the product has a secondary amine structure. There is no characteristic absorption peak of saturated aldehydes around 1740 cm−1, indicating that the product does not contain formaldehyde. MY1 and MY2 appear to have strong absorption peaks at 574 cm−1 and 583 cm−1, respectively, indicating that the H atom of acetophenone is substituted.
Figure 1b shows the LCMS of MY1. Its excimer ion peak [M+H]+ is 194.08, and the inferred relative molecular weight is 193.08. The theoretical value of the relative molecular weight is 193.25, and its fragment m/z (mass charge ratio) is 74.08. Figure 1c shows the LCMS of MY2. Its excimer ion peak [M+H]+ is 193.12, and the inferred relative molecular weight is 192.12. The theoretical value of the relative molecular weight is 192.26, and the fragment m/z 175.12 is judged to be the product of removing one H2O from the parent ion. The rest of the resolvable fragment ions m/z are 133.09, 105.08 and 73.11.
The above analysis shows that the synthesized product is a Mannich base corrosion inhibitor sample that meets the design.

3.2. Influence of Inhibitor Concentration on Corrosion Inhibition Performance

It can be seen from Figure 2 that with the continuous increase of the corrosion inhibitor concentration, the corrosion rate gradually decreases, and the corrosion inhibition rate gradually increases. When the concentration of corrosion inhibitor was 0.7% (mass fraction %, the same as below), The corrosion rates of MY1 and MY2 decreased from 129.39 g·m−2·h−1 to 1.45 g·m−2·h−1 and 2.79 g·m−2·h−1, respectively. Meanwhile, the corrosion inhibition rate of both inhibitors can reach 98%. It shows that the corrosion inhibition effect of the two corrosion inhibitors is obvious when the concentration is 0.7%.

3.3. Electrochemical Measurements

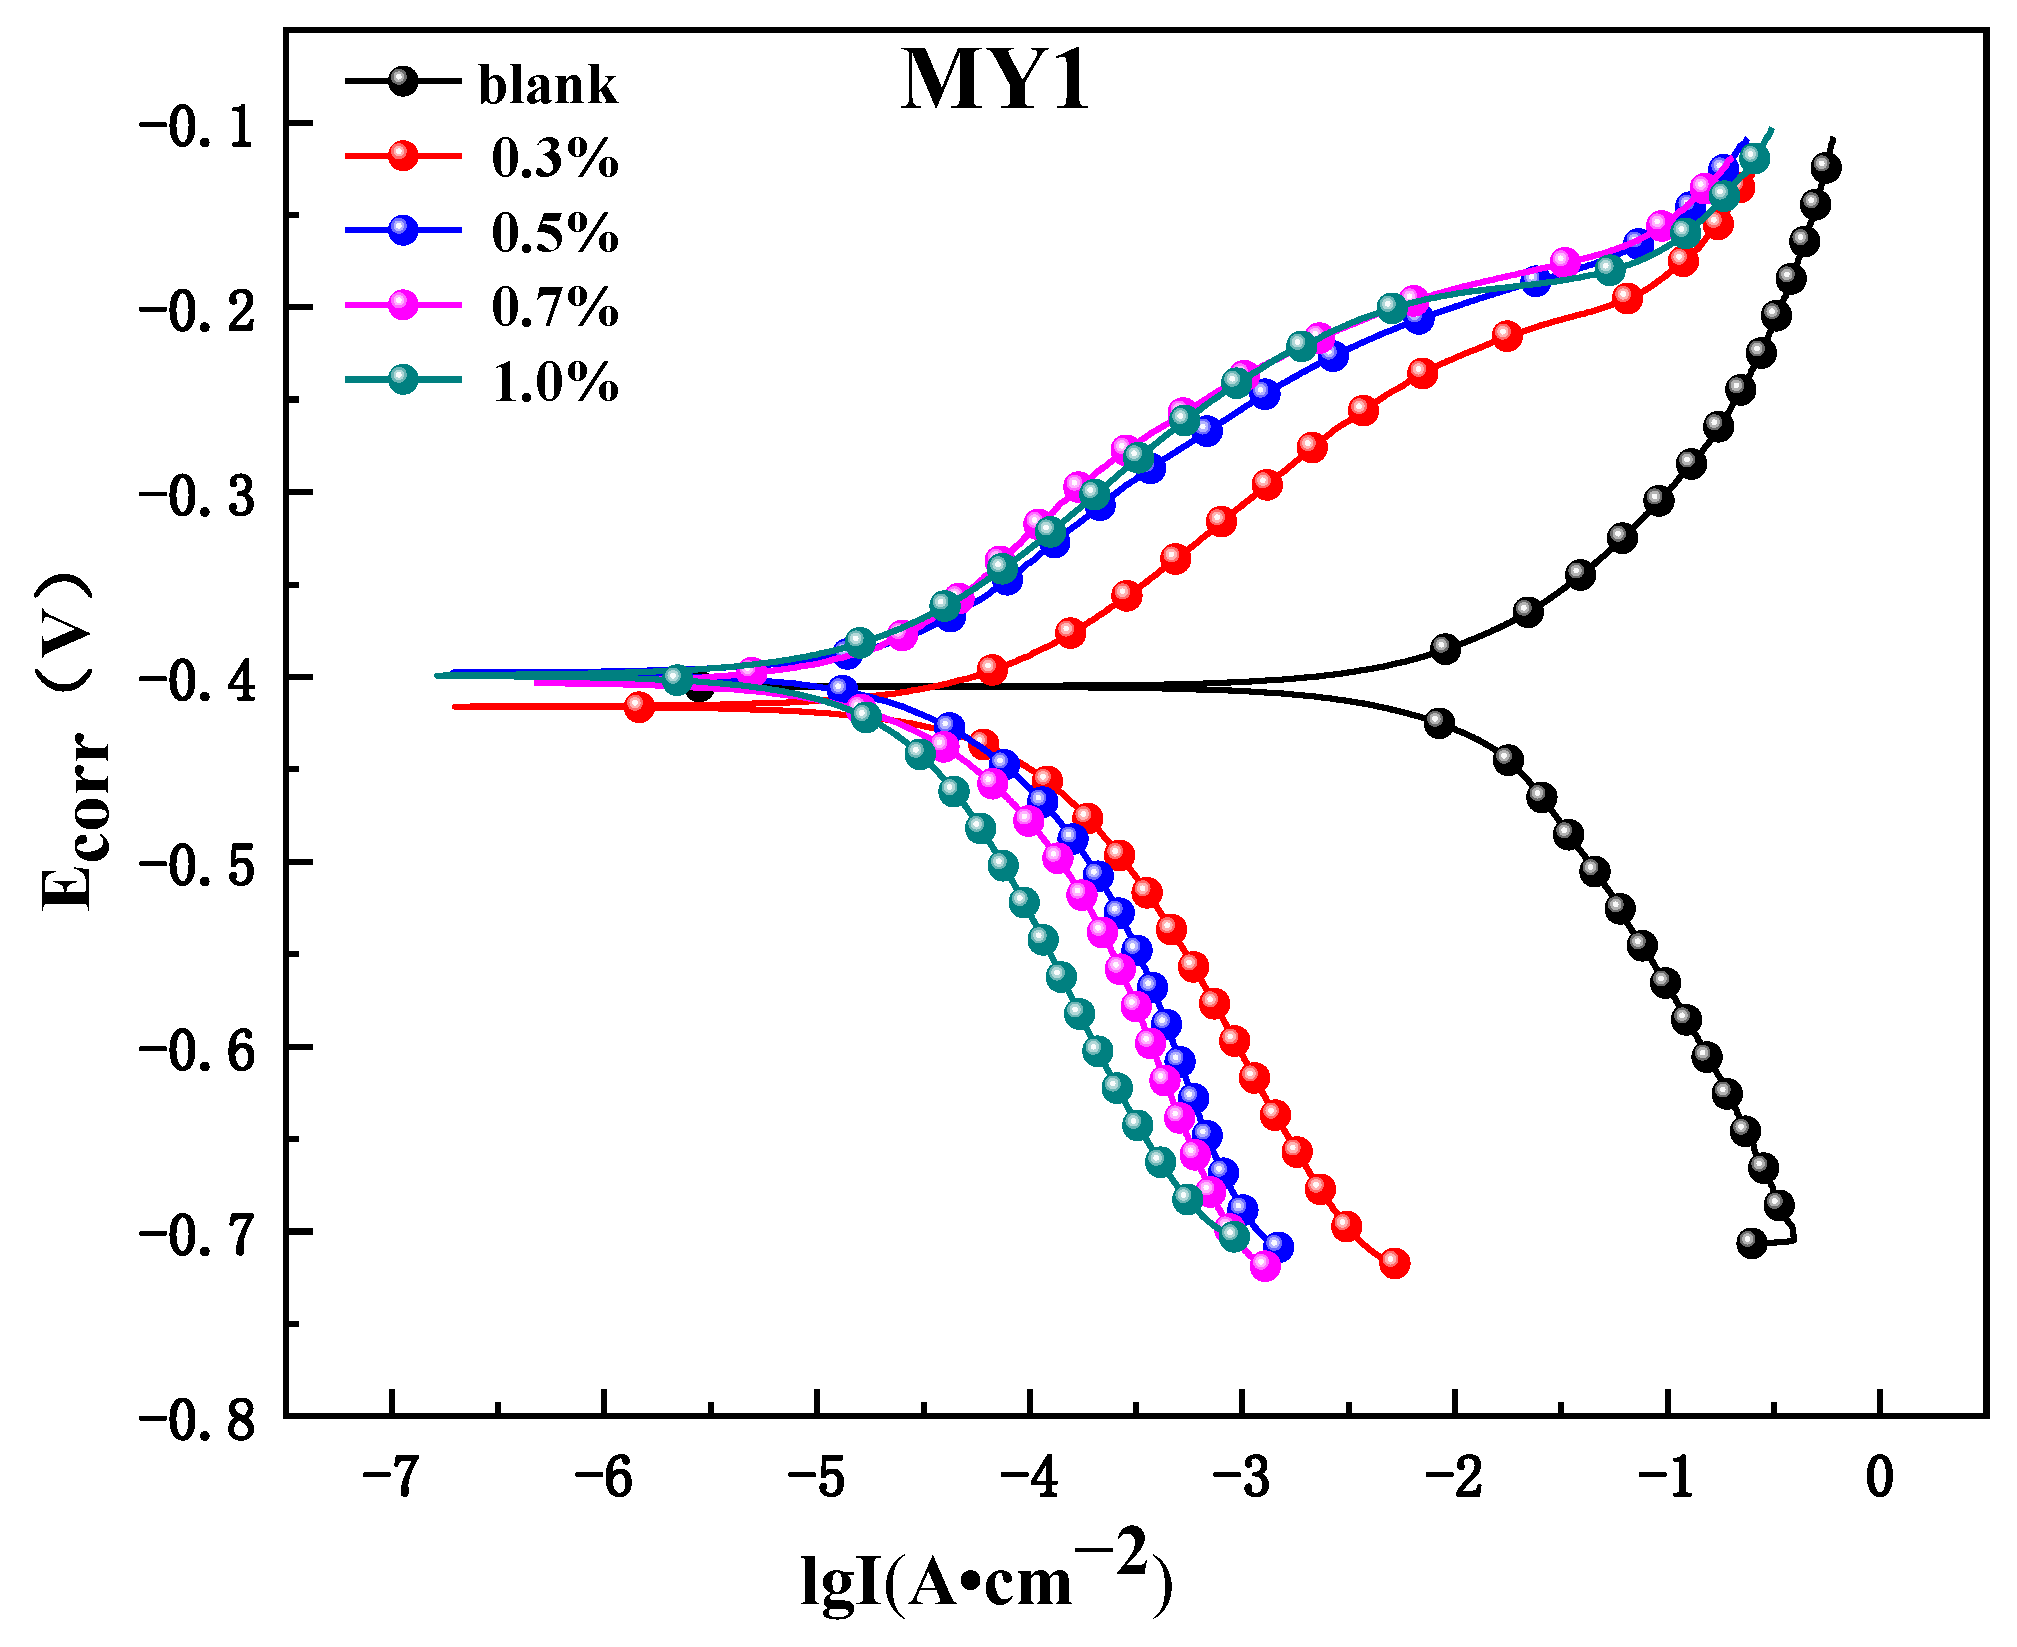
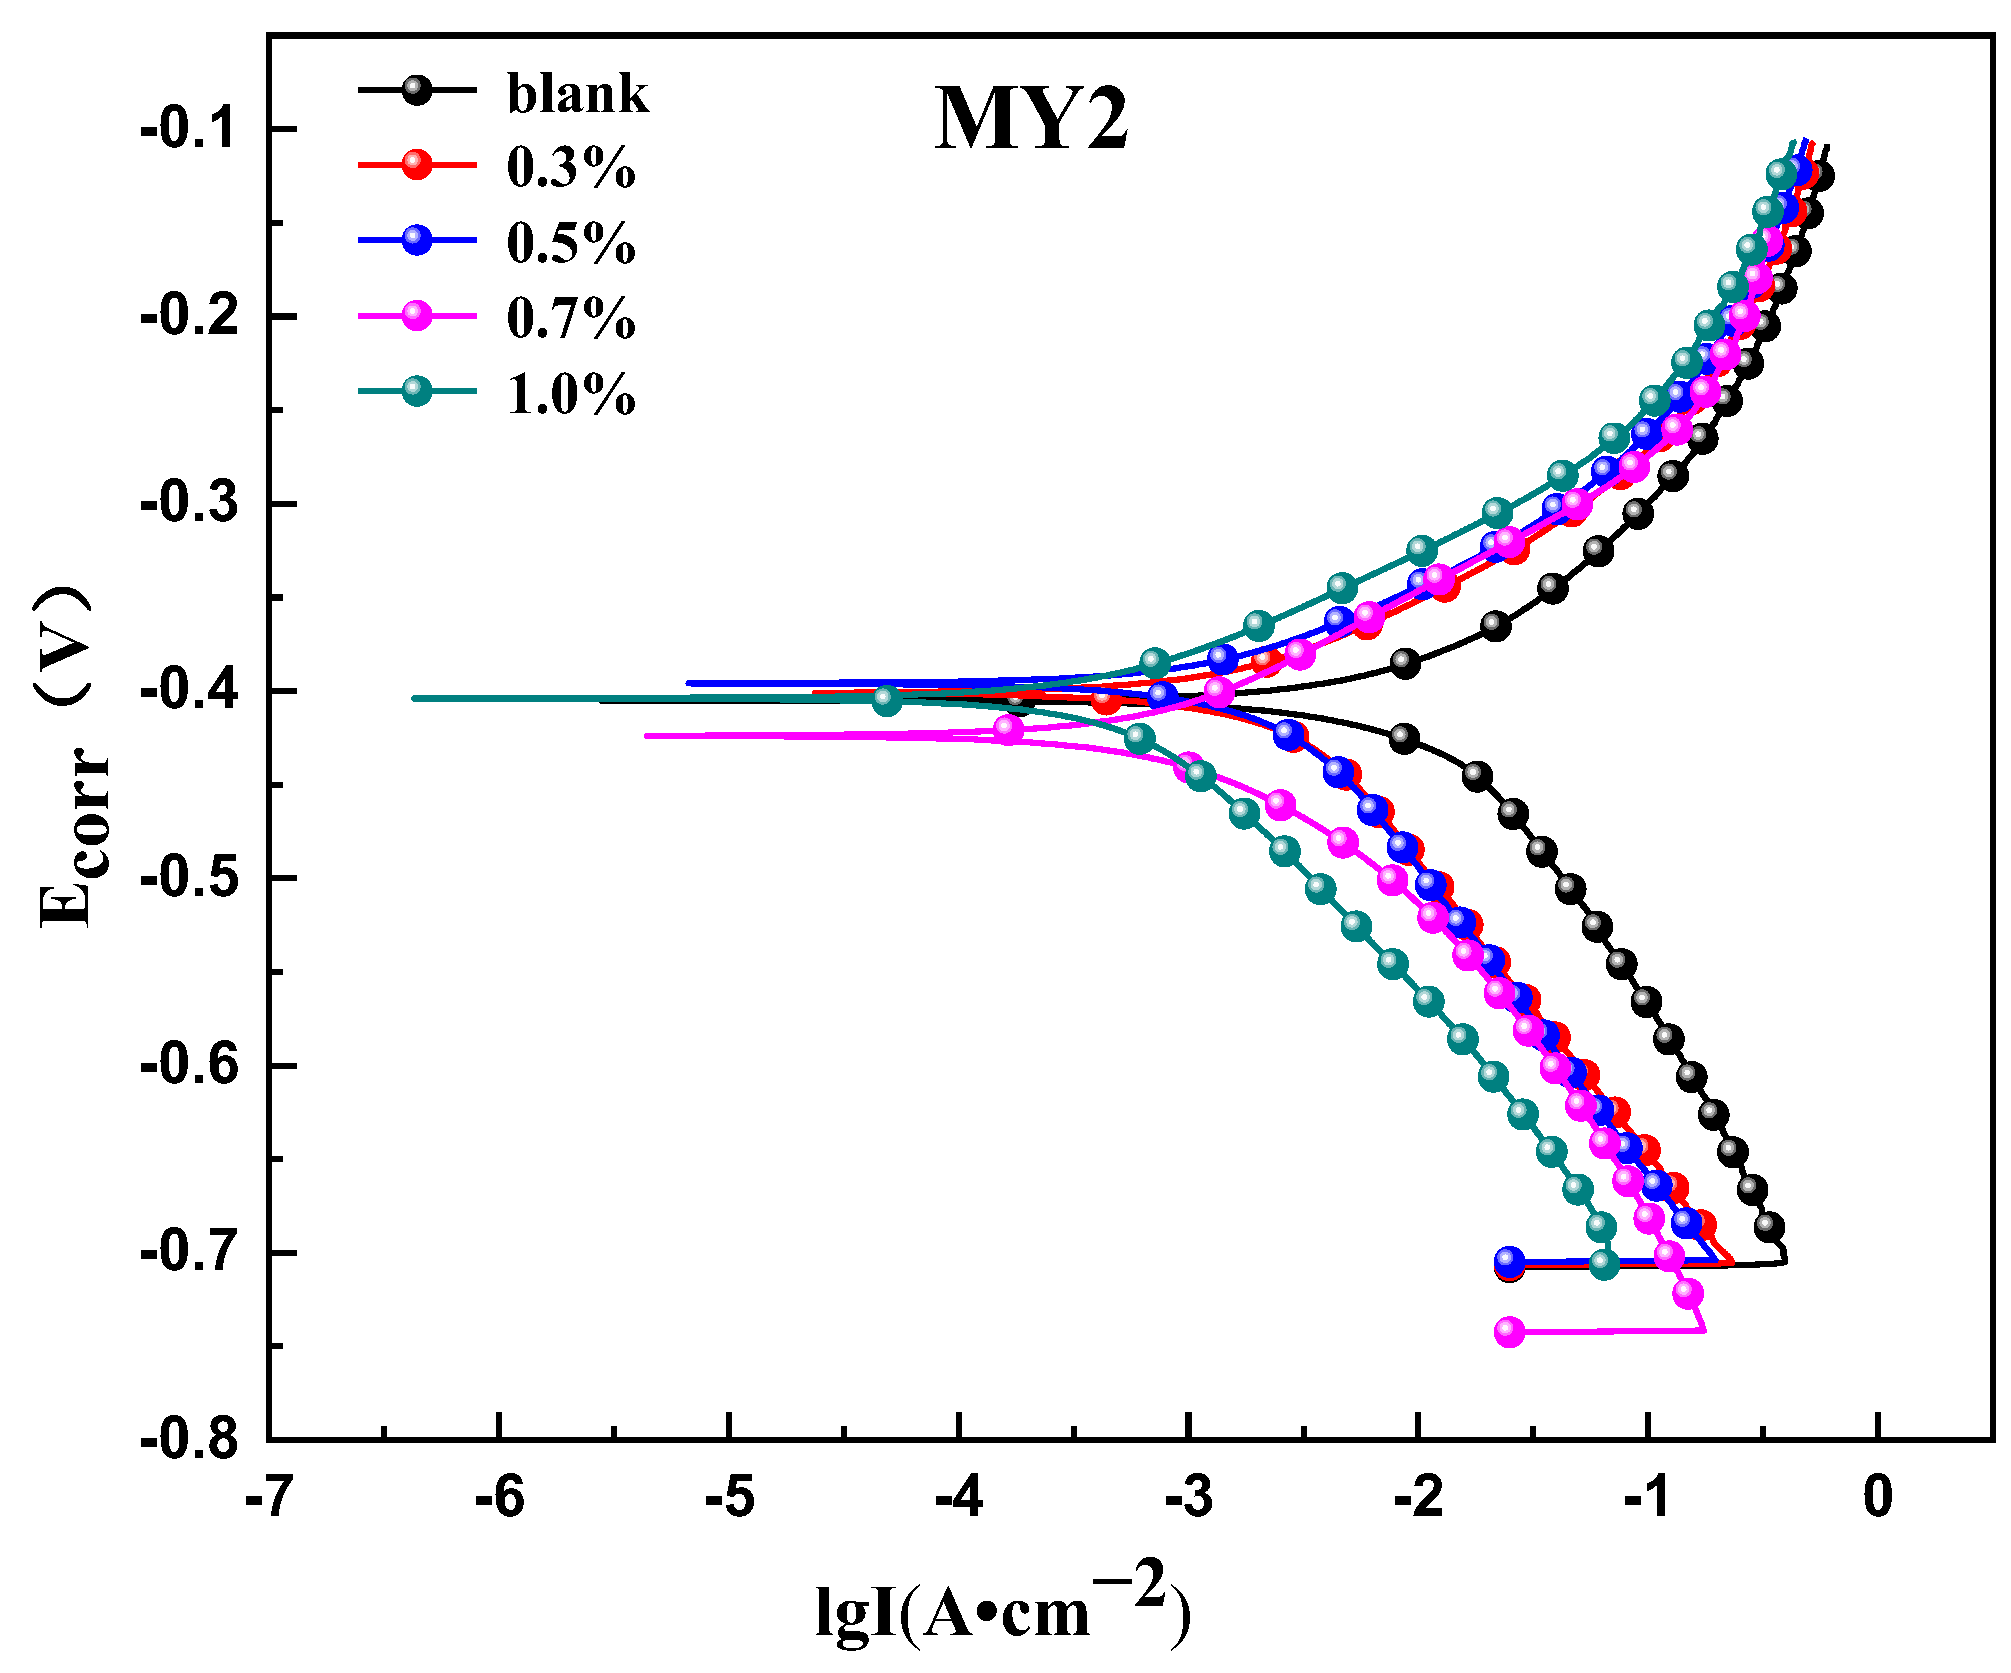
3.3.1. Potentiodynamic Polarization Measurements

At 30 °C, different concentrations of corrosion inhibitors were added to the 15% hydrochloric acid solution, and the polarization curves are shown in Figure 3. The corresponding electrochemical parameter fitting results are shown in Table 1.
It can be seen from Figure 3 and Table 1 that after adding the corrosion inhibitor, the Ecorr value is obviously shifted to a positive direction than that of the blank solution, indicating that the anode process is greatly hindered. At the same time, the concentration of corrosion inhibitor has a negative correlation with the corrosion current density (Icorr). With the increasing concentration of corrosion inhibitor, the value of Icorr gradually decreases, and the Icorr of MY1 is smaller than that of MY2, indicating that MY1 has a better corrosion inhibition effect than MY2. The addition of both inhibitors inhibited the electrochemical reaction during the corrosion process and reduced the corrosion reaction rate. It can be seen from Table 1 that both the cathodic Tafel slope (Bc) and the anodic Tafel slope (Ba) are affected, indicating that both corrosion inhibitors can effectively reduce both anodic Fe dissolution and cathodic hydrogen evolution reactions. It can be seen that MY1 and MY2 are mixed controlled corrosion inhibitors that mainly inhibit the anodic process [13].

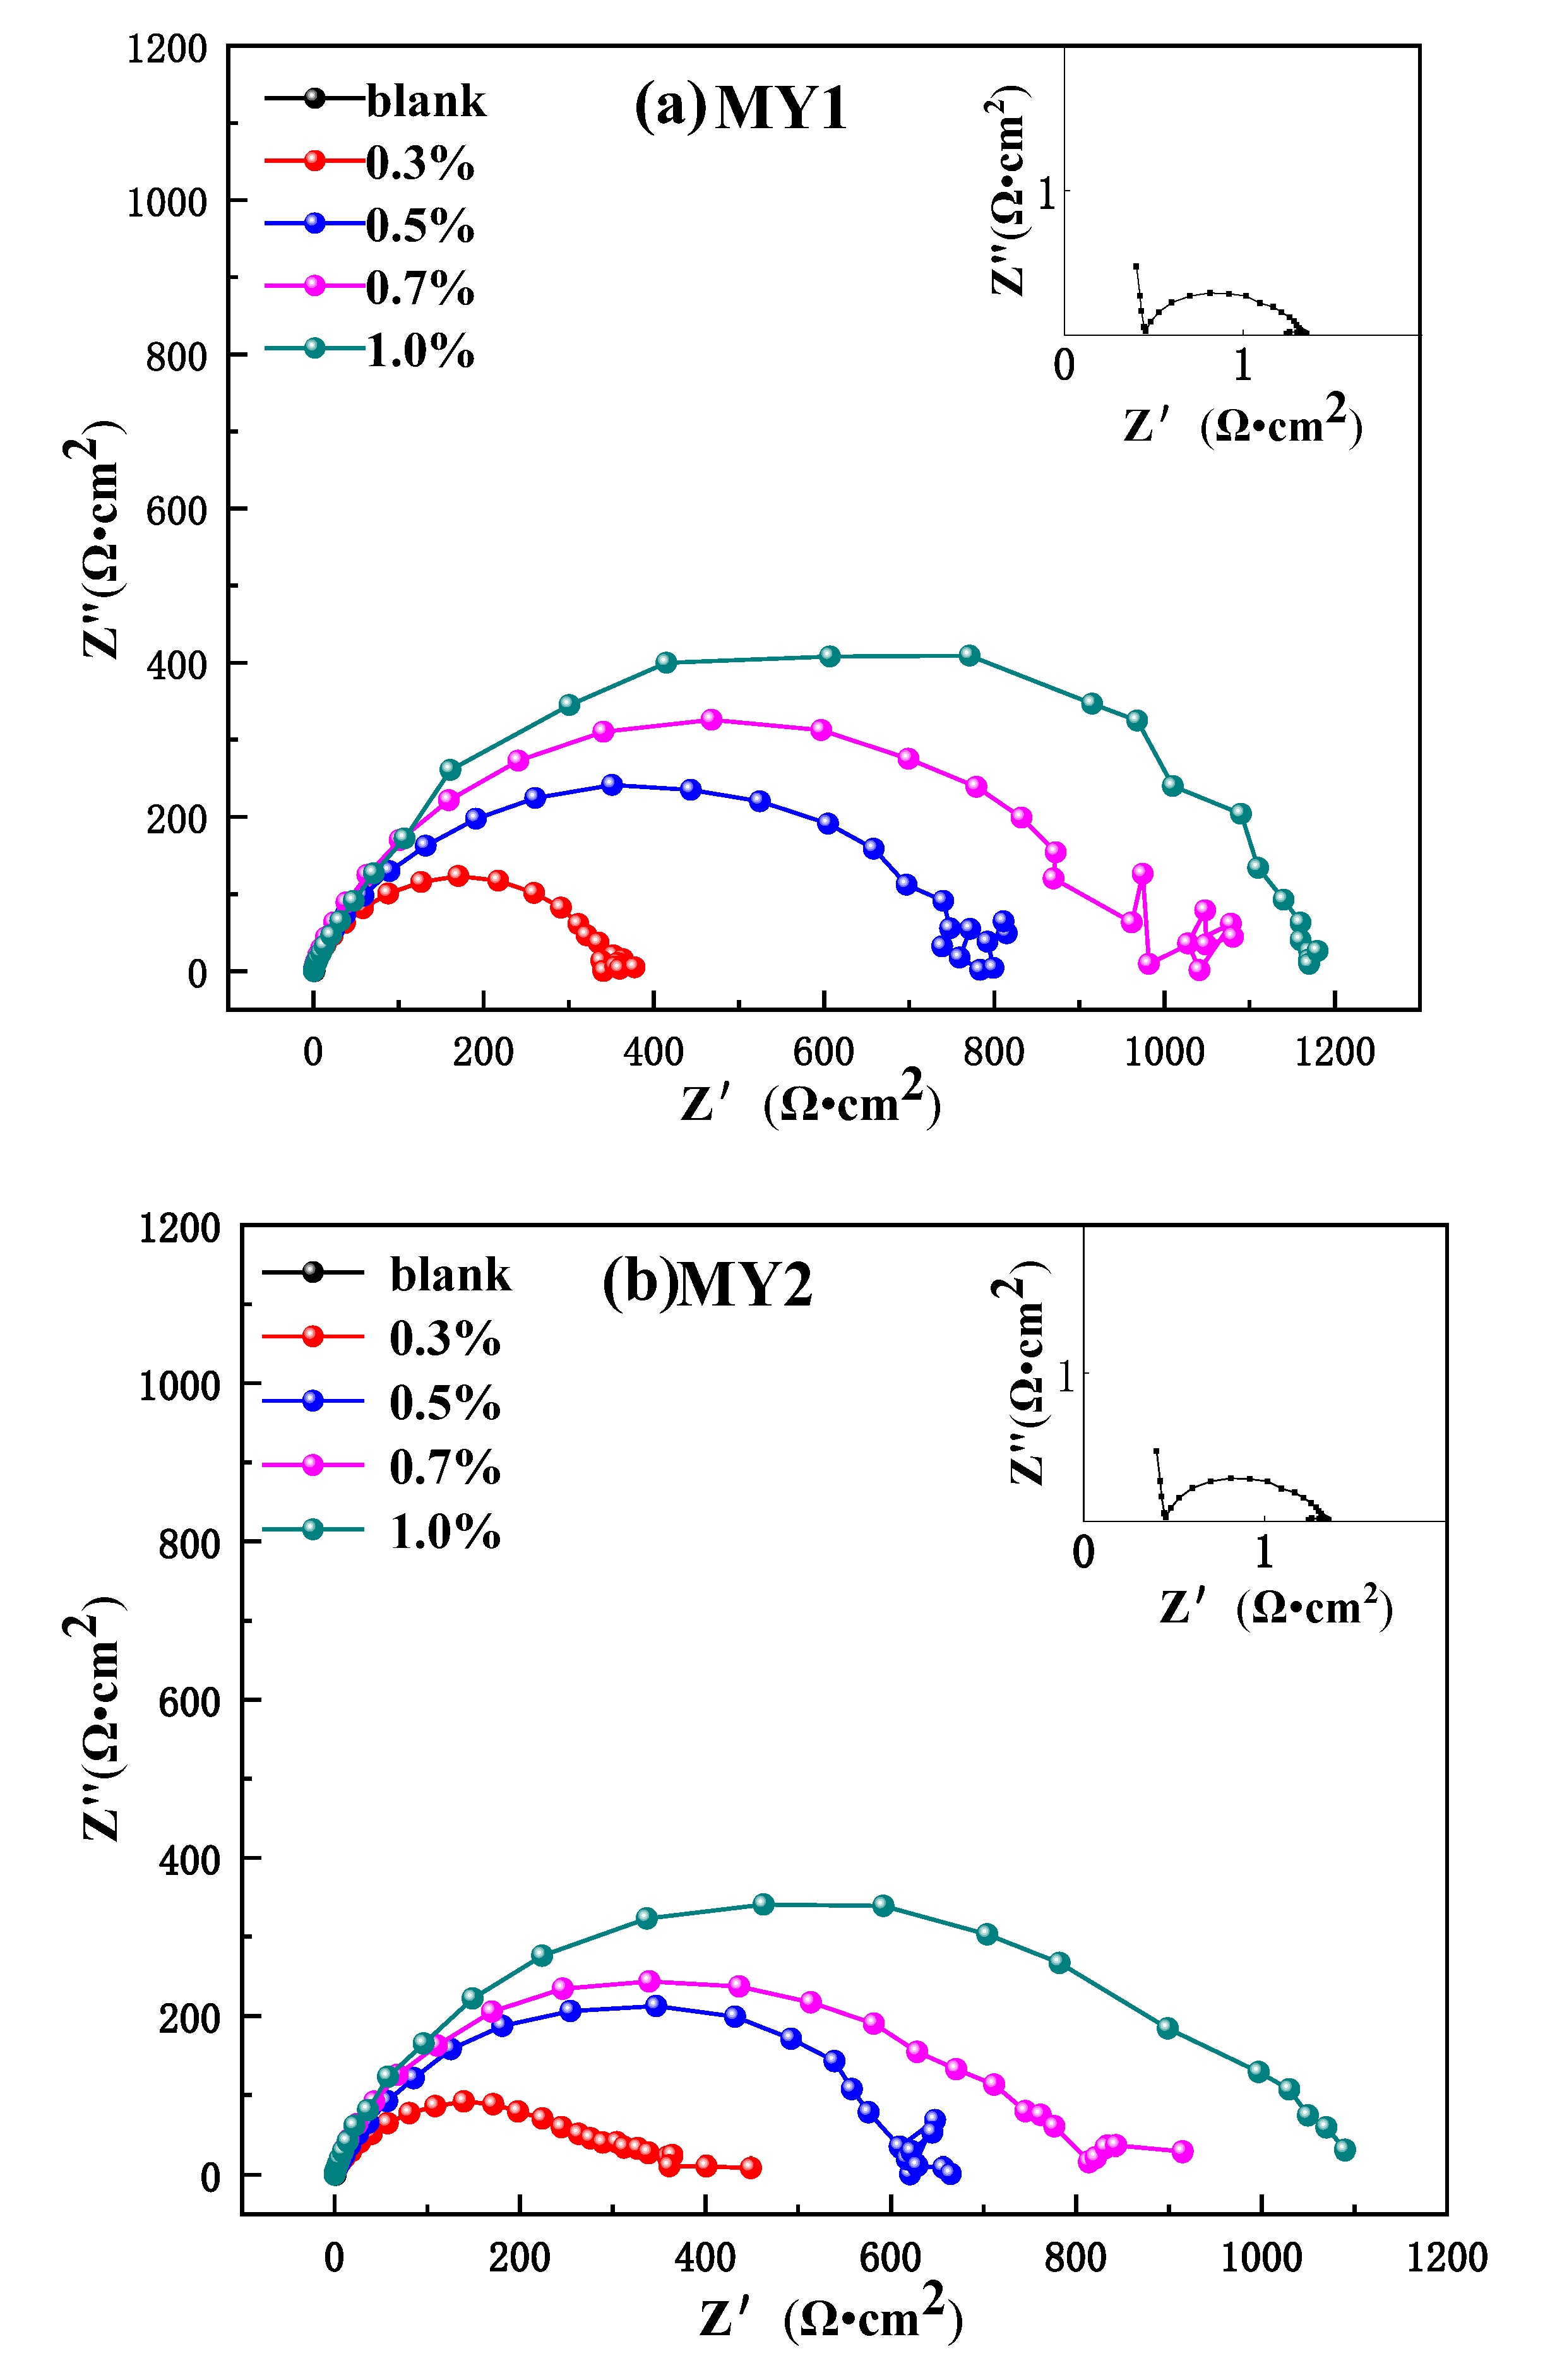
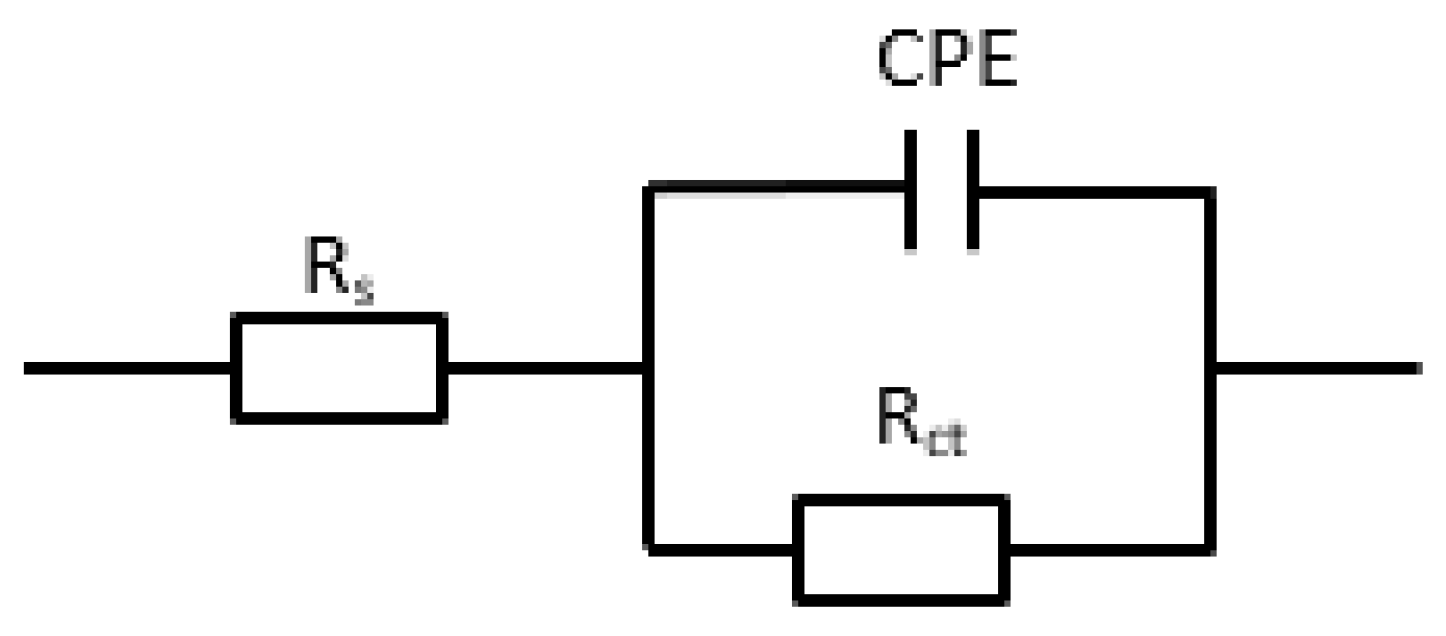
3.3.2. Electrochemical Impedance Spectroscope (EIS)

Figure 4 is the Nyquist plot and Bode plot of adding different concentrations of MY1 and MY2 in a 15% hydrochloric acid solution. When the test temperature is 30 °C, it can be seen from the Nyquist diagram that the impedance spectrum is a depressed capacitive semicircle. The impedance spectrum with and without corrosion inhibitor is still a capacitive semicircular, indicating that the corrosion reaction is still controlled by charge transfer [14]. The corrosion mechanism did not change. With the increased concentration of the corrosion inhibitor, the diameter of the semicircle gradually increased, indicating that the addition of the corrosion inhibitor inhibited the progress of corrosion. It can be seen from the Bode diagram that there is only one time constant during the corrosion process. Using the equivalent circuit diagram [15,16] shown in Figure 5 to perform impedance data fitting, Rs represents solution resistance, Rct represents charge transfer resistance, CPE is a constant phase angle element and γ 0 is the magnitude of the CPE [17]. The value of the electric double-layer capacitance (Cdl) is calculated by Formula (4) [18]. The fitting parameters are shown in Table 2.
C dl = γ 0 R ct 1 n 1 / n
It can be seen from Table 2 that when the concentration of the corrosion inhibitor increases continuously, the Rct also increases, which means that, with the increase in the concentration of the corrosion inhibitor, the resistance to metal dissolution will increase, and the electrochemical reaction process will slow down. Because the corrosion inhibitor molecules are adsorbed on the metal surface, the contact between the metal and the corrosive medium is hindered, and the corrosion process is inhibited. At the same time, with the increase of inhibitor concentration, the value of Cdl gradually decreases, which is due to the fact that when the corrosion inhibitor molecules are adsorbed on the metal surface, they gradually replace the water molecules with larger dielectric constant [19]. When more inhibitor molecules are adsorbed on the metal surface, the adsorbed film will be denser. This dense film hinders the electrochemical reaction process of erosive particles on the steel surface. From the Bode diagrams of MY1 and MY2, it can be found that the phase angle peaks of the two corrosion inhibitors gradually increase with the increase of the inhibitor concentration. It shows that the film layer of the corrosion inhibitor molecules adsorbed on the metal surface is denser and inhibits the electrochemical reaction process of corrosion.

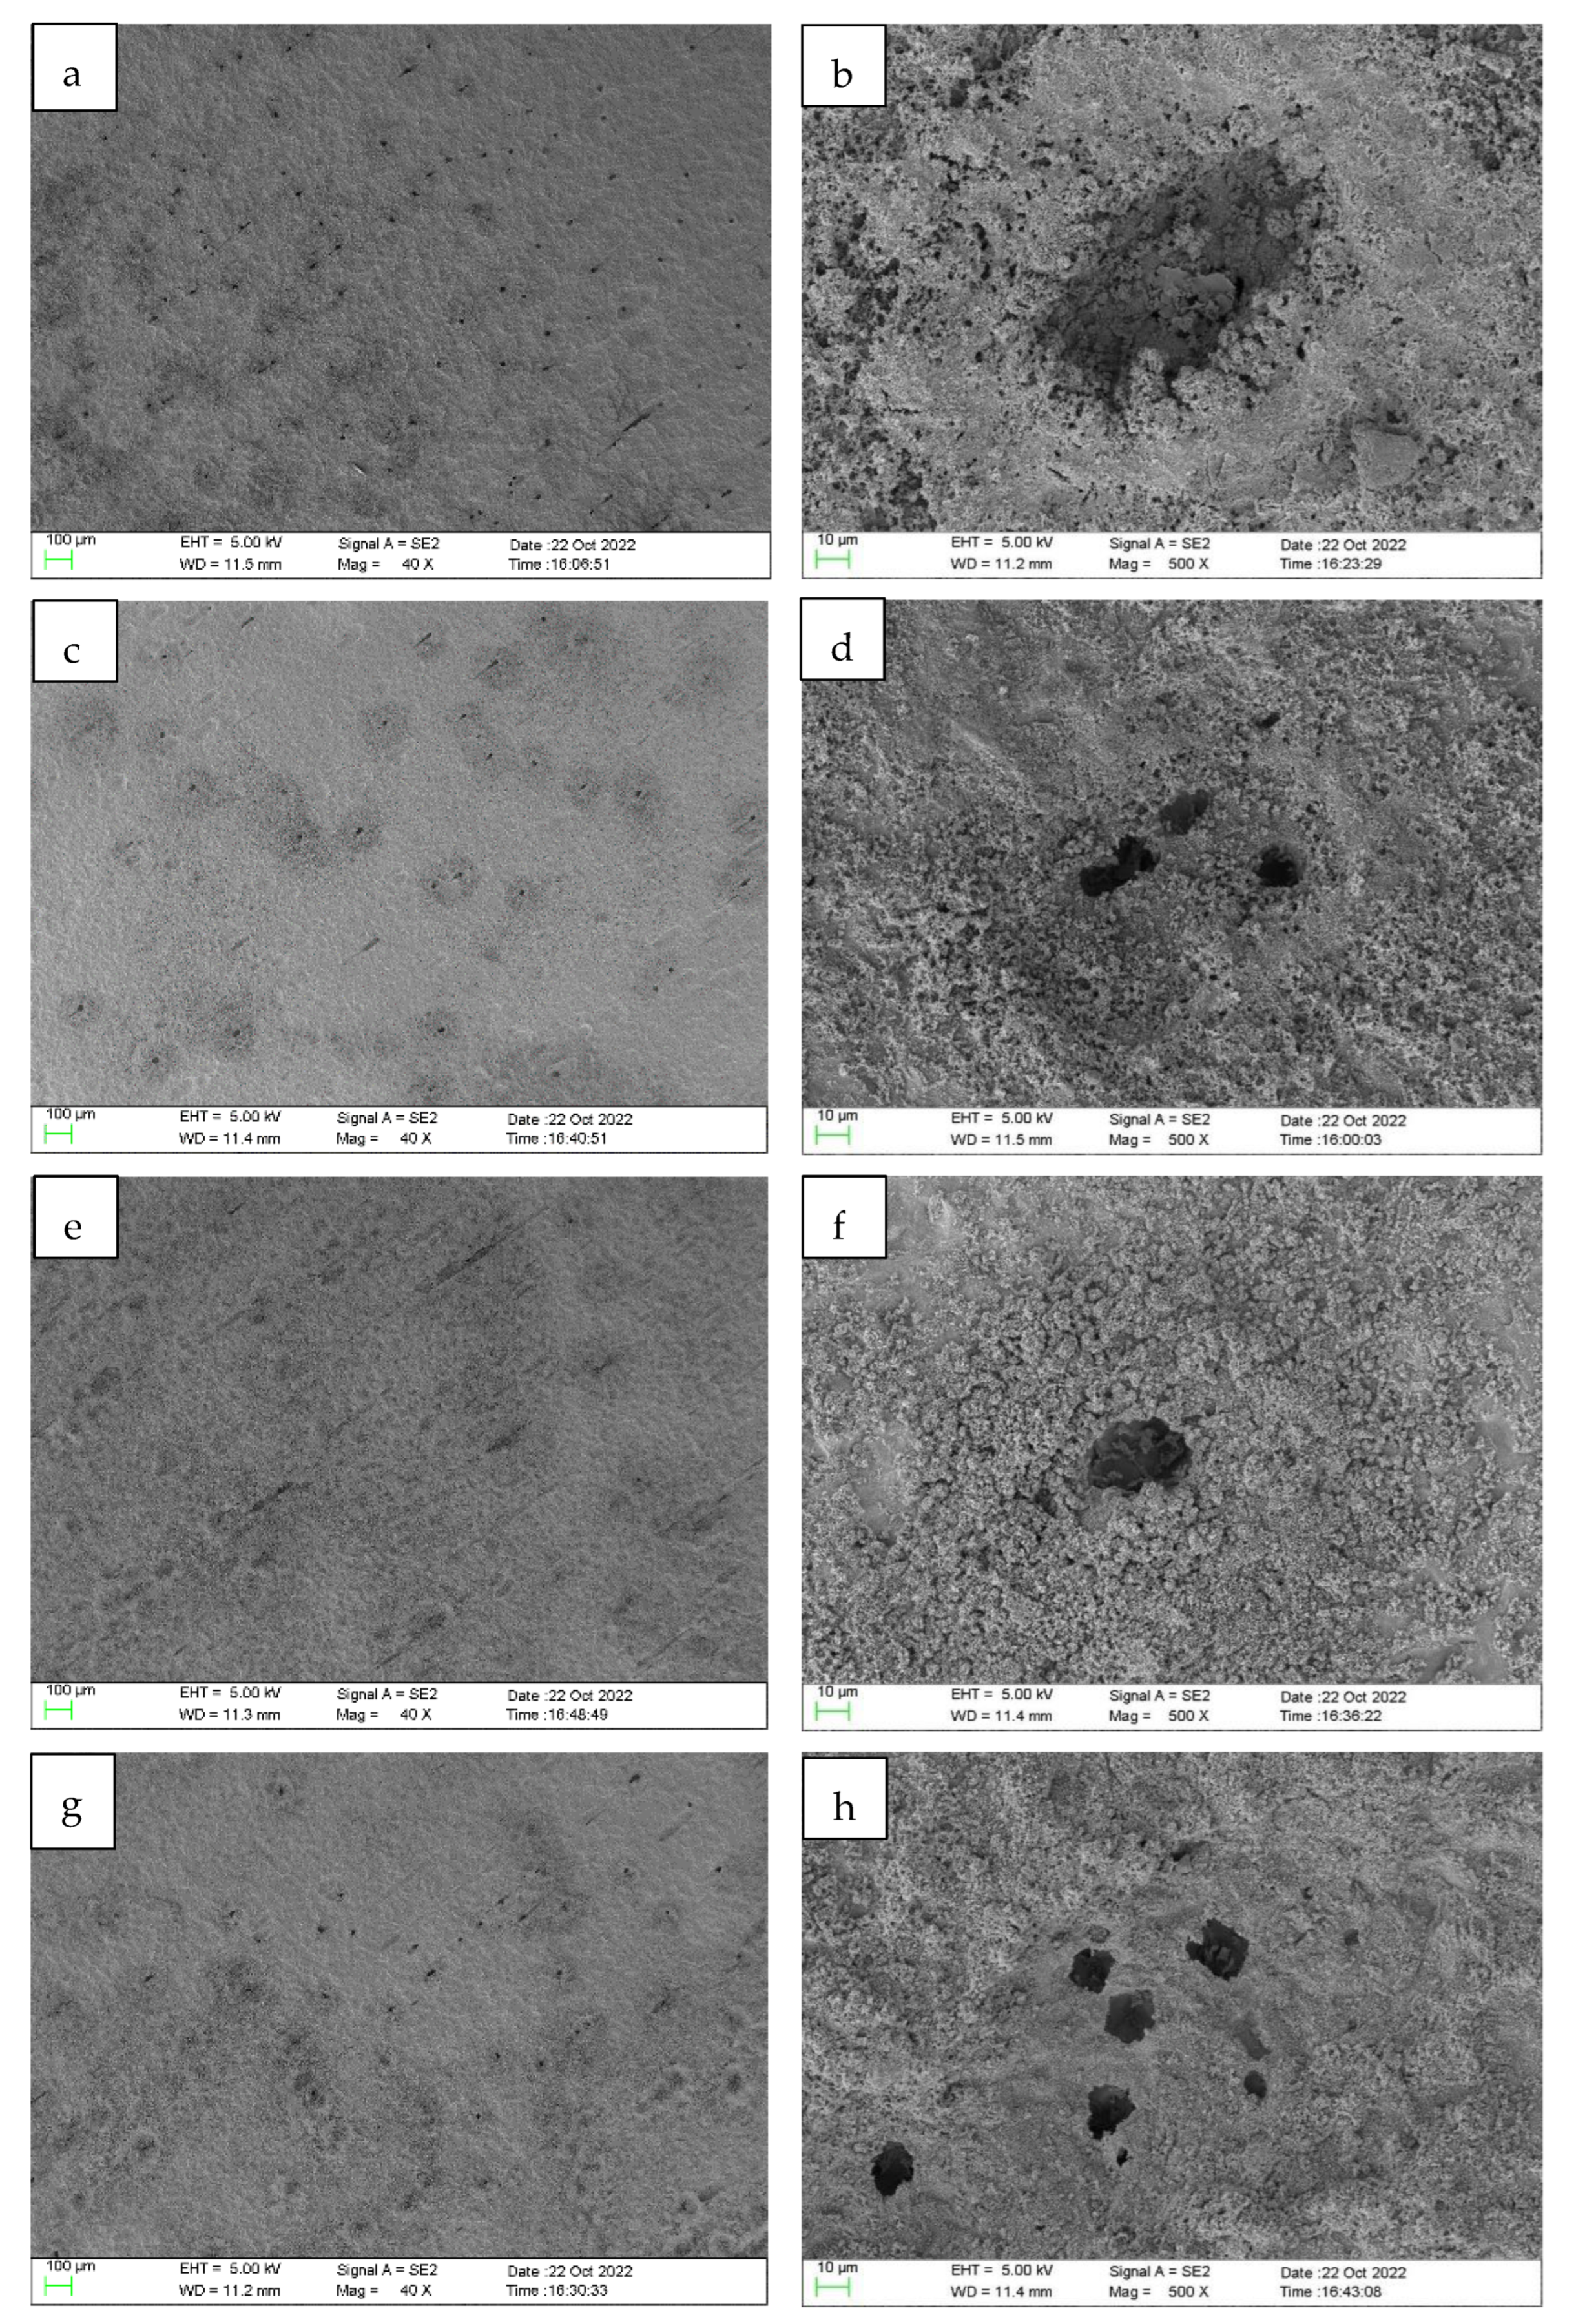
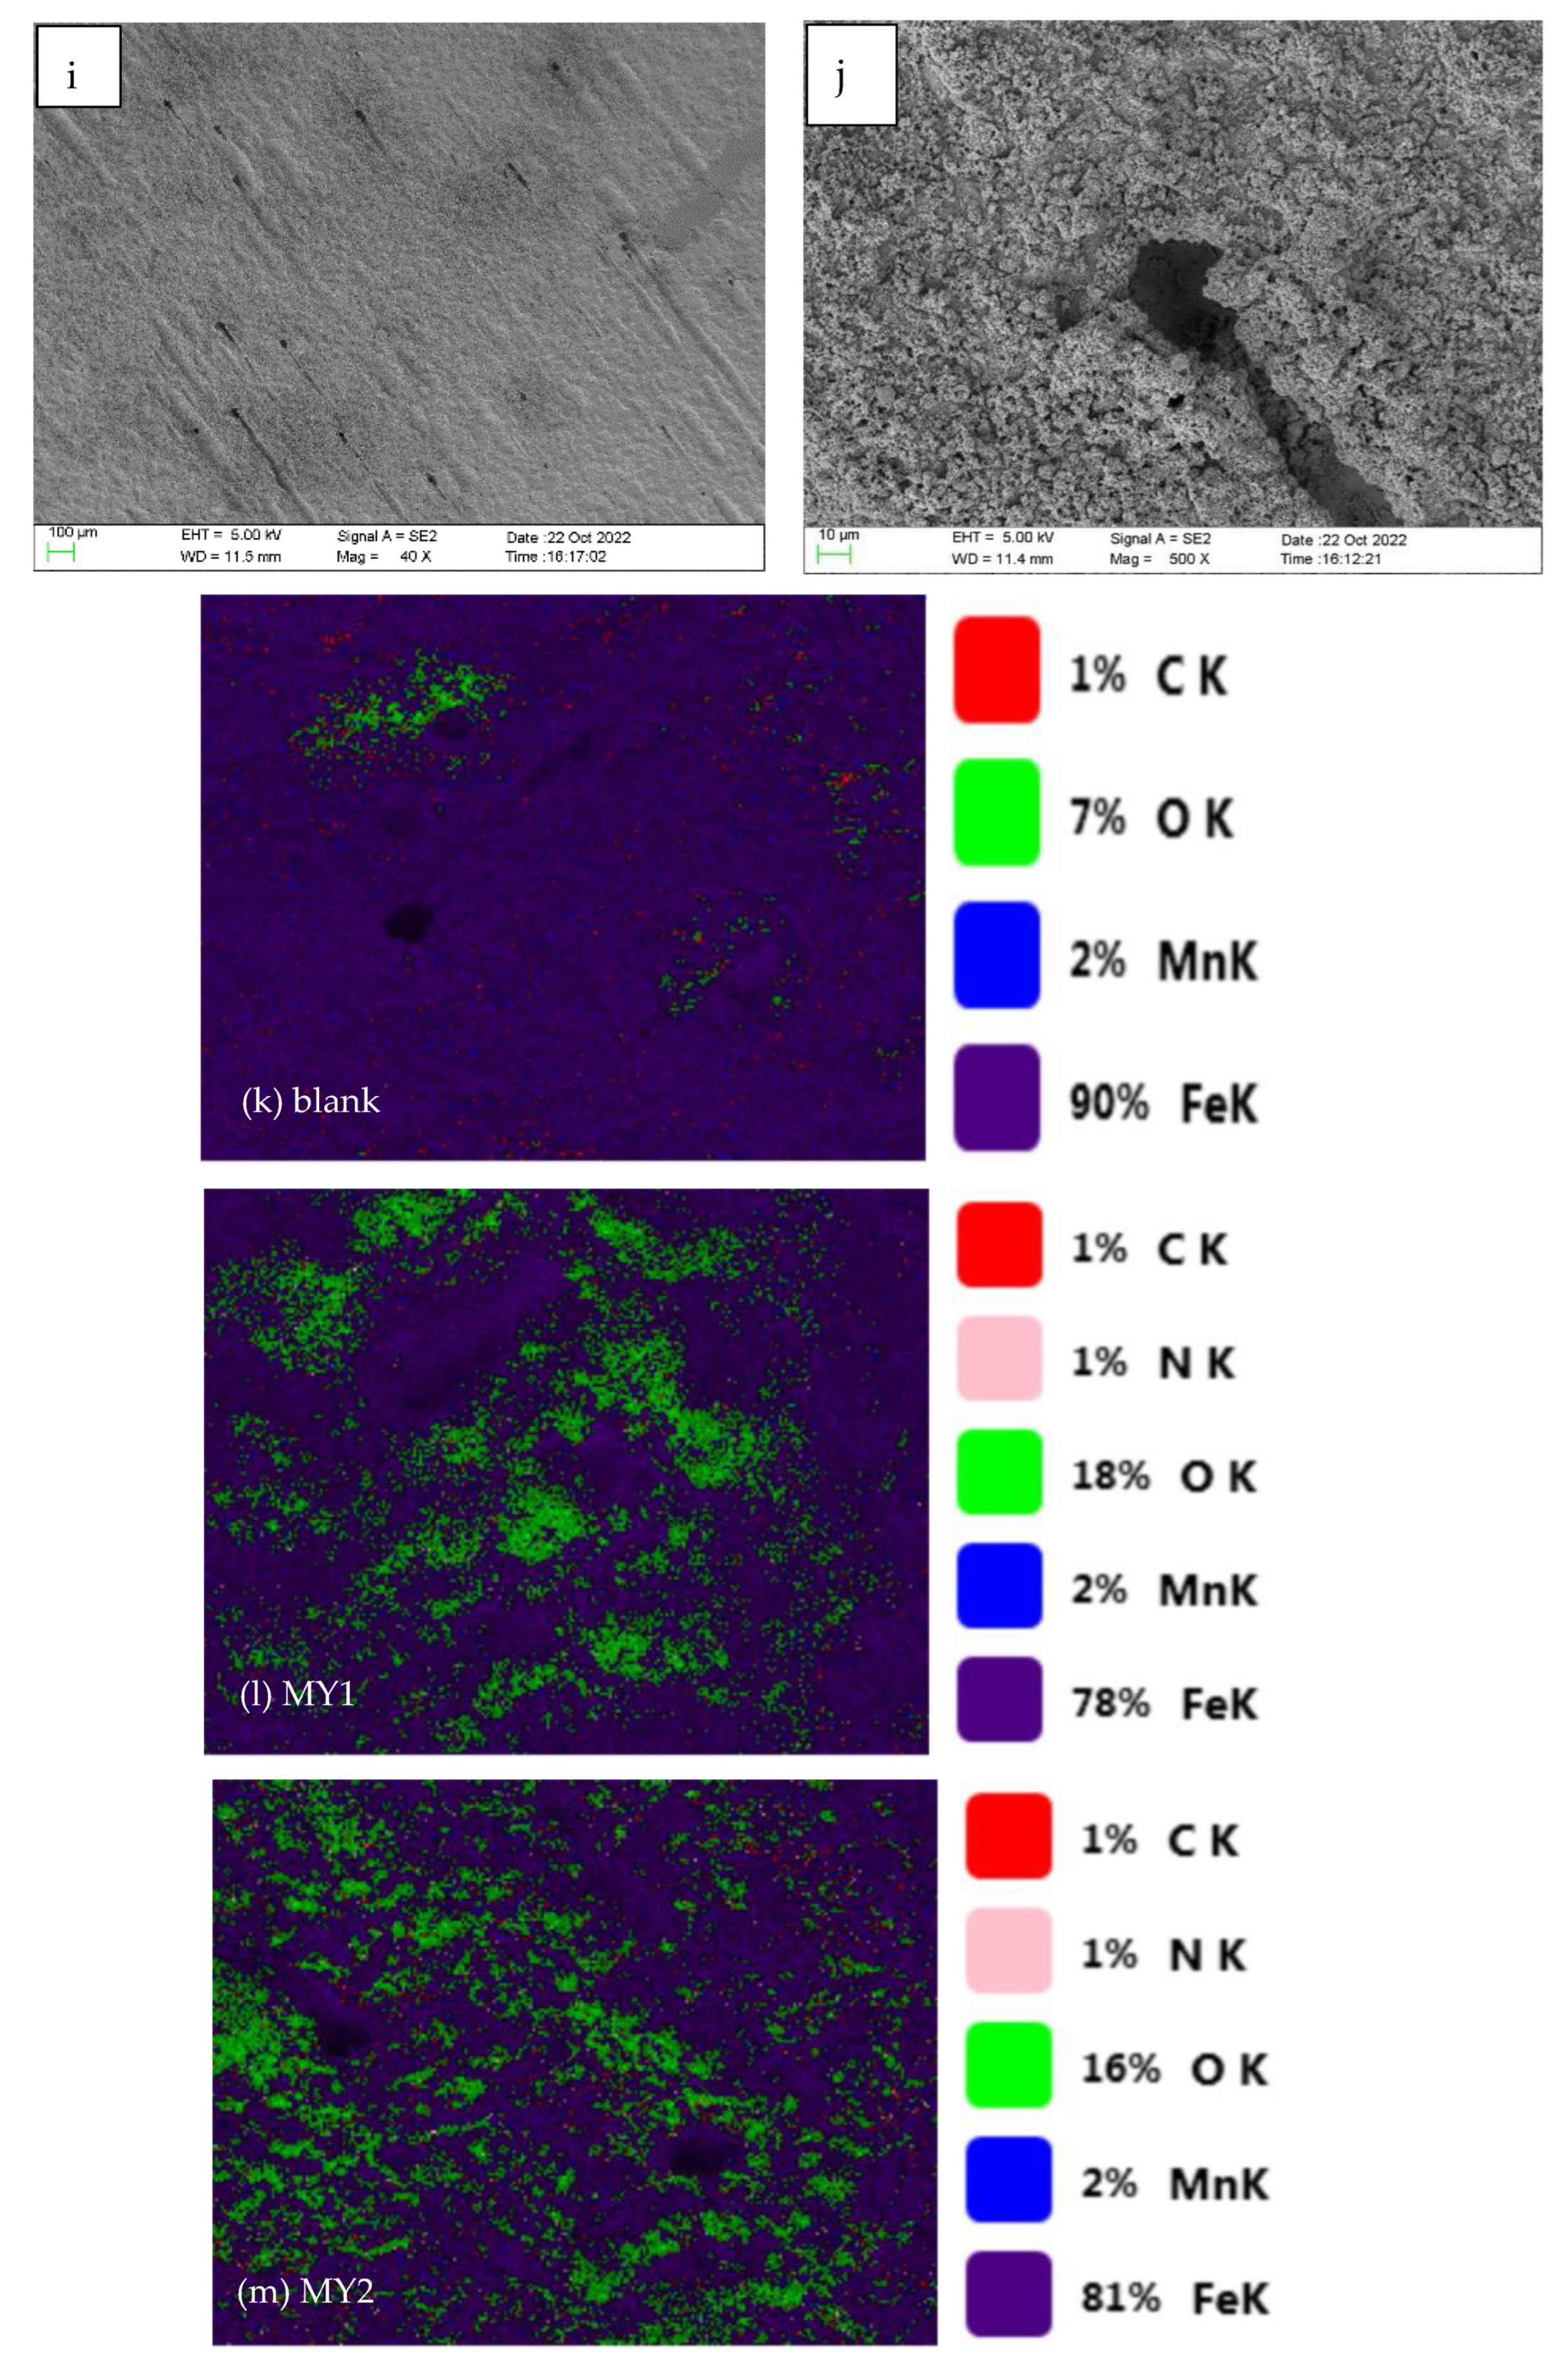
3.4. Corrosion Morphology Analysis of N80 Steel Specimens

Figure 6 shows SEM images of metal samples immersed in different inhibitor concentrations and EDS elemental mapping images with 0.7% inhibitor concentration. The immersion temperature is 60 °C, and the immersion time is 4 h. In order to better observe the corrosion appearance of the metal surface, SEM images with different multiples were taken. Figure 6a,b, respectively, show the SEM images of a blank group immersed in 15% hydrochloric acid solution at different multiples. It is obvious that the metal surface is very severely corroded, and the metal surface is very rough. There are many pits of different depths, with obvious local corrosion. At the same time, there are many corrosion products on the metal surface. Figure 6c,d, respectively, show SEM images containing 0.3% MY1 immersed in 15% hydrochloric acid solution at different multiples, and Figure 6e,f, respectively, show SEM images containing 0.3% MY2 immersed in 15% hydrochloric acid solution at different multiples. It can be clearly seen from the figure that the number of corrosion pits is reduced, and the corrosion products are denser than the blank test, but there is still local corrosion. Figure 6g,h, respectively, show SEM images containing 0.7% MY1 immersed in 15% hydrochloric acid solution at different multiples, and Figure 6i,j, respectively, show SEM images containing 0.7% MY2 immersed in 15% hydrochloric acid solution at different multiples. It can be clearly seen from the figure that there are still clearly visible mechanical grinding marks on the metal surface, and the diameter of the corrosion pit is obviously reduced. This shows that after the addition of the corrosion inhibitor, an adsorption film can be formed on the metal surface to block the contact between the corrosion medium and the metal surface, thereby effectively inhibiting the corrosion of the metal surface.
As can be seen from Figure 6k–m, the content of nitrogen atoms appears in the EDS elemental mapping images after MY1 and MY2 are added. Meanwhile, the area of the iron matrix exposed to the corrosive medium decreases significantly after MY1 and MY2 are added. This indicates that the nitrogen atoms contained in MY1 and MY2 play an important role in inhibiting corrosion, and a good protective film layer appears on the metal surface, reducing the degree of corrosion.

3.5. Adsorption and Thermodynamic Studies

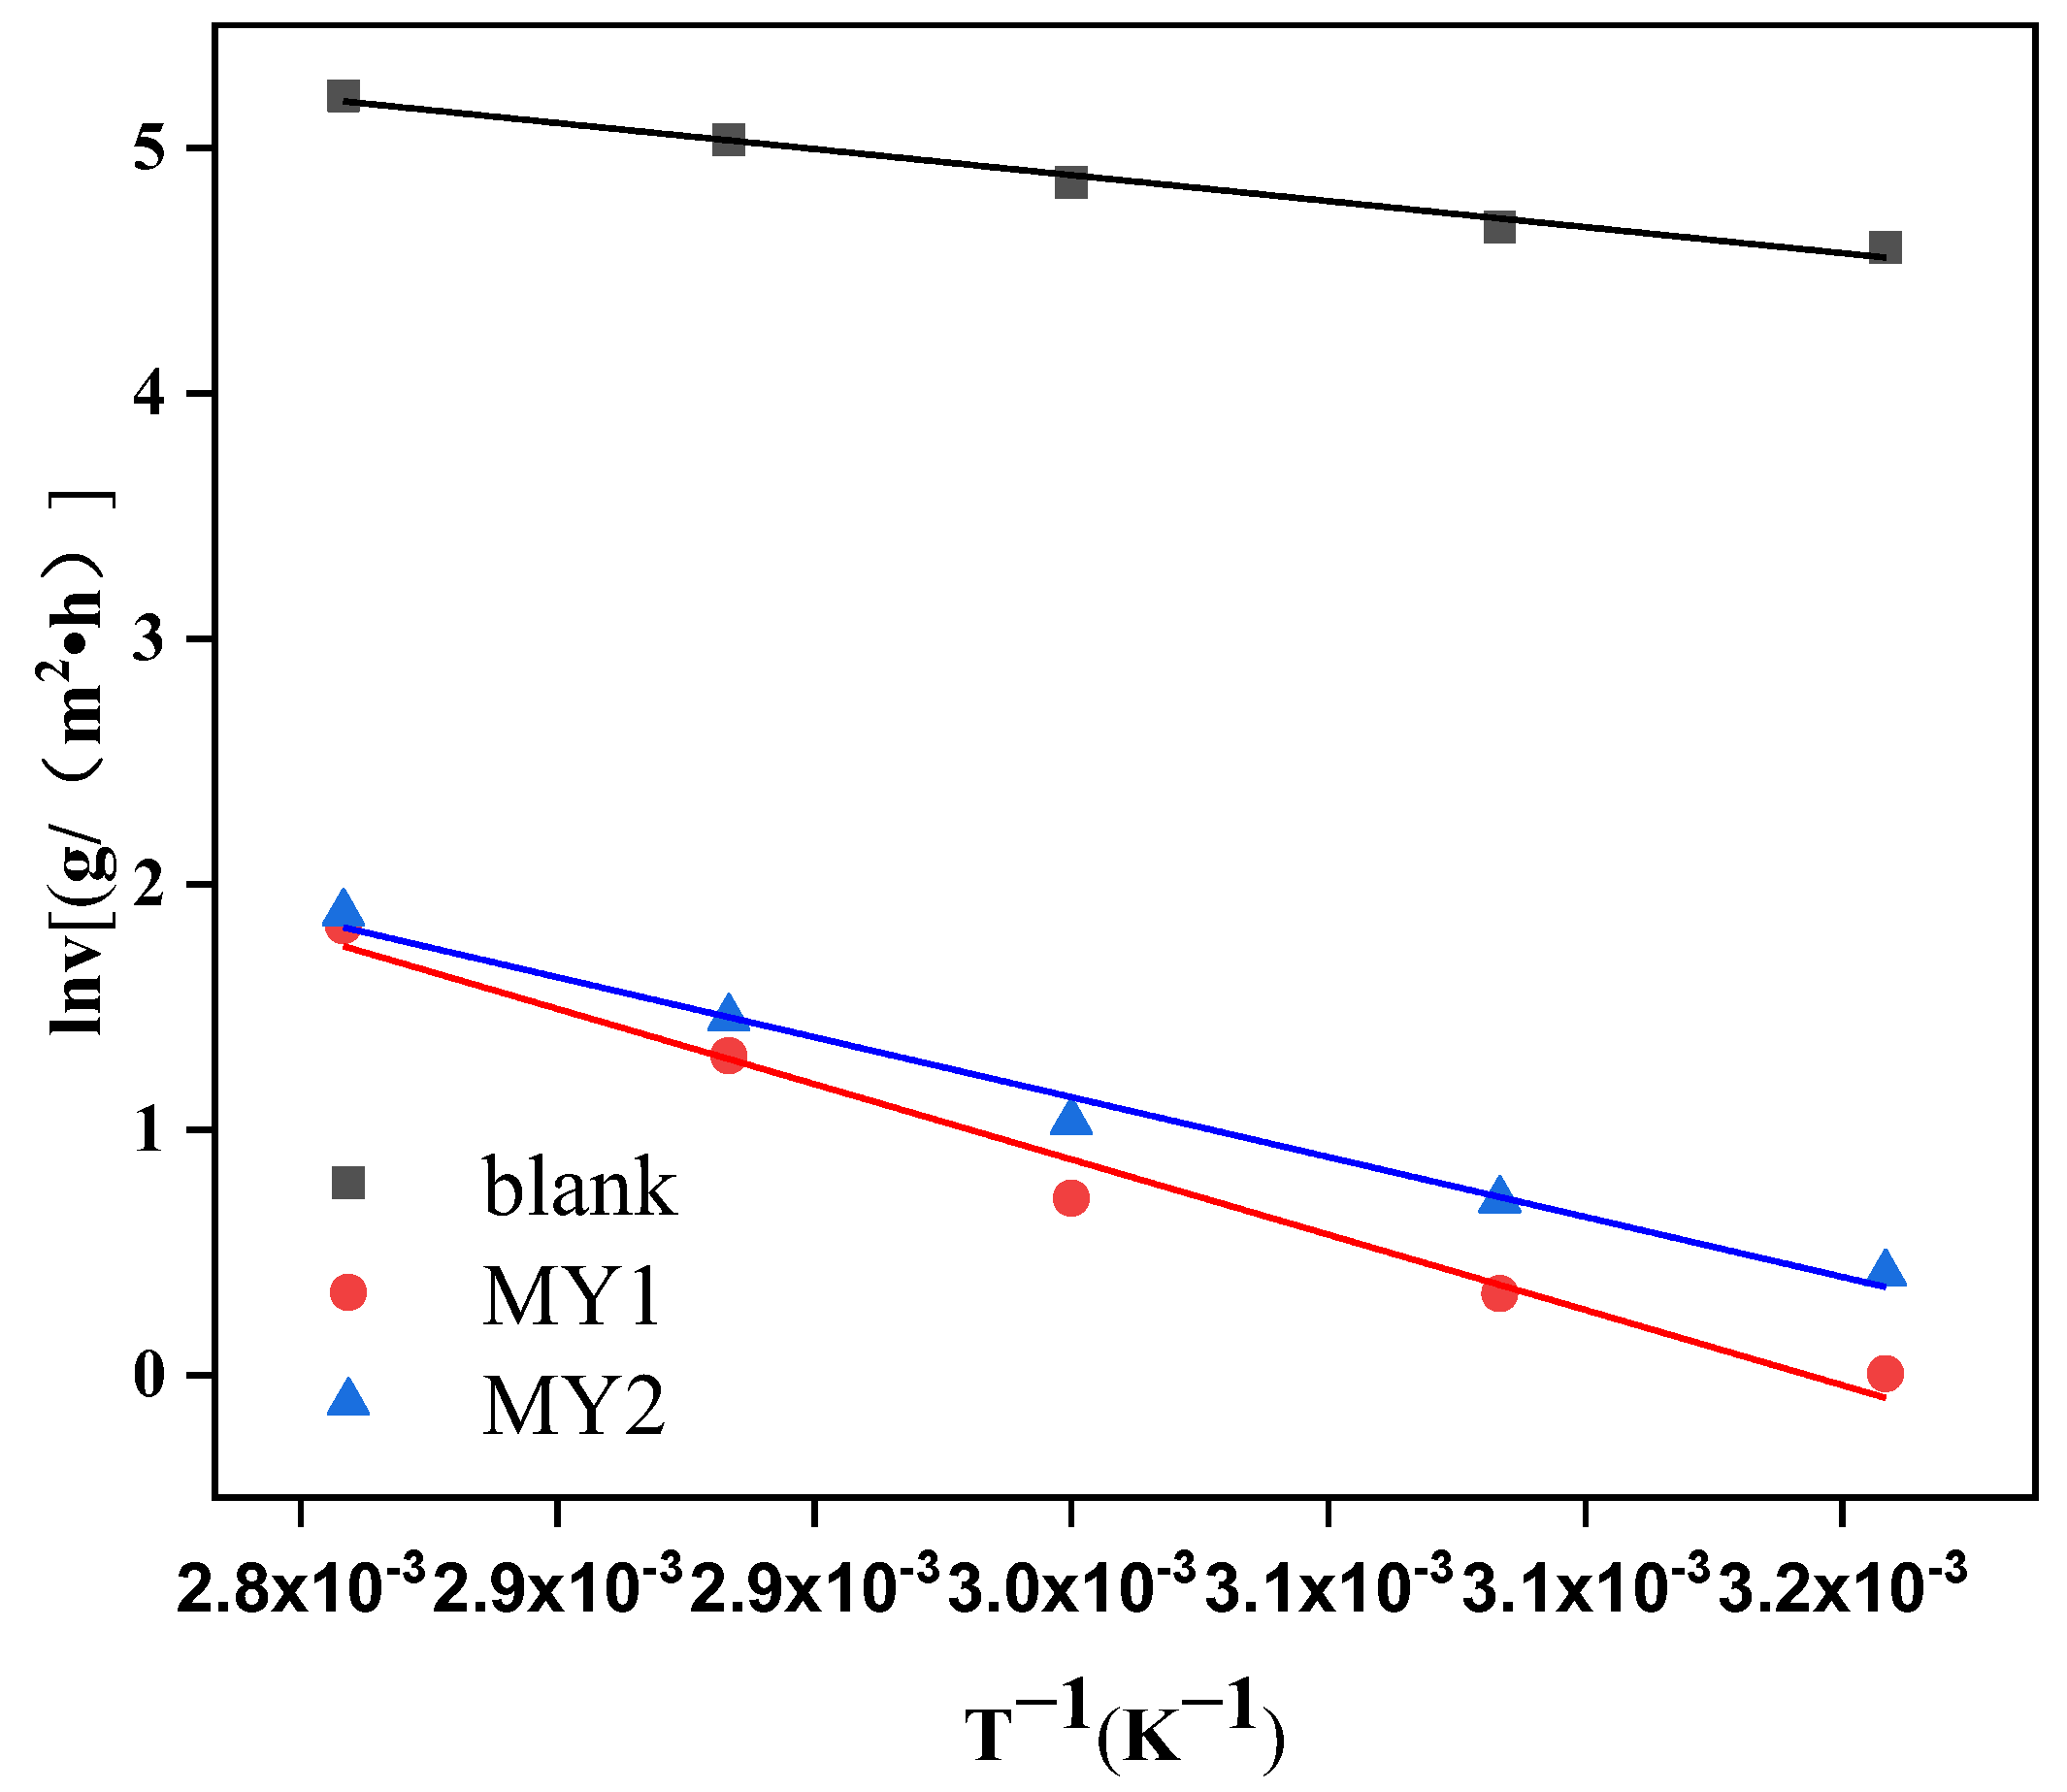
3.5.1. Arrhenius Curve Analysis

In order to better study the effect of temperature on the adsorption of corrosion inhibitor molecules on the metal surface, the test temperature was set between 40 °C and 80 °C, and the test time was 4 h. The blank test without inhibitor and the corrosion rate with 0.7% concentration of MY1 and MY2 is measured by the static weight loss method, according to the Arrhenius equation [20]. The relationship between lnv and 1/T is as follows:
lnv = E a R   T + lnA
where v represents the corrosion rate, [g/(m2·h)]; R is the molar gas constant, 8.314 J/(mol·K); T is the thermodynamic temperature, K; Ea is the apparent activation energy, (kJ/mol); and A is the pre-exponential factor. The abscissa and o rdinate are 1/T and lnv, respectively, and the slope of the straight line in the figure is the apparent activation energy. The linear fitting results of Arrhenius are shown in Figure 7 and Table 3. From Table 3, it can be seen that the apparent activation energy increases significantly after adding the corrosion inhibitor, and the apparent activation energy of MY1 is greater than that of MY2. The greater the activation energy of the corrosion reaction, the more energy must be overcome for corrosion to occur on the metal surface. Furthermore, the corrosion of the medium to the metal is inhibited.

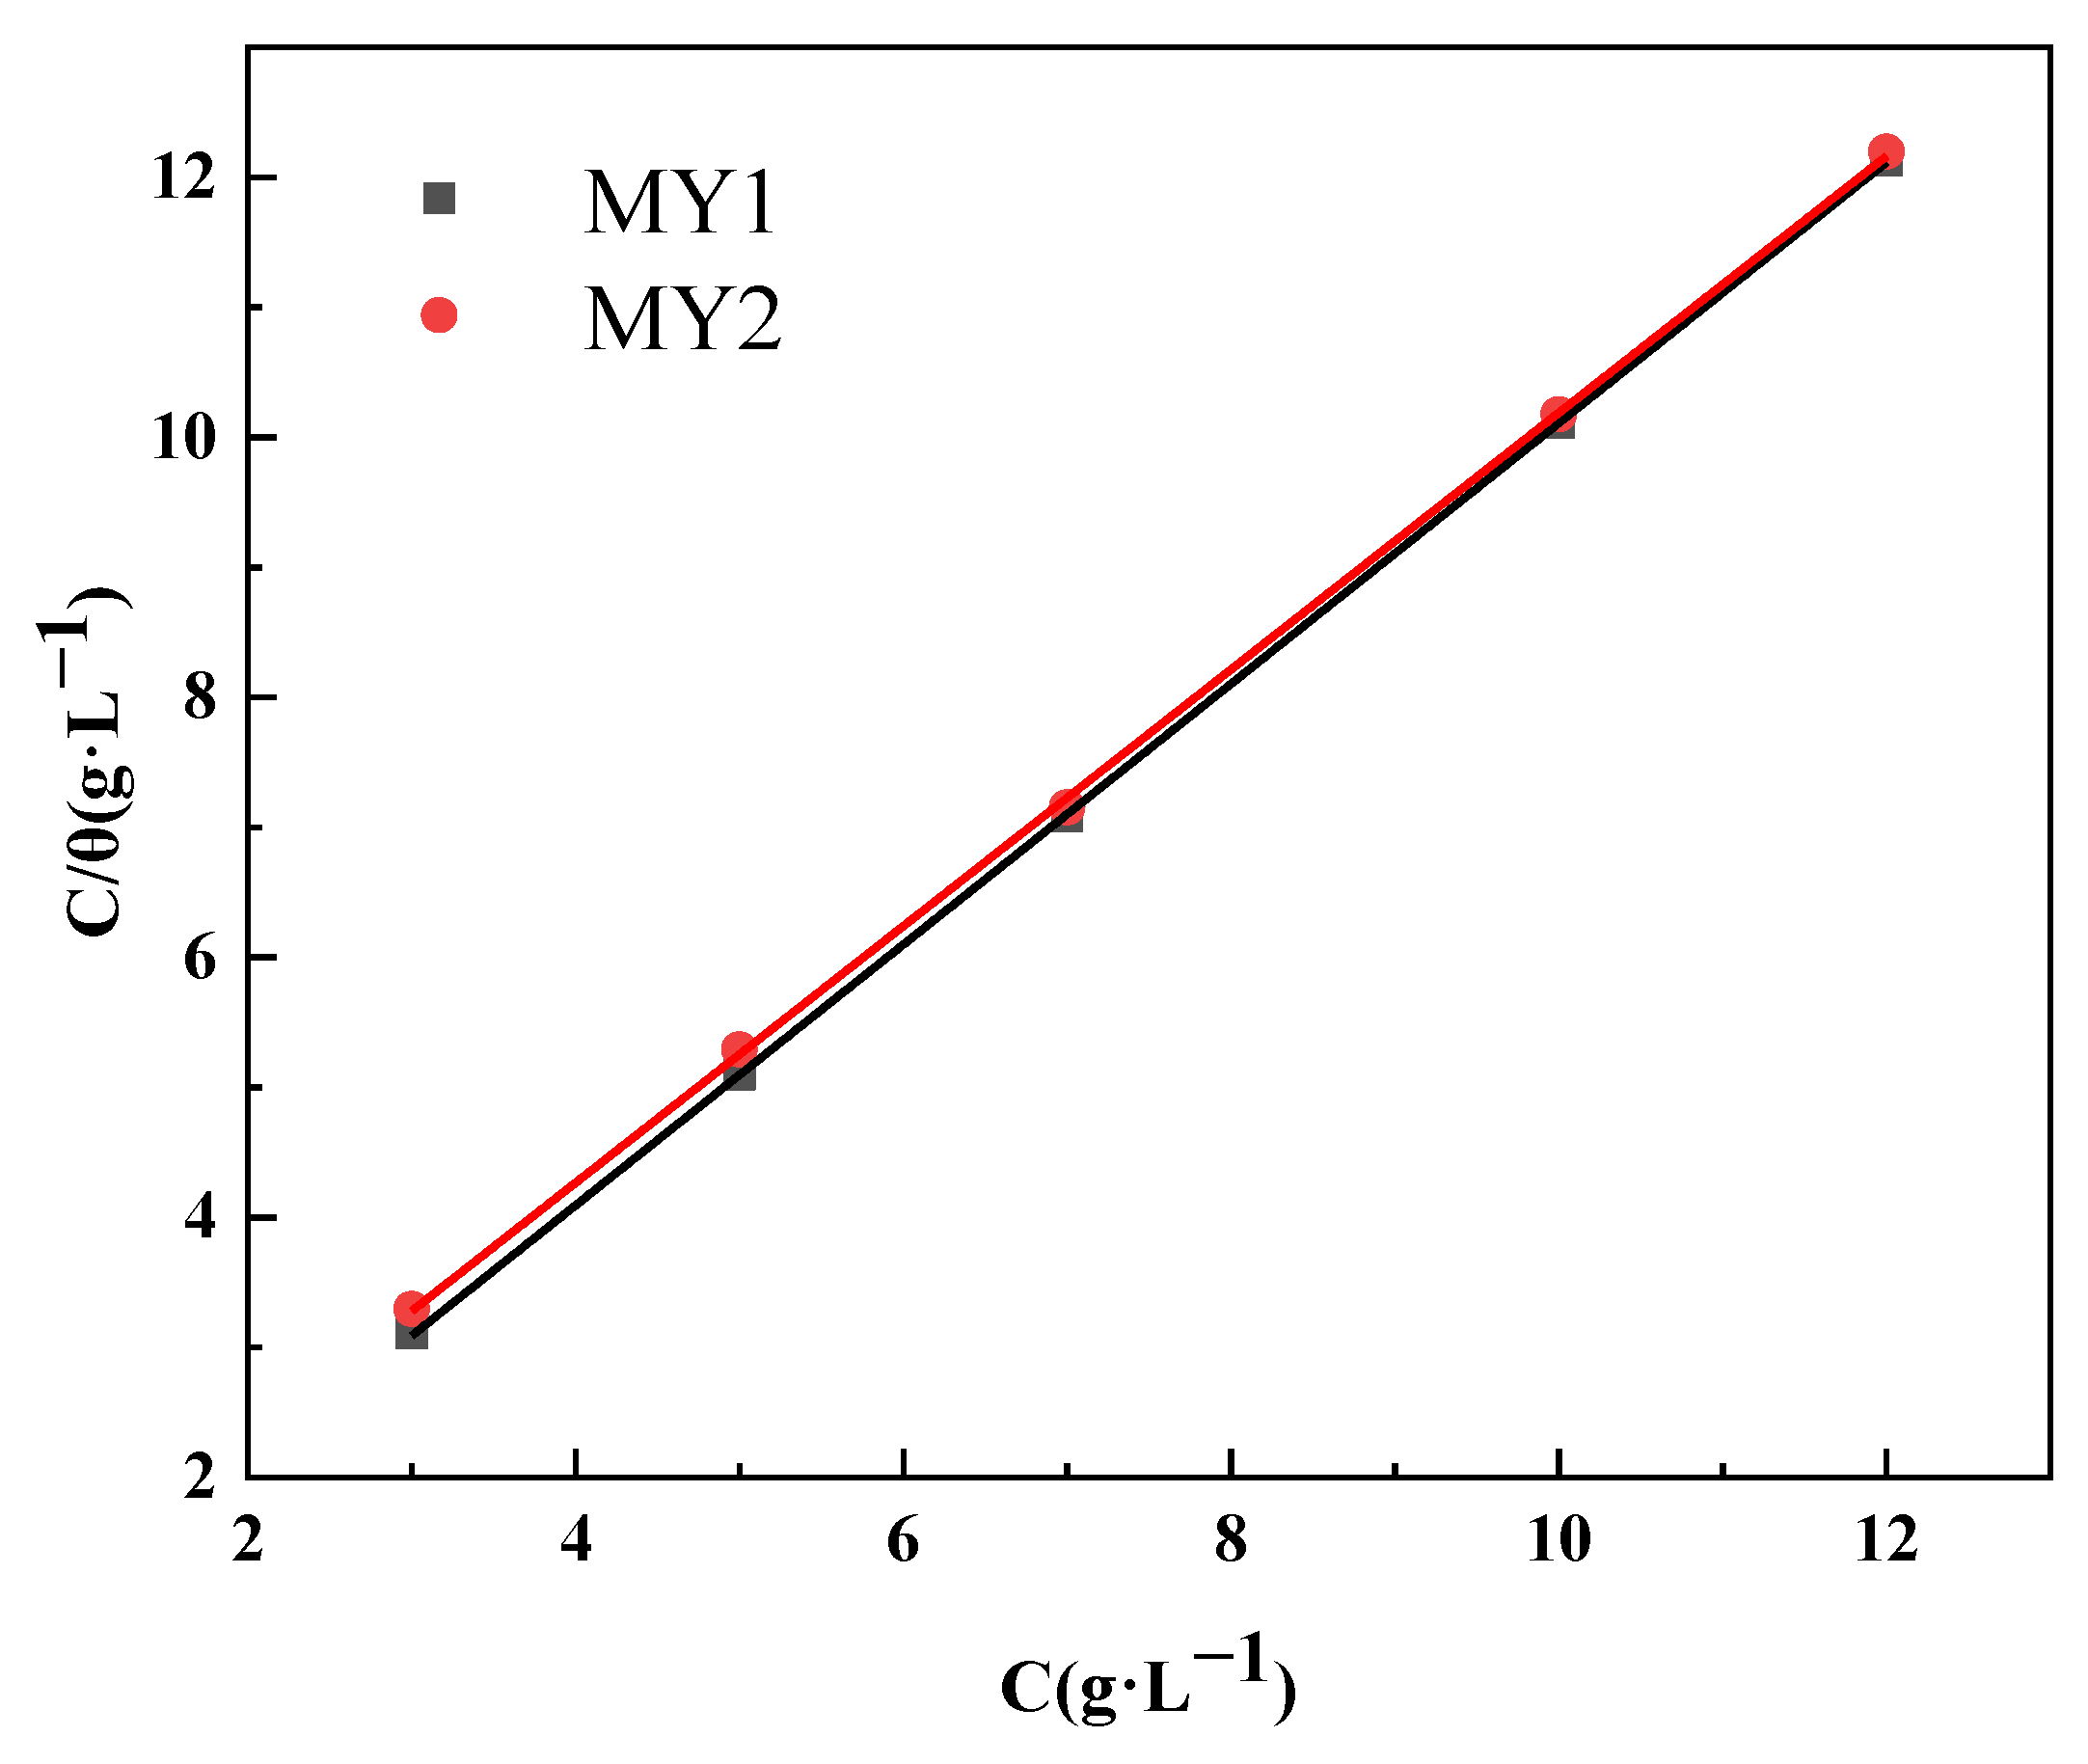
3.5.2. Adsorption Isotherm Analysis

In order to better explore the adsorption behavior of corrosion inhibitors on metal surfaces in corrosive media, adsorption isotherms can be used to reasonably study their adsorption states. By testing several different isotherms, the basic thermodynamic parameters were calculated by Langmuir adsorption isotherm. The Langmuir adsorption isotherm is shown in Formula (6):
c θ = 1 K + c
where c is the concentration of corrosion inhibitor, (g/L); θ is the surface coverage; and K is the equilibrium constant, (L/g).
When the adsorption behavior formed by the corrosion inhibitor molecules and the metal surface satisfies the Langmuir adsorption isotherm [21], the adsorption of the corrosion inhibitor molecules on the metal surface belongs to the monomolecular adsorption. At the same time, the probability of the inhibitor molecules adsorbed on the metal surface is exactly the same. Meanwhile, the adsorption coverage rate of the corrosion inhibitor molecule is equivalent to the corrosion inhibition rate of the corrosion inhibitor. A straight line with a correlation coefficient of 0.99 is fitted by Equation (6), as shown in Figure 8. The equilibrium constant K can be calculated from the intercept of the straight line equation, and then the Gibbs free energy (∆G) can be calculated from Equation (7), as shown in Table 4. If ∆G is negative, it indicates that the corrosion inhibitor is spontaneously adsorbed on the metal surface. If the |∆G| ≤ 20 kJ/mol, the adsorption mode of the corrosion inhibitor is mainly physisorption type; If the |∆G| ≥ 40 kJ/mol, the adsorption mode of the corrosion inhibitor is mainly chemisorption type [22]. It can be seen from Table 4 that MY1 and MY2 are mixed adsorption types with both physisorption type and chemisorption type.
G = RTln 1000 K
where R is the molar gas constant, 8.314 J/(mol·K); T is the thermodynamic temperature, K.

3.6. Contact Angle Test

Using an optical contact angle measuring instrument, the sessile drop method was used to determine the contact angle of the metal surface after adding different concentrations of MY1 and MY2 soaking in 15% hydrochloric acid solution at 60 °C for 4 h. It can be seen from Figure 9 that the droplets on the metal surface immersed in the case of the blank solution have an obvious collapse phenomenon, and the contact angle is 17.9°. With the increase of the concentrations of MY1 and MY2, the shape of the droplets on the surface of the steel sheet is more round and plump, and the contact angle also increases. The maximum contact angles of MY1 and MY2 are 113° and 100°, respectively, indicating that these two inhibitors can effectively improve the hydrophobicity of the metal interface, and the hydrophobicity of MY1 is better than that of MY2. This is because the presence of the hydrophilic hydroxyl group makes it easier to adsorb on the metal surface, and the alkyl chain extends into the corrosive medium to form a hydrophobic interface on the surface of the sample, which reduces the hydrophilicity of the metal surface [23], thus effectively isolate the corrosive medium and inhibit corrosion.

3.7. Dissolution and Dispersion Test

Take 100 mL of 15% hydrochloric acid solution, add 0.7% MY1 and MY2, respectively, and mix them evenly, put them in a water bath at 60 °C, and heat them at a constant temperature for 4 h to observe the change in the appearance of the acid solution, as shown in Figure 10.
It can be seen from Figure 10 that MY1 has good dispersibility in 15% hydrochloric acid solution at 60 °C, no precipitation, and always maintains a uniform solution. A small amount of precipitation of MY2 appeared in a 15% hydrochloric acid solution at 60 °C. This may be because MY1 contains a hydrophilic hydroxyl group, which makes the corrosion inhibitor molecules more hydrophilic so that they can be better dissolved in a 15% hydrochloric acid solution to form a uniform solution.

3.8. Corrosion Inhibition Mechanism Analysis

The experiment shows that MY1 and MY2 have an inhibition effect on the metal surface in a 15% hydrochloric acid solution. Through the Gibbs Free energy (∆G) and Langmuir adsorption isothermal model, it is found that MY1 and MY2 belong to the mixed adsorption that both physical adsorption and chemical adsorption exist. The existence of physical adsorption is due to the existence of polar and non-polar groups in the corrosion inhibitor molecules. When the polar groups of the corrosion inhibitor molecules are absorbed on the metal surface, the non-polar groups are closely arranged under the action of the van der Waals force, thus forming a firm adsorption film. At the same time, the benzene ring can be adsorbed on the metal surface through conjugation to enhance the stability of adsorption [24]. Chemical adsorption is due to the fact that MY1 and MY2 contain multiple N and O atoms that can provide lone pair electrons, and they can form coordination bonds with iron atoms [25]. Such chemical bonds have strong chemical forces, which enable the corrosion inhibitor molecules to be firmly adsorbed on the metal surface and prevent the diffusion of chloride of ions and hydrogen ions to the interior of the metal. It is precisely because of the existence of mixed adsorption, on the one hand, that the charge state and interface properties of the metal surface are changed, the energy of the metal surface becomes stable, the activation energy of the corrosion reaction is increased and the corrosion rate is slowed down. On the other hand, the non-polar group separates the metal surface from the corrosive medium, hindering the charge transfer in the electrochemical reaction and thus slowing the corrosion. In addition, the hydroxyl group contained in MY1 can improve the dispersion of corrosion inhibitor in 15% hydrochloric acid solution, and it is easier to form a dense adsorption film on the metal surface, improving the corrosion inhibition effect. After the addition of the corrosion inhibitor, the wetting angle of the steel surface increases significantly, indicating that the adsorption film formed by corrosion inhibitor molecules on the steel surface increases the hydrophobicity and inhibits corrosion.

4. Conclusions

  • The corrosion inhibition rates of synthesized MY1 and MY2 in 15% hydrochloric acid solution with a concentration of 0.7% were 98.8% and 97.8%, respectively, indicating that these two corrosion inhibitors have obvious effects on corrosion inhibition. Moreover, the corrosion inhibition effect of MY1 is better than that of MY2.
  • From the electrochemical test results, it can be seen that the concentration of the corrosion inhibitor is increased, and the corrosion current density is decreased, indicating that the two corrosion inhibitors can effectively inhibit the electrochemistry reaction. When the corrosion inhibitor is added, the ability of the anode metal surface to lose electrons and the ability of the cathode surface to gather electrons are obviously inhibited, but the Ecorr value is obviously shifted to the positive direction compared with the blank solution, indicating that the inhibitor molecules have a great hindering effect on the anode process, so MY1 and MY2 are high-efficiency corrosion inhibitors of a mixed control type and mainly inhibiting anodes.
  • The adsorption behavior of MY1 and MY2 on the metal surface conforms to the Langmuir adsorption isotherm, indicating that the adsorption of inhibitor molecules on the metal surface belongs to monolayer adsorption. According to the Gibbs free energy (∆G) of MY1 and MY2, the adsorption process of the two corrosion inhibitors is spontaneous adsorption and belongs to the mixed adsorption type.
  • Through SEM, EDS elemental mapping and contact angle measurement. A layer of hydrophobic protective film was indeed formed on the metal surface after the addition of MY1 and MY2, which weakens the corrosion degree of the metal surface and enhances the hydrophobicity of the metal surface.
  • According to the dispersion evaluation experiment of corrosion inhibitor, the hydroxyl group contained in MY1 can promote the dissolution of corrosion inhibitor in an aqueous solution so that the molecules of corrosion inhibitor can form a more dense adsorption film on the metal surface, thus achieving a better effect of corrosion inhibitor.

Author Contributions

Conceptualization, S.S. and Y.L.; methodology, S.S.; software, K.G.; validation, S.S., Y.L. and K.G.; formal analysis, L.C.; investigation, S.S.; resources, R.L.; data curation, X.Y.; writing—original draft preparation, Y.L.; writing—review and editing, S.S.; visualization, L.C.; supervision, X.Y.; project administration, R.L.; funding acquisition, R.L. All authors have read and agreed to the published version of the manuscript.

Funding

This research was funded by the financial support provided by the National Natural Science Foundation of China (No.62173049), and the special research funding from the Performance Analysis and Optimal Design of Networked Intelligent System under Various Communication Constraints.

Institutional Review Board Statement

Not applicable.

Informed Consent Statement

Not applicable.

Data Availability Statement

All data that support the findings of this study are included within the article.

Conflicts of Interest

The authors declare no conflict of interest.

References

  1. Turnbull, A.; Griffiths, A. Corrosion and cracking of weldable 13 wt% Cr martensitic stainless steels for application in the oil and gas industry. Corros. Eng. Sci. Technol. 2003, 38, 21–50. [Google Scholar] [CrossRef]
  2. Sainia, N.; Kumaa, R.; Pahujaa, P.; Malika, R.; Malika, R.; Singhalb, S.; Lataa, S. Exploring the Capability of Synthesized PVP-Oxime for Corrosion Inhibition of a Mild Steel Surface in a 1 M H2SO4 Solution. Port. Electrochim. Acta 2020, 38, 43–58. [Google Scholar] [CrossRef]
  3. Onyeachu, I.B.; Chauhan, D.S.; Quraishi, M.; Obot, I. Influence of hydrodynamic condition on 1,3,5-tris (4-methoxyphenyl)-1, 3,5-triazinane as a novel corrosion inhibitor formulation for oil and gas industry. Corros. Eng. Sci. Technol. 2021, 56, 154–161. [Google Scholar] [CrossRef]
  4. Queiroz Baddini, A.L.; Cardoso, S.P.; Hollauer, E.; Gomes, J.A.d.C.P. Statistical analysis of a corrosion inhibitor family on three steel surfaces (duplex, super-13 and carbon) in hydrochloric acid solutions. Electrochim. Acta 2007, 53, 434–446. [Google Scholar] [CrossRef]
  5. Barmatov, E.; Geddes, J.; Hughes, T.; Nagl, M. Research on corrosion inhibitors for acid stimulation. In Proceedings of the NACE —International Corrosion Conference Series, Salt Lake City, UT, USA, March 2012. [Google Scholar]
  6. Ayeni, A.O.; Akinyele, O.F.; Hosten, E.C.; Fakola, E.G.; Olalere, J.T.; Egharevba, G.O.; Watkins, G.M. Synthesis, crystal structure, experimental and theoretical studies of corrosion inhibition of 2-((4-(2-hydroxy-4-methylbenzyl) piperazin-1-yl) methyl)-5-methylphenol–A Mannich base. J. Mol. Struct. 2020, 1219, 128539. [Google Scholar] [CrossRef]
  7. Ita, B.; Offiong, O. The study of the inhibitory properties of benzoin, benzil, benzoin-(4-phenylthiosemicarbazone) and benzil-(4-phenylthiosemicarbazone) on the corrosion of mild steel in hydrochloric acid. Mater. Chem. Phys. 2001, 70, 330–335. [Google Scholar] [CrossRef]
  8. Musa, A.Y.; Kadhum, A.A.H.; Mohamad, A.B.; Rahoma, A.A.B.; Mesmari, H. Electrochemical and quantum chemical calculations on 4,4-dimethyloxazolidine-2-thione as inhibitor for mild steel corrosion in hydrochloric acid. J. Mol. Struct. 2010, 969, 233–237. [Google Scholar] [CrossRef]
  9. Emregül, K.C.; Hayvalí, M. Studies on the effect of a newly synthesized Schiff base compound from phenazone and vanillin on the corrosion of steel in 2 M HCl. Corros. Sci. 2006, 48, 797–812. [Google Scholar] [CrossRef]
  10. Singh, A.; Ansari, K.; Lin, Y.; Quraishi, M.; Lgaz, H.; Chung, I.-M. Corrosion inhibition performance of imidazolidine derivatives for J55 pipeline steel in acidic oilfield formation water: Electrochemical, surface and theoretical studies. J. Taiwan Inst. Chem. Eng. 2019, 95, 341–356. [Google Scholar] [CrossRef]
  11. Obot, I.; Onyeachu, I.B.; Kumar, A.M. Sodium alginate: A promising biopolymer for corrosion protection of API X60 high strength carbon steel in saline medium. Carbohydr. Polym. 2017, 178, 200–208. [Google Scholar] [CrossRef]
  12. Xu, C.; Zhan, W.; Tang, X.; Mo, F.; Fu, L.; Lin, B. Self-healing chitosan/vanillin hydrogels based on Schiff-base bond/hydrogen bond hybrid linkages. Polym. Test. 2018, 66, 155–163. [Google Scholar] [CrossRef]
  13. Wu, X.; Li, J.; Deng, C.; Yang, L.; Lv, J.; Fu, L. Novel carbon dots as effective corrosion inhibitor for N80 steel in 1 M HCl and CO2-saturated 3.5 wt% NaCl solutions. J. Mol. Struct. 2022, 1250, 131897. [Google Scholar] [CrossRef]
  14. Yang, Z.; Wang, Y.; Zhan, F.; Chen, W.; Ding, M.; Qian, C.; Wang, R.; Hou, B. Indolizine quaternary ammonium salt inhibitors, part III: Insights into the highly effective low-toxicity acid corrosion inhibitor–synthesis and protection performance. New J. Chem. 2019, 43, 18461–18475. [Google Scholar] [CrossRef]
  15. Nwokolo, I.K.; Shi, H.; Ikeuba, A.I.; Gao, N.; Li, J.; Ahmed, S.; Liu, F. Synthesis, Characterization and Investigation of Anticorrosion Properties of an Innovative Metal–Organic Framework, ZnMOF-BTA, on Carbon Steel in HCl Solution. Coatings 2022, 12, 1288. [Google Scholar] [CrossRef]
  16. Zhang, H.-H.; Gao, K.; Yan, L.; Pang, X. Inhibition of the corrosion of X70 and Q235 steel in CO2-saturated brine by imidazoline-based inhibitor. J. Electroanal. Chem. 2017, 791, 83–94. [Google Scholar] [CrossRef]
  17. Singh, A.; Ansari, K.; Kumar, A.; Liu, W.; Songsong, C.; Lin, Y. Electrochemical, surface and quantum chemical studies of novel imidazole derivatives as corrosion inhibitors for J55 steel in sweet corrosive environment. J. Alloys Compd. 2017, 712, 121–133. [Google Scholar] [CrossRef]
  18. Zhao, J.; Duan, H.; Jiang, R. Synergistic corrosion inhibition effect of quinoline quaternary ammonium salt and Gemini surfactant in H2S and CO2 saturated brine solution. Corros. Sci. 2015, 91, 108–119. [Google Scholar] [CrossRef]
  19. Yang, Z.; Zhan, F.; Pan, Y.; LYu, Z.; Han, C.; Hu, Y.; Ding, P.; Gao, T.; Zhou, X.; Jiang, Y. Structure of a novel Benzyl Quinolinium Chloride derivative and its effective corrosion inhibition in 15 wt.% hydrochloric acid. Corros. Sci. 2015, 99, 281–294. [Google Scholar] [CrossRef]
  20. Singh, A.; Bedi, P.; Ansari, K.; Pramanik, T.; Chaudhary, D.; Santra, S.; Alanazi, A.K.; Das, S.; Quraishi, M.; Lin, Y. Inhibition effect of newly synthesized benzoxanthonesderivative on hydrogen evolution and Q235 steel corrosion in 15% HCl under hydrodynamic condition: Combination of experimental, surface and computational study. Int. J. Hydrogen Energy 2021, 46, 37995–38007. [Google Scholar] [CrossRef]
  21. Elewady, G.; Mostafa, H. Ketonic secondary Mannich bases as corrosion inhibitors for aluminium. Desalination 2009, 247, 573–582. [Google Scholar] [CrossRef]
  22. Flores, E.A.; Olivares, O.; Likhanova, N.V.; Domínguez-Aguilar, M.A.; Nava, N.; Guzman-Lucero, D.; Corrales, M. Sodium phthalamates as corrosion inhibitors for carbon steel in aqueous hydrochloric acid solution. Corros. Sci. 2011, 53, 3899–3913. [Google Scholar] [CrossRef]
  23. Zhang, X.; Zhang, M.; Zhang, Z.; Li, Q.; Lv, R.; Wu, W. Bis-Mannich bases as effective corrosion inhibitors for N80 steel in 15% HCl medium. J. Mol. Liq. 2022, 347, 117957. [Google Scholar] [CrossRef]
  24. Senthilkumar, A.; Tharini, K.; Sethuraman, M. Studies on a few substituted piperidin-4-one oximes as corrosion inhibitor for mild steel in HCl. J. Mater. Eng. Perform. 2011, 20, 969–977. [Google Scholar] [CrossRef]
  25. Quraishi, M.A. 2-Amino-3, 5-dicarbonitrile-6-thio-pyridines: New and effective corrosion inhibitors for mild steel in 1 M HCl. Ind. Eng. Chem. Res. 2014, 53, 2851–2859. [Google Scholar]
Figure 1. FTIR and LCMS of target product. (a) FTIR of MY1 and MY2; LCMS of MY1 (b) andMY2 (c).
Coatings 12 01975 g001aCoatings 12 01975 g001b
Figure 2. Corrosion rate and inhibition efficiency of N80 steel in various test solutions.
Coatings 12 01975 g002
Figure 3. Polarization curves of MY1 and MY2 at different concentrations.
Coatings 12 01975 g003aCoatings 12 01975 g003b
Figure 4. EIS plots ((a,b) are Nyquist plots of MY1 and MY2, (c,d) are Bode plots of MY1 and MY2).
Coatings 12 01975 g004aCoatings 12 01975 g004b
Figure 5. Equivalent circuit model.
Coatings 12 01975 g005
Figure 6. SEM images in 15% HCl solution containing different concentrations of inhibitor and EDS elemental mapping images with 0.7% inhibitor concentration. (a) SEM of blank (40×); (b) SEM of blank (500×); (c) SEM of 0.3% MY1 (40×); (d) SEM of 0.3% MY1 (500×); (e) SEM of 0.3% MY2 (40×); (f) SEM of 0.3% MY2 (500×); (g) SEM of 0.7% MY1 (40×); (h) SEM of 0.7% MY1 (500×); (i) SEM of 0.7% MY2 (40×); (j) SEM of 0.7% MY2 (500×); (k) EDS elemental mapping of blank; (l) EDS elemental mapping of 0.7% MY1; (m) EDS elemental mapping of 0.7% MY2.
Coatings 12 01975 g006aCoatings 12 01975 g006b
Figure 7. Arrhenius fitting curves.
Coatings 12 01975 g007
Figure 8. Langmuir adsorption isotherm.
Coatings 12 01975 g008
Figure 9. Contact angle test results.
Coatings 12 01975 g009
Figure 10. Evaluation of corrosion inhibitor dispersibility.
Coatings 12 01975 g010
Table 1. Fitting electrochemical parameters with different concentrations of corrosion inhibitor.
InhibitorC (%)Ecorr (V)Icorr (A·cm−2)Ba (mV·dec−1)Bc (mV·dec−1)
blank0−0.4056.4611 × 10−369.09378.43
MY10.3−0.4168.7752 × 10−5108.11159.7
0.5−0.3983.4208 × 10−5119.25118.07
0.7−0.4032.8485 × 10−5143.73118.45
1.0−0.3992.5375 × 10−5107.17208.28
MY20.3−0.4013.904 × 10−3122.88174.97
0.5−0.3962.4332 × 10−389.741129.16
0.7−0.4249.8526 × 10−483.09679.171
1.0−0.4047.165 × 10−476.624153.25
Table 2. Electrochemical impedance spectroscopy fitting date.
InhibitorC (%)Rs (Ω·cm2)Rct (Ω·cm2)Cdl (μF·cm−2)n
blank00.56950.731256.400.9765
MY10.30.5936342.118.910.8682
0.50.5529744.914.000.8434
0.70.54797311.420.8567
1.00.5542115110.790.8314
MY20.30.1732332.425.580.7806
0.50.086632.125.640.7792
0.70.2265777.918.090.8332
1.00.2372995.619.740.8455
Table 3. Effect of corrosion inhibitor on activation energy of corrosion reaction.
InhibitorEa (kJ/mol)R2
blank14.700.983
MY142.510.980
MY233.850.987
Table 4. Thermodynamic adsorption parameters.
Inhibitor∆G (kJ/mol)R2
MY1−26.1170.999
MY2−22.4570.999
Publisher’s Note: MDPI stays neutral with regard to jurisdictional claims in published maps and institutional affiliations.

